

Abstract
Recent evidence has shown that alterations in dorsomedial hypothalamic (DMH) neuropeptide Y (NPY) signaling influence glucose homeostasis, but the mechanism through which DMH NPY acts to affect glucose homeostasis remains unclear. Here we report that DMH NPY descending signals to the dorsal motor nucleus of the vagus (DMV) modulate hepatic insulin sensitivity to control hepatic glucose production in rats. Using the hyperinsulinemic-euglycemic clamp, we revealed that knockdown of NPY in the DMH by adeno-associated virus-mediated NPY-specific RNAi promoted insulin's action on suppression of hepatic glucose production. This knockdown silenced DMH NPY descending signals to the DMV, leading to an elevation of hepatic vagal innervation. Hepatic vagotomy abolished the inhibitory effect of DMH NPY knockdown on hepatic glucose production, but this glycemic effect was not affected by vagal deafferentation. Together, these results demonstrate a distinct role for DMH NPY in the regulation of glucose homeostasis through the hepatic vagal efferents and insulin action on hepatic glucose production.
The maintenance of normal blood glucose levels is critical for the body to function properly. Insulin plays a key role in controlling blood glucose levels. Insulin resistance contributes to impaired glucose homeostasis and type 2 diabetes (1, 2). In addition to hormonal glucoregulation, the brain, particularly the hypothalamus, has been shown to play an important role in maintaining glucose homeostasis. The hypothalamus contains glucosensing (or nutrientsensing) neurons that integrate nutrient, hormonal, and neural signals to modulate food intake and glucose homeostasis (3). Low glucose levels such as hypoglycemia promote orexigenic and/or reduce anorexigenic neuronal activities to stimulate food intake, whereas elevation of glucose levels or hyperglycemia causes opposite effects (3). The central nervous system (CNS) has also been implicated in the modulation of endogenous glucose production to affect glucose homeostais (4). For instance, hypothalamic K(ATP) channels control hepatic glucose production (5). Despite these observations, the neuronal basis and signaling pathway of brain controlling glucose homeostasis remain incompletely understood.
Neuropeptide Y (NPY) is a potent hypothalamic orexigenic peptide that plays an important role in the regulation of energy balance (6). Previous studies have also shown that intraventricular administration of exogenous NPY reduces the inhibitory effect of insulin on glucose production but not on whole-body glucose disposal (7). This implies that central NPY plays an important role in glucoregulation in addition to its feeding effect. It is unclear, however, whether hypothalamic NPY contributes to this action. Within the hypothalamus, NPY-expressing neurons are primarily found in the arcaute nucleus (ARC) and the dormsomedial hypothalamus (DMH) in both rodents and primates (6). ARC NPY neurons contain the endogenous melanocortin receptor antagonist, agouti-related protein (AgRP) (8, 9), and NPY/AgRP neurons are regulated by adiposity signals (such as leptin and insulin), nutrient-related signals, and other hormonal signals (such as ghrelin) (10–12). Using mice with insulin receptor knockout in AgRP neurons, Konner et al have further demonstrated that whereas insulin action in AgRP cells is not required for steady-state regulation of food intake and body weight, insulin action specifically in AgRP neurons controls hepatic glucose production (13). Thus, these data suggest an important role for NPY/AgRP neurons in mediating insulin's central action in controlling glucose homeostasis, although the importance of NPY signaling derived from NPY/AgRP neurons in this action has yet to be determined.
A role for DMH NPY in the regulation of energy balance has also been implicated. Npy gene expression is increased in the DMH of intact rats with increased energy demands such as chronic food restriction (14) and in several rodent models of obesity including melanocortin 4 receptor knockout mice (15), high-fat-diet-induced obese mice (16) and Otsuka Long Evans Tokushima Fatty rats (6, 17). Whereas NPY in the ARC is under the control of leptin, its regulation in the DMH is leptin-independent (17) and DMH NPY is down-regulated by cholecystokinin (CCK) through CCK-1 receptors (6). Using the approach of adeno-associated virus (AAV)-mediated RNAi (AAVshNPY) for specific knockdown of NPY in the DMH, we have demonstrated that DMH NPY regulates energy balance through affecting food intake, body adiposity, brown fat thermogenesis, energy expenditure, and physical activity (18, 19). Thus, DMH NPY overexpression causes increases in food intake and body weight and exacerbates high-fat-diet-induced obesity in rats (18, 20), whereas DMH NPY knockdown ameliorates these alterations (18, 19, 21). Similar to these effects, while DMH NPY overexpression causes glucose intolerance, DMH NPY knockdown improves glucose tolerance (18–21). This knockdown also increases insulin sensitivity as rats with DMH NPY knockdown had a greater reduction of blood glucose levels compared with control rats in response to peripherally administered insulin (21). Together, these results imply that DMH NPY may also play a particular role in the regulation of insulin sensitivity and glucose homeostasis.
Here, we sought to assess this role using a rat model that received bilateral DMH injections of AAVshNPY for specific knockdown of NPY in the DMH. We have conducted the hyperinsulinemic-euglycemic clamp in these rats to examine the effects of DMH NPY knockdown on insulin's action in maintaining glucose homeostasis. We first assessed glucose dynamics in the liver and determined glucose disposal in skeletal muscle and white and brown adipose tissues. Given that DMH NPY neurons project to the brainstem dorsal vagal complex (18) and the hepatic branch of the vagus nerve is required for hypothalamic control of hepatic glucose production (5), we next examined whether DMH NPY signaling modulates glucose homeostasis via the vagus nerve. Overall, we have provided evidence demonstrating a distinct role for DMH NPY in modulating hepatic insulin action in controlling endogenous glucose production.
Materials and Methods
Animals
Male Sprague-Dawley rats were purchased from Charles River Laboratories, Inc., and were individually housed on a 12:12 hours light-dark cycle (lights on at 0600 hours) in a temperature-controlled colony room (22–24°C) with ad libitum access to tap water and standard rodent chow. All procedures were approved by the Institutional Animal Care and Use Committee at the Johns Hopkins University and were in accordance with the National Institutes of Health's Guide for the Care and Use of Laboratory Animals.
AAV-mediated knockdown of NPY in the DMH
The recombinant AAV vector AAVshNPY containing NPY-specific shRNA and the control vector AAVshCTL containing scrabbled shRNA were prepared in our laboratory as previously described (18). One week after arrival in the laboratory, rats received our standard bilateral DMH injections of AAVshNPY or AAVshCTL (18, 19) and remained on regular chow ad libitum. The insulin clamp was performed at 4 weeks postviral injection, at the time when the body weights of NPY knockdown and control rats did not differ significantly based on our previous reports (19, 21). At the end of experiments, DMH AAV injection was verified using the expression marker, humanized Renilla green fluorescent protein (hrGFP). Briefly, coronal sections (14 μm) through the hypothalamus were prepared, and the sections containing hrGFP expression were examined on a Zeiss Axio Imager (Carl Zeiss MicroImaging, Inc.). Data from rats with incorrect DMH injection were excluded from subsequent statistical analyses. Levels of Npy mRNA expression at areas of the DMH and the ARC [3.0–3.5 mm posterior to bregma (22)] were examined using our standard in situ hybridization with 35S-labeled antisense riboprobe of Npy as previously described (18).
Hyperinsulinemic-euglycemic clamp
Indwelling catheters were inserted in the left common carotid artery and the right internal jugular vein as previously described (23). After 5–7 days of surgical recovery, an insulin clamp was performed using standard methods (23). Briefly, food was removed 5 hours before the onset of study. A 2.5-uCi bolus of [3-3H] glucose was given via the venous catheter at 90 minutes prior to insulin infusion followed by a 0.05-uCi/min infusion for 90 minutes. Blood samples were obtained via the arterial catheter for monitoring glucose kinetics. Basal glucose and insulin levels were determined from blood samples at 15 and 5 minutes prior to insulin infusion. After the baseline determination, continuous infusions of insulin (Humulin R, 18 mU/kg/min prime for 1 minute, 1 mU/kg/min) and somatostatin (3 μg/kg/min, for inhibiting endogenous insulin and glucagon secretion) were started in combination with a continuous infusion of [3-3H] glucose (0.15 uCi/min). Euglycemia (∼100 mg/dL) was maintained by a variable continuous infusion of a 25% glucose solution adjusted every 10 minutes. Blood was sampled at 80, 90, 100, 110, and 120 minutes after initial insulin bolus and infusion. The steady-state glucose infusion rate (GIR) was determined in the last 30 minutes of the 120 minutes study. Clamp insulin levels were determined from samples at 120 minutes. Plasma insulin concentrations were determined by a rat insulin RIA kit (Linco Research). The rate of hepatic glucose production during the insulin clamp was calculated by subtracting the GIR from the whole-body glucose turnover rate, and hepatic insulin actions were further calculated as a percent suppression of basal hepatic glucose production. At the end of the clamp, a bolus of 2-deoxy-D-[14C]glucose (14C-2DG, 30 μCi) was infused and 45 minutes later, rats were euthanized. Liver, interscapular brown adipose tissue (IBAT), inguinal white adipose tissue (IWAT), epididymal white adipose tissue (EWAT), and gastrocnemius muscle were sampled for determinations of glucose uptake, and brains were collected and stored at −80°C for subsequent examination of DMH viral injection and hypothalamic Npy expression as described above. In addition, liver was sampled for subsequent determinations of gene expression for glucose-6-phosphatase (G6pase), phosphoenolpyruvate carboxykinase (Pepck), glucokinase (GK), glycogen phosphorylase (GP), and glycogen synthase (Gys) using quantitative real-time RT-PCR and phosphorylated levels of protein kinase B (Akt) using Western blot analysis.
DMH NPY projection to the dorsal motor nucleus of the vagus (DMV)
Rats received left DMH injection of AAVshNPY as previously described (18). Four weeks post viral injection, rats were anesthetized with Euthasol and perfused transcardially with PBS (pH 7.4) followed by 4% paraformaldehyde in PBS. Brains were removed and placed in 25% sucrose-4% paraformaldehyde overnight. NPY immunostaining was conducted as previously described (18). Briefly, 14-μm coronal sections at the level(s) of the brainstem dorsal vagal complex were prepared and incubated with anti-NPY monoclonal antibody (a gift from Dr Eric Grouzmann, Centre Hospitalier Universitaire Vaudois, Lausanne, Switzerland). After three washes, sections were incubated with Cy3-conjugated Donkey Anti-Mouse IgG (at 1:400 dilutions, Jackson ImmunoResearch) at room temperature for 1 hour. After final washes, the slides were mounted with the mounting medium and coverslipped, and the sections with NPY (red) and hrGFP fluorescence were examined on a Zeiss Axio Imager system (Carl Zeiss MicroImaging, Inc.).
Hepatic acetylcholine levels
Hepatic acetylcholine contents in the liver were measured using an ACh Assay Kit (Abcam) according to the manufacture's protocol.
Hepatic branch vagotomy
The procedure of hepatic vagotomy or sham surgery was conducted as previously described (24, 25). Briefly, 2 weeks after DMH viral injection, rats were anesthetized with ip ketamine (75 mg/kg, ip; Abbott Lab) and xylazine (10 mg/kg, ip; Butler). Following a midline laparotomy, the stomach was placed under gentle retraction and the liver packed off with saline-soaked gauze, exposing the lower part of the thoracic esophagus. Using an operating microscope, the point of branching of the hepatic branch from the right subdiaphragmatic vagus was identified and the hepatic branch was exposed and stripped of surrounding tissue. Two ligations of 6–0 silk were placed around the hepatic branch approximately 0.5 cm apart. The areas between the ligations containing the hepatic branch were excised. The incision was closed with synthetic absorbable sutures. One week after surgery recovery, indwelling catheters were made and 5–7 days later the standard insulin clamps were performed as described above. At euthanasia, liver was sampled for subsequent determinations of gene expression for G6Pase and Pepck using quantitative real-time RT-PCR and phosphorylation levels of Akt using Western blot analysis. Brains were saved for subsequent evaluation of DMH NPY knockdown as described above.
Vagal deafferentation
Left vagal deafferentation was performed by left vagal rootlet transection as preciously described (24, 25). Briefly, 2 weeks after DMH viral injection, anesthetized rats were placed in a stereotaxic apparatus with the neck in a dorsiflexion position. Following a skin incision in the upper neck, the posteriolateral aspect of the occipital bone was carefully exposed. With the aid of an operating microscope, the skull was drilled carefully using a dental drill directed parallel to the dorsal skull surface. After the remaining thin portion of bone was carefully removed with fine forceps, the dura mater was lanced with a hypodermic needle and opened further by blunt dissection, revealing the prominent vagal and more rostral glossopharyngeal afferent rootlets. The dorsal (afferent) rootlets of the vagus were gently lifted to separate them from the ventral (efferent) rootlets and sectioned using an iridectomy scissor. After the dorsal rootlet sectioning, the skull hole was irrigated with sterile saline and packed with saline-moistened gelfoam. The deep, superficial muscle layers and skin were closed with sutures. One week after surgery recovery, indwelling catheters were made and 5–7 days later, the standard insulin clamps were performed as described above. At euthanasia, liver was sampled for subsequent determinations of gene expression for G6Pase and Pepck using quantitative real-time RT-PCR and phosphorylation levels of Akt using Western blot analysis. Brains were saved for subsequent evaluation of DMH NPY knockdown as described above.
Quantitative real-time RT-PCR
Total RNA was extracted from each sample by using Trizol reagent (Invitrogen) according to the manufacturer's protocol. Two-step quantitative real-time RT-PCR was performed for gene expression determination. One microgram of total RNA was reverse-transcribed into first-strand cDNA using the RevertAid First Strand cDNA Synthesis Kits (FERMENTAS, Inc.), and the resulting cDNA product was then quantified using iQ SYBR Green Supermix Kit (Bio-Rad Laboratories) on iQ5 Multicolor Real-Time PCR Detection System (Bio-Rad Laboratories). β-actin was used as an internal control for quantification of individual mRNA. A list of primer sets included: GK, GP, Gys, G6pase, Pepck, and β-actin (Table 1).
Table 1.
A List of Prime Sets For Real-time RT-PCR
| Forward Primer | Reverse Primer | |
|---|---|---|
| GK | 5′-caaaaccacatcagcacacc-3′ | 5′-gcacattgaggctgtgagaa-3′ |
| GP | 5-tggtgtgccacagaaacatt-3 | 5-gcagctggactaggcatttc-3 |
| Gys | 5′-ggactgggctgatcctttctc-3′ | 5′-gcagtgtggcatgggttgta-3′ |
| G6Pase | 5′-gcacatttccctcaccaagt-3′ | 5′-acttggaagccaggttgatg-3′ |
| Pepck | 5′-ccgggcacctcagtgaag-3′ | 5′-cgttggtgaagatggtgtttttc-3′ |
| β-actin | 5′-aggccaaccgcgagaagatgacc-3′ | 5′-gaagtccagggcgacgtaggac-3′ |
Western Blot
Proteins were separated by using 4–12% SDS-PAGE, and transferred to an ImmunBlot polyvinylidene difluoride membrane. The membrane was then incubated with rabbit primary antibodies (anti-total-Akt, catalog No. 9272, anti-Phospho-Akt [ser473], catalog No. 4060, and anti-β-actin, 1:1000 dilution; Cell Signaling Technology) overnight at 4°C, followed by incubation with horseradish peroxidase–labeled antirabbit antibody (cell signaling technology) and specific proteins were detected by using Super Signal West Pico Chemiluminescent Substrate Kit (ThermoScientific). Band intensities were measured using Quantity One (Bio-Rad Laboratories) and β-actin was used as a loading control.
Statistical analysis
All values are presented as means ± SEM. Data were analyzed using StatSoft Statistica-7 software. Data from Figures 1, 2, and 3 were analyzed using Student t test (two-tailed) and data from Figures 4, 5 and 6 were analyzed using two-way ANOVA. All ANOVAs were followed by pairwise multiple Fisher's Least Significant Difference comparisons. P < .05 was considered as a statistically significant difference.
Figure 1.

AAV-mediated shRNA (AAVshNPY) for specific knockdown of NPY in the DMH. A, Representative 35S-labeled in situ hybridization histochemistry shows suppressed expression of Npy in the DMH of rats receiving bilateral DMH injections of AAVshNPY compared with rats receiving control vector injections (AAVshCTL). B, Mean (± SEM) Npy mRNA levels in the ARC and the DMH at 4 wk postviral injection as determined by in situ hybridization histochemistry. C, Body weight at the time of insulin clamp. D, Blood glucose levels at basal and steady-state conditions. E, Plasma insulin levels at basal and steady-state conditions. F, Blood glucose levels during the insulin clamp. Values are means ± SEM. n = 10 in AAVshCTL, n = 9 in AAVshNPY. *, P < .05 vs AAVshCTL rats.
Figure 2.

Glycemic effect of DMH NPY knockdown. A, Steady-state GIR in the euglycemic clamp. B, Rate of glucose disappearance at basal and steady-state conditions. C, Hepatic glucose production at basal and steady-state conditions. D, Suppression of hepatic glucose production (a percent suppression of basal hepatic glucose production). E, Glucose uptake in liver, gastrocnemius muscle, IWAT, EWAT, and IBAT. F, Phosphorylated levels of protein kinase B (Akt) in the liver, normalized to total Akt levels. β-actin served as a loading control. G, Levels of hepatic mRNA expression for GK, GP, Gys, Pepck, and G6pase. Values are means ± SEM. n = 10 in AAVshCTL, n = 9 in AAVshNPY. *P < .05 vs AAVshCTL rats.
Figure 3.
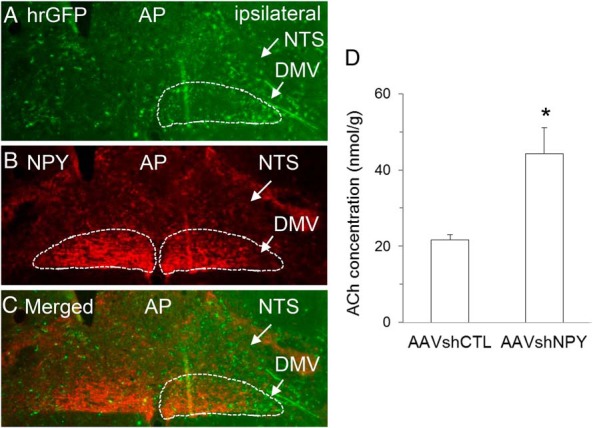
DMH NPY knockdown silences DMH NPY signaling to the DMV of the vagus. A, hrGFP positive fibers were detected in the ipsilateral DMV of rats receiving unilateral DMH injection of AAVshNPY. Abbreviations: NTS, nucleus solitary tract; AP, the area postrema. B, NPY-fiber (red) staining in the ipsilateral DMV was suppressed by DMH NPY knockdown compared with the contralateral DMV. C, Merged image of hrGFP positive and NPY fiber staining. D, Acetylcholine (ACh) levels in the liver. Values are means ± SEM. n = 4–5 rats per group. *, P < .05 vs AAVshCTL rats.
Figure 4.

Hepatic vagotomy ablates glycemic effect of DMH NPY knockdown. NPY knockdown and control rats received a hepatic branch vagotomy (AAVshNPY+Vago and AAVshCTL+Vago) or a sham surgery (AAVshNPY+Sham and AAVshCTL+Sham). A, Body weight at the time of insulin clamp. B, Blood glucose levels at basal and steady-state conditions. C, Plasma insulin levels at basal and steady-state conditions. D, Blood glucose levels during the insulin clamp. E, GIR. F, Rate of glucose disappearance at basal and steady-state conditions. G, Hepatic glucose production at a steady-state condition. H, Suppression of hepatic glucose production. Values are means ± SEM. n = 4–6 rats per group. *, P < .05 vs AAVshCTL+Sham rats; #, P < .05 vs AAVshNPY+Sham rats.
Figure 5.

Hepatic vagotomy ablates the effects of DMH NPY knockdown on Akt phosphorylation and hepatic gene expression. A, Western blot determination of hepatic Akt phosphorylation. β-actin served as a loading control. B, Gene expression determination of hepatic Pepck and G6pase. Values are means ± SEM. n = 4–6 rats per group. *, P < .05 vs AAVshCTL+Sham rats; #, P < .05 vs AAVshNPY+Sham rats.
Figure 6.

Vagal deafferentation does not affect glycemic effects of DMH NPY knockdown. NPY knockdown and control rats received a vagal deafferentation (AAVshNPY+Deaf and AAVshCTL+Deaf) or a sham surgery (AAVshNPY+Sham and AAVshCTL+Sham). A, Body weight. B, Blood glucose levels at basal and steady-state conditions. C, Plasma insulin levels at basal and steady-state conditions. D, GIR. E, Hepatic glucose production. F, Suppression of hepatic glucose production. G, Western blot determination of hepatic Akt phosphorylation. H, Gene expression determination of hepatic Pepck and G6pase. Values are means ± SEM. n = 4 rats per group. *, P < .05 vs AAVshCTL+Sham rats; #, P < .05 vs AAVshNPY+Sham rats.
Results
Effect of DMH NPY knockdown on endogenous glucose production
To better understand the physiological function of DMH NPY in regulating glucose homeostasis, we carried out the insulin clamp by increasing plasma insulin levels at a physiological condition (∼2 ng/mL) in awake rats. DMH NPY knockdown was achieved via bilateral DMH injections of AAVshNPY (Figure 1A). At 4 weeks postviral injection, we verified that Npy mRNA expression was significantly suppressed in the DMH, but was unaffected in the ARC in AAVshNPY rats compared with control rats receiving AAVshCTL (Figure 1B). Consistent with our previous reports, the body weights of NPY knockdown and control rats did not differ significantly at the clamp (4 wk postviral injection) (Figure 1C). Basal plasma glucose and insulin levels in NPY knockdown rats were not significantly different from those of control rats (Figure 1, D and E). During the insulin clamp, whereas both groups of rats maintained equal plasma glucose and insulin levels at the steady state (Figure 1, D–F), NPY knockdown rats required more glucose infusion to prevent insulin-induced hypoglycemia. As shown in Figure 2A, the steady-state GIR was almost double in NPY knockdown rats compared with control rats. Dynamic analysis of glucose production and uptake revealed that endogenous hepatic glucose production was significantly reduced in NPY knockdown rats (Figure 2, B and C). DMH NPY knockdown caused a greater suppression of hepatic glucose production (72% suppression in AAVshNPY vs 28% suppression in AAVshCTL; Figure 2D). This knockdown did not affect hepatic glucose uptake (Figure 2E). Although glucose uptake was higher in the IBAT of NPY knockdown rats compared with control rats, the difference did not reach statistical significance (P = .106; Figure 2E). Glucose uptake was unaffected in IWAT, EWAT, and skeletal muscles in NPY knockdown rats (Figure 2E).
The finding of a greater suppression of hepatic glucose production in NPY knockdown rats suggests that NPY knockdown causes increased hepatic insulin sensitivity. Akt is the key molecule downstream from the phosphatidylinositol 3-kinase (PI3K) pathway in insulin signaling cascades and the activation of Akt promotes insulin's action in controlling hepatic glucose production (1, 2). Thus, we examined the hepatic activity of Akt by detecting Akt phosphorylation. We found that levels of Akt phosphorylation were significantly increased in NPY knockdown rats compared with control rats (Figure 2F), confirming increased hepatic insulin signaling in NPY knockdown rats.
We next investigated hepatic gene expression for key enzymes involved in glucose metabolism. Relative to control rats, NPY knockdown rats had no alterations in mRNA expression for GK, GP, and Gys, but had significant decreases in mRNA expression for G6pase and Pepck (Figure 2G). G6Pase and PEPCK are the key enzymes that catalyze the rate-controlling step of gluconeogenesis. Thus, the reductions of their expression levels in NPY knockdown rats imply that this knockdown mainly affects hepatic gluconeogenesis to reduce hepatic glucose production.
DMH NPY knockdown silences DMH NPY signals to the DMV
The brainstem nucleus solitary tract (NTS) and the DMV are the important brain relay that integrates nutrient, hormonal, and neural signals to control food intake and have also been implicated in controlling hepatic glucose production. We examined the effect of DMH NPY knockdown on DMH NPY signaling to this region using AAVshNPY vector containing hrGFP as an anterograde tracer. Consistent with our previous report (18), we detected hrGFP-positive fibers primarily in the ipsilateral NTS/DMV of rats receiving unilateral DMH injection of AAVshNPY (Figure 3A). Within the DMV, hrGFP-positive fibers were localized particularly to the lateral DMV (Figure 3A), the area where NPY-fiber (red) staining was largely abolished by DMH NPY knockdown compared with the contralateral area (Figure 3, B and C), indicating that DMH NPY knockdown silences DMH NPY descending signals to this area. We next determined whether DMH NPY knockdown affects hepatic vagal innervation by examining levels of the principle vagal neurotransmitter ACh. We found a significant elevation of ACh levels in the liver of NPY knockdown rats compared with control rats (Figure 3D). Together, these results led us to hypothesize that DMH NPY descending signals to the DMV limit hepatic vagal innervation to control hepatic glucose production.
Effect of DMH NPY knockdown on hepatic glucose production via the hepatic vagal nerve
To test this hypothesis, we evaluated the importance of hepatic vagal nerve in the action of DMH NPY in regulating hepatic glucose production by assessing whether hepatic vagotomy abrogates this action. Hepatic vagotomy did not affect body weight, basal glucose, and insulin levels in both control and NPY knockdown rats (Figure 4, A–C). Hepatic vagotomy seems to reduce the potency of insulin's action given that we needed to increase insulin infusion rate in vagotomized rats to achieve the insulin clamp as seen in intact rats above. Nevertheless, under the same clamp condition with plasma insulin levels at ∼2 ng/mL (Figure 4C) and blood glucose levels at the steady state (Figure 4, B and D), hepatic vagotomy did not affect steady-state GIR (Figure 4E) and hepatic glucose production in control rats (Figure 4, F–H). Again, DMH NPY knockdown increased GIR (Figure 4E) and decreased hepatic glucose production compared with control rats with sham surgery (Figure, 4, F–H), but these effects were abated in vagotomized rats (Figure 4, E–H). Hepatic vagotomy also limited the effects of DMH NPY knockdown on Akt phosphorylation (Figure 5A) and mRNA expression of Pepck and G6pase in the liver (Figure 5B). Thus, these results demonstrate the effect of DMH NPY knockdown on hepatic glucose production via the hepatic vagus nerve.
Effect of DMH NPY knockdown on hepatic glucose production was not affected by vagal afferents
The hepatic branch of the vagus contains both vagal efferents and afferents. To distinguish the importance of vagal descending and/or ascending signals in DMH NPY's effects, we conducted left vagal deafferentation in NPY knockdown rats. Vagal deafferentation did not affect body weight, basal glucose, and insulin levels in both NPY knockdown and control rats (Figure 6, A–C). During the clamp, the GIR and hepatic glucose production did not differ significantly between the two control groups of rats receiving vagal deafferentation or sham surgery (Figure 6, D–F). As expected, DMH NPY knockdown in rats with sham surgery exerted its glycemic effects, ie, increased GIR and decreased hepatic glucose production, compared with sham-surgery control rats (Figure 6, D–F). In addition, we found that these effects were unaffected by vagal deafferentation in NPY knockdown rats (Figure 6, D–F), indicating that vagal afferents are not required for the glycemic effect of DMH NPY knockdown. Consistent with this view, NPY knockdown rats with vagal deafferentation had increased hepatic levels of phosphorylated Akt and decreased hepatic expression of Pepck as seen in NPY knockdown rats with sham surgery (Figure 6, G and H).
Discussion
We have assessed the function of DMH NPY in the regulation of glucose homeostasis using a rat model with specific knockdown of NPY in the DMH. We demonstrate that under the insulin clamp, rats with DMH NPY knockdown require more glucose infusion to prevent insulin-induced hypoglycemia. Particularly, DMH NPY knockdown augments insulin-induced suppression of endogenous glucose production. We further provide evidence that DMH NPY descending signals to the DMV modulate insulin's action in controlling hepatic glucose production. Hepatic vagal efferents are required for this glycemic effect. Overall, these results establish a neural signaling pathway of DMH NPY-DMV-liver in the control of hepatic glucose production and glucose homeostasis.
Evidence has shown that DMH NPY overexpression contributes to hyperphagia, obesity, impaired glucose tolerance, and type 2 diabetes (17, 20, 26), but the mechanism through which DMH NPY affects glucose homeostasis remains undetermined. To address this question, we conducted the insulin clamp in NPY knockdown rats at a time when their body weights were not different from those of control rats. We revealed that DMH NPY knockdown resulted in decreased hepatic glucose production, but did not affect glucose uptake. This knockdown elevated Akt phosphorylation and reduced G6pase and Pepck gene expression. These results suggest that lowered DMH NPY signaling causes increased hepatic insulin sensitivity and promote insulin's suppression of hepatic glucose production through limiting gluconeogenesis, suggesting that DMH NPY has an inhibitory effect on hepatic insulin action in the control of glucose production. Thus, physiologically, elevation of DMH NPY would promote endogenous glucose production to prevent hypoglycemia such as in the condition of food restriction-induced shortage of glucose supply (14). Pathologically, prolonged overexpression of DMH NPY causes hyperglycemia and impaired glucose tolerance, eventually leading to type 2 diabetes (17, 18, 20), whereas DMH NPY knockdown ameliorates these alterations (18, 19, 21).
A role for the DMH in glucoregulation has long been implicated. Lesions of the DMH of rats result in deficits in feeding responses to both glucose and insulin challenges (27, 28). Both insulin-induced hypoglycemia and intracarotid glucose cause neuronal activation in the DMH of rats as determined by increased number of Fos-like immunoreactive neurons in this brain region (29, 30). Whereas these results suggest the importance of the DMH in the regulation of glucose homeostasis, the nature of neurons and their signaling pathway underlying the glycemic effect of the DMH have yet to be determined. Our present results provide direct evidence that NPY in the DMH serves as an important neuromodulator in modulating endogenous glucose production to affect glucose homeostasis. In addition, we have previously found a particular role for DMH CCK in the control of glucose homeostasis through interacting with CCK-1 receptors independently of changes in body weight (31). Previous studies have demonstrated that DMH NPY neurons contain CCK-1 receptors (32) and parenchymal microinjection of exogenous CCK into the DMH suppresses Npy expression in the DMH (33). Thus, the results from the present study also provide evidence suggesting that DMH NPY may mediate the glycemic effect of DMH CCK, which merits further investigation.
Increased thermogenic activity in brown adipose tissue (BAT) (such as induced by cold exposure) promotes glucose clearance (34). We have previously demonstrated an important role for DMH NPY in BAT thermoregulation (35). DMH NPY knockdown promotes browning of IWAT and increases BAT thermogenesis (19, 35). At a room temperature condition (23 ± 1°C), this knockdown significantly increases both IBAT and IWAT temperatures during the dark, but not during the light (a trend for increases in IBAT and no change in IWAT) (35). In the present study, we conducted the insulin clamp at room temperature during the light. Consistent with those previous reports showing no significant effects of DMH NPY knockdown on IBAT and IWAT temperature during the light (35), NPY knockdown rats had a nonsignificant increase in glucose uptake in IBAT and unaffected glucose uptake in IWAT (Figure 2E). These results not only provide support for the view that both fat depots are not active in NPY knockdown rats during the light, but also suggest that they are not contributing factors to the glycemic effect of DMH NPY knockdown in the present experimental condition. Nevertheless, the present findings of no significant effects on glucose uptake underscore a distinct role for DMH NPY in regulating glucose homeostasis specifically via affecting hepatic glucose production.
A role for the brainstem NTS and DMV in feeding control has been well studied. They comprise a neural network that receives gastrointestinal signals via vagal afferent nerves, integrates them with inputs from other brain regions and systemic hormonal signals, and sends integrated output via vagal efferent nerves to control food intake (36–39). Recent reports have demonstrated that both gastrointestinal vagal afferents and hepatic vagal efferents also play an important role in controlling hepatic glucose production (40, 41), but it leaves open the question how the neural circuits of the forebrain-vagal system act in the control of hepatic glucose production. We have previously found that DMH NPY descending signals modulate NTS neural function to control food intake (18). In the present study, we extend the previous findings to show that DMH NPY neurons project to the lateral DMV, the area that contains neurons innervating the liver (42, 43), and silencing of DMH NPY descending signals to the DMV leads to increased hepatic vagal innervation. Hepatic vagotomy negated the inhibitory action of DMH NPY knockdown on hepatic glucose production, but vagal deafferentation did not affect this action. These results provide support for the role of the brainstem vagal system in the control of hepatic glucose production and importantly unveil a neural signaling pathway that DMH NPY descending signals modulate vagal hepatic innervation to control glucose production.
Previous reports have shown an effect of central NPY on hepatic insulin resistance. Singhal and colleagues (44) reported that central resistin induces hepatic insulin resistance via NPY in mice. They showed that central resistin–induced elevation of glucose production was abrogated in mice lacking NPY and pretreatment of wild-type mice with the Y1 receptor antagonist prevented the glycemic effect of central resistin (44). Central infusion of resistin also increased Npy expression in the hypothalamus (44), implying that elevation of hypothalamic NPY signaling contributes to hepatic insulin resistance. The present finding of increased insulin sensitivity in rats with NPY knockdown in the DMH provides support for this view, particularly indicating that DMH NPY acts to lower hepatic insulin sensitivity. Given that NPY inhibits DMV neuronal activity via Y1 receptors (45), whether Y1 receptors mediate the effect of DMH NPY on hepatic glucose production merits further investigation. In addition, van den Hoek et al have demonstrated that intracerebroventricular (icv) administration of NPY induces hepatic insulin resistance via sympathetic innervation in rats (46), although endogenous NPY neurons contributing to this effect have yet to be identified. Here we show that silencing of DMH NPY signals to the DMV promotes insulin's suppression of hepatic glucose production via hepatic vagal innervation. We speculate that central NPY regulates hepatic glucose production through modulating both sympathetic and parasympathetic hepatic innervation. Physiologically, the hepatic vagus nerve plays a primary role in controlling hepatic glucose production (47). DMH NPY inhibits this vagal innervation to affect glucose production. Thus, elevation of DMH NPY signaling will limit hepatic vagal innervation, leading to increased glucose production or hepatic insulin resistance. The previous report showing that parasympathetic hepatic denervation did not affect icv NPY-induced hepatic insulin resistance in rats (46) is likely due to the fact that this hepatic innervation was already suppressed by icv NPY. The prevention from icv NPY-induced hepatic insulin resistance or elevation of hepatic glucose production by hepatic sympathectomy suggests that central NPY also elevates sympathetic hepatic innervation to increase output of glucose from the liver likely under nonphysiological conditions (46). In contrast with this stimulation, evidence has suggested an inhibitory role for central NPY in modulating sympathetic activity. Central administration of NPY suppresses sympathetic activity to IBAT in rats (48). We and others have further found that ARC and DMH NPY signaling decreases sympathetic innervation of BAT thermogenesis (19, 49). DMH NPY knockdown promotes browning of IWAT via increased sympathetic innervation (19). Thus, the nature of endogenous NPY signaling (whether it is derived from ARC NPY, DMH NPY, or other NPY neurons) in elevating hepatic sympathetic innervation to regulate glucose homeostasis remains to be determined.
Table 2.
Antibody Table
| Peptide/Protein Target | Antigen Sequence (if known) | Name of Antibody | Manufacturer, Catalog Number, and/or Name of the Individual Providing the Antibody | Species Raised in; Monoclonal or Polyclonal | Dilution Used |
|---|---|---|---|---|---|
| Neuropeptide Y | Anti-NPY antibody | a gift from Dr Eric Grouzmann, Centre Hospitalier Universitaire Vaudois, Lausanne, Switzerland | Mouse, monoclonal | 1:1000 | |
| Total Akt | anti-total-Akt | cell signaling technology, No. 9272 | Rabbit, Polyclonal | 1:1000 | |
| Phospho-Akt (ser473) | anti-Phospho-Akt (ser473) | cell signaling technology, No. 4060 | Rabbit, Monoclonal | 1:1000 |
In summary, we have identified a previously unappreciated role for DMH NPY in regulating hepatic insulin sensitivity and glucose homeostasis. Particularly, DMH NPY descending signals to the DMV modulate hepatic vagal efferent outflow to regulate hepatic glucose production. Previous study has shown that DMH NPY knockdown can reverse high-fat-diet-induced obesity and glucose intolerance (21) in a rat model mimicking human obesity with impaired glucose homeostasis. NPY-expressing neurons are present in the DMH of primates (35). Thus, the present findings also provide a potential approach for suppression of DMH NPY signaling in prompting insulin sensitivity and limiting endogenous glucose production to fight against insulin resistance and type 2 diabetes.
Acknowledgments
We thank Dr T.H. Moran for the technique support of hepatic vagotomy and vagal deafferentation and for the comments, and Dr G.J. Schwartz for the technique support of the hyperinsulinemic-euglycemic clamp.
Present address of C.B.d.L.S.: Department of Foods and Nutrition, University of Georgia, Athens, GA 30602.
This work was supported by U.S. National Institute of Diabetes and Digestive and Kidney Diseases Grant DK103710 (to S.B.).
Disclosure Summary: The authors have nothing to disclose.
Footnotes
- AAV
- adeno-associated virus
- Ach
- acetylcholine
- ARC
- arcaute nucleus
- BAT
- brown adipose tissue
- CCK
- cholecystokinin
- DMH
- dorsomedial hypothalamus
- DMV
- dorsal motor nucleus of the vagus
- EWAT
- epididymal white adipose tissue
- GIR
- glucose infusion rate
- G6pase
- glucose-6-phosphatase
- GK
- glucokinase
- GP
- glycogen phosphorylase
- Gys
- glycogen synthase
- hrGFP
- humanized Renilla green fluorescent protein
- IBAT
- interscapular brown adipose tissue
- IWAT
- inguinal white adipose tissue
- NPY
- neuropeptide Y
- NTS
- nucleus solitary tract
- Pepck
- phosphoenolpyruvate carboxykinase.
References
- 1. Biddinger SB, Kahn CR. From mice to men: Insights into the insulin resistance syndromes. Annu Rev Physiol. 2006;68:123–158. [DOI] [PubMed] [Google Scholar]
- 2. Samuel VT, Shulman GI. Mechanisms for insulin resistance: Common threads and missing links. Cell. 2012;148(5):852–871. [DOI] [PMC free article] [PubMed] [Google Scholar]
- 3. Levin BE, Routh VH, Kang L, Sanders NM, Dunn-Meynell AA. Neuronal glucosensing: What do we know after 50 years? Diabetes. 2004;53(10):2521–2528. [DOI] [PubMed] [Google Scholar]
- 4. Lam CK, Chari M, Lam TK. CNS regulation of glucose homeostasis. Physiology. 2009;24:159–170. [DOI] [PubMed] [Google Scholar]
- 5. Pocai A, Lam TK, Gutierrez-Juarez R, et al. Hypothalamic K(ATP) channels control hepatic glucose production. Nature. 2005;434(7036):1026–1031. [DOI] [PubMed] [Google Scholar]
- 6. Bi S, Kim YJ, Zheng F. Dorsomedial hypothalamic NPY and energy balance control. Neuropeptides. 2012;46(6):309–314. [DOI] [PMC free article] [PubMed] [Google Scholar]
- 7. Marks JL, Waite K. Intracerebroventricular neuropeptide Y acutely influences glucose metabolism and insulin sensitivity in the rat. J Neuroendocrinol. 19(2)97;9:99–103. [DOI] [PubMed] [Google Scholar]
- 8. Broberger C, De Lecea L, Sutcliffe JG, Hokfelt T. Hypocretin/orexin- and melanin-concentrating hormone-expressing cells form distinct populations in the rodent lateral hypothalamus: Relationship to the neuropeptide Y and agouti gene-related protein systems. J Comp Neurol. 1998;402(4):460–474. [PubMed] [Google Scholar]
- 9. Hahn TM, Breininger JF, Baskin DG, Schwartz MW. Coexpression of Agrp and NPY in fasting-activated hypothalamic neurons. Nat Neurosci. 1(4)998;1:271–272. [DOI] [PubMed] [Google Scholar]
- 10. Gautron L, Elmquist JK. Sixteen years and counting: An update on leptin in energy balance. J Clin Invest. 2011;121(6):2087–2093. [DOI] [PMC free article] [PubMed] [Google Scholar]
- 11. Morton GJ, Cummings DE, Baskin DG, Barsh GS, Schwartz MW. Central nervous system control of food intake and body weight. Nature. 2006;443(7109):289–295. [DOI] [PubMed] [Google Scholar]
- 12. Kinzig KP, Scott KA, Hyun J, Bi S, Moran TH. Lateral ventricular ghrelin and fourth ventricular ghrelin induce similar increases in food intake and patterns of hypothalamic gene expression. Am J Physiol Regul Integr Comp Physiol. 2006;290:R1565–R1569. [DOI] [PubMed] [Google Scholar]
- 13. Könner AC, Janoschek R, Plum L, et al. Insulin action in AgRP-expressing neurons is required for suppression of hepatic glucose production. Cell Metab. 2007;5(6):438–449. [DOI] [PubMed] [Google Scholar]
- 14. Bi S, Robinson BM, Moran TH. Acute food deprivation and chronic food restriction differentially affect hypothalamic NPY mRNA expression. Am J Physiol Regul Integr Comp Physiol. 2003;285:R1030–R1036. [DOI] [PubMed] [Google Scholar]
- 15. Kesterson RA, Huszar D, Lynch CA, Simerly RB, Cone RD. Induction of neuropeptide Y gene expression in the dorsal medial hypothalamic nucleus in two models of the agouti obesity syndrome. Mol Endocrinol. 1997;11(5):630–637. [DOI] [PubMed] [Google Scholar]
- 16. Guan XM, Yu H, Trumbauer M, Frazier E, Van der Ploeg LH, Chen H. Induction of neuropeptide Y expression in dorsomedial hypothalamus of diet-induced obese mice. Neuroreport. 19(15)98;9:3415–3419. [DOI] [PubMed] [Google Scholar]
- 17. Bi S, Ladenheim EE, Schwartz GJ, Moran TH. A role for NPY overexpression in the dorsomedial hypothalamus in hyperphagia and obesity of OLETF rats. Am J Physiol Regul Integr Comp Physiol. 2001;281:R254–R260. [DOI] [PubMed] [Google Scholar]
- 18. Yang L, Scott KA, Hyun J, et al. Role of dorsomedial hypothalamic neuropeptide Y in modulating food intake and energy balance. J Neurosci. 2009;29:179–190. [DOI] [PMC free article] [PubMed] [Google Scholar]
- 19. Chao PT, Yang L, Aja S, Moran TH, Bi S. Knockdown of NPY expression in the dorsomedial hypothalamus promotes development of brown adipocytes and prevents diet-induced obesity. Cell Metab. 2011;13(5):573–583. [DOI] [PMC free article] [PubMed] [Google Scholar]
- 20. Zheng F, Kim YJ, Chao PT, Bi S. Overexpression of neuropeptide y in the dorsomedial hypothalamus causes hyperphagia and obesity in rats. Obesity. 2013;21(6):1086–1092. [DOI] [PubMed] [Google Scholar]
- 21. Kim YJ, Bi S. Knockdown of neuropeptide Y in the dorsomedial hypothalamus reverses high-fat diet-induced obesity and impaired glucose tolerance in rats. Am J Physiol Regul Integr Comp Physiol. 2016;310:R134–R142. [DOI] [PMC free article] [PubMed] [Google Scholar]
- 22. Paxinos G, Watson C. The rat brain in stereotaxic coordinates. 5th Ed San Diego: Elsevier Academic Press; 2005. [Google Scholar]
- 23. Ross RA, Rossetti L, Lam TK, Schwartz GJ. Differential effects of hypothalamic long-chain fatty acid infusions on suppression of hepatic glucose production. Am J Physiol Endocrinol Metab. 2010;299(4):E633–E639. [DOI] [PMC free article] [PubMed] [Google Scholar]
- 24. Moran TH, Norgren R, Crosby RJ, McHugh PR. Central and peripheral vagal transport of cholecystokinin binding sites occurs in afferent fibers. Brain Res. 1990;526(1):95–102. [DOI] [PubMed] [Google Scholar]
- 25. Moran TH, Baldessarini AR, Salorio CF, Lowery T, Schwartz GJ. Vagal afferent and efferent contributions to the inhibition of food intake by cholecystokinin. Am J Physiol. 1997;272(4 Pt 2):R1245–R1251. [DOI] [PubMed] [Google Scholar]
- 26. Kawano K, Hirashima T, Mori S, Saitoh Y, Kurosumi M, Natori T. Spontaneous long-term hyperglycemic rat with diabetic complications. Otsuka Long-Evans Tokushima Fatty (OLETF) strain. Diabetes. 1992;41(11):1422–1428. [DOI] [PubMed] [Google Scholar]
- 27. Bellinger LL, Bernardis LL. Effect of insulin in rats with lesions of the dorsomedial hypothalamic nucleus. Physiol Behav. 1979;23(6):1157–1161. [DOI] [PubMed] [Google Scholar]
- 28. Bellinger LL, Bernardis LL, Brooks S. Feeding responses of rats with dorsomedial hypothalamic lesions given ip 2DG or glucose. Am J Physiol. 1978;235(3):R168–R174. [DOI] [PubMed] [Google Scholar]
- 29. Dunn-Meynell AA, Govek E, Levin BE. Intracarotid glucose selectively increases Fos-like immunoreactivity in paraventricular, ventromedial and dorsomedial nuclei neurons. Brain Res. 1997;748(1–2):100–106. [DOI] [PubMed] [Google Scholar]
- 30. Niimi M, Sato M, Tamaki M, Wada Y, Takahara J, Kawanishi K. Induction of Fos protein in the rat hypothalamus elicited by insulin-induced hypoglycemia. Neurosci Res. 1995;23(4):361–364. [DOI] [PubMed] [Google Scholar]
- 31. Zhu G, Yan J, Smith WW, Moran TH, Bi S. Roles of dorsomedial hypothalamic cholecystokinin signaling in the controls of meal patterns and glucose homeostasis. Physiol Behav. 2012;105(2):234–241. [DOI] [PMC free article] [PubMed] [Google Scholar]
- 32. Bi S, Scott KA, Kopin AS, Moran TH. Differential roles for cholecystokinin a receptors in energy balance in rats and mice. Endocrinology. 2004;145(8):3873–3880. [DOI] [PubMed] [Google Scholar]
- 33. Chen J, Scott KA, Zhao Z, Moran TH, Bi S. Characterization of the feeding inhibition and neural activation produced by dorsomedial hypothalamic cholecystokinin administration. Neuroscience. 2008;152(1):178–188. [DOI] [PMC free article] [PubMed] [Google Scholar]
- 34. Nedergaard J, Bengtsson T, Cannon B. New powers of brown fat: Fighting the metabolic syndrome. Cell Metab. 2011;13(3):238–240. [DOI] [PubMed] [Google Scholar]
- 35. Bi S. Dorsomedial hypothalamic NPY modulation of adiposity and thermogenesis. Physiol Behav. 2013;121:56–60. [DOI] [PMC free article] [PubMed] [Google Scholar]
- 36. Bi S, Moran TH. Actions of CCK in the controls of food intake and body weight: Lessons from the CCK-A receptor deficient OLETF rat. Neuropeptides. 2002;36(2–3):171–181. [DOI] [PubMed] [Google Scholar]
- 37. Berthoud HR, Sutton GM, Townsend RL, Patterson LM, Zheng H. Brainstem mechanisms integrating gut-derived satiety signals and descending forebrain information in the control of meal size. Physiol Behav. 2006;89(4):517–524. [DOI] [PubMed] [Google Scholar]
- 38. Travagli RA, Hermann GE, Browning KN, Rogers RC. Brainstem circuits regulating gastric function. Annu Rev Physiol. 2006;68:279–305. [DOI] [PMC free article] [PubMed] [Google Scholar]
- 39. Grill HJ, Hayes MR. Hindbrain neurons as an essential hub in the neuroanatomically distributed control of energy balance. Cell Metab. 2012;16(3):296–309. [DOI] [PMC free article] [PubMed] [Google Scholar]
- 40. Wang PY, Caspi L, Lam CK, et al. Upper intestinal lipids trigger a gut-brain-liver axis to regulate glucose production. Nature. 2008;452(7190):1012–1016. [DOI] [PubMed] [Google Scholar]
- 41. Cheung GW, Kokorovic A, Lam CK, Chari M, Lam TK. Intestinal cholecystokinin controls glucose production through a neuronal network. Cell Metab. 2009;10(2):99–109. [DOI] [PubMed] [Google Scholar]
- 42. Rogers RC, Hermann GE. Central connections of the hepatic branch of the vagus nerve: A horseradish peroxidase histochemical study. J Auton Nerv Syst. 1983;7(2):165–174. [DOI] [PubMed] [Google Scholar]
- 43. Norgren R, Smith GP. Central distribution of subdiaphragmatic vagal branches in the rat. J Comp Neurol. 1988;273(2):207–223. [DOI] [PubMed] [Google Scholar]
- 44. Singhal NS, Lazar MA, Ahima RS. Central resistin induces hepatic insulin resistance via neuropeptide Y. J Neurosci. 2007;27:12924–12932. [DOI] [PMC free article] [PubMed] [Google Scholar]
- 45. Browning KN, Travagli RA. Neuropeptide Y and peptide YY inhibit excitatory synaptic transmission in the rat dorsal motor nucleus of the vagus. J Physiol. 2003;549(Pt 3):775–785. [DOI] [PMC free article] [PubMed] [Google Scholar]
- 46. van den Hoek AM, van Heijningen C, Schröder-van der Elst JP, et al. Intracerebroventricular administration of neuropeptide Y induces hepatic insulin resistance via sympathetic innervation. Diabetes. 2008;57(9):2304–2310. [DOI] [PMC free article] [PubMed] [Google Scholar]
- 47. Puschel GP. Control of hepatocyte metabolism by sympathetic and parasympathetic hepatic nerves. Anat Rec A Discov Mol Cell Evol Biol. 2004;280:854–867. [DOI] [PubMed] [Google Scholar]
- 48. Egawa M, Yoshimatsu H, Bray GA. Neuropeptide Y suppresses sympathetic activity to interscapular brown adipose tissue in rats. Am J Physiol. 1991;260(2 Pt 2):R328–R334. [DOI] [PubMed] [Google Scholar]
- 49. Shi YC, Lau J, Lin Z, et al. Arcuate NPY controls sympathetic output and BAT function via a relay of tyrosine hydroxylase neurons in the PVN. Cell Metab. 2013;17(2):236–248. [DOI] [PubMed] [Google Scholar]