

Abstract
Objectives
Calcium pyrophosphate crystal deposition disease (CPPD) is common, yet prevalence and overall clinical impact remain unclear. Sensitivity and specificity of CPPD reference standards (conventional crystal analysis (CCA) and radiography (CR)) were meta-analysed by EULAR (published 2011). Since then, new diagnostic modalities are emerging. Hence, we updated 2009–2016 literature findings by systematic review and evidence grading, and assessed unmet needs.
Methods
We performed systematic search of full papers (PubMed, Scopus/EMBASE, Cochrane 2009–2016 databases). Search terms included CPPD, chondrocalcinosis, pseudogout, ultrasound, MRI, dual energy CT (DECT). Paper selection, data abstraction, EULAR evidence level, and Quality Assessment of Diagnostic Accuracy Studies (QUADAS)-2 bias and applicability grading were performed independently by 3 authors.
Results
We included 26 of 111 eligible papers, which showed emergence in CPPD diagnosis of ultrasound (U/S), and to lesser degree, DECT and Raman spectroscopy. U/S detected CPPD crystals in peripheral joints with sensitivity >80%, superior to CR. However, most study designs, though analytical, yielded low EULAR evidence level. DECT was marginally explored for CPPD, compared with 35 published DECT studies in gout. QUADAS-2 grading indicated strong applicability of U/S, DECT and Raman spectroscopy, but high study bias risk (in ∼30% of papers) due to non-controlled designs, and non-randomised subject selection.
Conclusions
Though CCA and CR remain reference standards for CPPD diagnosis, U/S, DECT and Raman spectroscopy are emerging U/S sensitivity appears to be superior to CR. We identified major unmet needs, including for randomised, blinded, controlled studies of CPPD diagnostic performance and rigorous analyses of 4 T MRI and other emerging modalities.
Keywords: Chondrocalcinosis, Ultrasonography, Synovial fluid, Qualitative research, Quality Indicators
Key messages.
What is already known about this subject?
The reference standards of calcium pyrophosphate crystal deposition disease (CPPD) diagnosis are conventional radiography for chondrocalcinosis, and synovial fluid compensated polarised light microscopy, but, in recent years, ultrasound has been established to have strong diagnostic performance for CPPD, and sensitivity higher than plain radiography.
What does this study add?
Systematic search of full publications on CPPD diagnostic approaches, published since the drafting of EULAR CPPD diagnostic recommendations, point to the potential value for not only ultrasound, but also of DECT, the relatively unvalidated utility of emerging modalities such as Raman spectroscopy for crystal analysis (including an approach adapted for ‘point of care’ use).
Quality and inherent risks of bias were highly variable in the studies reviewed, and the volume of CPPD diagnosis investigation is dwarfed by the number of studies of urate crystal detection in gout.
Overall, there remains major, unmet need for randomised, blinded and controlled studies of CPPD diagnostic performance of advanced imaging and emerging crystal analytic modalities, in patient samples in ‘real-world’ clinical scenarios, with comparison to the reference standards.
How might this impact on clinical practice?
New criteria that incorporate advanced imaging and emerging crystal analytic methods should advance clinical practice by improving recognition of CPPD, and thereby leading to more understanding in clinical practice of how CPPD can impact on phenotypes of joint pathology.
Introduction
Calcium pyrophosphate dihydrate crystal deposition (CPPD) in the extracellular matrix of articular hyaline and fibrocartilages, and of certain articular and periarticular connective tissues is very common as an idiopathic disorder in ageing.1 CPPD also can occur in association with osteoarthritis (OA), certain metabolic disorders (including hyperparathyroidism, haemochromatosis, hypomagnesaemia), and as a heritable disorder, whose common thread may be excessive cartilage extracellular inorganic pyrophosphate (PPi).2 Contributing factors to the disorder include PPi generation and transport, imbalances in chondrocyte growth factors, and alterations in the connective tissue matrix.2
CPPD manifests substantially more often as joint pathology than it does as a symptomatic arthropathy. Recent epidemiological studies suggest growing CPPD prevalence in developed countries, not simply due to increased longevity of the population and particularly high prevalence of OA, but also potentially promoted by iatrogenic factors; these factors include hypomagnesaemia associated with loop and thiazide diuretics and proton pump inhibitors.1 The original diagnostic criteria for CPPD were proposed by McCarty3 in 1994. European League Against Rheumatism (EULAR) recommendations for diagnosis in 2011 reinforced these criteria,4 including that the gold standard for diagnosis of CPPD crystal deposition disease, particularly for acute CPP crystal-associated inflammatory arthritis, is identification of CPPD crystals by compensated polarised light microscopic analysis of synovial fluid, in the absence of joint infection or other cause of arthritis. EULAR also seminally highlighted evidence on the utility of ultrasound (U/S) in CPPD diagnosis in 2011.4 As U/S and other CPPD diagnostic modalities are rapidly emerging since 2011, we systematically reviewed the literature on the diagnostic approach modalities, including the conventional standard of plain radiography. We examined new evidence on high-resolution U/S, dual-energy CT (DECT) and specialised crystal analytic approaches such as Raman spectroscopy. To bring focus onto the most recent developments in CPPD diagnosis, we used the 2011 EULAR systematic review as a starting point, and simply updated 2009–2016 literature findings not cited in 2011 by EULAR.4 We also performed evidence grading, and assessed unmet needs in the field.
Methods
Literature search
We conducted a literature search of PUBMED (1 January 2009 to 30 April 2016), SCOPUS/EMBASE (1 January 2009 to 30 April 2016) and COCHRANE (1 January 2009 to 30 April 2016) databases. Our search strategies used a combination of controlled terms, subject headings and keywords to locate studies related to the themes of CPPD crystal deposition and diagnosis. The major search terms and concepts included (but were not limited to) CPPD crystal deposition, pseudogout, chondrocalcinosis, diagnosis, diagnostic imaging, ultrasound, plain x-ray, computed tomography, dual-energy computed tomography, magnetic resonance imaging, crystal analysis and Raman spectroscopy. We identified additional articles through manual searches of the references in relevant papers.
Review of literature
After the initial searches were completed, YW reviewed all the resulting titles and abstracts. Citations were excluded if the title or abstract was not relevant to the goals of the review. Full manuscripts of the remaining citations were reviewed by YW and RT. Review articles were excluded; selected articles were manually searched to identify additional relevant reports.
Selection criteria
We reviewed titles and abstracts to identify published studies that met our systematic review inclusion criteria of: (1) diagnostic performance of ≥1 imaging or tissue/fluid sample crystal analytic modalities; (2) ≥1 group of patient±human specimens; (3) sensitivity or specificity measure (original or meta-analytic). We excluded: (1) non-English text; (2) non-original literature (eg, reviews without meta-analysis or comparable statistical analyses, editorials, opinions, letters, non-analytical); (3) case report; (4) not pertaining to diagnosis; (5) simple prevalence survey by conventional crystal analysis (CCA) or conventional radiography (CR); (6) use of synthetic crystals.
Data extraction and quality assessment
Two authors (YW and RT) independently reviewed the articles identified from the literature search. Then the following information was collected: index diagnostic modality, overall study design, modality compared with CCA or CR reference standard and EULAR level of evidence. Methodological quality was assessed by the Quality Assessment of Diagnostic Accuracy Studies (QUADAS)-2 tool.5 QUADAS-2 is the current version of QUADAS and the tool for use in systematic reviews to evaluate the risk of bias and applicability of primary diagnostic accuracy studies. When there were differences in QUADAS-2 scores, a third author (KC) reviewed the paper to settle discrepancies.
Results
Study identification
A total of 111 articles were reviewed (figure 1). Among articles identified, 65 were excluded after review of the title and/or abstract, 19 were excluded after review of manuscript, and 1 duplicate was excluded. A total of 26 articles were included in the analysis, all of them are full length manuscripts (tables 1–3). Table 1 provides information on the diagnostic modalities and EULAR evidence levels. Two studies examined CR,6 7 12 studies examined U/S,8–19 1 study examined CT,20 1 study examined DECT,21 3 studies examined CCA,22–24 4 studies examined Raman spectroscopy,25–28 1 study examined elemental bioanalysis29 and 2 studies examined metabolomic or other mass spectrometry.30 31
Figure 1.
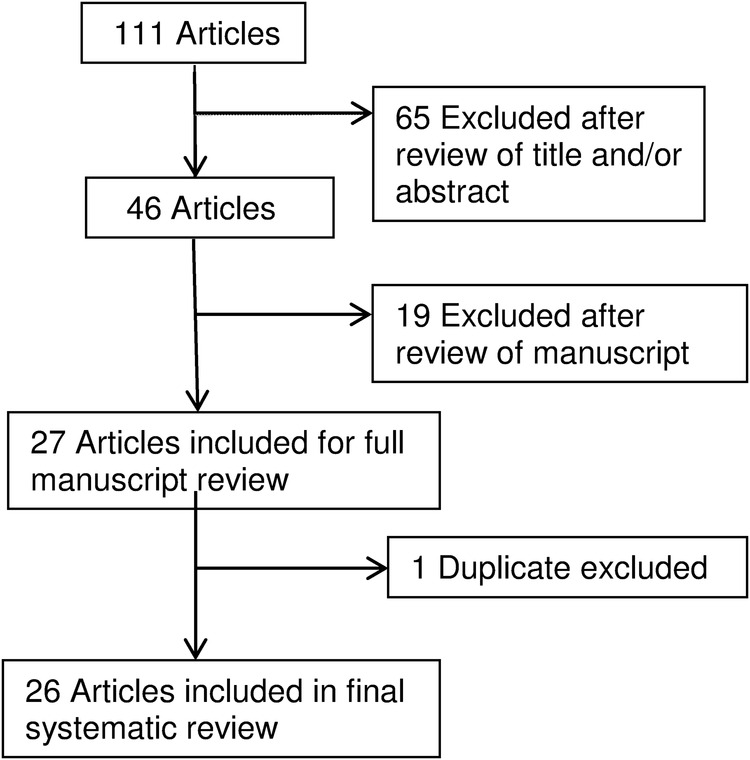
Systematic review study flow. A total of 111 articles were reviewed. Among articles identified, 65 were excluded after review of the title and/or abstract, 19 were excluded after review of manuscript, and 1 duplicate was excluded. A total of 26 articles were included in the analysis.
Table 1.
Modalities and EULAR evidence levels
| Index diagnostic modality: | Overall study design:
|
Modality compared with CA or CR Reference standard?
|
EULAR level of evidence*:
|
| CR6 7: n=2 | Analytical: cross-sectional, n=2 | Yes: n=2 | II: n=2 |
| U/S8–19: n=12 |
|
Yes: n=12 |
|
| CT20: n=1 | Analytical: cross-sectional, n=1. | Yes: n=1 | II: n=1 |
| DECT21: n=1 | Analytical: cross-sectional, n=1 | Yes: n=1 | II: n=1 |
| CCA22–24: n=3 |
|
Yes: n=3 | II: n=3 |
| Raman spectroscopy25–28: n=4 |
|
Yes: n=4 | II: n=4 |
| Elemental bioanalysis29: n=1 | Analytical: cross-sectional, n=1 | No: n=1 | II: n=1 |
| Metabolomic30 or other mass spectrometry31: n=2 |
|
|
|
II: Cohort or case–control studies; III: non-comparative, descriptive studies; IV: expert opinion.
*EULAR level of evidence: I: meta-analysis of cohort or case–control studies.
CCA, conventional crystal analysis; CR, conventional radiography; DECT, dual-energy CT; U/S, ultrasound.
Table 2.
Imaging study (CR, U/S, DECT, CT, MRI) characteristics and features
| Study | Modality | Diagnosis of CPPD | Publication date | Patients (N) | Features examined | Prevalence of pattern by site | Sensitivity | Specificity |
|---|---|---|---|---|---|---|---|---|
| Abhishek et al6 | CR | X-rays | 7/2013 | 435 | CC at knee, hip, wrist, symphysis pubis, and MCP | Knee 8%, hip 5%, wrist 6.9%, symphysis pubis 3.6%, MCP 1.5% | ND | ND |
| Abhishek et al7 | CR | X-rays | 10/2012 | 428 | CC at hip, wrist, symphysis pubis, and MCP without knee CC | Hip 45.9%, wrist 44.4%, symphysis pubis 45.5%, MCP 31.3% | ND | ND |
| Barskova et al8 | U/S | McCarty criteria | 6/2013 | 25 | Linear hyperechoic deposits in hyaline cartilage | Knee: U/S 100% CT 72% CR 52% |
ND | ND |
| Filippou et al9 | U/S | McCarty criteria | 11/2013 | 42 | Hyperechogenic bands and spots in hyaline cartilage and fibrocartilage; linear deposits along the tendon | Knee 97.6%, wrist 88%, Achilles tendon 54.8%, plantar fascia 26.1%, MCP 9.5% | ND | ND |
| Filippucci et al10 | U/S | CPPD crystal analysis | 9/2013 | 88 | Hyperechoic spots within the fibrocartilage and hyaline cartilage of the humeral head | Fibrocartilage 42.4%, hyaline cartilage 16.3% |
ND | ND |
| Filippucci et al11 | U/S | McCarty criteria | 2/2009 | 48 | Intracartilaginous hyperechoic spots | ND | Knee 68.7% | Knee 97.6% |
| Filippucci et al12 | U/S | McCarty criteria | 1/2010 | 70 | Intracartilaginous hyperechoic spots | Knee 64.2% | ND | ND |
| Gutierrez et al13 | U/S | CPPD crystal analysis | 12/2010 | 2 | Calcification within femoral hyaline cartilage, hyperechoic spots in wrist | ND | ND | ND |
| Lamers-Karnebeek et al14 | U/S | CPPD crystal analysis | 4/2014 | 54 | Hyperechoic band within the cartilage | 0 | ND | ND |
| Loffler et al15 | U/S | CPPD crystal analysis | 3/2015 | 225 | Hyperechoic spots within the cartilage | ND | 78.9% | 51.7% |
| Russell et al16 | U/S | CPPD crystal analysis | 3/2013 | 4 | Hyperechoic foci within the cartilage | ND | ND | ND |
| Ruta et al17 | U/S | McCarty criteria | 4/2016 | 75 | Hyperechoic bands within the femoral hyaline cartilage and hyperechoic spots in meniscal fibrocartilage | ND | 60% | 96.7% |
| Zufferey et al18 | U/S | CPPD crystal analysis | 7/2015 | 109 | Intracartilage, meniscus, synovial or tendon hyperechoic deposits | ND | 60% | 80% |
| Ottaviani et al19 | U/S | CPPD crystal analysis | 8/2015 | 51 | Hyperechoic spots in knee cartilage | ND | 100% | 92.3% |
| Kobayashi et al20 | CT | CPPD crystal analysis | 9/2014 | 27 | Calcification of the transverse ligament and longus colli muscle | Neck: transverse ligament 81.5%, longus colli 7.4% |
ND | ND |
| Misra et al21 | DECT | X-rays | 2/2015 | 16 | Intra-articular calcium crystal in meniscal and hyaline cartilage and deeper structures cruciate ligaments and joint capsules | Meniscus 66.6–95.8%, hyaline cartilage 8.3–91.6%, cruciate ligament 0–79.1%, joint capsule 58.3–62.5% | ND | ND |
CC, chondrocalcinosis; CPPD, calcium pyrophosphate crystal deposition disease; CR, conventional radiography; DECT, dual-energy CT; MCP, metacarpophalangeal joint; ND, not defined; U/S, ultrasound.
Table 3.
Crystal analytic study (CCA, Raman spectroscopy, elemental bioanalysis, metabolomic, mass spectrometry) characteristics and features
| Study | Modality | Diagnosis of CPPD | Publication date | Patients (N) | Features examined | Prevalence of pattern by site | Sensitivity | Specificity |
|---|---|---|---|---|---|---|---|---|
| Pollet et al22 | CCA | CPPD crystal analysis | 5/2015 | 180 | Synovial fluid crystal analysis | ND | 66.7% | 93.2% |
| Robier et al23 | CCA | CPPD crystal analysis | 6/2014 | 50 | Synovial CCP crystal count with cytospin and smear | Cytospin 96/10HPF, smear 2.5/10HPF | ND | ND |
| Tausche et al24 | CCA | CPPD crystal analysis | 8/2013 | 75 | CCP crystals/field day 0 and stored for 1–3 days | >5/field 33.3%, <5/field 66.6% |
ND | ND |
| Cheng et al25 | Raman spectroscopy | CPPD crystal analysis | 4/2009 | 35 | CCP crystal analysis with Raman and PLM | Agreement 91.4%, discrepancy 8.5%, confirmation 100% correct with Raman, 33.3% correct with PLM |
ND | ND |
| Li et al26 | Raman spectroscopy | CPPD crystal analysis | 2/2014 | ND | CPPD crystals concentrations detected by CARD and PLM | CARD 1 ug/mL, PLM 10–100 ug/mL |
ND | ND |
| Fuerst et al27 | Raman spectroscopy | CPPD crystal analysis | 3/2010 | 4 | CPPD crystal analysis by Raman spectra | CPPD 25%, HA 75% | ND | ND |
| Li et al28 | Raman spectroscopy | CPPD crystal analysis | 2/2016 | 174 | Rapid POCR compared with CPLM for CPPD and gout diagnoses | Overall 89.7% POCR and CPLM agreement; κ coefficient for POCR and CPLM: 0.61 (95% CI 0.42 to 0.81) in CPPD; 0.84 (CI 0.75 to 0.94) in gout |
ND | ND |
| Nguyen et al29 | Elemental bioanalysis | CPPD crystal analysis | 2013 | 20 (141 cartilage samples) | CaC crystals and CPP crystals in patients with OA by FT-IR | CaC crystals 68.3%, CPP crystals 14.1% | ND | ND |
| Hugle et al30 | Metabolomic | CPPD crystal analysis | 3/2012 | 59 | Metabolomic profiling of knee synovial fluid with NMR | 35 different metabolites identified, no difference compared with OA | ND | ND |
| Austin et al31 | Mass spectrometry | CPPD crystal analysis | 3/2009 | ND | CPP crystal identification with LA ICP-MS | High calcium, phosphorus, magnesium, strontium intensities in cartilage and synthetic synovial fluid | ND | ND |
CaC, calcium-containing; CARD, cost-efficient automated Raman device; CCA, conventional crystal analysis; CCP, cyclic citrullinated peptide; CPLM, compensated polarised light microscopy; CPPD, calcium pyrophosphate crystal deposition disease; FT-IR, Fourier-transform infrared spectroscopy; HA, hydroxyapatite; LA ICP-MS, laser ablation inductively coupled plasma mass spectrometry; ND, not defined; NMR, nuclear MR; OA, osteoarthritis; PLM, polarised light microscopy; POCR, point of care Raman.
Quality assessment
Overall, the included studies met most of the quality indicators of the QUADAS-2 tool (figure 2). The most common quality issues were non-randomised patient selection without case–control or appropriate exclusion, and index test results being interpreted without knowledge of the results of the reference standard.
Figure 2.

Graphical display for QUADAS-2 results. We assessed methodological quality by the QUADAS-2 tool, to evaluate the risk of bias and applicability of primary diagnostic accuracy studies, as described in the text. As the data show in the figure, the overall quality of the studies was satisfactory, with most QUADAS-2 grading in the low-risk range. The QUADAS-2 grading strongly supported applicability of U/S, DECT, and Raman spectroscopy, but there was moderate study bias risk overall; specifically ∼30% studies lacked proper knowledge of the results of the reference standard; and ∼25% studies without proper patient selection due to non-controlled study designs, and non-randomized subject selection. DECT, dual-energy CT; QUADAS, Quality Assessment of Diagnostic Accuracy Studies; U/S, ultrasound.
Study design, modality and level of evidence
Study design, modality and level of evidence are shown in table 1. Most studies were case–control or cross-sectional studies with exceptions of three descriptive studies.13 16 31 Among the 26 diagnostic studies, all but 229 30 used comparison to CCA or CR reference standard; the remaining 2 studies29 30 did not use any reference standard for comparison. Modalities examined, and numbers of studies for each are cited in table 1. Most studies (23 of 26)6–12 14 15 17–30 yielded EULAR evidence level of II, and 313 16 31 of 26 studies provided lower EULAR evidence of III.
Study characteristics and features
Detailed study characteristics and features are shown in tables 2 and 3. We included only studies (from 1 January 2009 to 30 April 2016) after the EULAR recommendations for calcium pyrophosphate deposition terminology and diagnosis. Among all 26 studies, 12 (7 U/S, 2 CCA, 3 Raman spectroscopy)10–12 14–16 18 22 24–26 28 included patients with CPPD and gout, 7 (5 U/S, 1 CT, 1 CCA)8 9 13 17 19 20 23 studied patients with CPPD only and 6 (2 CR, 1 DECT, 1 Raman spectroscopy, 1 elemental bioanalysis, 1 mass spectrometry)6 7 21 27 29 31 included patients with CPPD and significant coexisting OA. The articular or periarticular sites studied were mostly knees,6–9 11–19 21–23 29–31 as well as wrists,6 7 9 13 22 ankles,14 15 18 22 hips,6 7 22 31 metacarpophalangeal joints (MCPs),6 7 9 16 shoulders,10 22 23 metatarsophalangeal joints (MTPs),14 18 22 symphysis pubis,6 7 elbows,16 22 neck20 and Achilles tendon/plantar fascia.9 The age of patients ranged from 1828 to 9822 years, and the proportion of males ranged from 22.9%11 to 70.4%.14 The mean disease duration was described in three studies8 10 12 and ranged from 5.6 to 6 years.
As previously described, the U/S patterns evaluated were linear hyperechoic deposits or bands in the hyaline cartilage,8 9 14 17 hyperechoic spots in fibrous cartilage or in tendons.9–13 15–19 The sensitivity of U/S studies ranged from 60%17 18 to 100%19 and specificity from 51.7%15 to 97.6%.11 One study of CCA claimed sensitivity of 66.7%22 and specificity of 93.2%.22 Meta-analysis, in one systematic review study, concluded sensitivity and specificity for U/S in CPPD of 87.9%32 and 91.5%,32 respectively.
Diagnosis of CPPD relies on identification of CPPD crystals by compensated polarised light microscope (CPLM) in synovial fluid aspirates, enhanced by birefringent properties of CPPD. However, the relatively small field of view limits the efficiency and accuracy of CPPD diagnosis by CPLM. Raman spectroscopy is a chemical analysis technique that is 100% specific in fingerprinting species based on the identification of chemical bonds unique to each material.28 We reviewed four major studies25–28 comparing Raman spectroscopy and CPLM. It was found that point of care Raman (POCR) spectroscopy can detect monosodium urate and CPPD crystals with good sensitivity and specificity at concentrations as low as 5 and 2.5 μg/mL,25 and 0.1 and 1 μg/mL.26 The detection limit of Raman spectroscopy is lower than that reported for CCA. Further study using a larger clinical sample set revealed that CPLM and POCR analyses agreed in 89.7% of samples (156 of 174), κ coefficients indicated that POCR and CPLM had excellent agreement in diagnosing gout (0.84 with 95% CI 0.75 to 0.94), and good, but less broad agreement in diagnosing acute CPP crystal arthritis (pseudogout; 0.61 with 95% CI 0.42 to 0.81).28 The results suggested that POCR can be used in settings where there are limited time, resources or staff to execute CPLM, also can be used in conjunction with CPLM when there is ambiguity in identifying the type of crystal microscopically. Such ambiguity exists more often for CPP crystals which appear to evade detection by CPLM.33 However, the study refrained from deriving a sensitivity value for POCR or CPLM because there is no gold standard method that gives 100% accurate diagnosis.
We found only three small studies on elemental bioanalysis,29 metabolomics30 and mass spectroscopy.31 Nguyen et al29 carried out elemental bioanalysis using Fourier-transform infrared (FT-IR) spectrometry and scanning electron microscopy (SEM) of 8–10 cartilage zones of the knees from 20 patients with OA, including medial and lateral femoral condyles and tibial plateau and the intercondyle zone. Differential expression of genes involved in the mineralisation process between cartilage with and without calcification was assessed by RT-PCR; immunohistochemistry and histology studies were performed as well.29 Among 141 cartilage samples from 20 patients with OA,29 FT-IR spectroscopy detected calcium-containing (CaC) crystals in 63.8% (90/141) and revealed 4 distinct CaC crystal spectra: CA crystals in 71 samples; CPP crystals were detected in 20 samples from 8 patients; amorphous Ca2+ carbonated phosphate crystals in 3 samples from 3 patients, and whitlockite crystals in 4 samples from the same patient. Although preoperative X-rays showed joint calcifications (chondrocalcinosis) in four cases only, the CaC crystal deposition is a widespread phenomenon in human OA articular cartilage. Interestingly, the expression of several genes involved in mineralisation, including human homologue of progressive ankylosis, ectonucleotide pyrophosphatase phosphodiesterase I and tissue non-specific alkaline phosphatase, were upregulated in OA chondrocytes isolated from CaC crystal-containing cartilages.29
Synovial fluid metabolomics by proton (1H) nuclear MR (1H-NMR) spectroscopy was analysed in a study of 59 samples from patients with OA, gout, CPPD, spondyloarthritis, septic arthritis and rheumatoid arthritis.30 Although a distinctive metabolism signature was observed in septic arthritis, metabolites in OA were similar to those in inflammatory arthritis using 1H-NMR.
Last, an elemental bioimaging method with laser ablation inductively coupled plasma mass spectrometry (LA ICP-MS) using a focused laser beam to mobilise sample material as droplets or vapour from the sample surface. The material is then transported to the plasma where the material is ionised and carried through to the mass spectrometer, which selectively detects ions at a given mass-to-charge ratio.31 The study obtained cartilage sections from knee or hip arthroplasty and were imaged by LA ICP-MS for the presence of crystal-associated elements. In addition, eight synovial fluid samples, six from patients diagnosed with OA and two from patients diagnosed with rheumatoid arthritis were analysed by the same method. There were corresponding regions of relatively high calcium and phosphorus intensities in the cartilage section and synovial fluids taken from patients with OA, which may be representative of CPPD crystals. This preliminary study gives a good indication of the potential of LA ICP-MS to detect CPPD crystals in cartilage and synovial fluid samples. However, further studies are needed to confirm crystal presence by SEM.31
Discussion
This is the first systematic review, since that of EULAR published in 2011, to examine diagnostic performance of the broad field of established and emerging imaging and crystal analytic measures. We found 26 new studies since 2009 that examined the sensitivity and/or specificity of imaging and crystal analytic diagnostic measures for CPPD. Most studies used comparison to CCA or CR reference standard. Collectively, 78 9 11 15 17–19 of the 12 U/S studies suggest that U/S for CPPD may have higher sensitivity and/or specificity compared with CCA.
U/S also is particularly well established in gout.34 Significantly, a recent systematic review/meta-analysis focused on U/S in CPPD, reviewing studies up to 31 December 2014.32 Our report shows similar findings.32 Specifically, the most frequently reported CPPD pattern was hyperechoic foci within fibrocartilage or tendons but with a large range of sensitivity and specificity depending on the examined site: knees better than wrists, ankles, shoulders and hands (MCPs); hyperechoic spots identified more frequently within fibrocartilage than in hyaline cartilage and tendons.
Three U/S studies from 2015 reported moderate-to-high diagnostic performance of U/S with similar sensitivity of 60–100% and specificity of 80–96.7%17–19 compared with 87.9% and 91.5%32 in the preceding analysis by Gamon and colleagues. However, prior reports of high sensitivity and specificity performance of U/S for CPPD may be due to evaluation of a combination of several patterns and several sites during the same examination. Whether a specific number of joint sites is required for examination, and which joints to examine by U/S when CPPD is suspected, remain to be determined.9 Nevertheless, compared with CCA and CR, U/S results had better specificity and sensitivity for CPPD.8 17 19
Up to this point, there were no studies comparing U/S and Raman or FTIR spectroscopy, and most of the U/S studies used CCA or CR as gold standard for diagnosis of CPPD. Additionally, concurrence of basic calcium phosphate (BCP) and CPPD crystals, and degenerative joint disease has been well established.31 BCP deposits can also appear as hyperechoic spots on U/S particularly in tendons, whereas CPPD deposits may be misinterpreted as BCP aggregates because of limitations of the other imaging techniques (ie, X-rays and MRI).10
A striking observation of our systematic review was that, compared with over 3534 published DECT studies in gout, DECT has only been marginally explored for CPPD. Misra et al21 reported that intra-articular calcification in CPPD was seen broadly, including in meniscal fibrocartilage (the single most common site involved), hyaline cartilage, cruciate ligaments, medial collateral ligament and joint capsule. DECT enables detection of CaC crystals in deeper intra-articular structures. DECT for CPPD appears highly specific, and informative on crystal distribution in various joint tissues, but it is not yet clear whether DECT is superior to CT to detect CaC crystal deposition in the joint. More studies of DECT in CPPD are needed.
In contrast to previously reported work, Abhishek et al7 observed that chondrocalcinosis (CC) was frequently detected in the wrist (44.4%), hip (45.9%), symphysis pubis (45.5%) and MCP joint (31.3%) in the absence of knee CC. Further imaging studies are needed to replicate the findings about signal characteristics of CC using imaging modalities other than CR.
There has only been one study, to date, on 4 T MRI in CPPD. Specifically, a report of three patients with CC (one woman and two men, age range 54–68 years), and retrospective review of the imaging results of the knees with high-field MRI (4 T MRI), high-resolution three-dimensional CT, conventional radiography and arthroscopy, revealed that high-field MRI demonstrated a greater number of involved articular surfaces and meniscal bodies than CT, radiography and arthroscopy.35 Given that the case series represents a small sample size, and pathological correlation was not available for this study, definitive conclusions regarding sensitivity, specificity, accuracy and direct comparison of the techniques could not be made.35
Methods employed by studies analysed here were satisfactory overall. However, some studies15 24 27 used a case–control design. Such designs may exaggerate the diagnostic properties (sensitivity and specificity). Also, the majority of the studies used cross-sectional designs in which patients for whom the clinical question ‘Does this patient have CPPD?’ are referred for participation.
Last, there was great variability in the study protocols used. Standardisation of the methodology used for both U/S, DECT, and Raman spectroscopy are needed. At present, it remains unclear which joints and other sites are optimal for U/S or DECT imaging, and also which scanner settings are most appropriate to achieve optimal sensitivity and specificity for CPPD deposition.
Certain limitations of our analyses should be acknowledged: first the number of studies of U/S, DECT, Raman spectroscopy for CPPD is limited, particularly as compared with U/S in rheumatoid arthritis (RA) or DECT in gout. Second, the number of patients in the selected studies was often low, and comparators used had wide differences (ie, inflammatory arthritis, OA, asymptomatic). To evaluate this limitation, we used the QUADAS-2 tool. Overall, the quality of the studies was satisfactory with most QUADAS-2 grading in the low-risk range. The QUADAS-2 grading strongly supported applicability of U/S, DECT and Raman spectroscopy, but there was moderate study bias risk overall; specifically ∼30% studies lacked proper knowledge of the results of the reference standard; and ∼25% studies without proper patient selection due to non-controlled study designs, and non-randomised participant selection (figure 2).
A larger limitation in recent literature is that there has been little discussion and analysis of cost and resource issues for crystal arthropathy diagnostics. In this context, the applicability and efficiency of CPLM, and most other analytic methods for CPPD crystals remain burdened by cost issues of ‘point of care’ access to CPLM equipment. Diagnostic approaches to crystal arthropathies include emerging ‘point of care’ methodologies, exemplified by adaptation of Raman spectroscopy.28 As the field moves forward, we anticipate seeing similar adaptation of other, highly specific crystal analytic methods, such as FTIR spectroscopy.29 However, cost-effectiveness relative to CPLM is not assured. One potential approach to the cost issue may be via lens-free polarised microscopy, with wide-field holographic imaging of birefringent objects, as recently tested, with success, for identification of urate crystals from a tophus.36 This approach employs sensing and imaging methodology that can potentially be broadly adapted to use in conventional mobile electronic devices.36 However, it has not yet clear whether it will be reliable for synovial fluid samples or for identification of CPPD crystals, which can include both non-birefringent and highly polymorphic particulates.
In summary, systematic review of CPPD diagnostic studies since EULAR 20114 indicated that U/S is a highly sensitive and specific tool for the diagnosis of CPPD deposition. However, we identified major unmet needs, including for randomised, blinded, controlled studies of CPPD diagnostic performance and rigorous analyses of DECT, 4 T MRI and other emerging modalities, such as Raman spectroscopy.
Footnotes
Contributors: RT is the corresponding author who conceived, and designed the study. In addition, RT supervised in assembling the manuscript, and critical revision of the manuscript for important intellectual content. YW is the first author who performed acquisition of data, literature search, analysis and interpretation of data. Furthermore, YW has drafted the manuscript, designed the tables/figures and conducted the statistical analysis by QUADAS-2 methodology tool. KC is the second author who contributed intellectually to the design and interpretation of the work, reviewed the paper, and participated in data gathering by being the deciding voter for discrepancies when there were differences in QUADAS-2 scores between RT and YW. All authors contributed to refinement of the study protocol and approved the final manuscript.
Competing interests: None declared.
Provenance and peer review: Not commissioned; externally peer reviewed.
Data sharing statement: No additional data are available.
References
- 1.Terkeltaub R. Calcium crystal disease. Calcium pyrophosphate dihydrate and basic calcium phosphate: Epidemiology. In: Firestein GS, Budd RC, Gabriel SE, McInnes IB, O'Dell JR, eds Kelley's textbook of rheumatology. 9th edn Philadelphia: Elsevier Saunders, 2012;1576–7. [Google Scholar]
- 2.Abhishek A, Doherty M. Pathophysiology of articular chondrocalcinosis—role of ANKH. Nat Rev Rheumatol 2011;7:96–104. 10.1038/nrrheum.2010.182 [DOI] [PubMed] [Google Scholar]
- 3.McCarty DJ. Calcium pyrophosphate dihydrate crystal deposition disease: nomenclature and diagnostic criteria. Ann Intern Med 1977;87:241–2. 10.7326/0003-4819-87-2-240 [DOI] [PubMed] [Google Scholar]
- 4.Zhang W, Doherty M, Bardin T et al. European League Against Rheumatism recommendations for calcium pyrophosphate deposition. Part I: terminology and diagnosis. Ann Rheum Dis 2011;70:563–70. 10.1136/ard.2010.139105 [DOI] [PubMed] [Google Scholar]
- 5.Whiting PF, Rutjes AWS, Westwood ME et al. QUADAS-2: a revised tool for the quality assessment of diagnostic accuracy studies. Ann Intern Med 2011;155:529–36. 10.7326/0003-4819-155-8-201110180-00009 [DOI] [PubMed] [Google Scholar]
- 6.Abhishek A, Doherty S, Maciewicz R et al. Evidence of a systemic predisposition to chondrocalcinosis and association between chondrocalcinosis and osteoarthritis at distant joints: a cross-sectional study. Arthritis Care Res (Hoboken) 2013;65:1052–8. 10.1002/acr.21952 [DOI] [PubMed] [Google Scholar]
- 7.Abhishek A, Doherty S, Maciewicz R et al. Chondrocalcinosis is common in the absence of knee involvement. Arthritis Res Ther 2012;14:R205 10.1186/ar4043 [DOI] [PMC free article] [PubMed] [Google Scholar]
- 8.Barskova VG, Kudaeva FM, Bozhieva LA et al. Comparison of three imaging techniques in diagnosis of chondrocalcinosis of the knees in calcium pyrophosphate deposition disease. Rheumatology (Oxford) 2013;52:1090–4. 10.1093/rheumatology/kes433 [DOI] [PubMed] [Google Scholar]
- 9.Filippou G, Filippucci E, Tardella M et al. Extent and distribution of CPP deposits in patients affected by calcium pyrophosphate dihydrate deposition disease: an ultrasonographic study. Ann Rheum Dis 2013;72:1836–9. 10.1136/annrheumdis-2012-202748 [DOI] [PubMed] [Google Scholar]
- 10.Filippucci E, Delle Sedie A, Riente L et al. Ultrasound imaging for the rheumatologist. XLVII. Ultrasound of the shoulder in patients with gout and calcium pyrophosphate deposition disease. Clin Exp Rheumatol 2013;31:659–64. [PubMed] [Google Scholar]
- 11.Filippucci E, Riveros MG, Georgescu D et al. Hyaline cartilage involvement in patients with gout and calcium pyrophosphate deposition disease. An ultrasound study. Osteoarthritis Cartilage 2009;17:178–81. 10.1016/j.joca.2008.06.003 [DOI] [PubMed] [Google Scholar]
- 12.Filippucci E, Scirè CA, Delle Sedie A et al. Ultrasound imaging for the rheumatologist. XXV. Sonographic assessment of the knee in patients with gout and calcium pyrophosphate deposition disease. Clin Exp Rheumatol 2010;28:2–5. [PubMed] [Google Scholar]
- 13.Gutierrez M, Di Geso L, Filippucci E et al. Calcium pyrophosphate crystals detected by ultrasound in patients without radiographic evidence of cartilage calcifications. J Rheumatol 2010;37:2602–3. 10.3899/jrheum.100653 [DOI] [PubMed] [Google Scholar]
- 14.Lamers-Karnebeek FB, Van Riel PL, Jansen TL. Additive value for ultrasonographic signal in a screening algorithm for patients presenting with acute mono-/oligoarthritis in whom gout is suspected. Clin Rheumatol 2014;33:555–9. 10.1007/s10067-014-2505-6 [DOI] [PubMed] [Google Scholar]
- 15.Löffler C, Sattler H, Peters L et al. Distinguishing gouty arthritis from calcium pyrophosphate disease and other arthritides. J Rheumatol 2015;42:513–20. 10.3899/jrheum.140634 [DOI] [PubMed] [Google Scholar]
- 16.Russell E, Checa A. Potential pitfalls in the diagnosis of crystal-induced arthritis and in the sonographic measurement of hyaline cartilage due to the presence of joint effusion. J Clin Rheumatol 2013;19:98–100. 10.1097/RHU.0b013e31828635c5 [DOI] [PubMed] [Google Scholar]
- 17.Ruta S, Catay E, Marin J et al. Knee effusion: ultrasound as a useful tool for the detection of calcium pyrophosphate crystals. Clin Rheumatol 2016;35:1087–91. 10.1007/s10067-015-3100-1 [DOI] [PubMed] [Google Scholar]
- 18.Zufferey P, Valcov R, Fabreguet I et al. A prospective evaluation of ultrasound as a diagnostic tool in acute microcrystalline arthritis. Arthriits Res Ther 2015;17:188 10.1186/s13075-015-0701-7 [DOI] [PMC free article] [PubMed] [Google Scholar]
- 19.Ottaviani S, Juge PA, Aubrun A et al. Sensitivity and reproducibility of ultrasonography in calcium pyrophosphate crystal deposition in knee cartilage: a cross-sectional study. J Rheumatol 2015;42:1511–13. 10.3899/jrheum.141067 [DOI] [PubMed] [Google Scholar]
- 20.Kobayashi T, Miyakoshi N, Konno N et al. Acute neck pain caused by arthritis of the lateral atlantoaxial joint. Spine J 2014;14:1909–13. 10.1016/j.spinee.2013.10.054 [DOI] [PubMed] [Google Scholar]
- 21.Misra D, Guermazi A, Sieren JP et al. CT imaging for evaluation of calcium crystal deposition in the knee: initial experience from the Multicenter Osteoarthritis (MOST) study. Osteoarthritis Cartilage 2015;23:244–8. 10.1016/j.joca.2014.10.009 [DOI] [PMC free article] [PubMed] [Google Scholar]
- 22.Pollet S, Coiffier G, Albert JD et al. Concordance between fresh joint fluid analysis by the rheumatologist and joint fluid analysis at the laboratory: prospective single-center study of 180 samples. Joint Bone Spine 2015;82:161–5. 10.1016/j.jbspin.2014.11.005 [DOI] [PubMed] [Google Scholar]
- 23.Robier C, Quehenberger F, Neubauer M et al. The cytospin technique improves the detection of calcium pyrophosphate crystal in synovial fluid samples with a low leukocyte count. Rheumatol Int 2014;34:773–6. 10.1007/s00296-013-2689-0 [DOI] [PubMed] [Google Scholar]
- 24.Tausche AK, Gehrisch S, Panzner I et al. A 3-day delay in synovial fluid crystal identification did not hinder the reliable detection of monosodium urate and calcium pyrophosphate crystals. J Clin Rheumatol 2013;19:241–5. 10.1097/RHU.0b013e31829cde53 [DOI] [PubMed] [Google Scholar]
- 25.Cheng X, Haggins DG, York RH et al. Analysis of crystals leading to joint arthropathies by Raman spectroscopy: comparison with compensated polarized imaging. Appl Spectrosc 2009;63:381–6. 10.1366/000370209787944280 [DOI] [PubMed] [Google Scholar]
- 26.Li B, Yang S, Akkus O. A customized Raman system for point-of-care detection of arthropathic crystals in the synovial fluid. Analyst 2014;139:823–30. 10.1039/c3an02062b [DOI] [PMC free article] [PubMed] [Google Scholar]
- 27.Fuerst M, Lammers L, Schäfer F et al. Investigation of calcium crystals in OA knees. Rheumatol Int 2010;30:623–31. 10.1007/s00296-009-1032-2 [DOI] [PubMed] [Google Scholar]
- 28.Li B, Singer NG, Yeni YN et al. A point-of-care Raman spectroscopy-based device for the diagnosis of gout and pseudogout: comparison with the clinical standard microscopy. Rheumatol Int 2016;68:1751–7. 10.1002/art.39638 [DOI] [PMC free article] [PubMed] [Google Scholar]
- 29.Nguyen C, Bazin D, Daudon M et al. Revisiting spatial distribution and biochemical composition of calcium-containing crystals in human osteoarthritic articular cartilage. Arthritis Res Ther 2013;15:R103 10.1186/ar4283 [DOI] [PMC free article] [PubMed] [Google Scholar]
- 30.Hügle T, Kovacs H, Heijnen IA et al. Synovial fluid metabolomics in different forms of arthritis assessed by nuclear magnetic resonance spectroscopy. Clin Exp Rheumatol 2012;30:240–5. [PubMed] [Google Scholar]
- 31.Austin C, Hare D, Rozelle AL et al. Elemental bio-imaging of calcium phosphate crystal deposits in knee samples from arthritic patients. Metallomics 2009;1:142–7. 10.1039/b901310p [DOI] [PMC free article] [PubMed] [Google Scholar]
- 32.Gamon E, Combe B, Barnetche T et al. Diagnostic value of ultrasound in calcium pyrophosphate deposition disease: a systematic review and meta-analysis. RMD Open 2015;1:e000118 10.1136/rmdopen-2015-000118 [DOI] [PMC free article] [PubMed] [Google Scholar]
- 33.Ivorra J, Rosas J, Pascual E. Most calcium pyrophosphate crystals appear as non-birefringent. Ann Rheum Dis 1999;58:582–4. 10.1136/ard.58.9.582 [DOI] [PMC free article] [PubMed] [Google Scholar]
- 34.Ogdie A, Taylor WJ, Weatherall M et al. Imaging modalities for the classification of gout: systematic literature review and meta-analysis. Ann Rheum Dis 2015;74:1868–74. 10.1136/annrheumdis-2014-205431 [DOI] [PMC free article] [PubMed] [Google Scholar]
- 35.Suan JC, Chhem RK, Gati JS et al. 4 T MRI of chondrocalcinosis in combination with three-dimensional CT, radiography, and arthroscopy: a report of three cases. Skeletal Radiol 2005;34:714–21. 10.1007/s00256-005-0930-y [DOI] [PubMed] [Google Scholar]
- 36.Zhang Y, Lee SY, Zhang Y et al. Wide-field imaging of birefringent synovial fluid crystals using lens-free polarized microscopy for gout diagnosis. Sci Rep 2016;6:28793 10.1038/srep28793 [DOI] [PMC free article] [PubMed] [Google Scholar]