Abstract
Background
High Frequency Oscillations (HFOs) are considered to be highly representative of brain tissues capable of producing epileptic seizures. The visual review of HFOs on intracerebral electroencephalography is time-consuming and tedious, and it can be improved by time-frequency (TF) analysis. The main issue is that the signal is dominated by lower frequencies that mask the HFOs. Our aim was to flatten (i.e. whiten) the frequency spectrum to enhance the fast oscillations while preserving an optimal Signal to Noise Ratio (SNR).
Method
We investigated 8 methods of data whitening based on either prewhitening or TF normalization in order to improve the detectability of HFOs. We detected all local maxima of the TF image above a range of thresholds in the HFO band.
Results
We obtained the Precision and Recall curves at different SNR and for different HFO types and illustrate the added value of whitening both in the time-frequency plane and in time domain.
Conclusion
The normalization strategies based on a baseline and on our proposed method (the “H0 z-score”) are more precise than the others.
Significance
The H0 z-score provides an optimal framework for representing and detecting HFOs, independent of a baseline and a priori frequency bands.
Index Terms: high-frequency oscillation, epilepsy, wavelet transform, whitening, stereoelectroencephalography
I. Introduction
Stereoelectroencephalographic (SEEG) recordings using clinical intracranial macroelectrodes are considered as a standard for identifying the epileptogenic zone (EZ), the part of the brain which has to be surgically removed for the patient to be seizure free. Brain activities of patients are recorded during one or two weeks, and the brain regions are then ranked according to their epileptogenicity, i.e. to the level of involvement in the initiation of epileptic discharges.
One of the most challenging aspects of these examinations is that the electrophysiological criteria are not clearly defined. A recently proposed marker consists in High-Frequency Oscillations (HFO, 80–500Hz) which have been shown to be an indicator of epileptogenicity [1]–[3]. HFOs can be divided into 3 bands: High-Gamma (HG, 80 – 150 Hz), Ripple (R, 150 – 250 Hz), and Fast-Ripple (FR, 250 – 500 Hz) bands. There is however neither formal consensus nor a tool that enable clinicians to detect and identify these events objectively. The visual review of HFOs is time-consuming, tedious, and hardly reproducible because of the short duration (about a hundred milliseconds or less) and because the frequency (f) spectrum is dominated by low frequencies (1/fα spectrum). No automated detectors [4]–[7] have yet met a large consensus. Among possible strategies, time frequency (TF) analysis is an important tool for characterizing HFOs. In particular, it permits us to separate transients from actual oscillations, which have distinct signatures in the TF plan; however, the 1/fα spectrum impacts the TF maps. One obstacle that still remains is how to normalize the amplitudes across frequencies in order to capture equally well the activities in all the bands.
The purpose of this study is thus to propose a tool to objectively visualize and identify HFOs based on TF normalization or prewhitening. The underlying concept is to flatten, i.e. “whiten”, the spectrum in order to have a balance of power across frequencies. This flattening could however increase the noise and generate false detections. We therefore investigated and compared methods on different criteria and ranked them using the Area Under the Curve (AUC) of Precision and Recall (PR) curves. We applied these methods to simulated data with real human background (BKG) activity.
II. Methods
A. Continuous Wavelet Transform
The Continuous Wavelet Transform (CWT) of a signal f is defined as
| (1) |
with ψ the wavelet function, a the scaling factor, and b the shifting factor. We chose to normalize the wavelet in L2,
| (2) |
in order for the estimate of the power spectrum – the wavelet spectral function [8] – to correspond to
| (3) |
with B the duration of the time window, which needs to be large enough for standard ergodic arguments. In other words, the wavelet spectral function has to be the average over time of the TF image for each frequency. This is important to assure consistency between the prewhitening methods (that operate in the time domain) and the TF normalization methods. A normalization of the wavelet in L1 would lower even more the power of the low frequencies in the TF image and act as another filtering stage (more details in Appendix A). We therefore used the normalization in L2 defined in (2).
We utilized an analytic Derivative of Gaussian (DoG) wavelet (a specific case of the Morse wavelet) with n = 20. It is expressed in the frequency domain as
| (4) |
We used the analytic DoG wavelet for its good mathematical properties: it is null for negative frequencies and thus provides a better estimate of the phase [9], unlike the classical Morlet wavelet. Such analytic wavelets could provide a better strategy for analyzing HFOs [10]. To compare the different whitening strategies, we computed the TF image in log-scale with 3 octaves (Oct) and 12 voices (Voi) to cover the 68 – 512 Hz band (i.e. the band of interest for HFOs). For the figures, we increased the number of Oct to obtain a broader frequency range (below 68Hz) for a better overview of the data.
B. Whitening Strategies
1) Prewhitening in time-domain
The different prewhitening methods were applied in the time-domain. Let n be the time index.
The Diff method consists in a first-order backward differencing [5]. Let x̃ be the prewhitened signal
| (5) |
The motivation behind the diff method is that it suppresses the continuous component of the signal and lowers the low frequencies. The Discrete-time Fourier transform (DTFT) applied to a differentiated signal x gives
| (6) |
Thus its power spectral density (PSD) is
| (7) |
with X the DTFT of the signal x, ω = 2πf/fs its normalized frequency, f its frequency and fs the sampling frequency. The scalar (1 − cos(2πf/fs)) is monotonically increasing from [0, fs/4] in [0, 1], which indeed lowers the low frequencies compared to the high frequencies. The Diff prewhitening was applied on segments of interest (SOI), i.e. periods of BKG where an event of interest was added.
The autoregressive integrated moving average (ARIMA) [11] prewhitening computes the coefficients of a pth-order AR model (e.g. Matlab’s LPC function) on the dth-degree differentiated signal and filters the signal with the coefficient of the AR model. This method aims at finding the trend of the spectrum to flatten it afterward. Let ai (with i ∈ {1, 2, …, n}) be the ith coefficient of a pth-order AR model computed on x. The DTFT of a signal x prewhitened with the AR prewhitening gives
| (8) |
where “*” corresponds to the convolution. In other words, the AR prewhitening subtracts the autoregressive part of the spectrum from the spectrum. The ARIMA prewhitening is similar but the AR coefficients are computed on the dth-degree differentiated signal, yielding
| (9) |
It is noteworthy that the ARIMA(0,1,0) prewhitening is equivalent to the Diff method (6). As discussed in [11](Section 14.6), the differencing allows us to effectively manage the drifts and trends in the data that would otherwise overwhelm the frequencies. The fact that the last parameter is null means that there is no moving average (MA). We use ARIMA with the MA set to zero, because we want the “pre-emphasis” filter to be strictly FIR and not “smear” a transient too far in the data, which would happen if we allowed an MA component in the ARIMA. Several parameters were tested, and the set (15,1,0) gave the best results. The ARIMA filter was applied on SOI and not on baselines. Increasing the order of the AR model would lead to over-fitting the spectrum and thus prewhiten also the signal of interest.
2) Time-Frequency Normalization
Normalization methods were applied to the TF image of the original signal. Let n and m be the time and frequency indices.
The Teager-Kaiser Operator Energy (TKEO) is mostly used to identify the instantaneous frequency and the amplitude of non-stationary signals [12], [13]. The TKEO applied to a continuous signal x(t) = A sin (Ωt + ϕ0) corresponds to
| (10) |
where “˙” and “¨” describe the first and the second derivative respectively. The energy obtained depends on the amplitude and frequency of the wave. Its equivalence in discrete time is:
| (11) |
Note that the TKEO cannot be used as a prewhitening method, since its output is already an energy. Indeed TKEO normalization (used in [14]) operates on the complex coefficients of the TF image of the SOI over time and for each frequency taken separately,
| (12) |
where “⨪” denotes the complex conjugate.
The event-related spectral perturbation (ERSP) is a common way to normalize the TF maps in electrophysiological reviewing [15]. This method computes the mean μ[m] of the square modulus of the TF coefficients |Tf [n, m]|2 of a chosen baseline over time and for each frequency taken separately, and we apply this transformation
| (13) |
The baseline was taken in the same BKG but in a time-shifted window.
The z-score, another commonly used method, was applied to |Tf [n, m]|2 using the mean μtype[m] and the STD σtype[m] with type corresponding to either a baseline or the SOI itself, for each frequency taken separately. The baseline was selected the same way as for the ERSP. The two types of z-score will be further referred to as Zbaseline and ZSOI, and the TF transformation is
| (14) |
In fact, μ[m] is equivalent to the wavelet spectral function VB defined in (3). ERSP and the Zbaseline whiten the data by either dividing the |Tf [n, m]|2 coefficients by VB or subtracting VB from the coefficients, which would result in a flat spectrum in presence of BKG activity only. However, the results of Zbaseline and ERSP depend on the quality of the chosen baseline and its level of similarity with the BKG activity in the window of interest. For evoked potential, the baseline is usually taken in the window preceding the stimulus. It is to be noted that this does not guarantee that the BKG activity is similar before and after stimulus [16]. In HFO studies, finding a baseline for each channel can be difficult. This could be solved by the ZSOI that uses the event time window as a reference, but this implies that the events occur rarely within the window. This is however a strong hypothesis which is usually not verified. We therefore propose a new method – “H0 z-score” (ZH0) – which is built to be more robust to the SNR across frequency and does not require a baseline.
The first step of this method is to estimate the noise distribution in the complex plane at each scale. We thus made two hypotheses: 1) the global distribution HG per scale is made of a zero-mean Gaussian distributed noise H0 and our signal of interest H1; and 2) there is no correlation between the real and imaginary part in the center of the complex plan (the noise). This enables us to fit a Normal distribution on the center of the distribution of the real and imaginary part of the coefficients separately and calculate their mean and STD. Then the real and imaginary part are z-scored and the square modulus is taken to generate the TF image. The pseudo-code summarizing this technique is given below:
| 1: | for a = 1st scale to last scale do |
| 2: | |
| 3: | |
| 4: | calculate the first (Q1) and third (Q3) quartile and the interquartile range (IQR) of and |
| 5: | |
| 6: | |
| 7: | |
| 8: | |
| 9: | |
| 10: | end for |
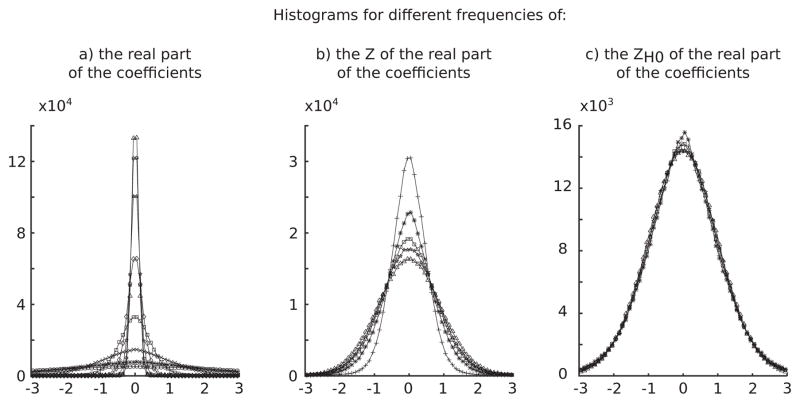
One characteristic of the ZH0 is that it whitens the TF by forcing the real and imaginary part of the coefficients to have broadly the same distribution across frequencies (Fig. 1).
Fig. 1.
Distributions of the real part of the TF coefficients at different scales for different normalizations. a) shows distributions without normalization where large differences in width can be observed across frequencies. b) represents the distributions z-scored with μ and σ estimated on the whole distribution. The variability is reduced but there is still a difference in width. c) displays the distributions normalized with ZH0. In that case distributions are similar across frequencies. The same behavior is observed with the imaginary part (data not shown).
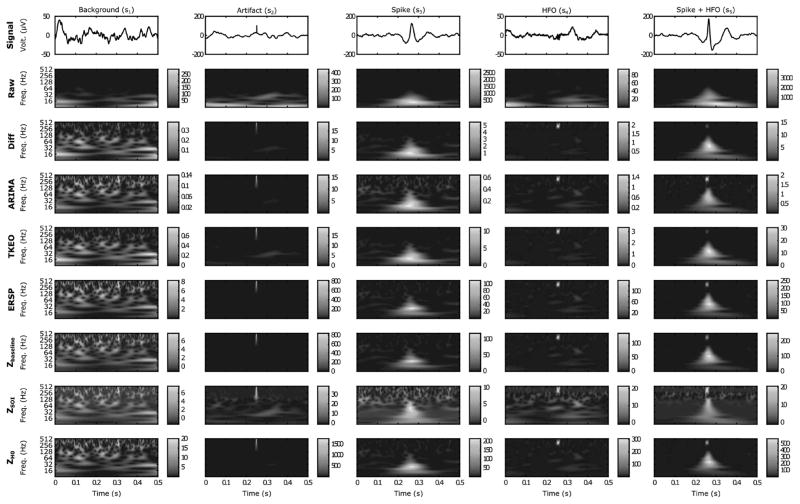
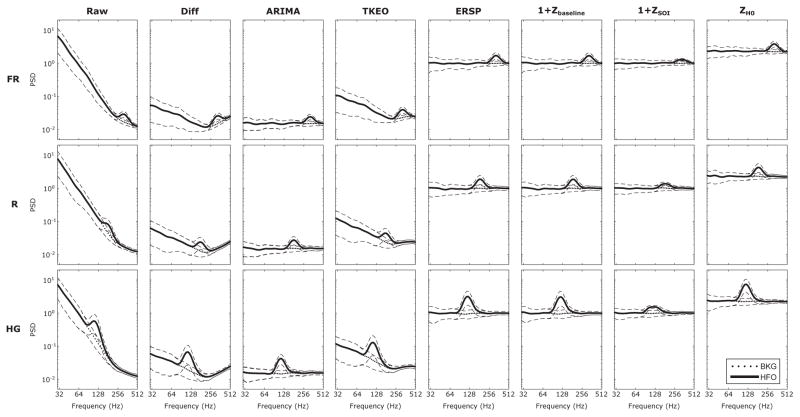
The methods are illustrated in Fig. 2; their effect on the power spectrum is represented in Fig. 3.
Fig. 2.
Examples of the 5 types of simulated events in time and time-frequency domains. The events are represented in a 500 ms-windows. The columns correspond to an event type, the first line shows the time-series, and the other lines illustrate the result of each method in the TF map. The HFOs were generated with an SNR of 10 dB. Each colormap was normalized between the minimum and maximum value of the image. As expected, the HFOs are not visible in the raw TF representation but appear in the whitened signal. Note how the ZSOI alters the images, especially the spike and the HFO.
Fig. 3.
The effect of the several methods on the spectrum are shown. 100 simulations of BKG with HFOs (SNR = 10 dB) were generated. The average estimate power spectrum VB of the BKG with HFO and the BKG are represented with solid and dotted line respectively. The dashed line corresponds to the standard deviation. The first column shows the spectrum of the non-whitened signal (Raw) and the other columns correspond to the different methods. The lines define the three simulated HFO types(FR: 323 Hz, R: 181 Hz, HG: 114 Hz). For the representation, an offset of 1 was added to the Zbaseline and ZSOI to have positive values. The raw spectrum has a “hockey-stick like” spectrum, meaning it follows two power laws 1/fαi, with α1 ≈ 3 and α2 ≈ 1 for the frequency range of 10 – 200 Hz and 250 – 500 Hz. The HFOs clearly stand out of the BKG around their respective frequency. All the whitening methods manage to flatten the spectrum but the Diff and TKEO do not succeed in removing the “hockey-stick like” spectrum and thus enhance the BKG high frequency.
Visualizing the signal in the time-domain is very important for clinicians, because they are more used to this type of representation than the TF map. One could argue that the normalization techniques do not permit to visualize the whitened signal in time, whereas the prewhitening methods do. In fact it is not the case for ZH0, thanks to the properties of the analytic DoG wavelet. Given that f(.) is a real-valued signal and the wavelet ψ is analytic, a reconstruction formula [17] is proportional to
| (15) |
with ℜ the real part of the complex number. Since , this could be simplified by using the linear analysis-reconstruction scheme [8] into
| (16) |
We thus define the ZH0 whitened signal as
| (17) |
At the computational level, since we choose a log-scale representation and neglect the multiplicative factor, the whitened signal can be computed as
| (18) |
One should be aware that if the number of Oct is not high enough, the reconstructed signal will correspond to the original signal being band-pass filtered. Indeed the lower frequency captured by the TF decreases when the number of Oct increases. Moreover, the accuracy of the reconstruction increases with the number of voices per octave [17].
C. Simulated Data
In order to compare the different methods, we simulated five types of signals. Each segment measures 5 s and is composed of human BKG activity and a type of events. The different types are the following: BKG activity alone (s1), BKG activity with an artifact (s2), BKG activity with a simulated epileptic spike (s3), BKG activity with a simulated HFO (s4), and finally BKG activity with a simulated spike and simulated FR (s5). The spike, the HFO and the artifact occur at 2.35 s, 2.5 s and 3.75 s respectively. Spikes and artifacts were chosen because they lead to false detection in common marking methods. Epileptic spikes were simulated using the spline function of MATLAB, which interpolates the curves between specific points taken from a real epileptic spike. The width of the spike randomly changed across trials. Its amplitude was set to be proportional to the standard deviation (STD) of the BKG. Three types of HFOs were produced, one for each HFO band with frequencies of 323 Hz, 181 Hz, and 114 Hz and a duration of six periods. To avoid edge effects, the spike and the FR were windowed beforehand and then added to the BKG. The artifact was simply generated by increasing a single point by a certain level (impulse function). This level corresponds to five times the STD of the chosen BKG. Examples of the five events are shown in Fig. 2. The piece of human BKG activity was randomly selected from a collection of recordings (sampling frequency: 2048 Hz) which was previously labeled as BKG, i.e signal without one of these events, from several patients and several brain areas. These recordings were performed on patients undergoing pre-surgical evaluation of drug resistant epilepsy with SEEG during slow wave sleep where HFOs are usually studied [18]. For standardization, the collection of BKGs were normalized by dividing each signal by its own standard deviation and multiplied by the median STD of the real data collection. Unlike previous studies [6], [19], the STDs were not computed on raw data but on data which were digitally bandpass-filtered (4th-order Butterworth) in the HFO band. The SNR was also calculated on the filtered data on the time duration of the HFO. This approach is motivated by the fact that SEEG signals are dominated by the low frequencies which would have increased the SNR in a non-representative manner.
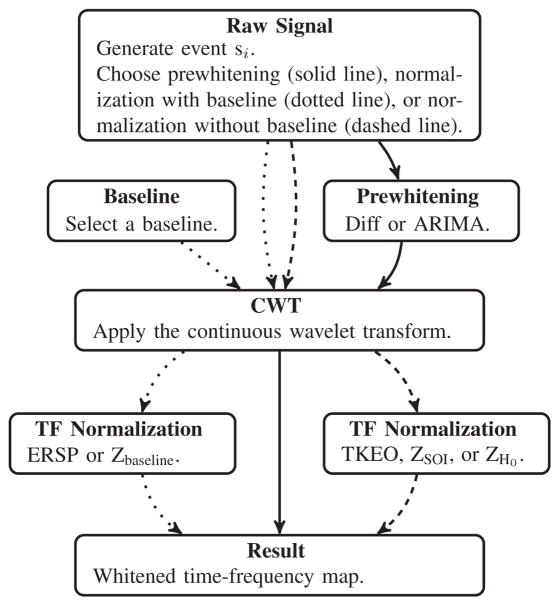
Each si event was processed for each prewhitening or normalization method. However, those which were prewhitened were not normalized in TF and conversely, as described in Fig. 4
Fig. 4.
Schematic representation of the pipeline. The boxes correspond to a stage and the arrows to a path. In the first step, we generate an event si. This event is either processed through the prewhitening pipeline (solid line), the normalization pipeline with baseline (dotted line), or the normalization pipeline without baseline (dashed line). The prewhitening is done in the time-domain before the CWT, and the normalization is done after the CWT. This results in a whitened TF map.
D. Real Data with HFOs
The aforementioned techniques were applied to real HFOs to give an illustration of clinical applications. These real HFOs were marked using an automatic detector [5] and verified visually [20] and were recorded from the same patients as in the simulation part II-C.
E. Method Quantification
To capture how relevant the representations are, we want to quantify how the oscillations are separated from the BKG activity. It is known that oscillations are well localized in TF images. They appear as “islands” or “blobs” [21] whereas spikes and artifacts are extended across frequencies. While analyzing visually such representations, we pay attention to the local maxima rising above the noise level. The method proposed here is to quantify the detectability of HFO by constructing Receiver Operating Characteristic (ROC) and Precision-Recall (PR) curves. To compute these curves, all local maxima in the HFO band are detected and labeled as True Positive (TP), False Positive (FP), True Negative (TN) and False Negative (FN) for each value of the threshold. This threshold takes increasing values ranging from the minimum to the maximum values across all TF images for each method and each HFO type independently. For the three types of simulated HFOs, 30 events of each type were generated.
TPs are local maxima which are above the threshold and are our peaks of interest, i.e local maxima of all signals s4 and s5 which are above the threshold and are in the confidence zone. The confidence zone was set as the zone of the image where the blob of the HFO should theoretically appear. It is a rectangular zone centered on the simulated HFO and at the frequency of the oscillation with a time width of 2σt and a frequency width of 2σf, where σt corresponds to the theoretical width of the wavelet at the corresponding frequency. σf was heuristically set to 30 Hz as being the accepted error on the frequency of the oscillation. FPs are local maxima which are above the threshold, but are not our peaks of interest, i.e local maxima of all signals s1, s2, and s3, which are above the threshold, plus those of all s4 and s5 above the threshold, which are not in the confidence zone. TNs are local maxima which are not above the threshold and are not our peaks of interest, i.e local maxima of all signals s1, s2, and s3, which are not above the threshold, plus those of all s4 and s5 under the threshold which are not in the confidence zone. FNs are local maxima which are not above the threshold but are our peaks of interest, i.e local maxima of all s4 and s5, which are not above the threshold but are in the confidence zone.
ROC and PR curves are obtained by calculating the True Positive Rate (TPR) or Recall, the False Positive Rate (FPR) and the Precision or Positive Predictive Value (PPV) as follows
| (19) |
| (20) |
| (21) |
The ROC curve represents TPR as a function of FPR and the PR curve PPV as a function of TPR.
The Area Under the Curve (AUC) of the PR curves was used as a criterion to rank the different whitening strategies. This measure was repeated 30 times for each SNR with random human background activities. The different SNRs were chosen according to the range seen in real data. The STD of the oscillation was obtained by decomposing the signal using the Empirical Mode Decomposition (EMD) [22] and taking the mode corresponding to the HFO band. The obtained signal was checked on TF representation before and after decomposition to ensure the correct EMD filtering. The STD of the noise was computed on two pieces of filtered BKG before and after the HFO occurs with overall length of the oscillation. The SNR of the real data were found to lie between 0 and 17 dB with a median value of 9 dB.
III. Result and Discussion
Fig. 3 represents the average spectrum of the signals s1 and s4 at SNR = 10 dB. In the first column, HFOs are dominated by the low frequencies in the non-whitened signal. This emphasized the importance of signal processing to visualize HFOs correctly. Moreover, the original spectrum has a “hockey-stick” like spectrum and is best fitted by two power laws 1/fαi, with α1 ≈ 3 and α2 ≈ 1 for the frequency range of 10 – 200 Hz and 250 – 500 Hz (the FR band), respectively. All the techniques managed to flatten the spectrum. The Diff and TKEO methods do not succeed in removing the “hockey-stick” like behavior and consequently amplify the high frequencies, whether they are due to FRs or BKG. This could lead to more FPs. Furthermore, the R band appears to be in the “elbow” of the raw spectrum which is turned into the global minimum of the Diff and TKEO spectra. In other words, a R will need a high enough amplitude to overcome the high frequency BKG. Visually, the ARIMA, ERSP and z-score methods exhibit better performance in flattening the spectrum. The average BKG spectrum is flat and the HFOs stand out of the BKG. The peaks of the HFOs on the ZSOI spectral is nevertheless smoother than on the other spectra which is probably due to the aforementioned drawback of this method. Because of the high number of negative events (N) compared to the number of positive (P) events the ROC curves are pushed to the left-hand side corresponding to the low FPR values and are thus not discriminative or even seems wrongly efficient. This imbalance is due to the intrinsic local maxima generated by the BKG activity. In contrast, the PR curves are not sensitive to this imbalance and thus highlight differences between the methods [23], [24]. In a clinical setting, it seems interesting to address the proportion of TP within all detections (PPV (21)) regardless of N, i.e. be more precise (high PPV (21)) than specific (high FPR (20)). PR curves are therefore preferred for further analysis.
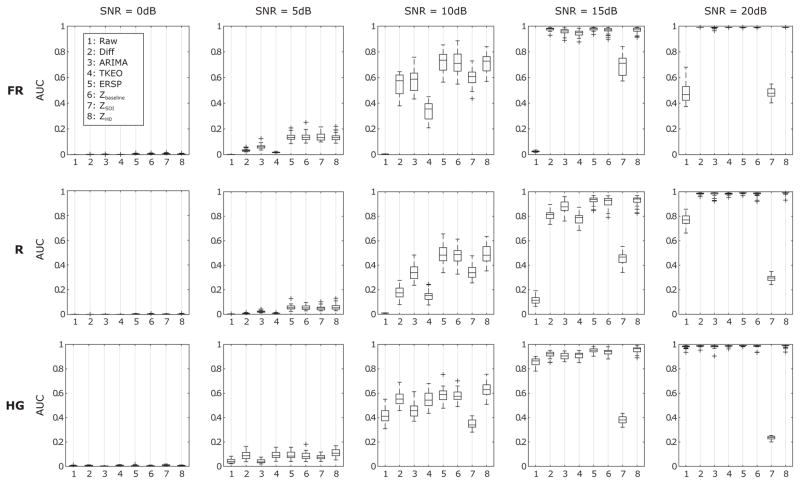
Box and whisker plots of the AUC of the 8 methods applied to the simulated data are represented in Fig. 5 for 5 different SNRs. Raw TF representation which corresponds to the case without normalization nor prewhitening shows the worst performance overall, except for the ideal case with SNR = 20 dB. This is consistent with the aim of this study. Generally all the methods improve with increasing SNR. They exhibit poor performance for SNRs below 5 dB without having one method being significantly better than another one. This is not the case for larger SNRs. The ERSP and z-score methods have better results for SNR = 5 dB for simulated FRs and Rs. As expected, the ZSOI falls behind the other normalization methods for all the frequency bands from SNR = 10 dB and its performances decrease after SNR = 15 dB. The more the signal of interest weights in the distribution, the more the parameters for the z-score are overestimated. The ERSP, Zbaseline and ZH0 perform the best across SNRs and frequency bands. The ARIMA method is the best prewhitening technique, but is still less efficient than the latter. The performance of the ERPS and Zbaseline may not be representative of the results which could be found in clinical settings because of the way the baseline was selected. In our study, the baseline was selected in the same BKG but in a time-shifted window. This means that the characteristics of the baseline were very similar to those of the BKG by construction. ZH0 is thus better in principle since it does not require a baseline. Moreover the normalization and ARIMA methods are very sensitive to the duration of the chosen window. Using windows below 5 s (≈ 10000 samples) would lead to bias in the estimators and deteriorate the performance of the methods.
Fig. 5.
Box and whisker plot of the AUC of PR curves of the original signal and the 8 techniques for several SNRs are displayed. Generally, all methods show better results when the SNR increases except the ZSOI. All methods exhibit poor performances for SNRs below 5dB without having one method being significantly better than another one. In most cases, the ERSP, the Zbaseline and ZH0 methods exhibit the best results. It is noteworthy that ZH0 is the only method which does not require to define a baseline.
IV. Applications
A. Objective identification of HFOs
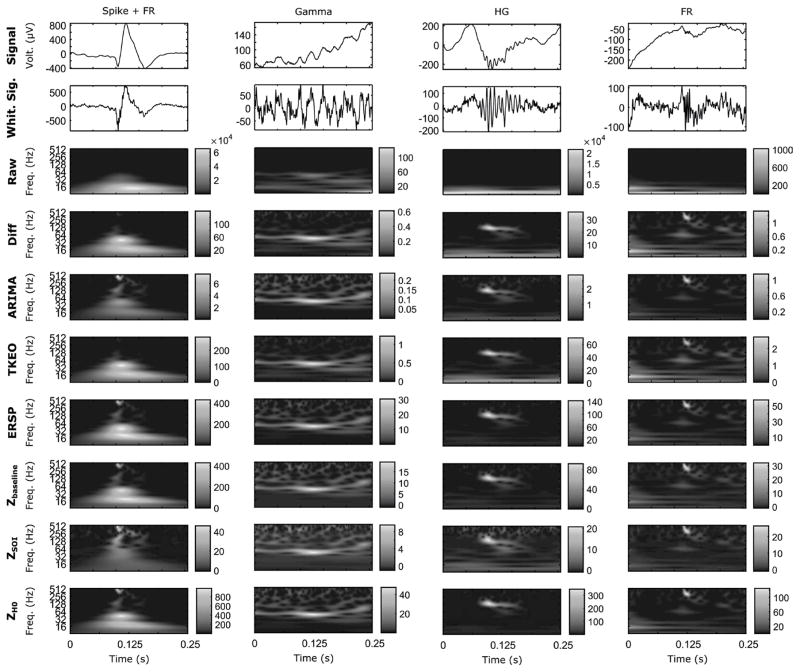
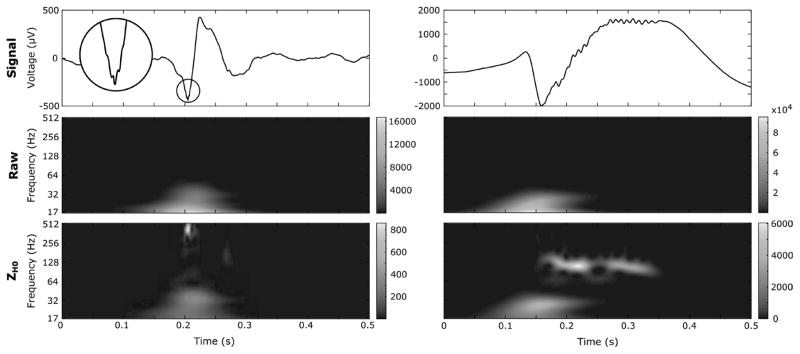
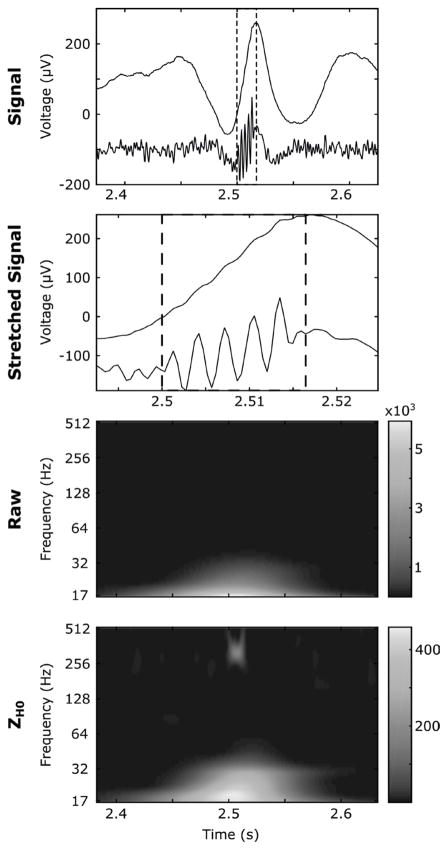
The ZH0 could improve the objective identification of HFOs since it is independent on a baseline and frequency bands and enables the HFOs to be easily spotted without increasing the BKG activity. In Fig. 6 four real events are represented in the TF maps using the aforementioned whitening processes. A spike with a FR, a gamma oscillation, a HG, and a FR are depicted in the first, second, third and fourth column respectively. As discussed above, the ARIMA and ZSOI tend to increase high-frequencies whether they originate from the background or the signal. It is very clear in the first and second column. The spike is dulled and the FR very energetic but the high frequency background is visible above the HG for these two techniques whereas it is not for the others. Moreover, note the distortion of the spike made by the ZSOI. The Diff and TKEO methods seem to work fine when a single event occurs. In Fig. 3 we showed that these methods could not remove the elbow of the spectrum. Indeed in the first column the FR appears very dull compared to the spike for both methods. The baseline based methods (ERSP and Zbaseline) and ZH0 manage to capture all the frequency contents of the examples. However some slight differences can be noticed between the two baseline based methods and the ZH0 .... The HG, FR and Gamma oscillations are visible, and most importantly the FR and the spike are distinguishable even while co-occurring. Fig. 7 illustrates in wider frames other real events which are clearly not visible in the normal TF representation and difficult to capture in the time-domain without stretching the signal but are evident in the ZH0 image. This normalization could especially improve identification of HFOs which are not distinguishable in the time series. There is still a debate on HFOs occurring within spikes. There are some reports of HFOs not visible in spikes [1], but it is possible that part of these could arise from filtering artifacts [21]. Time frequency methods should in principle improve this situation [19], but may be “blinded” by the high energy contained in the spike [25]. Fig. 8 represents a simulated FR which occurs during the build up of the spike (dashed boxes) and is clearly not visible in the original signal, and only slightly distinguishable when we zoom in. The ZH0 in the time or TF domain enables the searchers/clinicians to identify the HFOs without having to stretch or filter the signal to ensure the correctness of such “almost not visible HFO in spike”. One should be aware that even if the oscillation cannot be captured in the time-series, it does not necessarily mean that there is no oscillation. The ZH0 whitened reconstruction enhances greatly the FR without denaturing the epileptic spike. This method is also convenient to study the signal without having to saturate the color map and thus avoid losing the global significance of the signal.
Fig. 6.
Examples of 4 real events in time and time-frequency domains. The events are represented in a 250 ms-windows and are taken from 2 patients. The first to the last column corresponds to a spike with a FR, a gamma oscillation, a HG, and a FR respectively. The first line shows the original time-series, the second line displays the whitened reconstructed signals, and the other lines illustrate the result of each method in the TF map. Each color map was normalized between the minimum and maximum value of the image. As in Fig. 2, the HFOs are not visible in the raw TF representation but appear in the whitened signal and TF.
Fig. 7.
Examples of real FR and HG are illustrated in a wider frame. The FR and HG are represented in the time-domain and in the Raw and ZH0 TF image in the left and right panel respectively. The round inset is a stretched version of the FR. Both HFOs are completely hidden in the Raw TF map but clearly visible in the normalized version.
Fig. 8.
An example of a simulated Fast-Ripple (FR) occurring during a sharp transient. The box with dashed lines delineate the FR. The first line corresponds to the time course of the raw (above) and the ZH0 whitened reconstructed signal (below.) The second line is a stretched version of the first line. The third and fourth lines are the raw and ZH0 TF maps relative to the first line respectively. This HFO is hardly distinguishable in the time and TF domain on the original data. It is however evident in the ZH0 frame and whitened reconstructed signal. Note that the spike is still present in the whitened reconstructed signal.
B. Application beyond SEEG
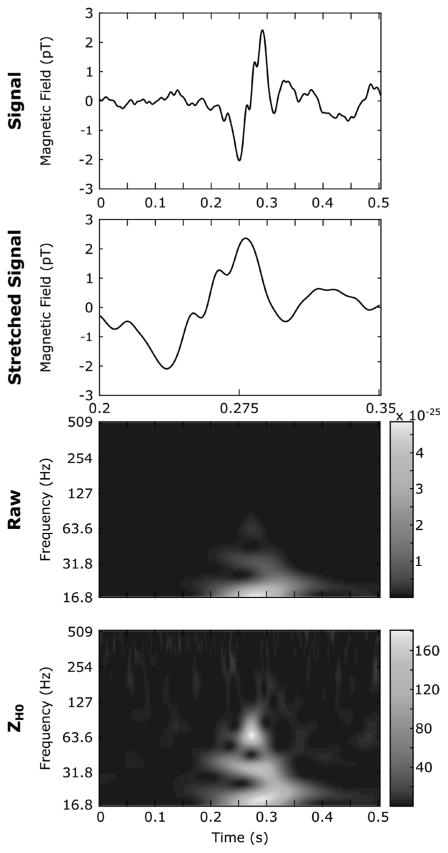
This study mainly focuses on SEEG because HFOs are mainly studied in SEEG recordings. Recently some groups have tried to study HFOs in scalp electroencephalography (EEG) [26], [27] and magnetoencephalography (MEG) [28]. Since the assumptions made by the ZH0 are not relative to SEEG, one could easily apply it to EEG or MEG data since they also have a 1/fα spectrum. A gamma wave (G, 25 – 80 Hz) marked in an MEG recording is shown in Fig. 9. The TF map is whitened as for SEEG data and the gamma is highlighted.
Fig. 9.
An example of a real gamma oscillation (G) from MEG data is illustrated. The G is represented above in the time-domain and in the Raw and ZH0 TF image. The oscillation is enhanced in the ZH0 image.
C. Framework for a new detector
Using our method should speed-up the visual marking of HFOs. Nevertheless, it would still be time-consuming and would need human resources. Interestingly, the method could be integrated in existing detectors such as [7]. These detectors are based on a two- or three-step algorithm. First a threshold is applied on the time-series according to its short-time energy [4] or short-time line length [5], but this step suffers high FP [5]; a second step was thus introduced to decrease this number. The second stage usually uses time-frequency images which could be strengthen by the ZH0. We however think that the signal should already be whitened at the first step because the short-time energy and short-time line length are greatly influenced by the 1/fα spectrum even if they are band-pass filtered between 80 – 500 Hz. In fact, the Diff method was used to prewhiten the signal in [5] to improve detections and decrease the number of missed HFOs (FN), but this method does not exhibit the best performance as we showed above. Moreover, the study was made on band-passed data between 0.1 – 100 Hz because of the low sampling frequency (200 Hz). We believe that FN would even be higher on data recorded with the current sampling frequency (2048 Hz) without whitening processing. Therefore to solve these issues, HFOs could be detected directly in the ZH0 TF map. Such a detector would select all local maxima above a threshold and label these maxima according to the shape of the “blob” into oscillation, spike or other. Using ZH0 normalization would actually have several interesting assets. By construction, the background activity can be modeled by a standard normal distribution (μ = 0 and σ = 1) at each frequency. The local False Discovery Rate (lFDR) [29] is an empirical Bayes approach which is based on the similar hypothesis than the ZH0. In short, this method assumes that the observed data histogram HG is a mixture of H0 (noise) and H1 (signal of interest), and that H0 is in the center of the histogram. It then defines a threshold such as
| (22) |
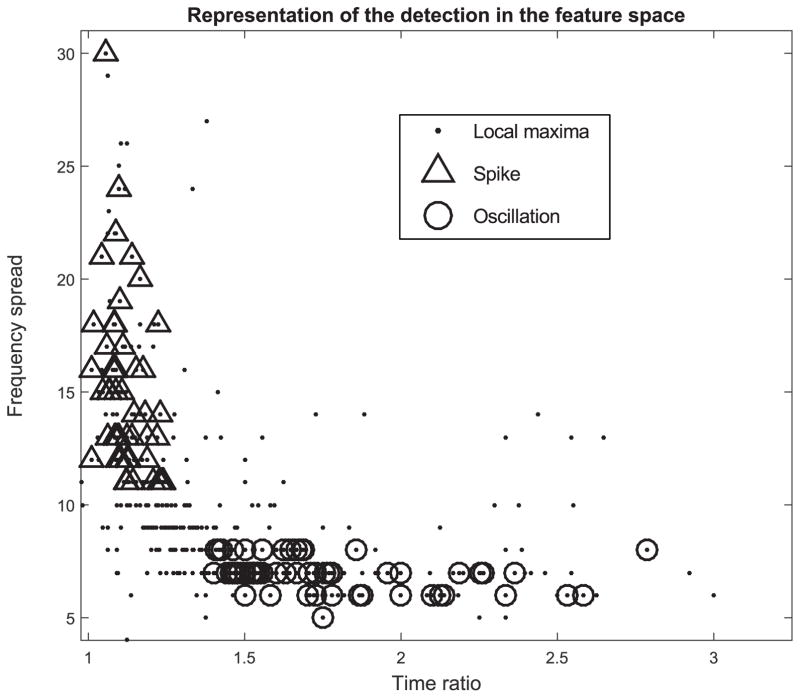
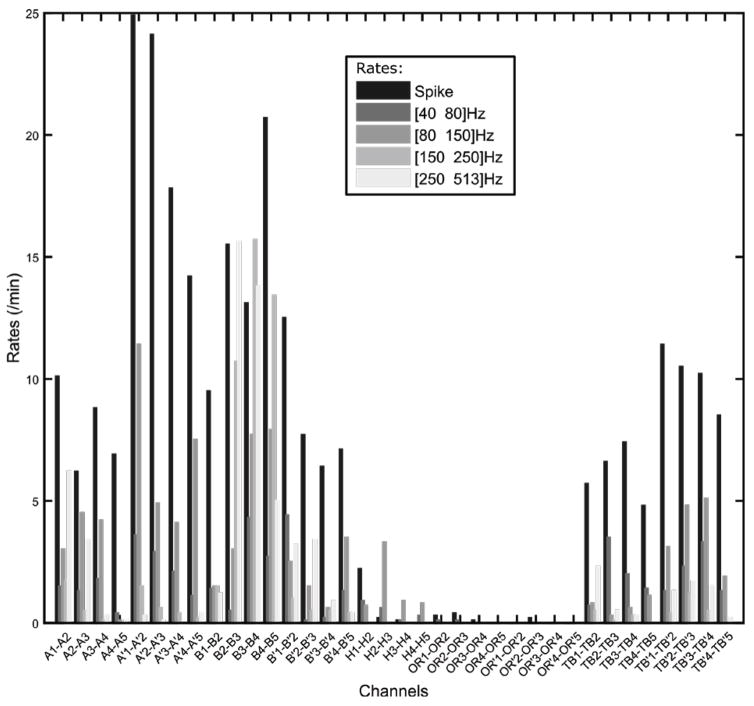
with thr the threshold and Q the accepted level of lFDR. The lFDR would provide one single threshold for all frequencies. Thresholding methods used in previous detectors [4], [7], [30] calculated the mean and the standard deviation of skewed distribution. By combining the lFDR and ZH0 we could guarantee that the detected local maxima are not generated by the background. Another step would be needed to separate the oscillations from the spikes. Fortunately the ZH0 conserves the properties of the wavelet. An interesting property is that the frequency width of the wavelets is constant in log-scale. This implies that the oscillations which correspond to two Dirac distributions in the frequency domain have the same width whatever their frequency. A simple threshold on the frequency width could differentiate oscillations from spikes. The measured frequency width is the Full Width at Half Maximum (FWHM) of the island in the frequency axis. In the literature [1], [2], [4], a threshold on the duration is used to select only oscillations with at least 3–4 periods. To be consistent this threshold should be different at each frequency. An approach could be to compare the time FWHM of the response of a Dirac in the TF map and the time FWHM of the selected island. This would provide a constant threshold across frequencies. It is noteworthy that this detector labels all oscillations without prior frequency bands. An example of the detection in the parameter plane is shown in Fig. 10. The black dots represent all the detected local maxima, the triangles correspond to the local maxima that were labeled as spikes and the circles designate the local maxima labeled as oscillations. Some local maxima in the oscillation or spike area were not labeled because they were too close in time from another local maxima. An illustration of the results of the detection is shown in Fig 11. We implemented a prototype of this detector in our open source software AnyWave [31], as well as a reviewer add-on that enables the user to review and edit the previous detections. We are currently testing them in a clinical setting.
Fig. 10.
Representation of the local maxima in the feature space. The time ratio in the x-axis corresponds to the Full Width at Half Maximum (FWHM) in time of the island relative to the local maxima compared to the width of the impulse response at the same frequency. The frequency spread in the y-axis is calculated in the TF image as the FWHM in frequency of the island relative to the local maxima. The black dots represent all the local maxima above the threshold. The triangles, and the circles are the local maxima that were labeled as spikes and oscillations respectively.
Fig. 11.
Example of the detection rates. The results of the detections are displayed in a bar graph giving the spike rates and the oscillation rates of given frequency ranges. These ranges can be manually set up. The name of the channels correspond to the name of the electrodes in bipolar montage (A: Amygdala, B: Hippocampus, H: Heschl’s Gyrus, OR: Orbitofrontal, TB: Temporo-basal, .’: left hemisphere). The numbers indicate the indices of the contacts in the mesiolateral axis.
V. Conclusion
This paper has examined several whitening methods for HFOs representation in TF maps. We compared 7 commonly used techniques, plus one method which we designed to overcome the drawbacks of other methods. We ranked the methods according to their capability to flatten the spectrum without increasing the BKG activity. This was made by simulated HFOs at different frequencies for several SNRs and localizing all local maxima in the TF image. The AUC of the PR curves was used as a performance criterion. We determined that the best methods were the ERSP, Zbaseline and ZH0. However, as the ERSP, Zbaseline require a baseline, the ZH0 outperforms them by its robustness to non-stationarity of background activities. This technique also permits to reconstruct the whitened signal, which is an obvious advantage for clinical application. We would like to point out that real HFOs could be not visible in time-domain because they are hidden by the slope of a sharp transients, which can be counter intuitive for neurophysiologists. The ZH0 provide an objective tool to identify HFOs since it does not over express high-frequency activity of the background and dissociate sharp transient from HFOs in time and TF domain. We have suggested that this technique could be applied on other types of electrophysiological recording with a power law spectrum. Future work will focus on the effect of the whitening methods in lower frequency bands and will test the detector on a large number of patients from multiple centers.
Acknowledgments
This study was supported by ANR, projet FORCE, ANR-13-TECS-0013.
This study was financed by the ANR-13-TECS-0013. Research by JCM was supported in part by the National Institute of Neurological Disorders and Stroke under grant number R01NS089212 and National Institute of Biomedical Imaging and Bioengineering under grant number R01EB009048, both of the National Institutes of Health. The content is solely the responsibility of the authors and does not necessarily represent the official views of the National Institutes of Health. We would like to thank Bruno Torrésani for his help on the analytic DoG wavelet implementation.
Appendix A
The estimate of the power spectrum VB in L2 corresponds to
| (23) |
In L1 it corresponds to
| (24) |
Note that . The main difference is that is simply the mean over time of the scalogram for the scale a, and is the mean over time of the spectrogram for the scale a, but multiplied by the scale a.
Contributor Information
Nicolas Roehri, Aix-Marseille Université, Institut de Neurosciences des Systèmes, and with INSERM, UMR 1106, 13005 Marseille, France.
Jean-Marc Lina, Department of Electrical Engineering, École de technologie supérieure 1100, Notre-Dame Street West Montréal, Québec, Canada H3C 1K3.
John C. Mosher, Epilepsy Center, Cleveland Clinic Neurological Institute, Cleveland, Ohio, 44195.
Fabrice Bartolomei, Aix-Marseille Université, Institut de Neurosciences des Systèmes, and with INSERM, UMR 1106, 13005 Marseille, France. APHM, Timone Hospital, Clinical Neurophysiology and Epileptology Department, 13005 Marseille, France.
Christian-George Bénar, Aix-Marseille Université, Institut de Neurosciences des Systèmes, and with INSERM, UMR 1106, 13005 Marseille, France.
References
- 1.Urrestarazu E, et al. Interictal high-frequency oscillations (10–500 Hz) in the intracerebral EEG of epileptic patients. Brain. 2007;130(9):2354–2366. doi: 10.1093/brain/awm149. [DOI] [PubMed] [Google Scholar]
- 2.Jacobs J, et al. Interictal high-frequency oscillations (80–500 Hz) are an indicator of seizure onset areas independent of spikes in the human epileptic brain. Epilepsia. 2008;49(11):1893–1907. doi: 10.1111/j.1528-1167.2008.01656.x. [DOI] [PMC free article] [PubMed] [Google Scholar]
- 3.Jacobs J, et al. High frequency oscillations in intracranial EEGs mark epileptogenicity rather than lesion type. Brain. 2009;132(4):1022–1037. doi: 10.1093/brain/awn351. [DOI] [PMC free article] [PubMed] [Google Scholar]
- 4.Staba RJ, et al. Quantitative analysis of high-frequency oscillations (80–500 Hz) recorded in human epileptic hippocampus and entorhinal cortex. Journal of neurophysiology. 2002;88(4):1743–1752. doi: 10.1152/jn.2002.88.4.1743. [DOI] [PubMed] [Google Scholar]
- 5.Gardner AB, et al. Human and automated detection of high-frequency oscillations in clinical intracranial EEG recordings. Clinical Neurophysiology. 2007;118(5):1134–1143. doi: 10.1016/j.clinph.2006.12.019. [DOI] [PMC free article] [PubMed] [Google Scholar]
- 6.Birot G, et al. Automatic detection of fast ripples. Journal of Neuroscience Methods. 2013;213(2):236–249. doi: 10.1016/j.jneumeth.2012.12.013. [Online]. Available: http://dx.doi.org/10.1016/j.jneumeth.2012.12.013. [DOI] [PubMed] [Google Scholar]
- 7.Burnos S, et al. Human intracranial high frequency oscillations (HFOs) detected by automatic time-frequency analysis. PLoS ONE. 2014;9(4) doi: 10.1371/journal.pone.0094381. [DOI] [PMC free article] [PubMed] [Google Scholar]
- 8.Carmona R, Hwang W-L, Torresani B. Practical Time-Frequency Analysis: Gabor and Wavelet Transforms, with an Implementation in S. Academic Press; 1998. [Google Scholar]
- 9.Lilly JM, Olhede SC. Higher-order properties of analytic wavelets. IEEE Transactions on Signal Processing. 2009;57(1):146–160. [Google Scholar]
- 10.Worrell GA, et al. Progress in Neurobiology Recording and analysis techniques for high-frequency oscillations. Progress in Neurobiology. 2012;98(3):265–278. doi: 10.1016/j.pneurobio.2012.02.006. [Online]. Available: http://dx.doi.org/10.1016/j.pneurobio.2012.02.006. [DOI] [PMC free article] [PubMed] [Google Scholar]
- 11.Ljung L. System identification: theory for the user. Prentice-Hall; 1987. [Google Scholar]
- 12.Kamwa I, et al. Robust Detection and Analysis of Power System Oscillations Using the Teager-Kaiser Energy Operator. 2011;26(1):323–333. [Google Scholar]
- 13.Kamath C. A New Approach to Detect Epileptic Seizures in Electroencephalograms Using Teager Energy. 2013(i):2013. [Google Scholar]
- 14.Zelmann R, et al. Scalp EEG is not a blur: it can see high frequency oscillations although their generators are small. Brain topography. 2014;27(5):683–704. doi: 10.1007/s10548-013-0321-y. [Online]. Available: http://www.ncbi.nlm.nih.gov/pubmed/24141890. [DOI] [PubMed] [Google Scholar]
- 15.Grandchamp R, Delorme A. Single-trial normalization for event-related spectral decomposition reduces sensitivity to noisy trials. Frontiers in Psychology. 2011 Sep;2:1–14. doi: 10.3389/fpsyg.2011.00236. [DOI] [PMC free article] [PubMed] [Google Scholar]
- 16.Krieg J, et al. A comparison of methods for assessing alpha phase resetting in electrophysiology, with application to intracerebral EEG in visual areas. NeuroImage. 2011;55(1):67–86. doi: 10.1016/j.neuroimage.2010.11.058. [Online]. Available: http://www.ncbi.nlm.nih.gov/pubmed/21111827. [DOI] [PubMed] [Google Scholar]
- 17.Mallat S. A Wavelet Tour of Signal Processing: The Sparse way. 2008. [Google Scholar]
- 18.Bagshaw AP, et al. Effect of sleep stage on interictal high-frequency oscillations recorded from depth macroelectrodes in patients with focal epilepsy. Epilepsia. 2009;50(4):617–628. doi: 10.1111/j.1528-1167.2008.01784.x. [Online]. Available: http://doi.wiley.com/10.1111/j.1528-1167.2008.01784.x. [DOI] [PMC free article] [PubMed] [Google Scholar]
- 19.Jmail N, et al. A comparison of methods for separation of transient and oscillatory signals in EEG. Journal of Neuroscience Methods. 2011;199(2):273–289. doi: 10.1016/j.jneumeth.2011.04.028. [Online]. Available: http://dx.doi.org/10.1016/j.jneumeth.2011.04.028. [DOI] [PubMed] [Google Scholar]
- 20.Zelmann R, et al. Improving the identification of High Frequency Oscillations. Clinical Neurophysiology. 2009;120(8):1457–1464. doi: 10.1016/j.clinph.2009.05.029. [Online]. Available: http://dx.doi.org/10.1016/j.clinph.2009.05.029. [DOI] [PMC free article] [PubMed] [Google Scholar]
- 21.Bénar CG, et al. Pitfalls of high-pass filtering for detecting epileptic oscillations: A technical note on “false” ripples. Clinical Neurophysiology. 2010;121(3):301–310. doi: 10.1016/j.clinph.2009.10.019. [Online]. Available: http://dx.doi.org/10.1016/j.clinph.2009.10.019. [DOI] [PubMed] [Google Scholar]
- 22.Huang NE, et al. The empirical mode decomposition and the Hilbert spectrum for nonlinear and non-stationary time series analysis. Proceedings of the Royal Society A: Mathematical, Physical and Engineering Sciences. 1998;454(1971):995, 903. [Google Scholar]
- 23.Davis J, Goadrich M. The Relationship Between Precision-Recall and ROC Curves. Proceedings of the 23rd International Conference on Machine learning – ICML’06; 2006. pp. 233–240. [Online]. Available: http://portal.acm.org/citation.cfm?doid=1143844.1143874. [Google Scholar]
- 24.Fawcett T. ROC Graphs: Notes and Practical Considerations for Data Mining Researchers ROC Graphs: Notes and Practical Considerations for Data Mining Researchers. 2003. p. 27. [Google Scholar]
- 25.Amiri M, et al. High Frequency Oscillations and spikes: Separating real HFOs from false oscillations. Clinical Neurophysiology. 2015 doi: 10.1016/j.clinph.2015.04.290. [Online]. Available: http://linkinghub.elsevier.com/retrieve/pii/S1388245715006161. [DOI] [PubMed]
- 26.Chaitanya G, et al. Scalp high frequency oscillations (HFOs) in absence epilepsy: An independent component analysis (ICA) based approach. Epilepsy Research. 2015;115:133–140. doi: 10.1016/j.eplepsyres.2015.06.008. [Online]. Available: http://linkinghub.elsevier.com/retrieve/pii/S0920121115300140. [DOI] [PubMed] [Google Scholar]
- 27.Kobayashi K, et al. Scalp-recorded high-frequency oscillations in childhood sleep-induced electrical status epilepticus. Epilepsia. 2010;51(10):2190–2194. doi: 10.1111/j.1528-1167.2010.02565.x. [Online]. Available: http://doi.wiley.com/10.1111/j.1528-1167.2010.02565.x. [DOI] [PubMed] [Google Scholar]
- 28.van Klink Nicole, Hillebrand Arjan, Zijlmans Maeike. Identification of epileptic high frequency oscillations in the time domain by using MEG beamformer-based virtual sensors. Clinical Neurophysiology. 2015 doi: 10.1016/j.clinph.2015.06.008. [Online]. Available: http://dx.doi.org/10.1016/j.clinph.2015.06.008. [DOI] [PubMed]
- 29.Efron B. Local false discovery rates. Discovery. 2005:63–79. [Online]. Available: http://statistics.stanford.edu/{~}ckirby/techreports/BIO/BIO234.pdf.
- 30.Khalilov I, et al. Epileptogenic actions of GABA and fast oscillations in the developing hippocampus. Neuron. 2005;48(5):787–796. doi: 10.1016/j.neuron.2005.09.026. [DOI] [PubMed] [Google Scholar]
- 31.Colombet B, et al. AnyWave: A cross-platform and modular software for visualizing and processing electrophysiological signals. Journal of Neuroscience Methods. 2015;242:118–126. doi: 10.1016/j.jneumeth.2015.01.017. [Online]. Available: http://linkinghub.elsevier.com/retrieve/pii/S0165027015000187. [DOI] [PubMed] [Google Scholar]


