

Abstract
Key points
The underlying mechanism of torsade de pointes (TdP) remains of debate: perpetuation may be due to (1) focal activity or (2) re‐entrant activity.
The onset of TdP correlates with action potential heterogeneities in different regions of the heart.
We studied the mechanism of perpetuation of TdP in silico using a 2D model of human cardiac tissue and an anatomically accurate model of the ventricles of the human heart.
We found that the mechanism of perpetuation TdP depends on the degree of heterogeneity. If the degree of heterogeneity is large, focal activity alone can sustain a TdP, otherwise re‐entrant activity emerges.
This result can help to understand the relationship between the mechanisms of TdP and tissue properties and may help in developing new drugs against it.
Abstract
Torsade de pointes (TdP) can be the consequence of cardiac remodelling, drug effects or a combination of both. The mechanism underlying TdP is unclear, and may involve triggered focal activity or re‐entry. Recent work by our group has indicated that both cases may exist, i.e. TdPs induced in the chronic atrioventricular block (CAVB) dog model may have a focal origin or are due to re‐entry. Also it was found that heterogeneities might play an important role. In the current study we have used computational modelling to further investigate the mechanisms involved in TdP initiation and perpetuation, especially in the CAVB dog model, by the addition of heterogeneities with reduced repolarization reserve in comparison with the surrounding tissue. For this, the TNNP computer model was used for computations. We demonstrated in 2D and 3D simulations that ECGs with the typical TdP morphology can be caused by both multiple competing foci and re‐entry circuits as a result of introduction of heterogeneities, depending on whether the heterogeneities have a large or a smaller reduced repolarization reserve in comparison with the surrounding tissue. Large heterogeneities can produce ectopic TdP, while smaller heterogeneities will produce re‐entry‐type TdP.
Key points
The underlying mechanism of torsade de pointes (TdP) remains of debate: perpetuation may be due to (1) focal activity or (2) re‐entrant activity.
The onset of TdP correlates with action potential heterogeneities in different regions of the heart.
We studied the mechanism of perpetuation of TdP in silico using a 2D model of human cardiac tissue and an anatomically accurate model of the ventricles of the human heart.
We found that the mechanism of perpetuation TdP depends on the degree of heterogeneity. If the degree of heterogeneity is large, focal activity alone can sustain a TdP, otherwise re‐entrant activity emerges.
This result can help to understand the relationship between the mechanisms of TdP and tissue properties and may help in developing new drugs against it.
Abbreviations
- APD
afterdepolarization duration
- AV
atrioventricular
- CVAB
chronic atrioventricular block
- EAD
early afterdepolarization
- PVT
polymorphic ventricular tachycardia
- RR
repolarization reserve
- TdP
Torsade de pointes
Introduction
Abnormalities in ventricular impulse formation and conduction can lead to cardiac arrhythmias. Polymorphic arrhythmias are characterized by a complex non‐periodic appearance on the ECG, in contrast to a monomorphic arrhythmia that has a regular pattern. A prevalent subtype of a polymorphic arrhythmia is the torsade de pointes (TdP), which shows a typical ‘twisting of the points’. The amplitude of the excitation peaks shows a slowly varying amplitude, something that is not observed with other forms of polymorphic arrhythmia.
The occurrence of a TdP is usually preceded by prolongation of ventricular repolarization, which can be detected as increased QT interval or prolonged duration of the ventricular activation–repolarization interval or monophasic action potential duration. In most cases, prolongation of repolarization is caused by inhibition of key repolarizing potassium ion currents (e.g. I Kr or I Ks) or enhanced depolarizing currents (e.g. I Na, late or I CaL). Roden (1998) introduced the term ‘repolarization reserve’ to describe the extent to which the heart can withstand challenges to its repolarizing mechanisms. Challenges that may affect repolarization reserve are also associated with TdP incidence, and include mutations in genes encoding cardiac ion channels or adverse drug effects (Morita et al. 2008; Kannankeril et al. 2010).
Clearly, prevention of dangerous drug side‐effects such as TdP is a critical factor in drug development. Understanding the mechanisms of TdP is of key importance to the pharmaceutical industry. Half of the drugs that were withdrawn from the market since 1998 in the USA were withdrawn due to cardiac side effects and consequent arrhythmias (Noble, 2002). Unfortunately our understanding of the mechanisms underlying TdP and its typical appearance on the ECG is limited. The mechanisms of TdP have been studied in many clinical, experimental and computational set‐ups (Asano et al. 1997; El‐Sherif et al. 1997; Murakawa et al. 1997; Senges et al. 2000; Volders et al. 2000; Choi et al. 2002; Kozhevnikov et al. 2002; Schreiner et al. 2004; Sipido et al. 2007; Oros et al. 2008; Boulaksil et al. 2011). An important step was the development of several specific animal models in which TdP could be induced (Volders et al. 2000; Sipido et al. 2007; Oros et al. 2008). In all these models the researchers induced tissue remodelling, which resulted in prolongation of the QT interval and onset of early afterdepolarizations (EADs), which are defined as a premature depolarization of the action potential (AP) before normal completion of repolarization (Asano et al. 1997; El‐Sherif et al. 1997; Murakawa et al. 1997; Senges et al. 2000; Choi et al. 2002; Kozhevnikov et al. 2002; Schreiner et al. 2004). In most studies TdP was initiated by ectopic beats triggered by EADs. However, it remains unclear by which mechanism ectopic beats are perpetuated, and deteriorate into TdP.
One such animal model is the chronic atrioventricular block (CVAB) dog model, in which tissue remodelling that reduces repolarization reserve is triggered by the creation of an AV block (Vos et al. 1998). After that, the drug dofetilide is applied which further prolongs afterdepolarization duration (APD). Directly after causing AV block, administration of dofetilide does not cause ectopic beats or TdP; only after several weeks of remodelling does dofetilide administration cause ectopic beats in all dogs, and TdP in most dogs (7/10). Liu & Laurita (2005) and Maruyama et al. (2011) suggested that ectopic beats originated from the region with the largest heterogeneity in APD, a property also observed in the CAVB dog.
Two main mechanisms have been suggested as an explanation for the typical ECG and perpetuation of TdP, appearance of re‐entry circuits and ectopic activity. As the ECG during a TdP changes gradually, both re‐entrant and ectopic activity were assumed to be non‐stationary. For re‐entrant activity this may be due to a heterogeneity‐induced drift of a re‐entry circuit (Rudenko & Panfilov, 1983; Abildskov & Lux, 1991; Panfilov & Vasiev, 1991; Gray et al. 1995; Abildskov & Lux, 2000; Schmitt et al. 2001) or meandering of a re‐entry spiral (Winfree, 1995; Asano et al. 1997; El‐Sherif et al. 1997). Alternatively, ectopic beats originating from different locations (Asano et al. 1997; Boulaksil et al. 2011) may underlie TdP. The latter is supported by early work in which ECGs with typical TdP appearance could be reproduced by pacing the left ventricle at a constant cycle length of 245 ms while pacing the right ventricle at slightly variable cycle lengths (230–260 ms) (D'Alnoncourt et al. 1982). In a recent study we found that in the drug‐induced CAVB dog, 90% of the cases of self‐terminating TdP are perpetuated by ectopic activity (Boulaksil et al. 2011). The origin of the first activation varied from beat to beat, and for certain beats a competition between two foci was observed.
Therefore, it remains an open question why and how these ectopic beats emerge and compete and what their relationship is to observed EAD activity. One of the difficulties in studying these processes experimentally is that it requires detailed studies of the substrate at locations where such foci occur, but these locations are not a priori known. Development of ectopic beats can be examined in computer simulations without this limitation, using a wide range of possible parameters affecting cardiac excitability and tissue architecture and they thus provide valuable information for further experimentation.
In this study we used computer simulations to investigate the involvement of heterogeneities in TdP that reflect the situation in the CAVB dog, and extended it to human ventricular tissue. We did not aim to reproduce the exact mechanism of tissue remodelling that occurs in the CAVB dog model, but we built our research on our previous studies of EAD generation in the human TNNP model (Vandersickel et al. 2014). We considered a heterogeneity with a reduced repolarization reserve in comparison with the surrounding tissue. As experiments cannot characterize the degree of heterogeneity in detail, we have considered two possible set‐ups: a heterogeneity with (1) substantially reduced and (2) moderately reduced repolarization reserve in comparison with the surrounding tissue, which we will refer to as a large and a small heterogeneity. Next, we have uniformly decreased the repolarization reserve in the whole tissue to account for remodelling which takes place in the CAVB dog model. On top of that, we blocked I Kr to model the effect of dofetilide administration. We found that under such conditions we can obtain arrhythmias which have a gradual twisting of the QRS complex around the isoelectric line, typical for TdP. The mechanisms of TdP were: ectopic activity for large heterogeneity, and re‐entrant activity for small heterogeneity. Also, an important requirement for the occurrence of ectopic activity was the inability of the surrounding tissue to exhibit EAD activity. We also explain how the presence of heterogeneities leads to an arrhythmia such as TdP and discuss the application of these results for further experimental and clinical studies.
Methods
2D slice simulations
The two‐dimensional (2D) tissue simulations were performed in a transmural section of the heart. The tissue had a size of 12.8 cm (length) by 2 cm (transmural thickness). In this paper, we used the recent TNNP model for human ventricle cells (ten Tusscher et al. 2004; ten Tusscher & Panfilov, 2006), which was constructed on a wide range of human‐based electrophysiological data. First, two different cell types were implemented, epicardial and endocardial (ten Tusscher et al. 2004; ten Tusscher & Panfilov, 2006). The upper half of the tissue was endocardial cells, while the lower half was epicardial cells. The parameters for these regions were taken from ten Tusscher et al. (2004) and ten Tusscher & Panfilov (2006). Then, two heterogeneities were added to the tissue with different sizes similar to those found experimentally by Glukhov et al. (2010) to the 2D simulations. These heterogeneities had a reduced repolarization reserve in comparison with the surrounding tissue. For all the experiments performed, inside the heterogeneities we took Mcell parameters of ten Tusscher et al. (2004), which mainly reduces the conductance of the I Ks current to 25% of its original value and therefore increases the length of the APD. In this case, the APD difference is around 60 ms, which is in the same range as in Glukhov et al. (2010) (see Fig. 4).
Figure 4. ECGs for different parameter sets of GCaL inside and outside the heterogeneities of the simulation shown in Fig. 3 .
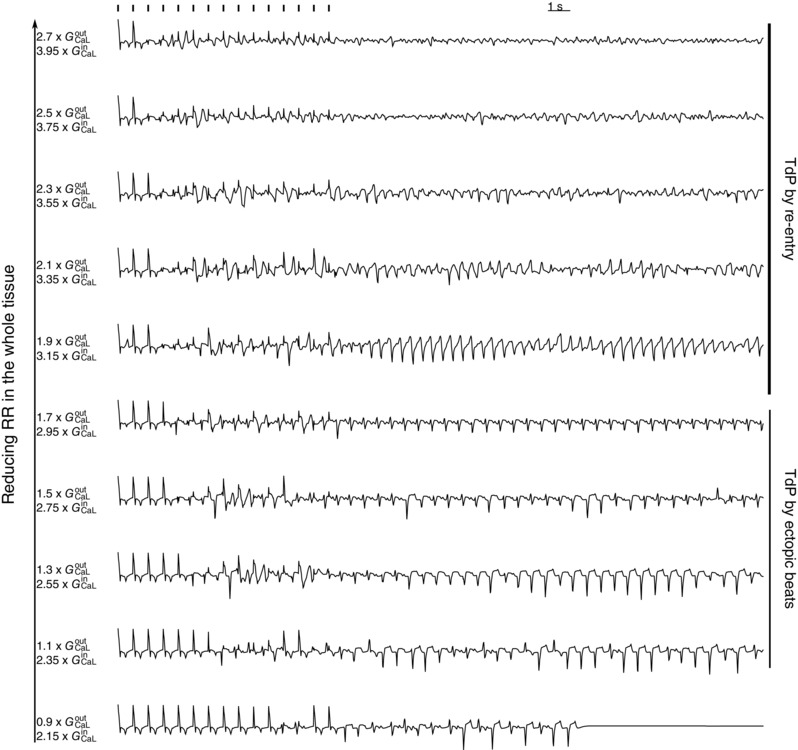
G CaL outside varies from 0.9 times its original value to 2.7 times its original value, while G CaL inside varies from 2.15 times to 3.95 times it original value . For we observed dynamic interaction between the two heterogeneities, which gave rise to TdP‐like ECGs. However, when its original value, the ectopic beats degenerated into re‐entry‐type TdP. For its original value, the TdP degenerated into VF. RR, repolarization reserve.
In a first series of simulations (experiment 1): (1) we fully blocked the I Kr current in the whole tissue, to model the effect of dofetilide, a drug which blocks I Kr and (2) we mimicked the effect of remodelling, which decreases the repolarization reserve in the whole tissue, by increasing I CaL in the whole slice. For each subsequent experiment, we further reduced the repolarization reserve in the whole tissue by continuing to increase the conductance of I CaL. This increase ranged from 1 to 2.9 times its original value. In conclusion, in this set of simulations, there is a small difference of repolarization reserve between the heterogeneity and the surrounding tissue (only by ). For a clarifying picture, please see the geometry in Fig. 1.
Figure 1. Excitation patterns with homogeneous reduction of RR in the 2D tissue with two heterogeneities with a smaller difference in RR between the heterogeneity and the surrounding tissue .
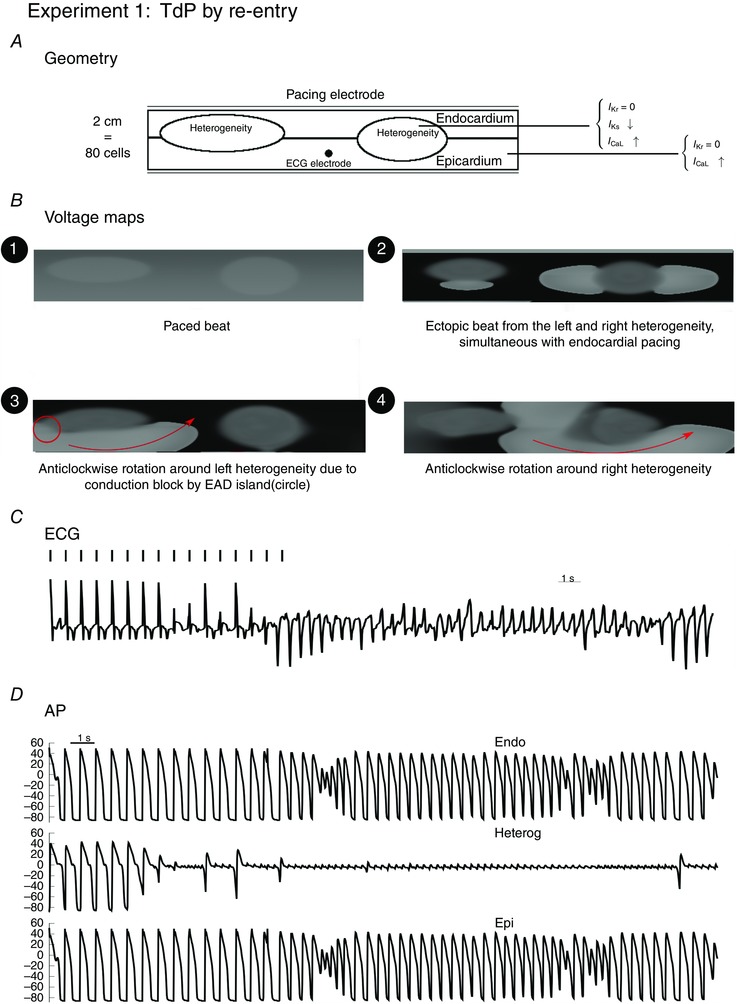
Inside the heterogeneities I Ks was lowered. In the whole tissue, I CaL was increased 2‐fold to model the effect of remodelling, while was blocked to represent the action of dofetilide. First, ectopic beats were generated by the heterogeneities (e.g. voltage map 2, t = 5.4). Then, due to conduction block, at t = 10.2 s a spiral wave started to anchor around the first heterogeneity in anticlockwise direction (voltage map 3), while in voltage map 4 the wave is rotated anticlockwise around the second (right) heterogeneity at t = 17.4 s.
In a second set of simulations (experiment 2), (1) we have further reduced the repolarization reserve inside the heterogeneity by increasing the conductance of the L‐type Ca current only inside the heterogeneity to 2.5 times its original value. (2) We again fully blocked the I Kr current in the whole tissue, and (3) we again modelled the effect of the remodelling in the dog model by subsequently increasing the L‐type Ca current in the whole slice for each subsequent experiment. In this set of simulations, we therefore have a large difference in repolarization reserve between the heterogeneity and the surrounding tissue. For a clarifying picture, please see the geometry in Fig. 3.
Figure 3. Large difference in RR between the heterogeneity and the surrounding tissue .
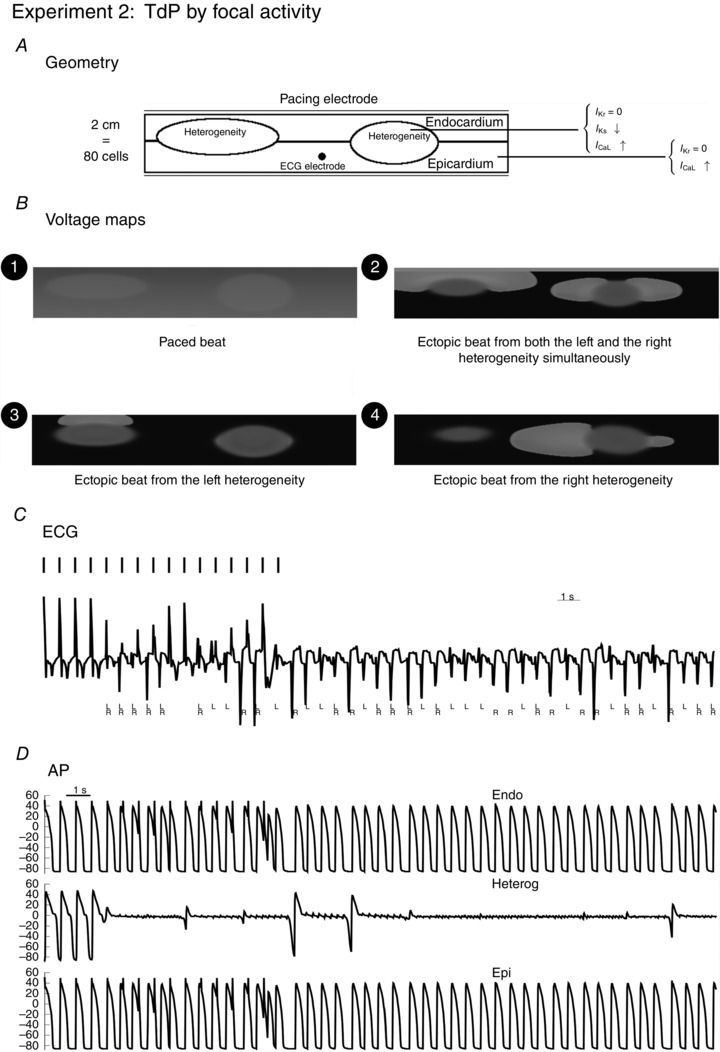
The myocardial slice represented in the geometry was paced from the endocardial side with pacing rate of 1.4 Hz, for 10 s. An additional 20 s was simulated without pacing. Inside the heterogeneities I Ks was lowered, and I CaL was increased 2.65 times; outside the heterogeneity I CaL was increased 1.4 times. In the whole tissue, was blocked. During the simulation, ectopic beats were produced in different configurations as presented in the voltage maps: emerging from the left (L) heterogeneity (voltage map 3, at t = 3.3 s), from the right (R) heterogeneity (voltage map 4, at t = 11.1 s) or from both simultaneously (activation map 2, at t = 2.8 s). The next panel represents the ECG, whereby the electrode for measuring the ECG was placed 2.5 cm above the black point indicated by the geometry. L and R represent the ectopic beats that arose from the left heterogeneity (L) or the right heterogeneity (R). Action potentials and are shown for this particular simulation, inside the heterogeneity and outside the heterogeneity (endocardium and epicardium).
All our 2D simulations have been carried out with a diffusion of cm2 ms–1, a time step of 0.02 ms and a space step of 0.25 mm in both x and y directions. The explicit Euler integration scheme was used, via Neumann (i.e. no‐flux) boundary conditions. Each cardiomyocyte was coupled to its four neighbouring cardiomyocytes. The tissue was paced with two different frequencies, 1 and/or 1.4 Hz. No qualitative differences were found between these two frequencies.
For the 2D simulations, pseudo ECGs were created by using the following formula:
| (1) |
whereby d2 S represents the surface we are studying, is the gradient of the corresponding point at the surface, and is a vector, for which the x and y position can be chosen at a certain location in the tissue, while placed at a perpendicular distance of 2.5 cm pointing to the surface (Z = 2.5 cm).
Whole heart simulations
For the whole heart simulations, we used an anatomically accurate model of the human ventricles (Tusscher et al. 2007). We introduced epi‐ and endocardial cells using the following algorithm. For each point, the shortest distance to the inner and outer walls were measured. If the inner or outer wall was closer to this point, is was set as an endocardial/epicardial cell type. This resulted in approximately 50% epicardial and 50% endocardial cells. We then added patchy localizations of heterogeneities with sizes based on the measurements of Glukhov et al. (2010), spheres with a radius in the range of 0.5 cm, at random locations in the heart. We repeated exactly the same protocols of the 2D simulations.
All simulations were performed on a GeForce GTX 680 and a GeForce GTX Titan, with single precision. Testing was also done with double precision and no substantial differences were found. Further details on the integration algorithm and numerical methods can be found in Tusscher et al. (2007) and Defauw et al. (2013). For the 3D simulations, pseudo‐ECGs were calculated in a similar fashion as in eqn (2):
| (2) |
whereby D is the diffusion tensor.
Results
As explained in the Introduction and Methods, we investigated two different cases, (1) heterogeneities with large reduced repolarization reserve in comparison with the surrounding tissue, and (2) heterogeneities with smaller reduced repolarization reserve in comparison with the surrounding tissue. In all cases I Kr was fully blocked in the whole tissue, while inside the heterogeneity I Ks was always reduced by 25%.
2D. 2D simulations
In all the 2D experiments, we have chosen two slightly different sizes of these heterogeneities as in cardiac tissue heterogeneities are unlikely to have identical sizes (see Figs 1 and 3).
Small heterogeneities: TdP by re‐entry
In this case, we gradually reduced the repolarization reserve by gradually increasing the L‐type Ca current in the whole tissue for each subsequent experiment. Therefore, in this experiment, only I Ks was reduced inside the heterogeneity. To initiate an arrhythmia we performed a burst pacing of 1.4 Hz of the tissue for 10 s at the endocardial side, and then studied excitation patterns for another 20 s without external pacing.
First, in these sets of experiments, we found that for the global parameter value occasionally ectopic beats were generated from the heterogeneities, but they were not sustained after we stopped pacing (see also the ECG in Fig. 2).
Figure 2. ECGs for different parameter sets of GCaL of the simulation shown in Fig. 1 .

G CaL varies from 1.8 times its original value to 2.5 times its original value. In the first two simulations, only ectopic beats were recorded, but no re‐entry was formed. There were also no EADs recorded in the surrounding tissue. For re‐entry was observed, but due to EAD formation in the surrounding tissue, the pattern of re‐entry was disturbed and became more chaotic. VF was initiated for .
Secondly, for an increase of in the whole tissue, we found that a re‐entry wave was formed around the heterogeneities. In Fig. 1, we show the voltage maps for this particular increase G CaL, and in Movie S1 (see Supplementary Material) we show a movie combined with the ECG. First, at time = 5.474 s a first ectopic beat originated from the left heterogeneity, while almost simultaneously, at t = 5.6 s an ectopic beat originated from the right heterogeneity (R) as well as from the left heterogeneity (L) (see also the voltage map 1 in Fig. 1). Then, additional ectopic beats were created at t = 6.3 s (L), t = 7.6 s (L), t = 9.0 s (L) and t = 9.6 s (L). Then at t = 10.2 s an ectopic beat came from the left heterogeneity, while in the surrounding tissue an island of EADs (Tran et al. 2009) was generated close to the ectopic beat, which caused conduction block in the upper direction of the wave. Therefore, the wave could only progress in anticlockwise direction around the first heterogeneity, and a re‐entry wave was formed. This is also shown in voltage map 3 (Fig. 3). From that moment, complex dynamics were displayed, where ectopic beats were generated by both heterogeneties and interacted with the surrounding tissue where islands of EADs were generated, creating complex rotations around the two heterogeneities. For example, at t = 17.4 s, the wave rotated anticlockwise around the second heterogeneity (see voltage map 4; Fig. 3). Interestingly, this rotation was able to change direction, due to conduction block formed by EAD activity in the surrounding tissue and at t = 24.0 s the wave changed its direction and started to rotate clockwise around the second heterogeneity. This particular movement of the spiral wave also gave rise to TdP‐like ECGs (Fig. 1). Similar excitation patterns were found for an increase of .
Thirdly, with a further reduction of the repolarization reserve , the patterns become very chaotic with multiple short living spirals present, in combination with focal activity of the surrounding tissue at the EAD islands becoming more prominent. The observed patterns showed co‐existence of Na+‐mediated and L‐type Ca+‐mediated activation wavefronts (Chang et al. 2012; Vandersickel et al. 2014), and resembled the SFb type we have described earlier (Vandersickel et al. 2014). L‐type Ca‐mediated waves are generated due to a reactivation of the L‐type Ca2+ current at a threshold of about −20 mV, which generates EADs in single cells. As this threshold is higher than the threshold for activation of sodium channels, it is possible for a wave to be only Ca2+‐mediated. In the tissue simulation, waves also formed due to normal Na+ activation of the cells. This gave rise to ventricular fibrillation (VF)‐like ECG, as can be seen in Fig. 2.
Large heterogeneities in repolarization reserve: TdP possible only by ectopic activity
In the second set of simulations, we paced the tissue for 10 s at the endocardial side, and then studied excitation patterns for another 20 s without external pacing. To have a larger heterogeneity, we have decreased the repolarization reserve inside the heterogeneity by increasing the conductance of I CaL to 2.5 times its original value, thereby increasing the difference in repolarization reserve between the heterogeneity and the surrounding tissue. As explained above, we then reduced the repolarization reserve in the whole tissue by increasing I CaL in the whole tissue.
For the case of large heterogeneity we found the following changes in the excitation patterns while reducing repolarization reserve (RR) in the whole tissue (Fig. 4). First, we found a gradual emergence of ectopic beats: starting with a single and progressing to multiple ectopic beats (see Fig. 4, for the original values of ). With further reduction of RR we found sustained ectopic activity, i.e. ectopic beats emerging from the heterogeneities that persisted after we stopped pacing the tissue. For the parameter value and , we therefore found a TdP‐like ECG only maintained by ectopic activity stemming from the heterogeneities. Reducing the RR even more, we found that the surrounding tissue started to exhibit EADs and again a re‐entrant type of TdP was found, as disussed in the previous section.
To illustrate a TdP due to ectopic activity in more detail, Fig. 3 shows that the location from which ectopic beats arise in our simulations is not fixed. First, within a particular heterogeneity it could arise from different locations, i.e. top, bottom or sides of the heterogeneity. In general, we observed that ectopic beats could arise from any direction of the heterogeneity region. Secondly, we found that the ectopic beats had interesting dynamics (Fig. 3). The ectopic beat could arise from the left (L) heterogeneity (voltage map 3, at t = 3.3 s) and the right (R) heterogeneity (voltage map 4, at t = 11.1 s). Moreover, we often found that ectopic activation emerged simultaneously at the different sites (voltage map 2, at t = 2.8 s). Similar excitation patterns have also been reported experimentally (Boulaksil et al. 2011). The most important finding was that in spite of different sizes and locations, there was no dominating heterogeneity and the ectopic sites could alternate between them (see also Movie S2). These dynamics between the two heterogeneities led to an ECG that resembled that of a TdP. Indeed, an important diagnostic feature of TdP is a gradual twisting of the QRS complex around the isoelectric baseline, which is normally seen as a change in ECG amplitude (Dessertenne, 1966). Figure 3 also shows the ECG generated for the simulation. There was a gradual change in ECG amplitude, which is similar to that of TdP and certainly similar to a polymorphic ventricular tachycardia (PVT). In Fig. 3, we have indicated which heterogeneity gave rise to an ectopic beat. The corresponding voltage maps for Fig. 3 are given in Movie S2, together with the ECG.
Whole heart simulations
We also studied if the heterogeneities considered in the simulation sets 1 and 2 can produce ectopic beats/re‐entry in the whole heart. For this, we conducted simulations using anatomically accurate model ventricles of the human heart in which, as in the previous sections, we set heterogeneities with lower repolarization reserve than in the surrounding tissue. Again, we reduced I Ks inside the heterogeneous regions to 25% of its original value to model a small heterogeneity. For large heterogeneities, we additionally increased I CaL to three times its original value to model large heterogeneities. Subsequently, we blocked I Kr to model the effect of dofetilide. We also increased G CaL in the whole tissue to account for the effect of the remodelling.
Small heterogeneities with EADs in the surrounding tissue: TdP by re‐entry
In the whole heart simulations, we simulated one or multiple heterogeneities with variable sizes, whereby the surrounding tissue displayed EADs. The results of these simulations were similar for a single and multiple heterogeneities, and therefore we illustrate them here for the case of a single circular heterogeneity 1 cm in size (Fig. 5). G CaL was increased to three times it original value inside the heterogeneity, and 2.05 times outside the heterogeneity. The results found are similar as in the 2D simulations, although patterns could become more complex due to the 3D nature of the heart. First, at t = 0 s (Fig. 5(1)), an endocardial beat was given, while in the first 7 s, eight ectopic beats stemming from the heterogeneity (E) arose spontaneously. After 7 s, the ectopic beats started to interact with islands of EAD, generated in the surrounding tissue, thereby leading to re‐entry, as described in the 2D case. This is presented in Movie S3. This led to more chaotic multiple waves as shown in Fig. 5(3), or to a re‐entrant wave around the heterogeneity as can be seen in Fig. 5(4). The ECG had a typical pattern of a TdP, with undulation of the signal. Note that in this case, only one heterogeneity is enough to get a TdP‐like signal, while in the case of ectopic beats only, multiple heterogeneities are required for a PVT. We further reduced the repolarization reserve outside the tissue in five steps by increasing G CaL up to 2.25 times its original value, again resulting in TdP‐like ECGs. For larger reductions of the repolarization reserve, the TdP degenerated into VF.
Figure 5. Whole heart excitation patterns for smaller differences in repolarization reserve between the heterogeneity and the surrounding tissue, whereby the surrounding tissue exhibits EADs .
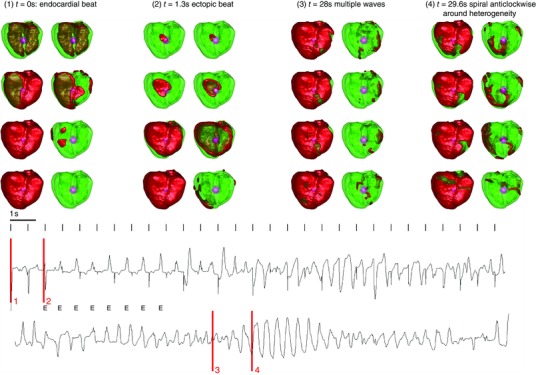
Frame 1 at time = 0 s shows an endocardial beat. The left frame represent the wave, while the right frames only show the wavefront. Inside the heterogeneities I Ks was lowered, and I CaL was increased 3‐fold; outside the heterogeneity I CaL was increased 2.05‐fold. In the whole tissue was blocked. The bottom panel represents the ECG, with the measurement electrode placed 2.5 cm from the top of the heart. During the simulation, first an ectopic beat was generated (frame 2 at t = 1.3 s). Later multiple ectopic beats (E) were generated which degenerated into re‐entry due to EAD activity in the surrounding tissue. At t = 28, we observed multiple waves, which gave rise to a fibrillatory ECG while at t = 29.6 s, a clear spiral wave was observed which rotated around the heterogeneity The four time episodes of the frames above are indicated in red.
We performed the same set of simulations with (1) a smaller sized heterogeneity (circular radius of 0.75 cm) and (2) with two heterogeneities of the same size with the same parameter ranges, and similar ECGs and patterns were always observed. In Fig. 6 we present an example where a clear twisting of the axis was observed: low amplitude in one ECG at one location can correspond to high amplitude in an ECG at a different location.
Figure 6. Whole heart ECGs from different locations with one heterogeneity with a circular size of 0.75 cm .
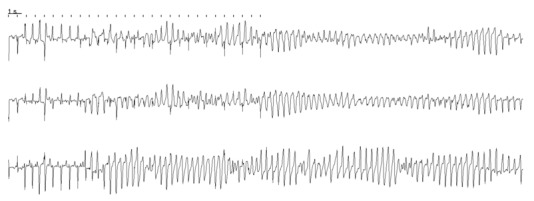
The same parameters were used as in Fig. 5 whereby G CaL inside was enhanced 5‐fold. The pseudo‐ECG was taken from three different locations, one at the top of the heart, one at the bottom and one from the side. This provides a nice example of twisting of the axis. Low amplitude in the first ECG can correspond to high amplitude in the third ECG.
Large heterogeneities in repolarization reserve with no EADs in the surrounding tissue: TdP by ectopic activity
In this set of simulations, we set two different circular heterogeneities with a radius of 0.75 cm at random locations in the heart. The repolarization reserve was reduced in the surrounding tissue in exactly the same way as in the 2D case.
We paced the heart from the endocardial side with a frequency of 1.4 Hz. We found very similar results as in the 2D model. In Fig. 7(1) the endocardial beat is shown. From these frames, is it clear that the heterogeneity has a longer APD. However, due to electrotonic coupling, no ectopic beat was produced for the first paced beat. Subsequently, after about 1.89 s, see Fig. 7(2), the top heterogeneity produced an ectopic beat (T), while in Fig. 7(4) the lower site (B) fired an ectopic beat at t = 7.26. It was also possible that both heterogeneities fired an ectopic beat simultaneously, as shown in Fig. 7(3). In Fig. 7 we present the corresponding ECG from this simulation. Similar to the 2D simulation, we found that the ECG has the characteristics of a polymorphic VT. The location of the beats from the heterogeneities are indicated with B and T. This ECG shows a gradual change in amplitude similar to TdP produced by undulation when the top heterogeneity takes over from the bottom. In the Supplementary Material, the full movie is presented with the corresponding time location indicated on the ECG (Movie S4).
Figure 7. Whole heart excitation patterns for a large difference in repolarization reserve between the heterogeneity and the surrounding tissue, whereby the surrounding tissue does not exhibit any EADs .
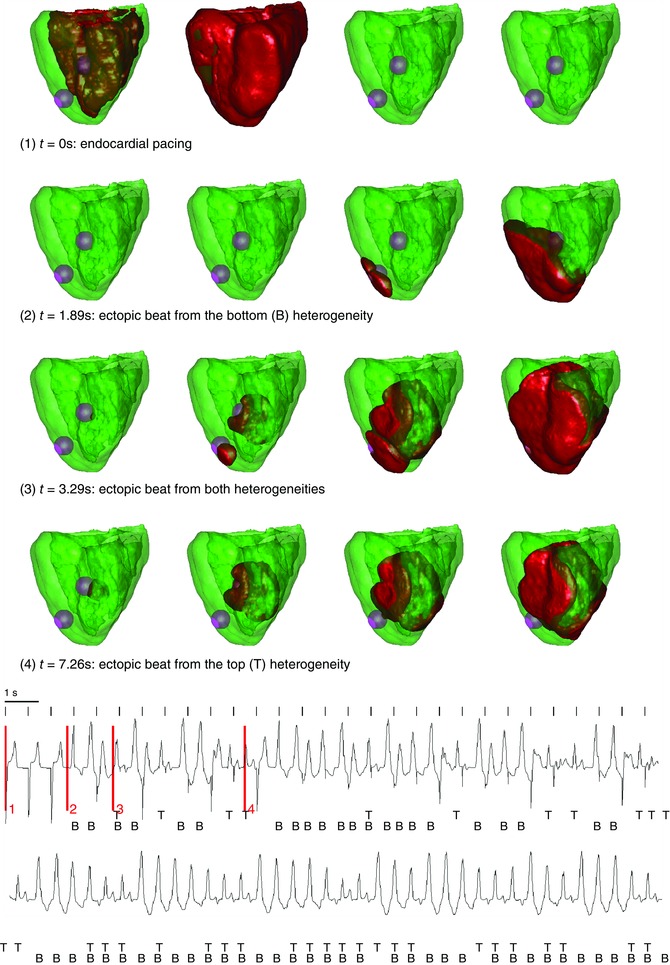
Frame 1 shows an endocardial beat. Inside the heterogeneities I Ks was lowered, and I CaL was increased 3.5‐fold; outside the heterogeneity I CaL was increased 1.5‐fold. In the whole tissue I Kr was blocked. During the simulation, ectopic beats were produced coming from the different heterogeneities: emerging from the bottom (B) heterogeneity (e.g. frames 3 at t = 1.89 s), from the top (T) heterogeneity (e.g. frames 4 at t = 7.26 s) or from the both simultaneously (e.g. frames 3 at t = 3.29). The bottom panel represents the ECG, with the measurement electrode placed above the heart. The four time episodes of the frames above are indicated in red.
Discussion
TdP is often assumed to be caused by triggered activity related to EADs (Boulaksil et al. 2011). However, the mechanism of perpetuation remains of debate. Two mechanisms were put forward to explain TdP, re‐entry and ectopic activity (Belardinelli et al. 2003). It was shown that moving sites of re‐entry caused by a heterogeneity can give rise to TdP‐like ECGs (Abildskov & Lux, 1991, 2000). Another possibility is a quasi‐periodically meandering spiral wave (Winfree, 1995), which also gives rise to TdP‐like ECGs. Secondly, focal activity was put forward as a possible source of continuation (Murakawa et al. 1997; Senges et al. 2000; Choi et al. 2002; Schreiner et al. 2004). Moreover, in the CAVB model, it was clearly shown that focal activity is the most important mechanism for continuation of TdP and these foci can lie in different locations in the heart (Boulaksil et al. 2011). Also, in these studies it has been suggested that heterogeneities could play an important role. In the canine CAVB model, electrical remodelling takes place due to bradycardia and altered ventricular activation. This is crucial for the development of TdPs. However, it takes place in a non‐uniform way, and therefore it might be related to locations of the foci.
One rationale for this research was to understand why experimental studies show that in similar situations a TdP can be driven either by focal activity or by re‐entry. In addition, how the focal activity can emerge due to EADs was not properly addressed in previous studies. Our study addresses both of these questions. First (in the case of small heterogeneities), we found that focal activity can easily deteriorate into re‐entrant activity, and in our simulations a hallmark of such transitions was the possibility of the onset of EADs in the surrounding tissue. Note that the re‐entry type is not stable; new re‐entry waves are formed and dissapear due to the interaction with islands of EADs, which form conduction blocks. These islands of EADs were shown to be formed due to chaos synchronization (Tran et al. 2009). Secondly (in the case of large heterogeneities), we showed that only focal EAD activity can also induce TdP‐like ECGs, although for that the tissue needs to have several heterogeneities. In that case the ectopic activity can occur at these various locations of heterogeneity and interaction of these ectopic beats produces an ECG similar to that of TdP. Interestingly, for multiple heterogeneities we do not see a dominance of one heterogeneity and observe their complex interaction.
Based on these results we can provide the following explanation for the TdPs observed in the canine CAVB model. As the experimental protocols result in a reduction of repolarization reserve in both ventricles (due to remodelling and application of dofetilide), then for a large reduction of repolarization reserve eventually all tissue can become prone to EAD generation and thus we would expect a re‐entrant mechanism of TdP of VF. However, if the tissue initially had multiple heterogeneous regions with large heterogeneities, then a uniform reduction of repolarization reserve can result in conditions of focal TdP as shown here. We therefore conclude that ectopic TdP is more likely to occur in highly heterogeneous tissue.
In our simulations we applied external stimulation with a given period independently of the excitation pattern. This is different from sinus node excitation, as a premature ventricular contraction (PVC) can reset a phase of sinoatrial node (SA) excitation, which is not the case in our stimulation protocol. To avoid possible effects of this shortcoming for the results of our paper, we have repeated the simulation of Fig. 1, whereby we only paced when no ectopic beats were present and in the presence of waves generated by ectopic activity stimulation was disconnected. The results of this simulation are shown in Movie S5. The resulting pattern was not affected by this change in pacing protocol.
We believe that our results can be applied not only for the CAVB dog model. Maruyama et al. (2011) and Liu & Laurita (2005) found that ectopic beat originated from the steepest APD region, in the rabbit and dog heart, respectively. Also, Glukhov et al. (2010) found heterogeneities with the sizes used in our study in the human heart. Therefore, it would be interesting to study if the effects found in our study are also observed in the above preparations under a decrease of the repolarization reserve.
We did not aim here to reproduce the exact remodelling of the CAVB dog model, but rather used our previous studies on EAD generation (Vandersickel et al. 2014). To accurately reproduce the experiments of the CAVB dog, one needs the use a dog ventricular cell model (model of Decker et al. 2009) and use an accurate anatomical reconstruction (Nielsen et al. 1991) of the dog ventricles. In addition, the model should include ionic tissue remodelling based on measured experimental data. However, we expect that the main results of our study will not change substantially. This is because our previous results which involved various parameter changes (Vandersickel et al. 2014) and even different cardiac models (Zimik et al. 2015) have shown that the main spatial regimes of excitation are largely determined by the repolarization reserve and are largely model‐ and parameter‐independent.
One possible form of heterogeneities might be M‐cells. Indeed, in previous experimental studies (Sicouri & Antzelevitch, 1991; Sicouri & Antzelevitch, 1993), it was shown that M‐cells are much more prone to the production of EADs and can show triggered activity. Numerical studies by Richards et al. (2013) provided an example of simulation in which wave dynamics in the presence of M‐cell regions produced a TdP‐like ECG. It would be interesting to study the mechanism underlying these simulations and compare it with our study.
Kim et al. (2015) studied another possible mechanism of PVT occurring in long QT1 syndrome in a transgenic rabbit model. It was shown that PVT can occur as a result of multiple shifting foci, which are not apparently connected to the underlying heterogeneity of the heart. A similar result was also reported in numerical simulations by Sato et al. (2009) for modelling oxidative stress in the whole rabbit heart. We have also observed multiple focal activity not relataed to heterogeneity, when repolarization reserve was reduced in the whole tissue. However, this did not resemble a regular shift and in most cases such activity quickly degenerated into VF. Our study also confirms the coexistence of Na+‐mediated and L‐type Ca+‐mediated activation wavefronts reported by Kim et al. (2015). For example in Fig. 2, in the top three ECGs, the observed patterns show the coexistence of Na+‐mediated and L‐type Ca2+‐mediated activation wavefronts.
It is also interesting to note the difference between the two different types of ECGs caused only by ectopic activity and the re‐entry type (see Fig. 1 C, 3 C and Fig 2, 4). Clearly, the re‐entry gives more smooth ECGs, and in our opinion might resemble more the typical TdP‐like ECG. However, note that no clear definition of TdP exists. In most cases, a PVT in combination with long QT syndrome is called a TdP. In some cases this typical twisting is observed. Therefore, for future research, it would be interesting to compare both ECGs of the re‐entry type with experimental ECGs that have only ectopic activity, to examine the difference between the two.
In conclusion, heterogeneities can be important for the induction of TdP. First, they can be the initiator of ectopic activity. If multiple heterogeneities are present, this interaction between the different heterogeneities can lead to a polymorphic VT. However, if the surrounding tissue is prone to the generation of EADs, these ectopic beats can lead to re‐entry due to conduction block and EAD‐triggered activity in the surrounding tissue. This gives a TdP‐like ECG, with with the typical twisting of the axis.
Additional information
Competing interests
The authors have no competing interests.
Author contributions
N.V. contributed to the conception and design of experiments; collection, analysis and interpretation of data; and writing and revising the article. T.P.d.B. contributed to the design of the experiments and to writing and revising the paper. M.A.V contributed to writing and revising the article. A.V.P. contributed to the conception and design of experiments; interpretation of data; and writing and revising the article.
Funding
N.V. was supported by the Research Foundation‐Flanders.
Supporting information
Movies S1: TdP by reentry. This movie shows the voltage maps of experiment 1 of 2D tissue in combintation with the corresponding ECG.
Movies S2: TdP by focal activity. This movie shows the voltage maps of experiment 2 of 2D tissue in combination with the corresponding ECG.
Movies S3: TdP by reentry. This movie shows the voltage maps of figure 5 in the whole heart in combination with the ECG.
Movies S4: TdP by reentry. This movie shows the voltage maps of figure 7 in the whole heart in combination with the ECG.
Movies S5: The same simulation of Figure 1 (Movie S1), whereby we only paced when no ectopic beats were present. In the presence of waves generated by ectopic activity, the tissue was not stimulated.
References
- Abildskov JA & Lux RL (1991). The mechanism of simulated torsade de pointes in a computer model of propagated excitation. J Cardiovasc Electrophysiol 2, 224–237. [Google Scholar]
- Abildskov JA & Lux RL (2000). Simulated torsade de pointes–the role of conduction defects and mechanism of qrs rotation. J Electrocardiol 33, 55–64. [DOI] [PubMed] [Google Scholar]
- Asano Y, Davidenko JM, Baxter WT, Gray RA & Jalife J (1997). Optical mapping of drug‐induced polymorphic arrhythmias and torsade de pointes in the isolated rabbit heart. J Am Coll Cardiol 29, 831–842. [DOI] [PubMed] [Google Scholar]
- Belardinelli L, Antzelevitch C & Vos MA (2003). Assessing predictors of drug‐induced torsade de pointes. Trends Pharmacol Sci 24, 619–625. [DOI] [PubMed] [Google Scholar]
- Boulaksil M, Jungschleger JG, Antoons G, Houtman MJC, de Boer TP, Wilders R, Beekman JD, Maessen JG, van der Hulst FF, van der Heyden MAG, van Veen TAB, van Rijen HVM, de Bakker JMT & Vos MA (2011). Drug‐induced torsade de pointes arrhythmias in the chronic av block dog are perpetuated by focal activity. Circ Arrhythm Electrophysiol 4, 566–576. [DOI] [PubMed] [Google Scholar]
- Chang MG, Sato D, de Lange E, Lee J‐H, Karagueuzian HS, Garfinkel A, Weiss JN & Qu Z (2012). Bi‐stable wave propagation and early afterdepolarization‐mediated cardiac arrhythmias. Heart Rhythm 9, 115–122. [DOI] [PMC free article] [PubMed] [Google Scholar]
- Choi B‐R, Burton F & Salama G (2002). Cytosolic Ca2+ triggers early afterdepolarizations and torsade de pointes in rabbit hearts with type 2 long QT syndrome. J Physiol 543, 615–631. [DOI] [PMC free article] [PubMed] [Google Scholar]
- D'Alnoncourt CN, Zierhut W & Blüderitz B (1982). “Torsade de pointes” tachycardia. re‐entry or focal activity? Br Heart J 48, 213–216. [DOI] [PMC free article] [PubMed] [Google Scholar]
- Decker KF, Heijman J, Silva JR, Hund TJ & Rudy Y (2009). Properties and ionic mechanisms of action potential adaptation, restitution, and accommodation in canine epicardium. Am J Physiol Heart Circ Physiol 4, H1017–H1026. [DOI] [PMC free article] [PubMed] [Google Scholar]
- Defauw A, Dawyndt P & Panfilov AV (2013). Initiation and dynamics of a spiral wave around an ionic heterogeneity in a model for human cardiac tissue. Phys Rev E Stat Nonlin Soft Matter Phys 88, 062703. [DOI] [PubMed] [Google Scholar]
- Defauw A, Kazbanov IV, Dierckx H, Dawyndt P & Panfilov AV (2013). Action potential duration heterogeneity of cardiac tissue can be evaluated from cell properties using gaussian green's function approach. PLoS One 8, e79607. [DOI] [PMC free article] [PubMed] [Google Scholar]
- Dessertenne F (1966). Ventricular tachycardia with 2 variable opposing foci. Arch Mal Coeur Vaiss 59, 263–272. [PubMed] [Google Scholar]
- El‐Sherif N, Chinushi M, Caref EB & Restivo M (1997). Electrophysiological mechanism of the characteristic electrocardiographic morphology of torsade de pointes tachyarrhythmias in the long‐QT syndrome: detailed analysis of ventricular tridimensional activation patterns. Circulation 96, 4392–4399. [DOI] [PubMed] [Google Scholar]
- Glukhov AV, Fedorov VV, Lou Q, Ravikumar VK, Kalish PW, Schuessler RB, Moazami N & Efimov IR (2010). Transmural dispersion of repolarization in failing and nonfailing human ventricle. Circ Res 106, 981–991. [DOI] [PMC free article] [PubMed] [Google Scholar]
- Gray RA, Jalife J, Panfilov A, Baxter WT, Cabo C, Davidenko JM & Pertsov AM (1995). Nonstationary vortexlike reentrant activity as a mechanism of polymorphic ventricular tachycardia in the isolated rabbit heart. Circulation 91, 2454–2469. [DOI] [PubMed] [Google Scholar]
- Kannankeril P, Roden DM & Darbar D (2010). Drug‐induced long QT syndrome. Pharmacol Rev 62, 760–781. [DOI] [PMC free article] [PubMed] [Google Scholar]
- Kim TY, Kunitomo Y, Pfeiffer Z, Patel D, Hwang J, Harrison K, Patel B, Jeng P, Ziv O, Lu Y, Peng X, Qu Z, Koren G & Choi B‐R (2015). Complex excitation dynamics underlie polymorphic ventricular tachycardia in a transgenic rabbit model of long QT syndrome type 1. Heart Rhythm 12, 220–228. [DOI] [PMC free article] [PubMed] [Google Scholar]
- Kozhevnikov DO, Yamamoto K, Robotis D, Restivo M & El‐Sherif N (2002). Electrophysiological mechanism of enhanced susceptibility of hypertrophied heart to acquired torsade de pointes arrhythmias: tridimensional mapping of activation and recovery patterns. Circulation 105, 1128–1134. [DOI] [PubMed] [Google Scholar]
- Liu J & Laurita KR (2005). The mechanism of pause‐induced torsade de pointes in long QT syndrome. J Cardiovasc Electrophysiol 16, 981–987. [DOI] [PubMed] [Google Scholar]
- Maruyama M, Lin SF, Xie Y, Chua SK, Joung SKB, Han S, Shinohara T, Shen MJ, Qu Z, Weiss JN & Chen PS (2011). Genesis of phase 3 early afterdepolarizations and triggered activity in acquired long‐QT syndrome. Circ Arrhythm Electrophysiol 4, 103–111. [DOI] [PMC free article] [PubMed] [Google Scholar]
- Morita H, Wu J & Zipes DP (2008). The QT syndromes: long and short. Lancet 372, 750–763. [DOI] [PubMed] [Google Scholar]
- Murakawa Y, Sezaki K, Yamashita T, Kanese Y & Omata M (1997). Three‐dimensional activation sequence of cesium‐induced ventricular arrhythmias. Am J Physiol 273, H1377–H1385. [DOI] [PubMed] [Google Scholar]
- Nielsen PM, Le Grice IJ, Smaill BH & Hunter PJ (1991). Mathematical model of geometry and fibrous structure of the heart. Am J Physiol 4, H1365–H1378. [DOI] [PubMed] [Google Scholar]
- Noble D (2002). Modeling the heart–from genes to cells to the whole organ. Science 295, 1678–1682. [DOI] [PubMed] [Google Scholar]
- Oros A, Beekman JDM & Vos MA (2008). The canine model with chronic, complete atrio‐ventricular block. Pharmacol Ther 119, 168–178. [DOI] [PubMed] [Google Scholar]
- Panfilov AV & Vasiev BN (1991). Vortex initiation in a heterogeneous excitable medium. Phys D 49, 107–113. [Google Scholar]
- Richards DF, Glosli JN, Draeger EW, Mirin AA, Chan B, Fattebert J‐L, Krauss WD, Oppelstrup T, Butler CJ, Gunnels JA, Gurev V, Kim C, Magerlein J, Reumann M, Wen H‐F & Rice JJ (2013). Towards real‐time simulation of cardiac electrophysiology in a human heart at high resolution. Comput Methods Biomech Biomed Engin 16, 802–805. [DOI] [PubMed] [Google Scholar]
- Roden DM (1998). Taking the idio” out of “idiosyncratic”: predicting torsades de pointes. Pacing Clin Electrophysiol 21, 1029–1034. [DOI] [PubMed] [Google Scholar]
- Rudenko AN & Panfilov AV (1983). Drift and interaction of vortices in two dimensional heterogeneous active medium. Stud Biophys 98, 183–188. [Google Scholar]
- Sato D, Xie L‐H, Sovari AA, Tran DX, Morita N, Xie F, Karagueuzian H, Garfinkel A, Weiss JN & Qu Z (2009). Synchronization of chaotic early afterdepolarizations in the genesis of cardiac arrhythmias. Proc Natl Acad Sci U S A 106, 2983–2988. [DOI] [PMC free article] [PubMed] [Google Scholar]
- Schmitt H, Cabo C, Costeas C, Coromilas J & Wit AL (2001). Mechanisms for spontaneous changes in QRS morphology sometimes resembling torsades de pointes during reentrant ventricular tachycardia in a canine infarct model. J Cardiovasc Electrophysiol 12, 686–694. [DOI] [PubMed] [Google Scholar]
- Schreiner KD, Voss F, Senges JC, Becker R, Kraft P, Bauer A, Kelemen K, Kuebler W, Vos MA & Schoels W (2004). Tridimensional activation patterns of acquired torsade‐de‐pointes tachycardias in dogs with chronic av‐block. Basic Res Cardiol 99, 288–298. [DOI] [PubMed] [Google Scholar]
- Senges JC, Sterns LD, Freigang KD, Bauer A, Becker R, Kübler W & Schoels W (2000). Cesium chloride induced ventricular arrhythmias in dogs: three‐dimensional activation patterns and their relation to the cesium dose applied. Basic Res Cardiol 95, 152–162. [DOI] [PubMed] [Google Scholar]
- Sicouri S & Antzelevitch C (1991). Afterdepolarizations and triggered activity develop in a select population of cells (M cells) in canine ventricular myocardium: the effects of acetylstrophanthidin and Bay K 8644. Pacing Clin Electrophysiol 14, 1714–1720. [DOI] [PubMed] [Google Scholar]
- Sicouri S & Antzelevitch C (1993). Drug‐induced afterdepolarizations and triggered activity occur in a discrete subpopulation of ventricular muscle cells (M cells) in the canine heart: quinidine and digitalis. J Cardiovasc Electrophysiol 4, 48–58. [DOI] [PubMed] [Google Scholar]
- Sipido KR, Bito V, Antoons G, Volders PG & Vos MA (2007). Na/Ca exchange and cardiac ventricular arrhythmias. Ann N Y Acad Sci 1099, 339–348. [DOI] [PubMed] [Google Scholar]
- ten Tusscher KH, Noble D, Noble PJ & Panfilov AV (2004). A model for human ventricular tissue. Am J Physiol Heart Circ Physiol 286, H1573–1589. [DOI] [PubMed] [Google Scholar]
- ten Tusscher KH & Panfilov AV (2006). Alternans and spiral breakup in a human ventricular tissue model. Am J Physiol Heart Circ Physiol 291, H1088–1100. [DOI] [PubMed] [Google Scholar]
- Tran DX, Sato D, Yochelis A, Weiss JN, Garfinkel A & Qu Z (2009). Bifurcation and chaos in a model of cardiac early afterdepolarizations. Phys Rev Lett 102, 258103. [DOI] [PMC free article] [PubMed] [Google Scholar]
- Tusscher KHWJT, Hren R & Panfilov AV (2007). Organization of ventricular fibrillation in the human heart. Circ Res 100, e87–101. [DOI] [PubMed] [Google Scholar]
- Vandersickel N, Kazbanov IV, Nuitermans A, Weise LD, Pandit R & Panfilov AV (2014). A study of early afterdepolarizations in a model for human ventricular tissue. PLoS One 9, e84595. [DOI] [PMC free article] [PubMed] [Google Scholar]
- Volders PG, Vos MA, Szabo B, Sipido KR, de Groot SH, Gorgels AP, Wellens HJ & Lazzara R (2000). Progress in the understanding of cardiac early afterdepolarizations and torsades de pointes: time to revise current concepts. Cardiovasc Res 46, 376–392. [DOI] [PubMed] [Google Scholar]
- Vos MA, de Groot SH, Verduyn SC, van der Zande J, Leunissen HD, Cleutjens JP, van Bilsen M, Daemen MJ, Schreuder JJ, Allessie MA & Wellens HJ (1998). Enhanced susceptibility for acquired torsade de pointes arrhythmias in the dog with chronic, complete av block is related to cardiac hypertrophy and electrical remodeling. Circulation 98, 1125–1135. [DOI] [PubMed] [Google Scholar]
- Winfree A (1995). Mechansism of cardiac fibrillation – reply Science 270, 1224–1225. [Google Scholar]
- Zimik S, Vandersickel N, Nayak AR, Panfilov AV & Pandit R (2015). A comparative study of early afterdepolarization‐mediated fibrillation in two mathematical models for human ventricular cells. PLoS One 10, e0130632. [DOI] [PMC free article] [PubMed] [Google Scholar]
Associated Data
This section collects any data citations, data availability statements, or supplementary materials included in this article.
Supplementary Materials
Movies S1: TdP by reentry. This movie shows the voltage maps of experiment 1 of 2D tissue in combintation with the corresponding ECG.
Movies S2: TdP by focal activity. This movie shows the voltage maps of experiment 2 of 2D tissue in combination with the corresponding ECG.
Movies S3: TdP by reentry. This movie shows the voltage maps of figure 5 in the whole heart in combination with the ECG.
Movies S4: TdP by reentry. This movie shows the voltage maps of figure 7 in the whole heart in combination with the ECG.
Movies S5: The same simulation of Figure 1 (Movie S1), whereby we only paced when no ectopic beats were present. In the presence of waves generated by ectopic activity, the tissue was not stimulated.