

Abstract
Key points
Sinoatrial node (SAN) function declines with age; however, not all individuals age at the same rate and health status can vary from fit to frail.
Frailty was quantified in young and aged mice using a non‐invasive frailty index so that the impacts of age and frailty on heart rate and SAN function could be assessed.
SAN function was impaired in aged mice due to alterations in electrical conduction, changes in SAN action potential morphology and fibrosis in the SAN.
Changes in SAN function, electrical conduction, action potential morphology and fibrosis were correlated with, and graded by, frailty.
This study shows that mice of the same chronological age have quantifiable differences in health status that impact heart rate and SAN function and that these differences in health status can be identified using our frailty index.
Abstract
Sinoatrial node (SAN) dysfunction increases with age, although not all older adults are affected in the same way. This is because people age at different rates and individuals of the same chronological age vary in health status from very fit to very frail. Our objective was to determine the impacts of age and frailty on heart rate (HR) and SAN function using a new model of frailty in ageing mice. Frailty, which was quantified in young and aged mice using a frailty index (FI), was greater in aged vs. young mice. Intracardiac electrophysiology demonstrated that HR was reduced whereas SAN recovery time (SNRT) was prolonged in aged mice; however, both parameters showed heteroscedasticity suggesting differences in health status among mice of similar chronological age. Consistent with this, HR and corrected SNRT were correlated with, and graded by, FI score. Optical mapping of the SAN demonstrated that conduction velocity (CV) was reduced in aged hearts in association with reductions in diastolic depolarization (DD) slope and action potential (AP) duration. In agreement with in vivo results, SAN CV, DD slope and AP durations all correlated with FI score. Finally, SAN dysfunction in aged mice was associated with increased interstitial fibrosis and alterations in expression of matrix metalloproteinases, which also correlated with frailty. These findings demonstrate that age‐related SAN dysfunction occurs in association with electrical and structural remodelling and that frailty is a critical determinant of health status of similarly aged animals that correlates with changes in HR and SAN function.
Keywords: aging, frailty, heart rate, sinoatrial node
Key points
Sinoatrial node (SAN) function declines with age; however, not all individuals age at the same rate and health status can vary from fit to frail.
Frailty was quantified in young and aged mice using a non‐invasive frailty index so that the impacts of age and frailty on heart rate and SAN function could be assessed.
SAN function was impaired in aged mice due to alterations in electrical conduction, changes in SAN action potential morphology and fibrosis in the SAN.
Changes in SAN function, electrical conduction, action potential morphology and fibrosis were correlated with, and graded by, frailty.
This study shows that mice of the same chronological age have quantifiable differences in health status that impact heart rate and SAN function and that these differences in health status can be identified using our frailty index.
Abbreviations
- ANP
atrial natriuretic peptide
- AP
action potential
- APD
action potential duration
- cSNRT
corrected sinoatrial node recovery time
- CTGF
connective tissue growth factor
- CV
conduction velocity
- DD
diastolic depolarization
- FI
frailty index
- HCN4
hyperpolarization‐activated cyclic nucleotide gated channel 4
- HR
heart rate
- MMP
matrix metalloproteinase
- SAN
sinoatrial node
- SND
sinoatrial node dysfunction
- SNRT
sinoatrial node recovery time
- TGFβ
transforming growth factor β
- TIMP
tissue inhibitor of metalloproteinase
Introduction
Heart rate (HR), which is a major determinant of cardiovascular performance, is determined by the intrinsic activity of the sinoatrial node (SAN) – the pacemaker of the heart (Mangoni & Nargeot, 2008; Lakatta et al. 2010; Fedorov et al. 2012). The SAN is located in the intercaval region (i.e. between the superior vena cava and the inferior vena cava) in the right atrium, adjacent to the crista terminalis (Dobrzynski et al. 2007). It contains specialized pacemaker myocytes that generate spontaneous action potentials (APs) (Fedorov et al. 2012). SAN myocyte APs are characterized by the presence of a diastolic depolarization (DD), which is the slow, gradual ‘phase 4’ depolarization of the membrane potential that occurs between successive APs. This DD is the fundamental feature of SAN myocytes that enables the generation of spontaneous APs (Irisawa et al. 1993; Mangoni & Nargeot, 2008; Lakatta et al. 2010).
Sick sinus syndrome, also referred to more generally as sinoatrial node dysfunction (SND), refers to conditions in which the pacemaker function of the heart is compromised due to an inability to adequately generate APs in the SAN and/or conduct electrical signals to the surrounding atrial myocardium (Adan & Crown, 2003; Dobrzynski et al. 2007; Monfredi & Boyett, 2015). SND results in atrial rates that are not sufficient to meet physiological requirements. Clinical symptoms of SND include bradycardia, fatigue and syncope as well as increased occurrence of supraventricular tachyarrhythmias such as atrial fibrillation and atrial flutter (Monfredi & Boyett, 2015).
SND increases in prevalence during ageing and is common in older adults as demonstrated by the decline in intrinsic HR seen in aged individuals (Lakatta & Levy, 2003; Dobrzynski et al. 2007; Monfredi & Boyett, 2015; Alfaras et al. 2016). SND affects 1 in 600 patients over the age of 65 years and is the most common reason for artificial pacemaker implantation (Dobrzynski et al. 2007; Monfredi & Boyett, 2015). The cellular and molecular basis for the increase in SND in aged populations is not well understood.
While it is clear that SND is common in older adults (Dobrzynski et al. 2007) it is important to realize that individuals do not age at the same rate and chronological age is not necessarily the same as biological age. This is because as people age they accumulate health deficits that manifest as frailty (Searle et al. 2008). Since deficits can accumulate at different rates, and for different reasons, individuals of similar chronological age can vary in health status from very fit to very frail. Frailty is an important clinical challenge as it increases the risk of adverse health outcomes in older adults (Rockwood & Mitnitski, 2007, 2011; Clegg et al. 2013). Frailty is common in patients with cardiovascular disease and frail older adults with cardiovascular disease have an increased risk of worse health outcomes, including death (McNallan et al. 2013; Singh et al. 2014). Accordingly, understanding and quantifying frailty has important implications for identifying and treating older patients affected by cardiovascular disease who may have similar ages but vary greatly in health status and prognosis.
While there are different ways of measuring frailty (de Vries et al. 2011; Heuberger, 2011), we have adopted the deficit accumulation approach (Mitnitski et al. 2001; Searle et al. 2008). The principle of this well‐validated method is to assess deficits in health, which can include signs, symptoms, diseases, disabilities and/or laboratory abnormalities, and to construct a ‘frailty index’ in which each individual's frailty index (FI) score is calculated as the proportion of deficits present in that individual. Specifically, the number of health deficits present in each individual are counted and divided by the total number of items measured so that FI scores can range from 0 (fittest/least frail, no deficits present) to 1 (least fit/most frail, all deficits present) (Rockwood et al. 2006; Rockwood & Mitnitski, 2007; Searle et al. 2008). Importantly, the specific items included in the FI are less important than ensuring a minimum number of items are included. As long as the number of variables is large enough, the variables can be randomly chosen and they will still result in very similar assessments for the risk of adverse outcomes (Rockwood & Mitnitski, 2007, 2011).
Although the biology of frailty is incompletely understood, it has been proposed that alterations at the cellular and molecular levels may ultimately give rise to the deficits that can be observed clinically (Rockwood & Mitnitski, 2011). This is an essential area of study that will help translate newly identified mechanisms of age‐related cellular dysfunction into novel clinical approaches. Accordingly, we recently developed a method for quantifying frailty in mice using a non‐invasive 31‐item FI based on deficit accumulation (Whitehead et al. 2014). These items are not direct measures of cardiovascular function per se, but rather are general measures of health status. They were chosen based on the concept that any item included in an FI should be acquired, age associated, associated with adverse outcomes and should not saturate too early during the ageing process (Rockwood & Mitnitski, 2011). Our previous work using this 31‐item FI shows that the relationships between FI score and age, including quantification of how FI score and rate of deficit accumulation each increase with age, are highly comparable in mice and humans (Whitehead et al. 2014). Thus, our clinical FI approach provides a powerful new tool for the study of age related cardiac dysfunction in an animal model.
In the present study we have used our clinical FI to investigate the impacts of age and frailty on SAN dysfunction in mice. We demonstrate that SAN dysfunction occurs in aged mice in association with both electrical and structural remodelling of the SAN. Furthermore, changes in SAN function were found to be graded by FI score. These findings demonstrate that frailty assessment facilitated the identification of individuals of differing health status and that changes in SAN function correlate with FI score (i.e. health status of the individual) regardless of chronological age.
Methods
Ethical approval
This study used young (mean ± SEM; 13.7 ± 0.4 weeks; n = 77) and aged (101.8 ± 1.0 weeks; n = 109) male C57BL/6 mice. Mice were purchased at 3–4 weeks of age and housed in our animal care facility until used experimentally. All experimental procedures were approved by the Dalhousie University Committee for Laboratory Animals and followed the guidelines of the Canadian Council on Animal Care.
Frailty assessment
Frailty was assessed in all mice immediately prior to experimental use. This was done using our non‐invasive 31‐item frailty index, which is based on established clinical signs of health deterioration in mice (Whitehead et al. 2014; Feridooni et al. 2015). Clinical assessments of the integument, musculoskeletal, vestibulocochlear/auditory, ocular, nasal, digestive, urogenital and respiratory systems were made. We also assessed mice for signs of discomfort and measured body surface temperature and body mass. Each of the 31 items that were assessed is listed in our frailty assessment form (Fig. 1). To score deficit accumulation, each trait was given a score of 0 (no sign of deficit), 0.5 (mild deficit) or 1 (severe deficit). Deficits in body mass and body temperature for young mice were scored based on deviation from the mean of young mice while deficits in body mass and body temperature for the aged mice were scored based on deviation from the mean of the aged mice (Whitehead et al. 2014). For each animal, the scores for each trait were summed and the total was divided by the number of items measured (i.e. 31) to provide a FI score between 0 (least frail) and 1 (most frail). Experiments were blinded so individuals performing functional measurements did not know the FI score of the mice until after data were analysed.
Figure 1. Mouse frailty assessment form .
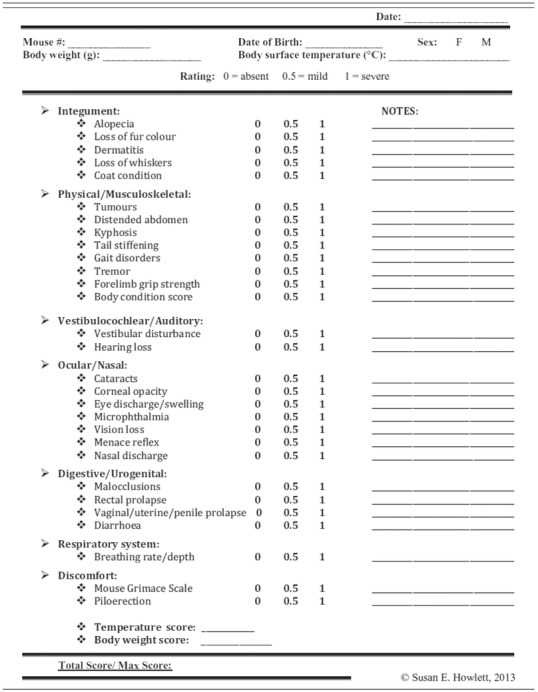
This figure was previously published as a table in Whitehead et al. (2014).
In vivo electrophysiology and programmed stimulation
HR was measured in anaesthetized mice (2% isoflurane inhalation) using 30 gauge subdermal needle electrodes (Grass Technologies, West Warwick, RI, USA) to record body surface (lead II) ECGs. In parallel, a 1.2 French octapolar electrophysiology catheter was inserted in the right heart via the jugular vein and used for intracardiac programmed stimulation experiments, as we have described previously (Egom et al. 2015; Krishnaswamy et al. 2015). Correct catheter placement was ensured by obtaining a sole ventricular signal in the distal lead and a predominant atrial signal in the proximal lead. All stimulation pulses were given at 0.4 mA for 2 ms, which enabled continuous capture and drive of cardiac conduction. Sinoatrial node recovery time (SNRT) was measured by delivering a 12 stimulus drive train at a cycle length of 100 ms. SNRT is defined as the time between the last stimulus in the drive train and the occurrence of the first spontaneous atrial beat (P wave). SNRT was corrected for heart rate (cSNRT) by subtracting the prestimulus RR interval from the measured SNRT. Data were acquired using a Gould ACQ‐7700 amplifier and Ponemah Physiology Platform software (Data Sciences International, St. Paul, MN, USA). Body temperature was monitored continuously via a rectal probe and maintained at 37°C with a heating pad.
High resolution optical mapping
To investigate patterns of electrical conduction in the SAN we used high resolution optical mapping in atrial preparations as we have described previously (Egom et al. 2015; Hua et al. 2015; Krishnaswamy et al. 2015). Mice were anaesthetized by isoflurane inhalation and killed by cervical dislocation. Hearts were excised into Krebs solution (35°C) containing (in mm): 118 NaCl, 4.7 KCl, 1.2 KH2PO4, 12.2 MgSO4, 1 CaCl2, 25 NaHCO3, 11 glucose and bubbled with 95% O2–5% CO2 in order to maintain a pH of 7.4. The atrial preparation was superfused continuously with Krebs solution (37°C) bubbled with 95% O2–5% CO2 and allowed to equilibrate for at least 30 min. During this time the preparation was treated with the voltage sensitive dye di‐4‐ANEPPS (10 μm) and blebbistatin (10 μm) was added to the superfusate to suppress contractile activity (Farman et al. 2008; Fedorov et al. 2010). Blebbistatin was present throughout the duration of the experiments in order prevent motion artifacts during optical mapping. Experiments were performed in sinus rhythm so that the cycle length (i.e. beating rate) of the atrial preparation was free to change. In some studies we also used a pacing electrode to pace atrial preparations at a fixed cycle length of 125 ms in order to study electrical conduction independently of changes in cycle length. The pacing electrode was placed near the opening of the superior vena cava.
Di‐4‐ANEPPS‐loaded atrial preparations were illuminated with light at a wavelength of 520–570 nm using an EXFO X‐cite fluorescent light source (Lumen Dynamics, Mississauga, ON, Canada). Emitted fluorescent light (590–640 nm) was captured using a high speed EMCCD camera (Evolve 128, Photometrics, Tucson, AZ, USA). We mapped conduction in the region of the right atrial posterior wall around the point of initial electrical excitation, which corresponds to the activation of the SAN (Glukhov et al. 2010; Fedorov et al. 2012; Azer et al. 2014). The region that was mapped extended from the superior vena cava to the inferior cava along the edge of the crista terminalis, based on the known anatomical location of the SAN in the mouse heart (Liu et al. 2007). In these studies the spatial resolution of each pixel was 50 μm × 50 μm and data were acquired at 900 frames s−1 using Metamorph software (Molecular Devices, Sunnyvale, CA, USA). Magnification was similar in all experiments and no pixel binning was used.
The location of the leading pacemaker site was assessed in all hearts. Shifts in leading pacemaker site were quantified using a grid in which the vertical axis was placed parallel, and just adjacent to the crista terminalis. The horizontal axis was placed along the edge of the opening of the inferior vena cava, perpendicular to the vertical axis.
All optical data were analysed using custom software written in MATLAB. Analyses included pseudocolour electrical activation maps, which were generated from measurements of activation time at individual pixels. In each case background fluorescence was subtracted. Local conduction velocity (CV) was quantified specifically in the SAN around the site of initial electrical activation in the right atrial posterior wall using an approach previously described by us and others (Morley et al. 1999; Nygren et al. 2004; Azer et al. 2014). Briefly, activation times at each pixel from a 7 × 7 pixel array were determined and fitted to a plane using the least squares fit method. The direction on this plane that is increasing the fastest represents the direction that is perpendicular to the wavefront of electrical propagation and the maximum slope represents the inverse of the speed of conduction in that direction. Using this method we computed maximum local CV vectors in the SAN around the leading pacemaker site. With pixel dimensions of 50 μm × 50 μm, the area of the 7 × 7 pixel array was 350 μm × 350 μm, which is within the anatomical area of the mouse SAN (Liu et al. 2007). Optical action potential data were obtained by measuring changes in fluorescence as a function of time at individual pixels within the SAN as we have described previously (Azer et al. 2014; Egom et al. 2015).
Collagen staining and collagen assay
Interstitial collagen was assessed using picrosirius red (collagen) and fast green (myocardium) staining of paraffin embedded sections (3 μm) through the SAN region (intercaval region of the right atrial posterior wall adjacent to the crista terminalis). We confirmed that these sections were from the SAN region based the expression of hyperpolarization‐activated cyclic nucleotide gated channel 4 (HCN4) and atrial natriuretic peptide (ANP) in tissue samples taken from the same region for quantitative PCR studies (see below). The level of fibrosis was quantified using ImageJ software as previously described (Egom et al. 2015; Krishnaswamy et al. 2015).
Total collagen content was measured using a hydroxyproline assay (Sigma‐Aldrich, St. Louis, MO, USA) according to kit instructions. These assays were performed on the whole right atrium, including the SAN region of the right atrial posterior wall, because the SAN region by itself did not yield sufficient tissue to run the assay.
Quantitative PCR
Quantitative gene expression in the SAN was performed as we described previously (Hua et al. 2012; Springer et al. 2012). Intron spanning primers (Sigma‐Aldrich, St. Louis, MO, USA, Invitrogen, Burlington, ON, Canada) were designed for collagen I (col1a), collagen III (col3a), matrix metalloproteinase 2 (MMP2), MMP9, tissue inhibitor of metalloproteinase 1 (TIMP1), TIMP2, TIMP3, TIMP4, transforming growth factor β (TGFβ) and connective tissue growth factor (CTGF). β‐Actin (Actb) and GAPDH were used as reference genes. HCN4 and ANP expression were used to confirm samples were from the SAN as we have described previously (Hua et al. 2012; Springer et al. 2012). Specifically, HCN4 expression is high in the SAN compared to the right atrium while ANP expression is high in the right atrium compared to the SAN. All primer sequences are provided in Table 1.
Table 1.
Quantitative PCR primers
| Gene of interest | Forward primer (5′ → 3′) | Reverse primer (5′ → 3′) | Amplicon length (bp) |
|---|---|---|---|
| TIMP1 | CAGATACCATGATGGCCCCC | CGCTGGTATAAGGTGGTCTCG | 190 |
| TIMP2 | CCAGAAGAAGAGCCTGAACCA | GTCCATCCAGAGGCACTCATC | 112 |
| TIMP3 | GGCCTCAATTACCGCTACCA | CTGATAGCCAGGGTACCCAAAA | 135 |
| TIMP4 | TGCAGAGGGAGAGCCTGAA | GGTACATGGCACTGCATAGCA | 80 |
| MMP2 | CCACGTGACAAGCCCATGGGGCCC | GCAGCCTAGCCAGTCGGATTTGATG | 486 |
| MMP9 | TCGCGTGGATAAGGAGTTCTC | ATGGCAGAAATAGGCTTTGTCTTG | 82 |
| TGFβ1 | CGAGGTGACCTGGGCACCATCCATGAC | CTGCTCCACCTTGGGCTTGCGACCCAC | 405 |
| CTGF | TCCCGAGAAGGGTCAAGCT | TCCTTGGGCTCGTCACACA | 222 |
| Col1a | GCGGACTCTGTTGCTGCTTGC | GACCTGCGGGACCCCTTTGT | 125 |
| Col3a | AGATCCGGGTCCTCCTGGCATTC | CTGGTCCCGGATAGCCACCCAT | 194 |
| GAPDH | AATGGGGTGAGGCCGGTGCT | CACCCTTCAAGTGGGCCCCG | 87 |
| β‐Actin | AGCCATGTACGTAGCCATCC | TCTCAGCTGTGGTGGTGAAG | 227 |
| HCN4 | CCAGGAGAAGTATAAACAGGTGGAGCG | GTTGATGATCTCCTCTCGAAGTGGCTC | 169 |
| ANP | CAAGAACCTGCTAGACCACCTGGAG | AGAGGTGGGTTGACCTCCCCAGTCC | 153 |
Following synthesis primers were reconstituted in nuclease free water at a concentration of 100 nm and stored at −20°C. All primer sets were validated in order to determine the optimal annealing temperature as well as confirmation of ideal amplification efficiency (between 90 and 110% copy efficiency per cycle).
RNA was extracted in PureZOL RNA isolation reagent according to kit instructions (Aurum Total RNA Fatty and Fibrous Tissue Kit, Bio‐Rad, Mississauga, ON, Canada). RNA was eluted in 40 μl of elution buffer from the spin column. RNA concentrations were determined using a Qubit fluorometer (Invitrogen) and first strand synthesis reactions were performed using the iScript cDNA synthesis kit (Bio‐Rad) according to kit instructions. The Experion Automated Electrophoresis System (Bio‐Rad) was used to assess RNA quality by observing the 28S and 18S rRNA subunits prior to first strand synthesis. Lack of genomic DNA contamination was verified by reverse transcription (RT)‐PCR using a no RT control.
Quantitative reverse transcription PCR (RT‐qPCR) using BRYT green dye (Promega, Madison, WI, USA) was used to assess gene expression. Following RNA extraction, cDNA was synthesized and 10 μl reactions were performed with 5.6 μl of BRYT green dye, 4 μl cDNA template (at the appropriate dilution), and 0.4 μl of primers. Primers were used at a concentration of 10 nm. Reactions were carried out using the CFX384 Touch Real‐Time PCR Detection System (Bio‐Rad). Amplification conditions were as follows: 95°C for 2 min to activate Taq polymerase, followed by 39 cycles of denaturation at 95°C for 15 s, annealing at 60°C for 30 s, and extension at 72°C for 30 s. Melt curve analysis was performed from 65 to 95°C in 0.5°C increments. Single amplicons with appropriate melting temperatures and sizes were detected. Data were analysed using the method by which the expression values are determined relative to an internal control and normalized to both GAPDH and β‐actin.
Statistical analysis
Data are presented as box and whisker plots or means ± standard error of the mean (SEM). Data were analysed using Student's t test, Mann–Whitney rank sum test, two‐way ANOVA with Tukey's post hoc test or Fisher's exact test, as indicated in each figure legend, to detect differences in young vs. aged mice. To assess differences as a function of frailty we performed linear regression analysis and used Pearson's correlation to obtain correlation coefficients. P < 0.05 was considered significant.
Results
Assessment of frailty in mice
Initially, an FI score was generated for each individual mouse using our recently developed non‐invasive FI for mice (Whitehead et al. 2014; Feridooni et al. 2015). The mean FI score was 0.11 ± 0.04 in the young mice and 0.25 ± 0.05 in the aged mice (P < 0.001; Fig. 2). These data demonstrate that mice of similar chronological age have a range of FI scores (i.e. differences in health status), which can be quantified using our FI. Note that while, on average, aged mice were more frail than young mice there is overlap in FI score between young and aged mice (i.e. the highest FI scores in the young mice overlapped with the lowest FI scores in the aged mice).
Figure 2. Relationship between age and frailty in mice .
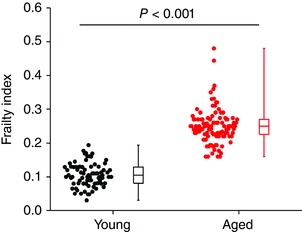
Two groups of male C57BL/6 mice were used in this study including a group of young mice with a mean age of 13.7 ± 0.4 weeks (n = 77) and a group of aged mice with a mean age of 101.8 ± 1.0 weeks (n = 109). Graph shows the summary of differences in FI score between young and aged mice. Data analysed using Student's t test.
Effects of age and frailty on sinoatrial node function
An age‐dependent decline in HR and intrinsic SAN function is known to occur (Monfredi & Boyett, 2015), including in mice (Larson et al. 2013); however, how HR and SAN function are impacted by frailty is not known. Accordingly, we began by measuring HR and cSNRT using intracardiac programmed stimulation in anaesthetized young and aged mice (Fig. 3 A). HR was reduced (P < 0.001) in aged mice in comparison to young mice (Fig. 3 B). Consistent with this, cSNRT, which is a direct measure of SAN function, was prolonged (P < 0.001) in aged mice (Fig. 3 C). Interestingly, we observed a high degree of variability within age groups such that HR and cSNRT can vary greatly in mice of similar chronological age. Furthermore, the data in Fig. 3 B and C demonstrate that the variability in both HR and cSNRT is much larger in the aged mice, which suggests that there are factors other than chronological age that impact HR and SAN function. To determine how this heteroscedasticity was impacted by frailty, HR in each individual animal (young animals shown in black and aged shown in red as in the box plots in panels B and C) was plotted as a function of each animal's FI score. These data demonstrate that HR was negatively correlated (P = 0.02) with frailty whereby HR decreased as the FI score increased (Fig. 3 D). Similarly, cSNRT was also correlated with frailty (P < 0.001) such that cSNRT increased with increasing FI scores (Fig. 3 E). These analyses demonstrate that HR and cSNRT were graded with FI score and that HR and cSNRT fall along a continuum when measured as a function of frailty (i.e. health status).
Figure 3. Effects of age and frailty on heart rate and sinoatrial node function in anaesthetized mice .
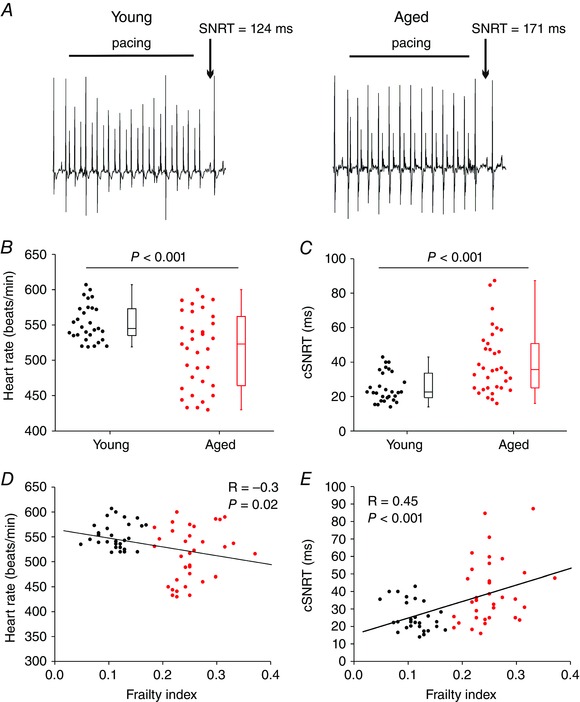
A, representative ECG recordings during programmed electrical stimulation in a young mouse and an aged mouse. Sinoatrial node recovery time (SNRT) was measured as described in the Methods. B, summary of differences in HR between young and aged mice. C, summary of differences in corrected SNRT (cSNRT) between young and aged mice. Data in B and C analysed by Mann–Whitney rank sum test; n = 29 young and 34 aged mice. D, linear regression analysis of HR as a function of FI for the same mice as used in B. For this and all subsequent linear regression analysis plots the young mice are represented by black circles and the aged mice are represented by red circles. E, linear regression analysis of cSNRT as a function of FI for the same mice as used in C. HR and cSNRT were graded by FI; for D and E, n = 63 mice; correlation coefficients obtained using Pearson's correlation.
To further assess intrinsic SAN function in vivo we next measured HR following application of atropine and propranolol to block muscarinic and β‐adrenergic receptors, respectively (Fig. 4). This enables an assessment of HR due to intrinsic SAN function, independently of the autonomic nervous system (Rose et al. 2007; Egom et al. 2015; Krishnaswamy et al. 2015). Representative surface ECGs (Fig. 4 A) and summary data (Fig. 4 B) demonstrate that application of atropine and propranolol decreased (P < 0.001) HR in young and aged mice and that HR was lower (P = 0.006) in the aged mice at baseline and after autonomic blockade. Consistent with the data in Fig. 3, scatter plots of HR as a function of FI score demonstrate that HR is graded as a function of frailty at baseline (P = 0.003; Fig. 4 C) and after autonomic blockade (P = 0.05; Fig. 4 D) further demonstrating that HR and SAN function decrease as frailty increases.
Figure 4. Effects of age and frailty on heart rate following autonomic nervous system blockade in anaesthetized mice .
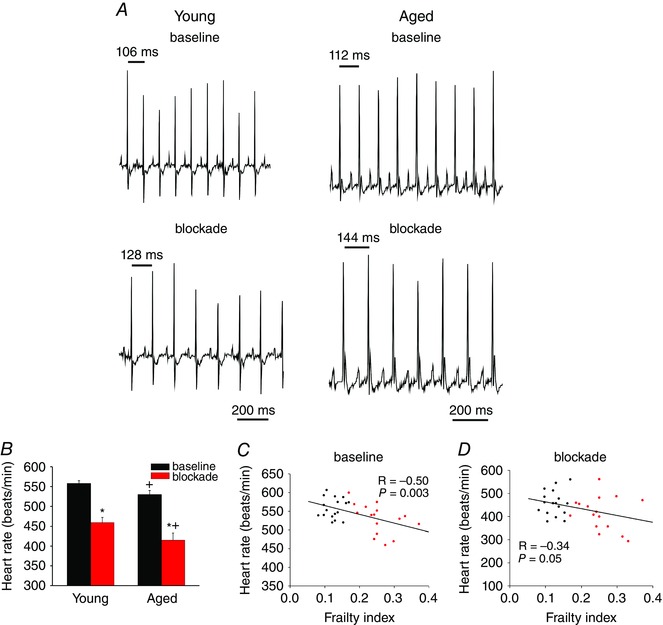
A, representative ECG recordings at baseline and following intraperitoneal injection of atropine (10 mg kg−1) and propranolol (10 mg kg−1) to block the autonomic nervous system. B, summary of the effects of atropine and propranolol (blockade) on HR in young and aged mice. * P < 0.05 vs. baseline, + P < 0.05 vs. young by two‐way ANOVA with Tukey's post hoc test; n = 17 young and 16 aged mice. C and D, linear regression analysis of HR as a function of FI at baseline (C) and after autonomic blockade (D) for the same mice as used in B (n = 33; correlation coefficients obtained using Pearson's correlation).
Impacts of age and frailty on electrical conduction and activation patterns in the sinoatrial node
To investigate how age and frailty impact patterns of electrical conduction in the SAN we used high resolution optical mapping in intact atrial preparations (Fig. 5 A) in which we can map electrical activation and propagation from the SAN within the right atrial posterior wall, as we have described previously (Azer et al. 2014; Egom et al. 2015; Krishnaswamy et al. 2015). Representative activation maps for young and aged hearts (Fig. 5 B) in sinus rhythm demonstrate that the aged heart had an inferior leading pacemaker site adjacent to the crista terminalis within the right atrial posterior wall and a slower conduction time than the young heart which had a leading pacemaker site in the superior region of the right atrial posterior wall near the opening of the superior vena cava.
Figure 5. Effects of age and frailty on patterns of electrical conduction in mice .
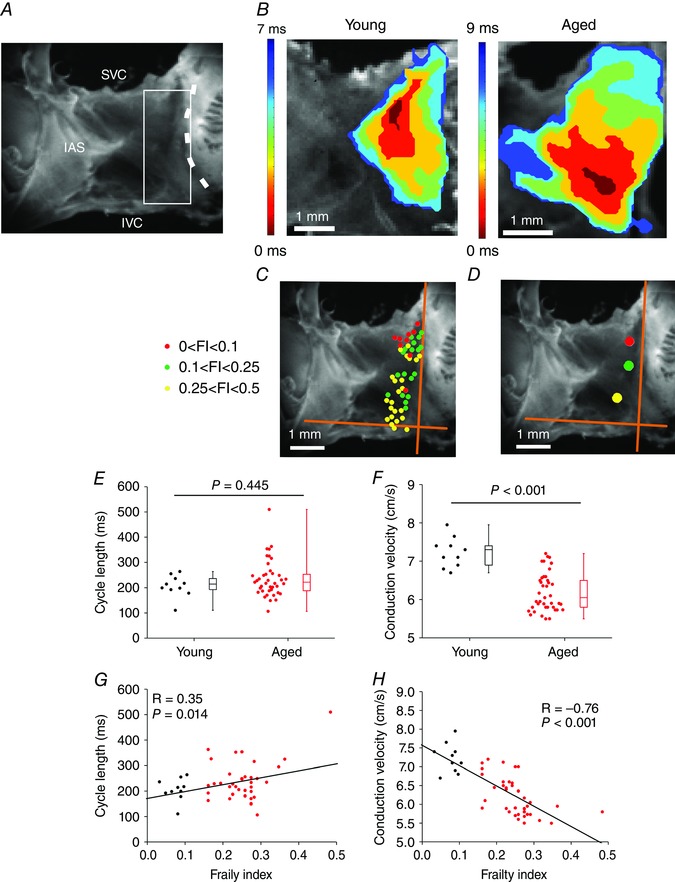
A, mouse atrial preparation used for optical mapping experiments. The heart is positioned such that the right atrium is on the right side of the image. SVC, opening of the superior vena cava; IVC, opening of the inferior vena cava; IAS, interatrial septum. The dashed line indicates the crista terminalis (CT). The sinoatrial node (SAN) is located in the intercaval region of the right atrial posterior wall, adjacent to the CT. The white box indicates the typical area that was mapped. B, representative activation maps in atrial preparations from a young mouse and an aged mouse. Red colour indicates earliest activation time in the SAN within the right atrium. Time interval between isochrones is 1.2 ms for the young map and 1.5 ms for the aged map. C, location of the leading pacemaker site within the right atrial posterior wall for all hearts used in this experiment. Colours represent three different FI ranges as indicated. Orange axes were placed adjacent to the crista terminalis and along the opening of the inferior vena cava. D, average location of leading pacemaker site as a function of FI range. These values were obtained by measuring, and averaging, the distances from the intersection of the orange axes for each heart depicted in C. E and F, summary of the effects of age on cycle length (E) and SAN conduction velocity (F). Data analysed using Mann–Whitney rank sum test; n = 10 young and 40 aged mice. G and H, linear regression analysis of cycle length (G) and SAN conduction velocity (H) as a function of FI (n = 50 mice; correlation coefficients obtained using Pearson's correlation).
To accurately assess activation patterns we mapped the location of the leading pacemaker site for all hearts according to three FI score ranges (low: 0–0.1; intermediate: 0.1–0.25; high: 0.25–0.5). These data (Fig. 5 C) demonstrate that all hearts showed a leading pacemaker site adjacent to the crista terminalis within the right atrial posterior wall and that these were distributed across the right atrial posterior wall from superior to inferior regions of the preparation. It is evident from these data that the least frail hearts (i.e. FI score less than 0.1) primarily showed superior leading pacemaker sites whereas the most frail hearts (i.e. FI score greater than 0.25) tended to have more inferior leading pacemaker sites. Hearts with FI scores between 0.1 and 0.25 showed a mixture of superior and inferior leading pacemaker sites. These observations are further demonstrated in Fig. 5 D where the distance from the intersection of a set of axes (placed adjacent to the crista terminalis and along the edge of the inferior vena cava) for each leading pacemaker site was measured and averaged for each range of FI. These measurements indicate that the location of the leading pacemaker site within the right atrial posterior wall is affected by the health status of the individual (i.e. frailty).
Next, we quantified the effects of age and frailty on cycle length in atrial preparations. Cycle length was slightly higher (corresponding to a lower HR) in aged mice (P = 0.445; Fig. 5 E), but showed substantial variability, particularly in the aged mice. We also measured local conduction velocity (CV) within the SAN as we have described previously (Azer et al. 2014; Krishnaswamy et al. 2015). These data demonstrate that SAN CV was lower (P < 0.001) in aged hearts compared to young hearts (Fig. 5 F) but was also highly variable. Importantly, and consistent with our in vivo findings, cycle length was clearly correlated (P = 0.014) with FI score such that cycle length increased as FI score increased and was graded by frailty (Fig. 5 G). Similarly, the reduction in SAN CV was negatively graded and correlated with increasing FI score (P < 0.001; Fig. 5 H), once again showing that frailty analysis enabled us to discriminate changes in SAN activity as a function of differences in health status separately from chronological age. We also measured changes in SAN CV in atrial preparations that were paced at a fixed cycle length of 125 ms in order to account for the possibility of rate dependent effects. These experiments (Fig. 6) demonstrate very comparable results to those obtained for atrial preparations in sinus rhythm. Note that overall, SAN CVs are low (i.e. less than 10 cm s−1) as expected for the SAN (Verheijck et al. 2001; Fedorov et al. 2006; Azer et al. 2014). Collectively, these data demonstrate that SAN function decreases with increasing FI score.
Figure 6. Effects of age and frailty on sinoatrial node conduction velocity in paced atrial preparations .
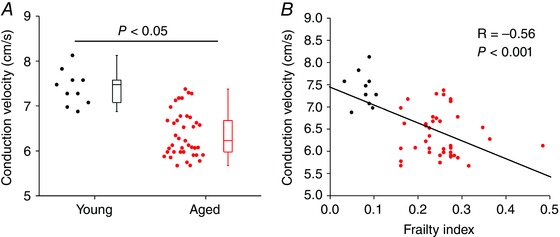
Atrial preparations were paced at a fixed cycle length of 125 ms. A, summary of the effects of age on SAN conduction velocity. Data analysed using Mann–Whitney rank sum test; n = 10 young and 40 aged mice. B, linear regression analysis of SAN conduction velocity as a function of FI (n = 50 mice).
In some instances we observed beat to beat variability in the location of the leading pacemaker site within the same heart. An example of this is shown in representative activation maps from two consecutive beats from the same heart in Fig. 7 A. In this example the first activation map shows a leading pacemaker site in the superior region of the preparation and a conduction time of 11 ms. The second activation map demonstrates that the leading pacemaker site shifted towards the inferior region of the preparation and had a slower conduction time of 14 ms. Figure 7 B shows the leading pacemaker sites for all hearts that had more than one activation site, grouped according to FI score. Different leading pacemaker sites within a given heart are connected by lines. The magnitudes of the shifts in leading pacemaker site for each heart are quantified in Fig. 7 C. These data demonstrate that in the majority of cases leading pacemaker sites shifted between superior and inferior locations along the border of the crista terminalis; however, in some cases lateral shifts towards the inferior region of the interatrial septum and the septal leaflet of tricuspid valve were also observed. Quantification of these data showed that more aged hearts had multiple activation sites in comparison to young hearts (38% vs. 10%); however, this was not statistically significant (P = 0.142; Fig. 7 D). In contrast, analysing these data as a function of frailty illustrates that multiple activation sites were more prevalent (P < 0.05) in hearts from the two higher FI score ranges compared to hearts with FI scores less than 0.1 (Fig. 7 E). Note that hearts showing more than one activation site were also included in the analysis in Fig. 5. In these cases only the superior activation site adjacent to the crista terminalis was included.
Figure 7. Beat to beat variability in leading pacemaker site .
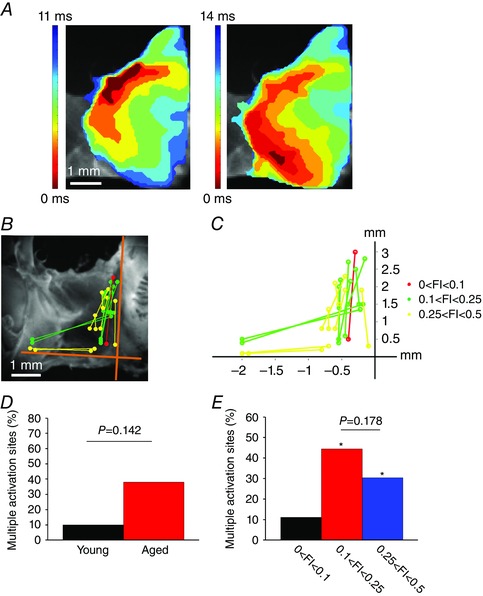
A, representative activation maps from two consecutive heart beats in the same heart showing variability in the location of the leading pacemaker site (as indicated by the red colour at 0 ms). In this example, the leading pacemaker site shifted between superior (left) and inferior (right) locations. Time interval between isochrones is 1.4 ms. Scale bar is the same for both maps. B, location of leading pacemaker sites in all hearts that showed more than one activation site. Distinct leading pacemaker sites for each individual heart are connected by lines. Colours represent three different FI ranges as indicated. C, quantification of the magnitude of shifts in leading pacemaker site in hearts showing more than one activation site. D, percentage of hearts (young vs. aged) that showed multiple activation sites. Data analysed using Fisher's exact test. E, percentage of hearts showing multiple activation sites as a function of FI. * P < 0.05 vs. lowest FI group (black bar). Data analysed using Fisher's exact test.
Effects of age and frailty on sinoatrial node action potential morphology
We next measured the effects of age and frailty on optical action potential (AP) morphology in the SAN. As expected, SAN APs occurred spontaneously and were characterized by a diastolic depolarization (DD) between successive APs (Mangoni & Nargeot, 2008; Azer et al. 2014; Egom et al. 2015) (Fig. 8 A). Quantitative analysis demonstrates that the DD slope was reduced (P = 0.002) in the SAN of aged mice (Fig. 8 B). We also measured AP duration at 50% (APD50) and 70% (APD70) repolarization. These analyses illustrate that while APD50 tended to be shorter (P = 0.08; Fig. 8 C), APD70 was reduced (P = 0.004; Fig. 8 D) in aged hearts. Once again, there was variability in the magnitude of these parameters, especially in DD slope, in mice of similar chronological age. Furthermore, this variability was much greater in the aged mice compared to the young mice. When analysed by FI score, we found that DD slope (P < 0.001), APD50 (P = 0.001) and APD70 (P = 0.003) were all negatively correlated with, and graded by, frailty (Fig. 8 E–G). Thus, frailty analysis enabled us to identify alterations in SAN AP morphology as a function of differences in health status separately from chronological age.
Figure 8. Effects of age and frailty on sinoatrial node action potential morphology .
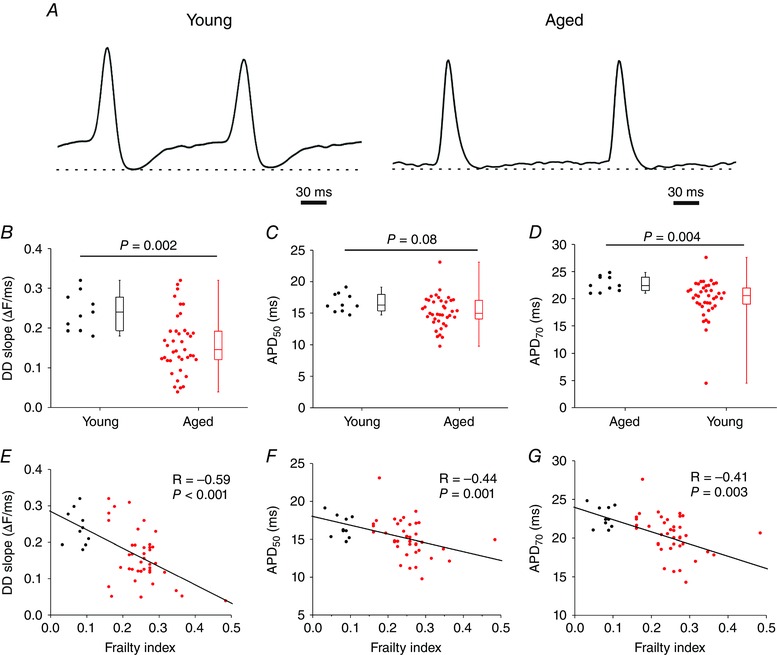
A, representative optical APs from a young heart and an aged heart. Optical APs were measured in the region of the leading activation site in the right atrial posterior wall. Dashed lines are shown through the maximum diastolic potential. Note the presence of a diastolic depolarization between successive APs. B–D, summary of the effects of age on DD slope (B), APD50 (C) and APD70 (D). Data analysed using Student's t test (B and C) or Mann–Whitney rank sum test (D); n = 10 young and 40 aged hearts. E and F, correlations between DD slope (E), APD50 (F) and APD70 (G) as a function of FI (n = 50 hearts, correlation coefficients obtained using Pearson's correlation).
Effects of age and frailty on interstitial fibrosis in the sinoatrial node
Structural remodelling due to fibrosis is known to contribute to changes in electrical conduction in the heart, including in the SAN (Glukhov et al. 2010; Miragoli & Glukhov, 2015); therefore, we assessed patterns of interstitial fibrosis in the intercaval region of the right atrial posterior wall adjacent to the crista terminalis (i.e. the SAN region). These tissue sections were confirmed to contain the SAN because tissue samples isolated from this region of the heart for quantitative PCR studies (see below) demonstrate a pattern of gene expression (high expression of HCN4 and low expression of ANP) that is characteristic of the SAN, but not the atrium, as we and others have shown previously (Liu et al. 2007; Hua et al. 2012; Springer et al. 2012). Representative histological images (Fig. 9 A) of picrosirius red stained sections, and quantification of these images, illustrate an increase (P < 0.001) in interstitial fibrosis in the SAN of aged vs. young hearts (Fig. 9 B). Furthermore, this increase in SAN interstitial fibrosis was positively correlated (P = 0.02) with, and graded by, the FI score (Fig. 9 C).
Figure 9. Effects of age and frailty on interstitial fibrosis and collagen production in the sinoatrial node .
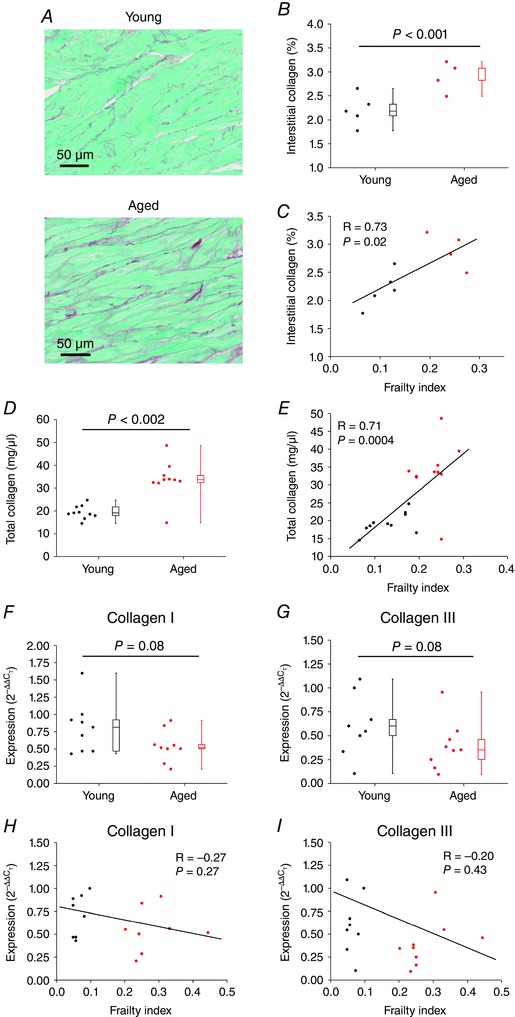
A, representative images demonstrating patterns of interstitial collagen deposition (red colour) in the right atrial posterior wall (intercaval region adjacent to the crista terminalis) from young and aged hearts. B, quantification of fibrosis from histological sections as depicted in A. Data analysed using Student's t test; n = 5 young and 4 aged hearts. C, linear regression analysis of interstitial collagen in the SAN region as a function of FI (n = 9 hearts). D, effects of age on total collagen content in the right atrium by hydroxyproline assay. Data analysed using a Mann–Whitney rank sum test; n = 10 young and 10 aged hearts. E, correlation between total collagen content in the right atrium and FI (n = 20 hearts; correlation coefficient obtained using Pearson's correlation). F and G, quantitative mRNA expression of collagen I (F) and collagen III (G) in the SAN of young and aged mice. Data analysed using Student's t test; n = 9 young and 8 aged hearts. H and I, correlation between SAN expression of collagen I (H) and collagen III (I) expression and FI (n = 17 hearts; correlation coefficient obtained using Pearson's correlation).
Collagen content was further quantified using hydroxyproline assays. Due to the very small size of the SAN region, which did not yield sufficient tissue, these assays were performed on the whole right atrium. Analysis demonstrates that total collagen content in the right atrium was increased (P = 0.002) in aged hearts (Fig. 9 D) and that collagen content was positively correlated (P = 0.0004) with FI score (Fig. 9 E).
To determine if increased fibrosis in the SAN of aged and frail hearts was associated with changes in active collagen production we measured the mRNA expression of collagen type I and collagen type III (the predominant interstitial collagens in the myocardium; Kassiri & Khokha, 2005) in the SAN. Neither collagen I (P = 0.08; Fig. 9 F) nor collagen III (P = 0.08; Fig. 9 G) showed any differences in expression in the SAN of aged vs. young hearts. Similarly, neither collagen I (P = 0.27; Fig. 9 H) nor collagen III (P = 0.43; Fig. 9 I) showed any correlation with the FI score. We also measured the mRNA expression of TGFβ and CTGF (both known to play a role in the production of collagens in the heart; Thannickal et al. 2014; Leask, 2015) in the SAN of young vs. aged hearts. These data demonstrate that there were no differences in expression of TGFβ or CTGF whether analysed by age or by FI score (Fig. 10). The tissue samples used in these qPCR experiments were confirmed to be from the SAN based on the high expression of HCN4 and low expression of ANP relative to adjacent regions from the right atrium (Fig. 11).
Figure 10. Quantitative mRNA expression of transforming growth factor β and connective tissue growth factor in the sinoatrial node .
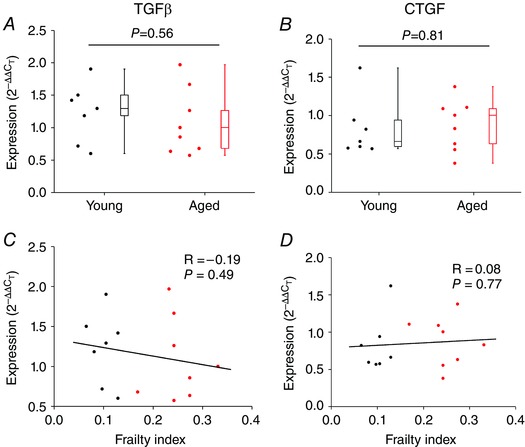
A and B, expression of TGFβ (A) and CTGF (B) in the SAN of young and aged hearts. Data analysed by Student's t test; n = 8 young and 8 aged hearts. C and D, correlation between SAN expression of TGFβ (C) and CTGF (D) and FI (n = 16 hearts, correlation coefficient obtained using Pearson's correlation).
Figure 11. Quantitative mRNA expression of HCN4 and ANP in the SAN and right atrium .
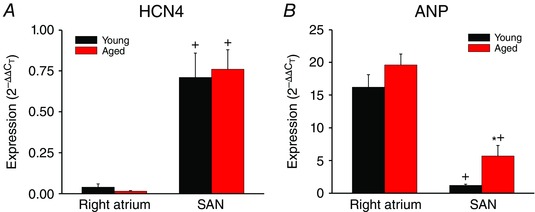
A and B, expression of HCN4 (A) and ANP (B) in the right atrium and SAN of young and aged hearts. * P < 0.05 vs. young; + P < 0.05 vs. right atrium by two‐way ANOVA with Tukey's post hoc test; n = 9 young and 8 aged hearts. These data confirm that samples used for qPCR experiments and histology were from the SAN based on the high expression of HCN4 and low expression of ANP in the SAN compared to the right atrium.
The data above demonstrate that interstitial fibrosis is increased in the SAN of aged and frail hearts, but suggest that this is not due to actively increased collagen production. Accordingly, we next considered the possibility that fibrosis in the SAN was associated with changes in regulation of the extracellular matrix by matrix metalloproteinases (MMPs) and/or tissue inhibitors of metalloproteinases (TIMPs). MMPs function to process and degrade extracellular matrix proteins, including collagens, while TIMPs act as inhibitors of MMPs (Spinale, 2002, 2007; Kassiri & Khokha, 2005; Nagase et al. 2006).
We measured the mRNA expression of MMP2 and MMP9 (gelatinases in the heart that are both known to degrade collagen type I and, in the case of MMP2, collagen type III; Kassiri & Khokha, 2005) in the SAN. MMP2 expression tended to be lower in aged hearts; however, substantial variability was evident within age groups and the differences did not reach statistical significance (P = 0.06; Fig. 12 A). In contrast, MMP2 expression showed a clear negative correlation (P = 0.02) with FI score (Fig. 12 A). MMP9 expression in the SAN was not different (P = 0.66) in young vs. aged hearts and was not correlated (P = 0.58) with FI score (Fig. 12 B). We also measured the mRNA expression of TIMP1, TIMP2, TIMP3 and TIMP4 in the SAN. These data (Fig. 12 C–F) demonstrate no significant differences in TIMP expression in the SAN as a function of age or frailty. Collectively, these experiments show that there is a reduction in MMP2 expression without changes in TIMP expression in the SAN and that frailty was better able to identify these alterations than chronological age.
Figure 12. Quantitative mRNA expression of matrix metalloproteinases (MMPs) and tissue inhibitors of metalloproteinases (TIMPs) in the SAN .
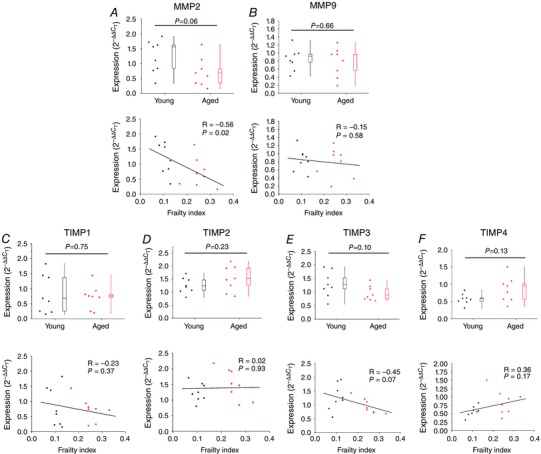
Expression of MMP2 (A), MMP9 (B), TIMP1 (C), TIMP2 (D), TIMP3 (E) and TIMP4 (F) are shown as a function of age (top panels) and FI (bottoms panels). For box and whisker plots data were analysed by Student's t test (n = 8 young and 8 aged hearts). For scatter plots correlation coefficients were obtained using Pearson's correlation; n = 16 hearts).
Since remodelling of the extracellular matrix is determined by the balance between MMP and TIMP activities we also quantified the ratios between TIMP1–4 and MMP2 (because this MMP was reduced in aged/frail hearts). These data (Fig. 13) illustrate that the ratios of TIMP2 and TIMP4 to MMP2 are increased in aged and frail mice. A reduction in MMP2 expression and/or alterations in the balance between MMP2 and TIMP activity could explain the increase in interstitial fibrosis we observed in the SAN of aged and frail hearts (see Discussion).
Figure 13. Ratios of expression of TIMPs/MMP2 in the sinoatrial node .
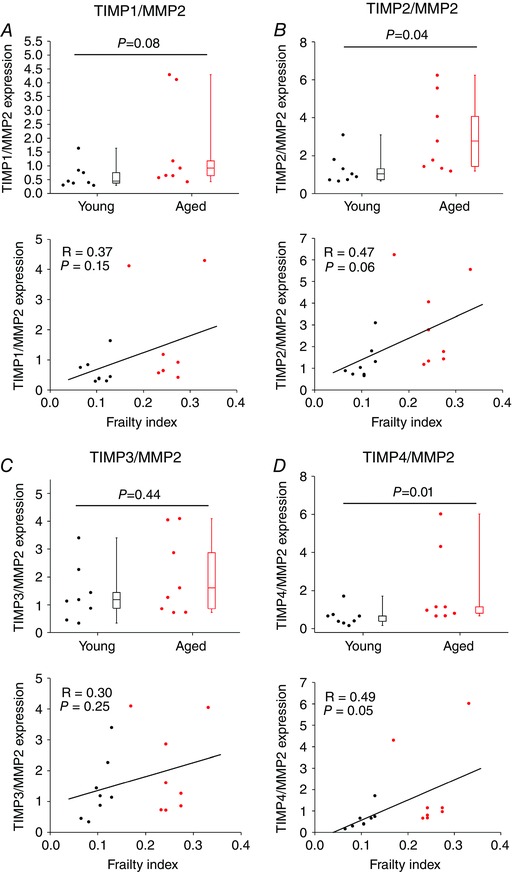
The ratio of the mRNA expression of TIMP1 (A), TIMP2 (B), TIMP3 (C) and TIMP4 (D) to the mRNA expression of MMP2 is shown as a function of age (top panels) and FI (bottom panels). For box and whisker plots data were analysed by Student's t test; n = 8 young and 8 aged hearts. For scatter plots correlation coefficients were obtained using Pearson's correlation; n = 16 hearts.
Discussion
In this study we investigated mechanisms underlying the reductions in HR and SAN function that occur in association with ageing using a mouse model. Our data demonstrate that HR was reduced in aged mice and that this is associated with a decline in intrinsic SAN function, as assessed by cSNRT and measures of HR in the presence of autonomic nervous system blockers. Collectively, these findings confirm that, as in humans, intrinsic HR is reduced in aged mice. This is also consistent with other studies in animal models of ageing (Di Gennaro et al. 1987; Jones et al. 2004; Tellez et al. 2011; Larson et al. 2013). Importantly, it is well appreciated from clinical gerontology studies that not all individuals age at the same rate and that the health status of people of the same chronological age can vary from very fit to very frail (Rockwood & Mitnitski, 2007, 2011). Consistent with this concept, our data demonstrate that HR and SAN function show substantial heteroscedasticity (i.e. there is variability in measures of SAN function in mice of similar chronological age, particularly in the aged mice). This suggests that factors other than, or in addition to, chronological age can impact SAN function.
Here we have used our novel, non‐invasive frailty index for mice (Whitehead et al. 2014) to assess changes in HR and SAN function in relation to frailty in our animal model of ageing. This approach clearly demonstrates that animals of the same chronological age can have different FI scores and that changes in HR and cSNRT are highly correlated with frailty. This is of importance based on the differences in FI scores within age groups as well as the fact that we observed overlap in FI scores between young and aged mice (i.e. young mice could have a relatively high FI score and aged mice could have a relatively low FI score). Indeed, our analysis demonstrates that mice of very different chronological ages (i.e. young vs. aged) could have very similar measures of SAN function when they had comparable FI scores. Furthermore, mice of the same chronological age could have substantial differences in SAN function, which was also correlated with FI score. Thus, our findings clearly demonstrate that frailty analysis enabled us to identify differences in health status and that measures of SAN function were highly correlated with FI score. Despite the fact that two distinct age groups were studied (and hence data as a function of age are presented as two distinct groups), frailty analysis demonstrates that HR and SAN function fall along a continuum when measured as a function of FI score. Thus, frailty analysis enabled us to demonstrate that health status impacts the decline in HR and SAN function seen in ageing populations. This has major implications for our understanding of the biology of ageing and for clinical decision making in patients who may be more or less frail and, thus, how they might be able to tolerate different interventions. Based on these observations an important question is whether age or frailty is better correlated with changes in SAN function. This could be pursued in future studies by using mice of several different chronological ages and performing frailty analysis in these different age groups.
The fundamental biology of frailty, including in the context of a decline in intrinsic SAN function, is poorly understood. Our development of a method for assessing frailty in mice opens up the opportunity to investigate the cellular and molecular mechanisms by which changes in frailty contribute to a decline in SAN function. Indeed, our recent studies have demonstrated that changes in cardiac function are linked to FI rather than age (Parks et al. 2012). Using the FI approach, we were able to demonstrate that changes in HR and SAN function are associated with electrical and structural remodelling of the SAN, both of which were highly correlated with frailty. In terms of electrical remodelling, we used high resolution optical mapping to demonstrate that SAN activation patterns and conduction are altered in aged and frail mice. Interestingly, the location of the leading pacemaker site (i.e. the point of initial electrical activation within the right atrial posterior wall) was dependent on the degree of frailty, whereby the least frail mice had, on average, a leading pacemaker site closer to the superior vena cava and the more frail mice had a leading pacemaker site that was, on average, shifted inferiorly (towards the inferior vena cava). These observations strongly suggest that the physical location of the leading pacemaker site (the region of the SAN with the highest rate of intrinsic spontaneous activity) is a critical determinant of HR in vivo and that, as frailty increases, this site shifts within the SAN. Consistent with this, it is well known that the location of the leading pacemaker site within the SAN can change in different physiological conditions, such as during changes in autonomic nervous system tone (Fedorov et al. 2006, 2010; Glukhov et al. 2010; Krishnaswamy et al. 2015) or in the presence of hormones such as natriuretic peptides (Azer et al. 2014), and that these changes in leading pacemaker site are correlated with changes in HR in vivo. While our studies of leading pacemaker site were performed in isolated preparations with no nervous system present, there is evidence that autonomic tone is also impacted by frailty (Katayama et al. 2015), suggesting that this may further contribute to changes in location of the leading pacemaker site and hence SAN function in frail older individuals.
Interestingly, in some hearts, we observed beat to beat changes in the location of the leading pacemaker site. In the majority of cases, these involved shifts between a superior site and an inferior site along the border of the crista terminalis (i.e. within the SAN). In a few instances, however, we observed lateral shifts from a location adjacent to the crista terminalis to a site near the interatrial septum and septal leaflet of the tricuspid valve. It is possible that these lateral sites are in the atrioventricular node, which is known to be located in this region of the right atrium (i.e. within the triangle of Koch, adjacent to the septal leaflet of the tricuspid valve; Marionneau et al. 2005; Dobrzynski et al. 2006). Additional studies will be required to determine the precise identity of these sites in aged/frail hearts as well as the physiological basis for these shifts. Quantification of the number of hearts that showed multiple activation sites demonstrated that frailty was a better and more accurate predictor of this phenomenon than chronological age, which failed to reveal a statistically significant difference.
We were also able to measure cycle length (i.e. beating rate) as well as local SAN CV in our experiments. Our analyses demonstrate that cycle length and CV were both highly correlated with the FI score. These studies demonstrate that frailty was effectively able to identify changes in health status of individual mice and that SAN CV (a major determinant of SAN function and HR; Fedorov et al. 2010, 2012) is critically affected by frailty. As expected, CVs were very low in the SAN, typically less than 10 cm s−1 (Azer et al. 2014; Egom et al. 2015). This is because the SAN AP upstroke is primarily generated by calcium currents as opposed to APs in the working atrial or ventricular myocardium, which rely on the much larger and faster sodium current to generate the AP upstroke (Mangoni & Nargeot, 2008).
Measurements of optical APs revealed changes in AP morphology in the SAN of aged and frail mice. The DD slope, which is a major determinant of SAN AP firing frequency (Mangoni & Nargeot, 2008), was reduced in aged mice and was negatively correlated with FI score. Similarly, we observed reductions in SAN AP duration that also correlated with the FI score. When measured as a function of chronological age, DD slope, in particular, showed substantial heteroscedasticity indicating that factors other than age impact on this critical aspect of SAN function (DD slope is the critical component of the SAN myocyte AP that determines HR in vivo; Mangoni & Nargeot, 2008; Lakatta et al. 2010). Consistent with the other measures of SAN function described above, frailty was a powerful determinant of DD slope in SAN myocytes. While the mechanisms by which frailty impacts function at the cellular levels are not well understood (Rockwood & Mitnitski, 2011; Whitehead et al. 2014), our findings do confirm that frailty affects key cellular aspects of SAN myocyte physiology. This is consistent with other studies that have also shown that cellular changes in the heart are linked to frailty rather than age (Parks et al. 2012).
We have not investigated the ionic basis for the changes in SAN AP morphology we have observed; however, numerous studies have shown that electrical remodelling in the SAN during ageing is associated with downregulation of several ionic currents including I f, I Na, I Ca,L, I Ca,T, as well as the downregulation of ryanodine receptors in the sarcoplasmic reticulum and changes in expression of connexins in SAN myocytes (Jones et al. 2004, 2007; Hao et al. 2011; Tellez et al. 2011; Larson et al. 2013; Liu et al. 2014). Reduction in these currents is consistent with the reductions in DD slope and AP duration, as well as the slowing of SAN CV we have observed in our study. It will be very interesting to determine whether changes in any of these specific ion currents are correlated with frailty, which has not been investigated.
In addition to electrical remodelling, we also observed an age and frailty dependent increase in structural remodelling due to fibrosis in the SAN. This is important because, while it has been suggested that SAN fibrosis is a primary pathological mechanism that underlies SND (Mangrum & DiMarco, 2000; Adan & Crown, 2003; Herrmann et al. 2011; Alfaras et al. 2016), this has been disputed (Morris et al. 2011). Indeed, some studies in hearts from ageing humans and animals have failed to identify fibrosis in the SAN (Alings et al. 1995; Yanni et al. 2010). We assessed fibrosis in the SAN using a number of approaches. Firstly, we performed histology and stained for collagen in sections of the right atrial posterior wall containing the SAN. These data demonstrate that interstitial fibrosis was increased in aged SAN and that this was graded by FI. We also measured total collagen content using hydroxyproline assays. Consistent with our histology, total collagen content was increased in the right atrium of aged hearts and was highly correlated with FI. Collectively, these findings indicate that fibrosis does occur in the SAN during the ageing process and that frailty (i.e. health status) is a critical determinant of this response. Fibrosis has been shown to interfere with electrical conduction in the SAN (Fedorov et al. 2009; Csepe et al. 2015) and would therefore be expected to contribute to the changes in SAN function that occur in ageing and as a function of frailty as observed in our study.
Interestingly, we found that enhanced SAN fibrosis in aged and frail hearts was not associated with an active increase in collagen production at the mRNA level. This is based on the observation that there were no differences in expression of collagen I and collagen III in the SAN, whether evaluated by chronological age or by frailty. Similarly, neither age nor FI were associated with any differences in the expression of TGFβ or CTGF (profibrotic signalling proteins; Thannickal et al. 2014; Travers et al. 2016) in the SAN. This is consistent with findings in the SAN of aged, obese rats (Yanni et al. 2010). In contrast, our study did reveal changes in the expression of MMPs. Specifically, we found that expression of MMP2 (known to play a role in the degradation of collagens I and III in the extracellular matrix; Kassiri & Khokha, 2005) was reduced in the SAN of aged mice and that this reduction was graded by FI. MMP9, on the other hand was not changed in the SAN of aged or frail mice. A reduction in MMP2 activity could result in less breakdown of collagens in the extracellular matrix and contribute to the increased amounts of interstitial fibrosis we observed in the SAN of aged and frail mice.
We also measured the expression of TIMP1–4 in the SAN and found no changes as a function of age or frailty; however, remodelling of the extracellular matrix is dependent on the balance between MMP and TIMP activity (Kassiri & Khokha, 2005). Therefore, we measured the ratios of each of TIMP1–4 to MMP2 expression in the SAN, which revealed several changes. Specifically, we found that in aged and frail hearts there were increases in the ratios of expression of TIMP2 and TIMP4 to MMP2. These increases would be expected to further reduce MMP activity in the SAN of aged and frail hearts, which is consistent with our observation that interstitial fibrosis is increased in the SAN of these mice. Our observations are also consistent with recent studies showing that ventricular fibrosis is increased in aged rats in association with changes in expression of MMPs and TIMPs rather than changes in collagen expression (Sangaralingham et al. 2011, 2016) and with studies demonstrating that plasma levels of MMPs and TIMPs are altered in ageing humans (Bonnema et al. 2007).
In summary, intrinsic SAN function is known to decline with age and SND is of major clinical importance in aged individuals, frequently requiring pacemaker implantation with attendant risks and high costs (Uretsky & Sheahan, 1997; Costa & Richman, 2016). We have examined the effects of age on SAN function in mice and used our recently developed FI to study how the health status of individuals impacts SAN function. Our study demonstrates that the age‐dependent decline in intrinsic SAN function occurs in association with electrical remodelling of the SAN, including reductions in SAN CV and alterations in SAN AP morphology (reductions in DD slope and AP duration), as well as increases in SAN fibrosis. Critically, our novel approach to quantifying frailty in mice enabled us to demonstrate that frailty is significantly associated with SAN dysfunction, including at the cellular and molecular levels. More specifically, we found that all changes in SAN function were graded by FI score indicating that animals of the same chronological age have quantifiable differences in health status that impact HR and SAN function and that frailty analysis enables us to identify these differences in health status. Our work creates a system that will further facilitate critical and essential studies of the cellular and molecular mechanisms that underlie the development of frailty and SAN dysfunction. This has important implications for understanding how and why function may differ in similarly aged individuals, which may affect decision making around procedures that may or may not be necessary and/or tolerated in specific individuals.
Additional information
Competing interests
None declared.
Author contributions
All experiments were performed at Dalhousie University. The conception and design of the experiments were performed by M.Mo., H.J.J., S.E.H. and R.A.R. The collection, analysis and interpretation of the data were done by M.Mo., H.J.J., M.Ma., S.A.R., O.B., J.L.S., S.E.H. and R.A.R. Drafting the article or revising it critically for important intellectual content was done by M.Mo., H.J.J., M.Ma., S.A.R., J.L.S., S.E.H. and R.A.R. All authors have approved the final version of the manuscript and agree to be accountable for all aspects of the work. All persons designated as authors qualify for authorship, and all those who qualify for authorship are listed.
Funding
This work was supported by operating grants from the Canadian Institutes of Health Research to R.A.R. (MOP 93718, 142486) and S.E.H. (MOP 126018). R.A.R. holds a New Investigator Award from the Heart and Stroke Foundation of Canada. H.J.J. is the recipient of a Nova Scotia Graduate Scholarship.
Translational perspective.
Heart rate, which is a major determinant of cardiac performance, is determined by the intrinsic, spontaneous activity of the sinoatrial node (SAN). Heart rate and SAN function are known to decline with age and this is a major cause of artificial pacemaker implantation; however, the basis for this decline in SAN activity in the ageing heart is incompletely understood. Furthermore, it is known that not all individuals age at the same rate and that individuals of similar chronological age can vary widely in health status. More specifically, individuals can vary from being very fit to very frail. Here we have utilized a newly developed method for quantifying frailty in mice using a non‐invasive frailty index and studied the basis for changes in heart rate and SAN function as a function of age and frailty. Our study demonstrates that SAN function was impaired in aged mice due to electrical remodelling (i.e. changes in electrical conduction and action potential morphology) as well as structural remodelling (i.e. the development of fibrosis in the SAN). Critically, these changes were found to be highly correlated with frailty. Thus, our study shows that differences in frailty (i.e. health status) can be quantified in ageing individuals and that frailty is a strong predictor of the decline in heart rate and SAN function separately from chronological age. This work establishes an important new model for studying the cellular and molecular basis for frailty and how it affects the heart, which is very poorly understood.
Acknowledgements
We sincerely thank Dr Tiesong Li for excellent technical assistance and Dr Kenneth Rockwood for helpful comments on the manuscript.
M. Moghtadaei and H. J. Jansen contributed equally to this work.
Linked articles This article is highlighted by a Perspective by Cho. To read this Perspective, visit http://dx.doi.org/10.1113/JP273370.
This is an Editor's Choice article from the 1 December 2016 issue.
References
- Adan V & Crown LA (2003). Diagnosis and treatment of sick sinus syndrome. Am Fam Physician 67, 1725–1732. [PubMed] [Google Scholar]
- Alfaras I, Di Germanio C, Bernier M, Csiszar A, Ungvari Z, Lakatta EG & de Cabo R (2016). Pharmacological strategies to retard cardiovascular aging. Circ Res 118, 1626–1642. [DOI] [PMC free article] [PubMed] [Google Scholar]
- Alings AM, Abbas RF & Bouman LN (1995). Age‐related changes in structure and relative collagen content of the human and feline sinoatrial node. A comparative study. Eur Heart J 16, 1655–1667. [DOI] [PubMed] [Google Scholar]
- Azer J, Hua R, Krishnaswamy PS & Rose RA (2014). Effects of natriuretic peptides on electrical conduction in the sinoatrial node and atrial myocardium of the heart. J Physiol 592, 1025–1045. [DOI] [PMC free article] [PubMed] [Google Scholar]
- Bonnema DD, Webb CS, Pennington WR, Stroud RE, Leonardi AE, Clark LL, McClure CD, Finklea L, Spinale FG & Zile MR (2007). Effects of age on plasma matrix metalloproteinases (MMPs) and tissue inhibitor of metalloproteinases (TIMPs). J Card Fail 13, 530–540. [DOI] [PMC free article] [PubMed] [Google Scholar]
- Clegg A, Young J, Iliffe S, Rikkert MO & Rockwood K (2013). Frailty in elderly people. Lancet 381, 752–762. [DOI] [PMC free article] [PubMed] [Google Scholar]
- Costa A & Richman DC (2016). Implantable devices: Assessment and perioperative management. Anesthesiol Clin 34, 185–199. [DOI] [PubMed] [Google Scholar]
- Csepe TA, Kalyanasundaram A, Hansen BJ, Zhao J & Fedorov VV (2015). Fibrosis: a structural modulator of sinoatrial node physiology and dysfunction. Front Physiol 6, 37. [DOI] [PMC free article] [PubMed] [Google Scholar]
- de Vries NM, Staal JB, van Ravensberg CD, Hobbelen JS, Olde Rikkert MG & Nijhuis‐van der Sanden MW (2011). Outcome instruments to measure frailty: a systematic review. Ageing Res Rev 10, 104–114. [DOI] [PubMed] [Google Scholar]
- Di Gennaro M, Bernabei R, Sgadari A, Carosella L & Carbonin PU (1987). Age‐related differences in isolated rat sinus node function. Basic Res Cardiol 82, 530–536. [DOI] [PubMed] [Google Scholar]
- Dobrzynski H, Billeter R, Greener ID, Tellez JO, Chandler NJ, Flagg TP, Nichols CG, Lopatin AN & Boyett MR (2006). Expression of Kir2.1 and Kir6.2 transgenes under the control of the α‐MHC promoter in the sinoatrial and atrioventricular nodes in transgenic mice. J Mol Cell Cardiol 41, 855–867. [DOI] [PubMed] [Google Scholar]
- Dobrzynski H, Boyett MR & Anderson RH (2007). New insights into pacemaker activity: promoting understanding of sick sinus syndrome. Circulation 115, 1921–1932. [DOI] [PubMed] [Google Scholar]
- Egom EE, Vella K, Hua R, Jansen HJ, Moghtadaei M, Polina I, Bogachev O, Hurnik R, Mackasey M, Rafferty S, Ray G & Rose RA (2015). Impaired sinoatrial node function and increased susceptibility to atrial fibrillation in mice lacking natriuretic peptide receptor C. J Physiol 593, 1127–1146. [DOI] [PMC free article] [PubMed] [Google Scholar]
- Farman GP, Tachampa K, Mateja R, Cazorla O, Lacampagne A & de Tombe PP (2008). Blebbistatin: use as inhibitor of muscle contraction. Pflugers Arch 455, 995–1005. [DOI] [PubMed] [Google Scholar]
- Fedorov VV, Chang R, Glukhov AV, Kostecki G, Janks D, Schuessler RB & Efimov IR (2010). Complex interactions between the sinoatrial node and atrium during reentrant arrhythmias in the canine heart. Circulation 122, 782–789. [DOI] [PMC free article] [PubMed] [Google Scholar]
- Fedorov VV, Glukhov AV & Chang R (2012). Conduction barriers and pathways of the sinoatrial pacemaker complex: their role in normal rhythm and atrial arrhythmias. Am J Physiol Heart Circ Physiol 302, H1773–H1783. [DOI] [PubMed] [Google Scholar]
- Fedorov VV, Hucker WJ, Dobrzynski H, Rosenshtraukh LV & Efimov IR (2006). Postganglionic nerve stimulation induces temporal inhibition of excitability in rabbit sinoatrial node. Am J Physiol Heart Circ Physiol 291, H612–H623. [DOI] [PubMed] [Google Scholar]
- Fedorov VV, Schuessler RB, Hemphill M, Ambrosi CM, Chang R, Voloshina AS, Brown K, Hucker WJ & Efimov IR (2009). Structural and functional evidence for discrete exit pathways that connect the canine sinoatrial node and atria. Circ Res 104, 915–923. [DOI] [PMC free article] [PubMed] [Google Scholar]
- Feridooni HA, Sun MH, Rockwood K & Howlett SE (2015). Reliability of a frailty index based on the clinical assessment of health deficits in male C57BL/6J mice. J Gerontol A Biol Sci Med Sci 70, 686–693. [DOI] [PMC free article] [PubMed] [Google Scholar]
- Glukhov AV, Fedorov VV, Anderson ME, Mohler PJ & Efimov IR (2010). Functional anatomy of the murine sinus node: high‐resolution optical mapping of ankyrin‐B heterozygous mice. Am J Physiol Heart Circ Physiol 299, H482–H491. [DOI] [PMC free article] [PubMed] [Google Scholar]
- Hao X, Zhang Y, Zhang X, Nirmalan M, Davies L, Konstantinou D, Yin F, Dobrzynski H, Wang X, Grace A, Zhang H, Boyett M, Huang CL & Lei M (2011). TGF‐β1‐mediated fibrosis and ion channel remodeling are key mechanisms in producing the sinus node dysfunction associated with SCN5A deficiency and aging. Circ Arrhythm Electrophysiol 4, 397–406. [DOI] [PubMed] [Google Scholar]
- Herrmann S, Fabritz L, Layh B, Kirchhof P & Ludwig A (2011). Insights into sick sinus syndrome from an inducible mouse model. Cardiovasc Res 90, 38–48. [DOI] [PubMed] [Google Scholar]
- Heuberger RA (2011). The frailty syndrome: a comprehensive review. J Nutr Gerontol Geriatr 30, 315–368. [DOI] [PubMed] [Google Scholar]
- Hua R, Adamczyk A, Robbins C, Ray G & Rose RA (2012). Distinct patterns of constitutive phosphodiesterase activity in mouse sinoatrial node and atrial myocardium. PLoS One 7, e47652. [DOI] [PMC free article] [PubMed] [Google Scholar]
- Hua R, MacLeod SL, Polina I, Moghtadaei M, Jansen HJ, Bogachev O, O'Blenes SB, Sapp JL, Legare JF & Rose RA (2015). Effects of wild‐type and mutant forms of atrial natriuretic peptide on atrial electrophysiology and arrhythmogenesis. Circ Arrhythm Electrophysiol 8, 1240–1254. [DOI] [PubMed] [Google Scholar]
- Irisawa H, Brown HF & Giles W (1993). Cardiac pacemaking in the sinoatrial node. Physiol Rev 73, 197–227. [DOI] [PubMed] [Google Scholar]
- Jones SA, Boyett MR & Lancaster MK (2007). Declining into failure: the age‐dependent loss of the L‐type calcium channel within the sinoatrial node. Circulation 115, 1183–1190. [DOI] [PubMed] [Google Scholar]
- Jones SA, Lancaster MK & Boyett MR (2004). Ageing‐related changes of connexins and conduction within the sinoatrial node. J Physiol 560, 429–437. [DOI] [PMC free article] [PubMed] [Google Scholar]
- Kassiri Z & Khokha R (2005). Myocardial extra‐cellular matrix and its regulation by metalloproteinases and their inhibitors. Thromb Haemost 93, 212–219. [DOI] [PubMed] [Google Scholar]
- Katayama PL, Dias DP, Silva LE, Virtuoso‐Junior JS & Marocolo M (2015). Cardiac autonomic modulation in non‐frail, pre‐frail and frail elderly women: a pilot study. Aging Clin Exp Res 27, 621–629. [DOI] [PubMed] [Google Scholar]
- Krishnaswamy PS, Egom EE, Moghtadaei M, Jansen HJ, Azer J, Bogachev O, Mackasey M, Robbins C & Rose RA (2015). Altered parasympathetic nervous system regulation of the sinoatrial node in Akita diabetic mice. J Mol Cell Cardiol 82, 125–135. [DOI] [PubMed] [Google Scholar]
- Lakatta EG & Levy D (2003). Arterial and cardiac aging: major shareholders in cardiovascular disease enterprises: Part II: the aging heart in health: links to heart disease. Circulation 107, 346–354. [DOI] [PubMed] [Google Scholar]
- Lakatta EG, Maltsev VA & Vinogradova TM (2010). A coupled SYSTEM of intracellular Ca2+ clocks and surface membrane voltage clocks controls the timekeeping mechanism of the heart's pacemaker. Circ Res 106, 659–673. [DOI] [PMC free article] [PubMed] [Google Scholar]
- Larson ED, St Clair JR, Sumner WA, Bannister RA & Proenza C (2013). Depressed pacemaker activity of sinoatrial node myocytes contributes to the age‐dependent decline in maximum heart rate. Proc Natl Acad Sci USA 110, 18011–18016. [DOI] [PMC free article] [PubMed] [Google Scholar]
- Leask A (2015). Getting to the heart of the matter: new insights into cardiac fibrosis. Circ Res 116, 1269–1276. [DOI] [PubMed] [Google Scholar]
- Liu J, Dobrzynski H, Yanni J, Boyett MR & Lei M (2007). Organisation of the mouse sinoatrial node: structure and expression of HCN channels. Cardiovasc Res 73, 729–738. [DOI] [PubMed] [Google Scholar]
- Liu J, Sirenko S, Juhaszova M, Sollott SJ, Shukla S, Yaniv Y & Lakatta EG (2014). Age‐associated abnormalities of intrinsic automaticity of sinoatrial nodal cells are linked to deficient cAMP‐PKA‐Ca2+ signaling. Am J Physiol Heart Circ Physiol 306, H1385–H1397. [DOI] [PMC free article] [PubMed] [Google Scholar]
- McNallan SM, Chamberlain AM, Gerber Y, Singh M, Kane RL, Weston SA, Dunlay SM, Jiang R & Roger VL (2013). Measuring frailty in heart failure: a community perspective. Am Heart J 166, 768–774. [DOI] [PMC free article] [PubMed] [Google Scholar]
- Mangoni ME & Nargeot J (2008). Genesis and regulation of the heart automaticity. Physiol Rev 88, 919–982. [DOI] [PubMed] [Google Scholar]
- Mangrum JM & DiMarco JP (2000). The evaluation and management of bradycardia. N Engl J Med 342, 703–709. [DOI] [PubMed] [Google Scholar]
- Marionneau C, Couette B, Liu J, Li H, Mangoni ME, Nargeot J, Lei M, Escande D & Demolombe S (2005). Specific pattern of ionic channel gene expression associated with pacemaker activity in the mouse heart. J Physiol 562, 223–234. [DOI] [PMC free article] [PubMed] [Google Scholar]
- Miragoli M & Glukhov AV (2015). Atrial fibrillation and fibrosis: beyond the cardiomyocyte centric view. Biomed Res Int 2015, 798768. [DOI] [PMC free article] [PubMed] [Google Scholar]
- Mitnitski AB, Mogilner AJ & Rockwood K (2001). Accumulation of deficits as a proxy measure of aging. ScientificWorldJournal 1, 323–336. [DOI] [PMC free article] [PubMed] [Google Scholar]
- Monfredi O & Boyett MR (2015). Sick sinus syndrome and atrial fibrillation in older persons – A view from the sinoatrial nodal myocyte. J Mol Cell Cardiol 83, 88–100. [DOI] [PubMed] [Google Scholar]
- Morley GE, Vaidya D, Samie FH, Lo C, Delmar M & Jalife J (1999). Characterization of conduction in the ventricles of normal and heterozygous Cx43 knockout mice using optical mapping. J Cardiovasc Electrophysiol 10, 1361–1375. [DOI] [PubMed] [Google Scholar]
- Morris GM, Monfredi O & Boyett MR (2011). Not so fast! Sick sinus syndrome is a complex and incompletely understood disease that might prove hard to model in animals. Cardiovasc Res 92, 178; author reply 179. [DOI] [PubMed] [Google Scholar]
- Nagase H, Visse R & Murphy G (2006). Structure and function of matrix metalloproteinases and TIMPs. Cardiovasc Res 69, 562–573. [DOI] [PubMed] [Google Scholar]
- Nygren A, Lomax AE & Giles WR (2004). Heterogeneity of action potential durations in isolated mouse left and right atria recorded using voltage‐sensitive dye mapping. Am J Physiol Heart Circ Physiol 287, H2634–H2643. [DOI] [PubMed] [Google Scholar]
- Parks RJ, Fares E, Macdonald JK, Ernst MC, Sinal CJ, Rockwood K & Howlett SE (2012). A procedure for creating a frailty index based on deficit accumulation in aging mice. J Gerontol A Biol Sci Med Sci 67, 217–227. [DOI] [PubMed] [Google Scholar]
- Rockwood K & Mitnitski A (2007). Frailty in relation to the accumulation of deficits. J Gerontol A Biol Sci Med Sci 62, 722–727. [DOI] [PubMed] [Google Scholar]
- Rockwood K & Mitnitski A (2011). Frailty defined by deficit accumulation and geriatric medicine defined by frailty. Clin Geriatr Med 27, 17–26. [DOI] [PubMed] [Google Scholar]
- Rockwood K, Mitnitski A, Song X, Steen B & Skoog I (2006). Long‐term risks of death and institutionalization of elderly people in relation to deficit accumulation at age 70. J Am Geriatr Soc 54, 975–979. [DOI] [PubMed] [Google Scholar]
- Rose RA, Kabir MG & Backx PH (2007). Altered heart rate and sinoatrial node function in mice lacking the cAMP regulator phosphoinositide 3‐kinase‐γ. Circ Res 101, 1274–1282. [DOI] [PubMed] [Google Scholar]
- Sangaralingham SJ, Huntley BK, Martin FL, McKie PM, Bellavia D, Ichiki T, Harders GE, Chen HH & Burnett JC Jr (2011). The aging heart, myocardial fibrosis, and its relationship to circulating C‐type natriuretic peptide. Hypertension 57, 201–207. [DOI] [PMC free article] [PubMed] [Google Scholar]
- Sangaralingham SJ, Wang BH, Huang L, Kumfu S, Ichiki T, Krum H & Burnett JC Jr (2016). Cardiorenal fibrosis and dysfunction in aging: Imbalance in mediators and regulators of collagen. Peptides 76, 108–114. [DOI] [PMC free article] [PubMed] [Google Scholar]
- Searle SD, Mitnitski A, Gahbauer EA, Gill TM & Rockwood K (2008). A standard procedure for creating a frailty index. BMC Geriatr 8, 24. [DOI] [PMC free article] [PubMed] [Google Scholar]
- Singh M, Stewart R & White H (2014). Importance of frailty in patients with cardiovascular disease. Eur Heart J 35, 1726–1731. [DOI] [PMC free article] [PubMed] [Google Scholar]
- Spinale FG (2002). Matrix metalloproteinases: regulation and dysregulation in the failing heart. Circ Res 90, 520–530. [DOI] [PubMed] [Google Scholar]
- Spinale FG (2007). Myocardial matrix remodeling and the matrix metalloproteinases: influence on cardiac form and function. Physiol Rev 87, 1285–1342. [DOI] [PubMed] [Google Scholar]
- Springer J, Azer J, Hua R, Robbins C, Adamczyk A, McBoyle S, Bissell MB & Rose RA (2012). The natriuretic peptides BNP and CNP increase heart rate and electrical conduction by stimulating ionic currents in the sinoatrial node and atrial myocardium following activation of guanylyl cyclase‐linked natriuretic peptide receptors. J Mol Cell Cardiol 52, 1122–1134. [DOI] [PubMed] [Google Scholar]
- Tellez JO, McZewski M, Yanni J, Sutyagin P, Mackiewicz U, Atkinson A, Inada S, Beresewicz A, Billeter R, Dobrzynski H & Boyett MR (2011). Ageing‐dependent remodelling of ion channel and Ca2+ clock genes underlying sino‐atrial node pacemaking. Exp Physiol 96, 1163–1178. [DOI] [PubMed] [Google Scholar]
- Thannickal VJ, Zhou Y, Gaggar A & Duncan SR (2014). Fibrosis: ultimate and proximate causes. J Clin Invest 124, 4673–4677. [DOI] [PMC free article] [PubMed] [Google Scholar]
- Travers JG, Kamal FA, Robbins J, Yutzey KE & Blaxall BC (2016). Cardiac fibrosis: The fibroblast awakens. Circ Res 118, 1021–1040. [DOI] [PMC free article] [PubMed] [Google Scholar]
- Uretsky BF & Sheahan RG (1997). Primary prevention of sudden cardiac death in heart failure: will the solution be shocking? J Am Coll Cardiol 30, 1589–1597. [DOI] [PubMed] [Google Scholar]
- Verheijck EE, van Kempen MJ, Veereschild M, Lurvink J, Jongsma HJ & Bouman LN (2001). Electrophysiological features of the mouse sinoatrial node in relation to connexin distribution. Cardiovasc Res 52, 40–50. [DOI] [PubMed] [Google Scholar]
- Whitehead JC, Hildebrand BA, Sun M, Rockwood MR, Rose RA, Rockwood K & Howlett SE (2014). A clinical frailty index in aging mice: comparisons with frailty index data in humans. J Gerontol A Biol Sci Med Sci 69, 621–632. [DOI] [PMC free article] [PubMed] [Google Scholar]
- Yanni J, Tellez JO, Sutyagin PV, Boyett MR & Dobrzynski H (2010). Structural remodelling of the sinoatrial node in obese old rats. J Mol Cell Cardiol 48, 653–662. [DOI] [PMC free article] [PubMed] [Google Scholar]