

Abstract
Intracellular Ca2+ transients are an integral part of the signaling cascade during pathogen-associated molecular pattern (PAMP)-triggered immunity in plants. Yet, our knowledge about the spatial distribution of PAMP-induced Ca2+ signals is limited. Investigation of cell- and tissue-specific properties of Ca2+-dependent signaling processes requires versatile Ca2+ reporters that are able to extract spatial information from cellular and subcellular structures, as well as from whole tissues over time periods from seconds to hours. Fluorescence-based reporters cover both a broad spatial and temporal range, which makes them ideally suited to study Ca2+ signaling in living cells. In this study, we compared two fluorescence-based Ca2+ sensors: the Förster resonance energy transfer (FRET)-based reporter yellow cameleon NES-YC3.6 and the intensity-based sensor R-GECO1. We demonstrate that R-GECO1 exhibits a significantly increased signal change compared with ratiometric NES-YC3.6 in response to several stimuli. Due to its superior sensitivity, R-GECO1 is able to report flg22- and chitin-induced Ca2+ signals on a cellular scale, which allowed identification of defined [Ca2+]cyt oscillations in epidermal and guard cells in response to the fungal elicitor chitin. Moreover, we discovered that flg22- and chitin-induced Ca2+ signals in the root initiate from the elongation zone.
Keywords: calcium imaging, R-GECO1, flg22, chitin, sensor, Arabidopsis
Introduction
Ca2+ as a second messenger is of fundamental importance for all eukaryotic organisms. In plants, Ca2+-mediated signaling participates in the regulation of abiotic stress responses as well as in signal transduction during interaction with symbiotic microorganisms and pathogens (Dodd et al., 2010). Ca2+ signaling is characterized by a transient increase of cytosolic Ca2+ ([Ca2+]cyt), which is accomplished by the activity of transporters and channels that allow influx of Ca2+ from intra- and extracellular stores (Dodd et al., 2010). These transient [Ca2+]cyt changes are then sensed and decoded by a complex network of Ca2+-binding proteins and interacting kinases that transduce the information downstream to regulate effector proteins and gene expression (Luan, 2009; Boudsocq and Sheen, 2010; Romeis and Herde, 2014; Steinhorst and Kudla, 2014). It is thought that specificity in Ca2+ signaling is primarily conferred through spatial and temporal qualities of the Ca2+ signal, which differs in frequency, amplitude, and duration in a stimulus-dependent manner (McAinsh and Pittman, 2009).
Genetically encoded indicators (GECIs) are ideal tools to study transient [Ca2+]cyt patterns, as they enable non-invasive monitoring of [Ca2+]cyt dynamics in living cells (Monshausen, 2012; Pérez Koldenkova and Nagai, 2013). In plants, luminescent aequorin-based Ca2+ reporters have been widely used to investigate the role of Ca2+ signaling during abiotic stress responses, such as cold, osmotic, and salt stress (Knight et al., 1991, 1996; Kiegle et al., 2000; Martí et al., 2013), and to study Ca2+ signaling during plant defense reactions (Blume et al., 2000; Lecourieux et al., 2002; Kwaaitaal et al., 2011; Ranf et al., 2011). Despite its high sensitivity, aequorin has a low quantum yield, which limits its use for live cell imaging (Brini, 2008). To overcome the limitation of low brightness, aequorin was fused to green fluorescent protein (GFP) to create a bioluminescence resonance energy transfer (BRET) sensor. Here, the luminescence of aequorin is transferred via FRET to GFP, which in turn emits light of higher quantum yield (Baubet et al., 2000). Recently, this concept has been applied in Arabidopsis to measure [Ca2+]cyt dynamics in entire seedlings and leaves (Xiong et al., 2014). However, there are two issues that remain limiting when using aequorin Ca2+ sensors. First, there is a need for co-factor loading, which is time consuming and might therefore interfere with the timing of experiments. Second, commonly available devices for photon counting usually do not resolve cellular and subcellular structures, resulting in compromised spatial resolution. However, the analyses of molecular mechanisms behind Ca2+ signaling networks requires versatile Ca2+ reporter tools that cover a broad range of resolution in time and space.
Because of their higher quantum yield, fluorescence-based GECIs are able to fulfill both criteria. Imaging periods from seconds to hours that cover from subcellular structures to whole organisms are feasible. Fluorescence-based GECIs can be categorized in two classes: ratiometric FRET-based reporters and intensiometric reporters. Yellow cameleon (YC) Ca2+ sensors belong to the group of ratiometric FRET-based indicators (Miyawaki et al., 1997). They consist of an enhanced cyan fluorescent protein (ECFP) variant as FRET donor and a yellow fluorescent protein (YFP) variant as acceptor. Both fluorophores are linked via a Ca2+ sensory domain that is composed of calmodulin (CaM), a short linker, and the M13 peptide, which binds to CaM in a Ca2+-dependent manner (Ikura et al., 1992; Porumb et al., 1994). Upon Ca2+ binding, the sensory domain structurally rearranges, thereby changing the distance and orientation of the fluorescent proteins to increase FRET efficiency (Miyawaki et al., 1997). Yellow cameleons have been extensively engineered to improve brightness and dynamic range (Nagai et al., 2004), minimize interference with endogenous Ca2+ signaling (Palmer and Tsien, 2006), and modulate Ca2+ affinities (Horikawa et al., 2010). Additional FRET-based Ca2+ reporters that use the troponin C Ca2+-binding moiety as sensory domain have been developed (Heim and Griesbeck, 2004; Mank et al., 2008; Thestrup et al., 2014). In plants, FRET-based Ca2+ reporters have advanced our understanding of Ca2+ signaling on the cellular and even subcellular scale (Choi et al., 2012; Monshausen, 2012 and references therein). Currently, yellow cameleon YC3.6 (Nagai et al., 2004) is the most commonly used fluorescent Ca2+ reporter in plants (Choi et al., 2012).
Intensiometric Ca2+ reporters with Pericam and GCaMPas prototypes are designed with a single circularly permutated green fluorescent protein (cpGFP) that is flanked by an N-terminal CaM-binding M13 peptide and by a C-terminal CaM (Nagai et al., 2001; Nakai et al., 2001). Upon Ca2+ binding, the CaM domain folds around the M13 peptide, thereby altering the chemical environment of the chromophore, leading to enhanced fluorescence emission (Akerboom et al., 2009). These reporters have also been extensively engineered to improve stability, sensitivity, and dynamic range resulting in various generations of GCaMPs and the development of G-GECOs (Akerboom et al., 2009; Muto et al., 2011; Zhao et al., 2011; Akerboom et al., 2012). To enable multi-color Ca2+ imaging, blue and yellow shifted intensity-based Ca2+-reporters have been developed by mutagenesis of G-GECO1.1 and GCaMP3 (Zhao et al., 2011; Akerboom et al., 2013). Red and orange emitting reporters were generated by replacing the cpGFP with cpmApple to generate R- and O-GECOs (Zhao et al., 2011; Wu et al., 2013) or with cpmRuby to generate RCaMPs (Akerboom et al., 2013). Among these reporters, R-GECO1 was the first red-shifted intensity-based Ca2+ reporter; it was combined with FRET-based reporters to perform multi-compartment and multi-parameter imaging (Zhao et al., 2011). In Arabidopsis, YC3.6 was used in combination with R-GECO1 to resolve cell-specific Ca2+ responses in pollen and synergid cells during pollen tube perception, demonstrating the potential of multi-color Ca2+ imaging (Ngo et al., 2014). When compared with ratiometric FRET-based Ca2+ reporters, intensity-based Ca2+ reporters are characterized by a superior dynamic range but are more sensitive to fluctuations in sensor expression and distribution, instrument noise, and motion artifacts (O'Connor and Silver, 2013; Pérez Koldenkova and Nagai, 2013). Therefore, the appropriate Ca2+ reporter should be selected according to the experimental needs.
In order to investigate whether R-GECO1 would be useful to facilitate Ca2+ imaging in plants, we created dual expression lines of the fluorescent Ca2+ sensors R-GECO1 and NES-YC3.6, and compared their performance under in vivo conditions. We found that R-GECO1 shows significantly higher signal changes compared with NES-YC3.6 in response to extracellular ATP and plasma membrane hyperpolarization. To make use of the higher sensitivity of R-GECO1, we studied cell- and tissue-specific characteristics of Ca2+ signals elicited by the microbe-derived molecules flg22 and chitin. Flg22 and chitin are conserved PAMPs that are recognized cell autonomously by pattern recognition receptors (Boller and Felix, 2009 and references therein). Within seconds to minutes after PAMP perception, plants respond with a transient increase in [Ca2+]cyt (Blume et al., 2000; Lecourieux et al., 2002; Kwaaitaal et al., 2011; Ranf et al., 2011). Although it is well established that Ca2+ signals are an integral part of the signaling cascade during PAMP-triggered immunity (Boller and Felix, 2009), detailed spatial and temporal information of signal onset and propagation is missing at the cellular level. Here, we report that R-GECO1 is able to resolve flg22 and chitin-induced Ca2+ signals on a cellular scale. We were able to observe defined transient [Ca2+]cyt patterns in leaves as well as in roots of Arabidopsis seedlings. We identified differences in guard cell Ca2+ signaling in response to flg22 that suggest a cell-autonomous perception of flg22 in guard cells. In roots, we identified that flg22 and chitin-induced Ca2+ signals initiate from the elongation zone. Taken together, imaging PAMP-induced Ca2+ signals with R-GECO1 allowed the identification of cell-specific differences in Ca2+ signaling in the leaf, as well as the observation of tissue-specific responses in the root.
Results and Discussion
In Vivo Comparison of Ca2+ Sensors NES-YC3.6 and R-GECO1
In order to compare in vivo properties of FRET-based and intensity-based Ca2+ reporters, we generated stable transgenic Arabidopsis lines expressing both cytosolic localized NES-YC3.6 (Nagai et al., 2004; Krebs et al., 2012) and cytosolic and nuclear localized R-GECO1 (Zhao et al., 2011). For comparable expression levels, both reporters were expressed under control of the UBQ10 promoter (Norris et al., 1993; Grefen et al., 2010). Fluorescence microscopy revealed that NES-YC3.6 and R-GECO1 were evenly expressed throughout the whole plant including guard cells and pollen (Supplemental Figure 1 and Figure 2). Due to the uniform expression pattern and their distinct spectral properties, we were able to perform comparative in vivo analyses of both Ca2+ reporters.
R-GECO1 Is More Sensitive Toward Changes of [Ca2+]cyt than NES-YC3.6
To evaluate sensor performance with respect to dynamic signal change, we determined the maximum signal change and signal-to-noise ratio (SNR) of NES-YC3.6 and R-GECO1 in response to 1 mM ATP (Figure 1) and to plasma membrane hyperpolarization (Supplemental Figure 2). Both stimuli are known to induce fast and robust changes of [Ca2+]cyt (Allen et al., 2000; Tanaka et al., 2010; Choi et al., 2014). To compare the readout of the intensity-based sensor R-GECO1 with the readout of the ratiometric FRET-based sensor NES-YC3.6, fractional fluorescence changes (ΔF/F) and fractional ratio changes (ΔR/R) were calculated respectively. [Ca2+]cyt dynamics were recorded from the root hair zone of 6- to 8-day-old seedlings (Figure 1A). Fluorescence intensity values of a representative measurement are shown in Figure 1B and the respective fractional signal changes of NES-YC3.6 (ΔR/R) and R-GECO1 (ΔF/F) are shown in Figure 1C. We observed that, in response to 1 mM ATP, R-GECO1 showed a 17-fold increased maximum signal change compared with NES-YC3.6 (Figure 1C and 1D). Similarly, when we induced cytosolic Ca2+ transients by plasma membrane hyperpolarization, the maximum signal change for R-GECO1 was 11 times higher compared with NES-YC3.6 (Supplemental Figure 2A, 2B, and 2E).
Figure 1. R-GECO1 Exhibits Enhanced Ca2+-Dependent Signal Change Compared with NES-YC3.6.
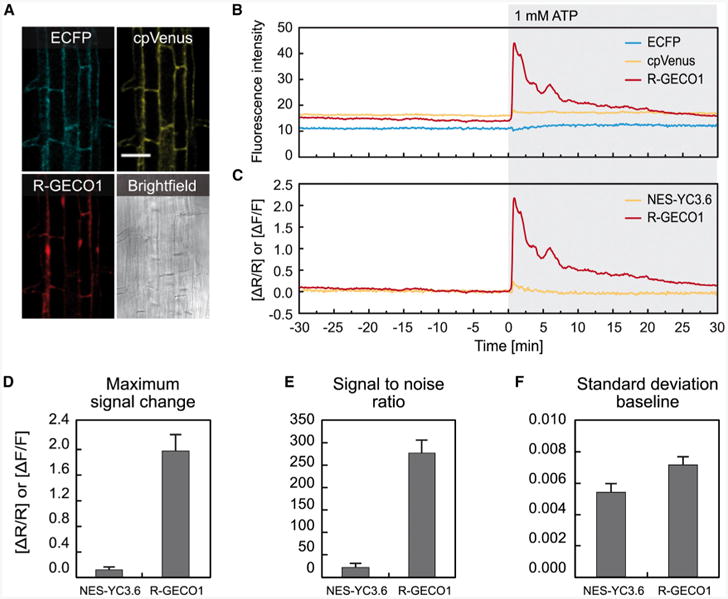
Ca2+-dependent signal changes in response to 1 mM ATP in roots of 6- to 8-day-old seedlings expressing NES-YC3.6 and R-GECO1.
(A) Fluorescence images of ECFP, cpVenus, R-GECO1, and corresponding bright field image. Scale bar represents 50 μm.
(B) Time-dependent fluorescence intensities.
(C) Time-dependent normalized NES-YC3.6 emission ratios (ΔR/R) and normalized R-GECO1 fluorescence intensities (ΔF/F).
(D–F) Maximum signal change (D), signal-to-noise ratios (E), and SD of the baseline (F). Error bars represent SD of three independent experiments.
To exclude the possibility that the higher signal changes observed for R-GECO1 are due to an overrepresentation of nuclear Ca2+ changes in R-GECO1 transgenic lines, we excluded plant cell nuclei for data analyses (Supplemental Figure 2C and 2D) and compared the maximum signal change of cytosol and nucleus versus cytosol only (Supplemental Figure 2E). Importantly, the maximum signal change of R-GECO1 after plasma membrane hyperpolarization was not changed (Supplemental Figure 2E), no matter whether nuclei were excluded from the analyses or not. From this we conclude that the improved sensor performance of R-GECO1 is not due to an overrepresentation of nuclear Ca2+ signal changes and it is therefore valid to compare cytosolic localized NES-YC3.6 with cytosolic and nuclear localized R-GECO1.
The increased maximum signal amplitude observed for R-GECO1 results in significantly higher SNRs for R-GECO1 compared with NES-YC3.6 (Figure 1E and Supplemental Figure 2F). The baseline noise, indicated by the SD of the baseline, was found to be in a similar range for R-GECO1 and NES-YC3.6 (Figure 1F and Supplemental Figure 2G). Yet, it is known that under certain imaging conditions, intensiometric sensors are more prone to noise, as changes in sensor localization as well as motion artifacts will be directly converted into altered levels of fluorescence intensity that are not correlated with changes of [Ca2+]cyt. At lower magnifications, where sample movement and focus shifts are minimally effective, intensity-based reporters might outperform ratiometric FRET-based reporters because of their higher dynamic range. However, at high magnifications, the use of ratiometric reporters is an advantage as they are intrinsically normalized. Therefore, the design of ratiometric R-GECO1 by fusion to a second fluorescent protein would provide a strategy to further increase the quality of live cell Ca2+ imaging, in particular under unfavorable imaging conditions. Our results show that under in vivo conditions R-GECO1 is 11–17 times more sensitive to [Ca2+]cyt changes compared with the FRET-based Ca2+ sensor NES-YC3.6 (Figure 1 and Supplemental Figure 2), demonstrating its huge potential for Ca2+ imaging in plants.
Individual Sensor Performance of NES-YC3.6 and R-GECO1 Is Not Impaired in Dual Expression Lines
The two Ca2+ sensors NES-YC3.6 (Kd = 250 nM; Nagai et al., 2004) and R-GECO1 (Kd = 480 nM; Zhao et al., 2011) differ to some extent in their affinity for Ca2+. To rule out that sensor readout is biased in dual expression lines due to a competition for cytosolic Ca2+, we directly compared the Ca2+-dependent signal change of NES-YC3.6 and R-GECO1 in response to plasma membrane hyperpolarization in dual expression and single expression lines (Supplemental Figure 3). A sequence of Ca2+ transients was induced by alternate application of depolarization (Depol) and hyperpolarization buffer (Hyper; Supplemental Figure 3B, 3D, and 3F). We found that the Ca2+-dependent signal change was in a similar range for NES-YC3.6 in the dual and the single expression line (Supplemental Figure 3B and 3D). Similarly, fractional fluorescence changes of R-GECO1 are comparable between the dual and the single expression line (Supplemental Figure 3B and 3F). Quantification of the mean maximum Ca2+-dependent signal change of NES-YC3.6 and R-GECO1 indicates that there is no significant difference between dual and single expression lines (Supplemental Figure 3G). These results demonstrate that the sensor performance of NES-YC3.6 and R-GECO1 is not affected in dual expression lines and therefore results obtained from experiments with dual expression lines are valid and reflect the in vivo properties of the respective sensors.
Visualization of Tip-Localized Ca2+ Gradients
Root hairs and pollen tubes are experimental systems in which polar cell growth occurs. In both systems, the tip-focused Ca2+ gradient is essential to establish and maintain polar cell growth (Reiss and Herth, 1978; Bibikova et al., 1997; Monshausen et al., 2008; Steinhorst and Kudla, 2013). We acquired ratiometric and fluorescence images of growing pollen tubes (Figure 2A) and root hairs (Figure 2B) expressing NES-YC3.6 and R-GECO1 to visualize the Ca2+ distributions in these cells. Both sensors report the expected [Ca2+]cyt gradients at the tips of pollen tubes (Figure 2A) and root hairs (Figure 2B). To investigate dynamic changes of [Ca2+]cyt, we performed time-lapse imaging in growing root hairs and were able to resolve cytosolic Ca2+ oscillations at the tip of the root hair (Figure 2C and 2D and Supplemental Movie 1). Maxima of [Ca2+]cyt were observed every 24.3 s (SD ± 6.4 s) over a time period of 360 s (Figure 2D). These results are in accordance with a previous study in which the maximum cytosolic Ca2+ signal at the root hair tip was found to oscillate with a frequency of two to four peaks per minute (Monshausen et al., 2008). As R-GECO1 is an intensity-based indicator, Ca2+-induced signal changes might be influenced by sensor distribution or pH oscillations (Bibikova et al., 1998; Feijó et al., 1999). Although the accuracy of intensity-based sensors might not be ideally suited to visualize cellular Ca2+ distributions, our data clearly show that R-GECO1 is able to report tip-localized Ca2+ gradients as well as Ca2+ oscillations during tip growth, which reveals its potential for the investigation of Ca2+-related phenotypes associated with pollen tube growth or root hair development. To increase the precision of R-GECO1, the aforementioned generation of ratiometric versions of R-GECO1 would be desirable.
Figure 2. Visualization of Tip-Localized [Ca2+]cyt Gradients.
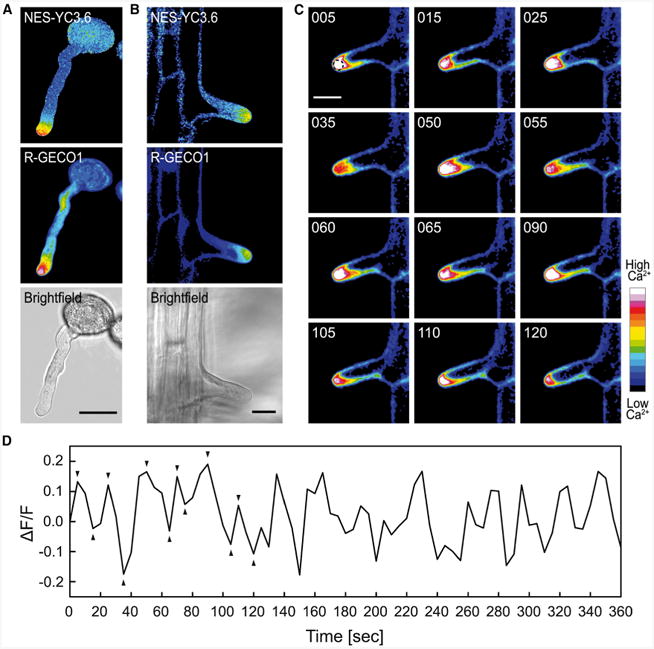
(A and B) Tip-localized [Ca2+]cyt gradients were visualized in germinating pollen tubes (A) and growing root hair cells (B) expressing NES-YC3.6 and R-GECO1. Shown are ratiometric images for NES-YC3.6, fluorescence images for R-GECO1, and the corresponding bright field images.
(C) Time-dependent [Ca2+]cyt dynamics in a growing root hair. Fluorescence images of R-GECO1 at different time points. Time format, sss.
(D) Time-dependent normalized R-GECO1 fluorescence intensities (ΔF/F) were extracted from the apex of a growing root hair indicated by the circled area in (C). Arrowheads in (D) correspond to the images shown in (C).
Scale bars in (A–C) represent 20 μm.
R-GECO1 Is More Sensitive Toward Changes of pH than NES-YC3.6
Wild-type Aequorea victoria GFP and several of its derivates are sensitive to changes in pH (Kneen et al., 1998; Young et al., 2010). Also R-GECO1, derived from circular permutated mApple (Shaner et al., 2008), is pH sensitive in vitro (Zhao et al., 2011). Within a physiological pH range of 6.8–8.0, R-GECO1 fluorescence emission changes by a factor of 4.0 for the Ca2+-free form and by a factor of 1.4 for the Ca2+-bound form, which resembles a change in the dynamic range between 8 and 16 (Zhao et al., 2011). Therefore, we wanted to investigate to what extent intracellular pH changes could bias Ca2+ measurements in Arabidopsis. To compare the pH sensitivity of R-GECO1 and NES-YC3.6, we performed a pH clamp experiment in which we controlled the intracellular pH of seedlings, using pH equilibration buffers (Yoshida, 1994; Krebs et al., 2010), within a physiologically relevant range of pH 6.8–8.0 (Figure 3). In order to distinguish between pH- and Ca2+-induced signal changes, the experiment was carried out in the presence of the Ca2+ channel blocker lanthanum chloride (LaCl3), the extracellular Ca2+ chelater ethylene glycol tetraacetic acid (EGTA), and the intracellular, membrane-permeant Ca2+ chelater 1,2-bis(o-aminophenoxy)ethane-N,N, N′,N′-tetraacetic acid (acetoxymethyl ester) (BAPTA-AM), which have been previously shown to block or attenuate cytosolic Ca2+ transients in Arabidopsis (Knight et al., 1996; Young et al., 2006; Kwaaitaal et al., 2011; Ranf et al., 2011). To demonstrate that pH treatments were effective in planta, we monitored changes in cytosolic pH (pHcyt) in Arabidopsis seedlings expressing pHGFP (Moseyko and Feldman, 2001; Fendrych et al., 2014; Figure 3A). As indicated, ΔR/R of pHGFP increased stepwise with increasing pH values of the equilibration buffers (Figure 3B). We also found that the fluorescence intensity of both Ca2+ sensors was sensitive to intracellular pH changes (Figure 3D). Fluorescence intensities of the NES-YC3.6 fluorophores ECFP and cpVenus increased by a factor of 1.3 from pH 6.8 to 8.0, whereas the emission intensity of R-GECO1 increased by a factor of 2.1 (Figure 3D). Since emission intensities of ECFP and cpVenus increase by the same factor, the resulting emission ratio is not affected by pH fluctuations (Figure 3E). In contrast, the pH-induced increase in fluorescence emission of R-GECO1 is directly translated into increased ΔF/F values (Figure 3E). Under conditions that might involve changes in pHcyt, the pH sensitivity of R-GECO1 has to be taken into account for data interpretation. Based on in vitro data (Zhao et al., 2011), cytoplasmic alkalinization could dampen [Ca2+]cyt responses of R-GECO1 through an increased baseline fluorescence emission (Figure 3E). To distinguish between pH- and Ca2+-induced signal changes, a pH reporter such as pHGFP could be investigated in parallel with R-GECO1. The spectral properties of pHGFP and R-GECO1 allow simultaneous imaging of both reporters. Therefore, dual reporter lines that simultaneously express pHGFP and R-GECO1 would be ideal for the collection and interpretation of data of stimulus-induced [Ca2+]cyt changes that also involve changes in pHcyt.
Figure 3. R-GECO1 Is More Sensitive toward Changes of pH than NES-YC3.6.
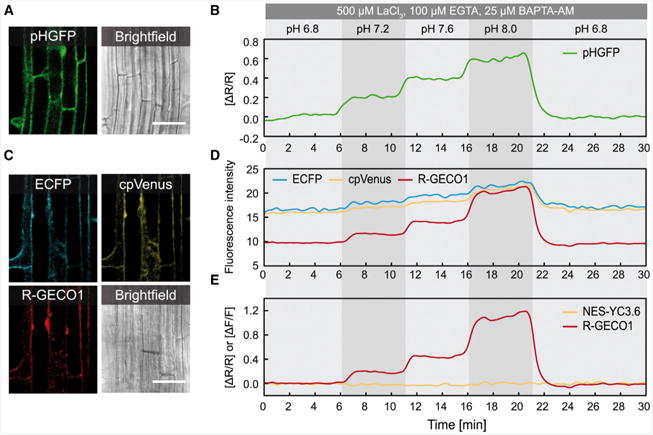
pH-dependent signal changes in response to pH equilibration buffers in roots of 6- to 8-day-old seedlings expressing pHGFP or NES-YC3.6 and R-GECO1. For cytosolic pH adjustment, pH equilibration buffers ranging from pH 6.8–8.0 were applied sequentially to the seedlings. To suppress Ca2+ ion fluxes during the pH treatments, indicated concentrations of LaCl3, EGTA, and BAPTA-AM were applied simultaneously.
(A) Fluorescence image of pHGFP and the corresponding bright field image.
(B) Time-dependent normalized pHGFP ratio changes (ΔR/R).
(C) Fluorescence images of ECFP, cpVenus, R-GECO1, and corresponding bright field image.
(D) Time-dependent fluorescence intensities of ECFP, cpVenus, and R-GECO1.
(E) Time-dependent normalized NES-YC3.6 emission ratios (ΔR/R) and normalized R-GECO1 fluorescence intensities (ΔF/F). Data are representative of n = 5 measurements. Scale bars in (A) and (C) represent 50 μm.
Live Cell Imaging Using R-GECO1 Resolves PAMP-Triggered Single-Cell Ca2+ Transients in Leaves
Even though it is well documented that transient increases in [Ca2+]cyt are among the earliest responses that take place after PAMP perception (Blume et al., 2000; Lecourieux et al., 2002; Kwaaitaal et al., 2011; Ranf et al., 2011), little is known about signal dynamics and propagation in different tissues and cell types at the single-cell level. To demonstrate that increased sensitivity of R-GECO1 would be instrumental to visualize PAMP-triggered single-cell Ca2+ signals, we challenged Arabidopsis seedlings with two well-described elicitors: the bacterial-derived peptide flg22 (Felix et al., 1999; Jeworutzki et al., 2010) and the fungal elicitor chitin (Mithöfer et al., 1999). We performed live cell imaging with R-GECO1 and NES-YC3.6 in detached true leaves of 14- to 16-day-old Arabidopsis seedlings. At indicated time points, we applied either 100 nM flg22 (Figure 4A and 4B) or 100 μg/ml chitin (Figure 4C and 4D). In the case of flg22, we detected defined oscillations of [Ca2+]cyt that lasted for approximately 30 min (Figure 4A and 4B and Supplemental Movie 2). We observed similar responses for chitin-treated leaves in which cytosolic Ca2+ oscillations lasted for approximately 20 min (Figure 4C and 4D and Supplemental Movie 3). As observed for stimulation with ATP and plasma membrane hyperpolarization (Figure 1 and Supplemental Figure 2), the signal amplitude after flg22 and chitin application is several times higher for R-GECO1 than for NES-YC3.6 (Figure 4B and 4D). As a result, R-GECO1 is able to visualize flg22- and chitin-induced transient [Ca2+]cyt patterns with higher sensitivity and resolution than NES-YC3.6 (Figure 4B and 4D).
Figure 4. R-GECO1 Detects PAMP-Triggered [Ca2+]cyt Oscillations in Intact Leaves.
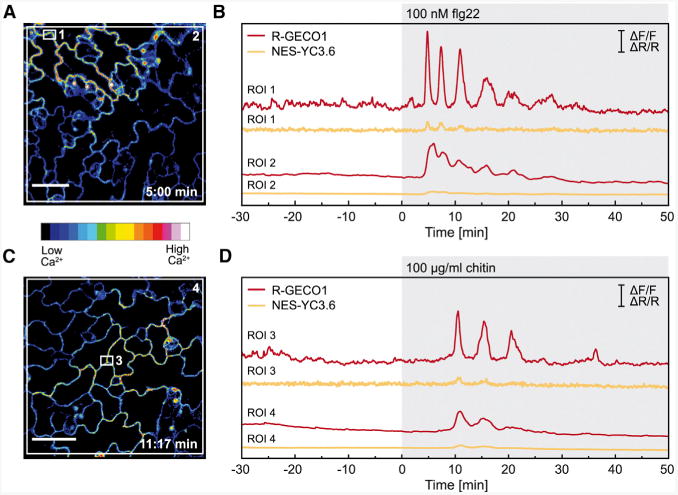
Ca2+-dependent signal changes in response to flg22 (A, B) and chitin (C, D) in true leaves of 14- to 16-day-old seedlings expressing NES-YC3.6 and R-GECO1. Fluorescence images of R-GECO1 5:00 min after flg22 (A) and 11:17 min after chitin application (C).
(B, D) Time-dependent normalized NES-YC3.6 emission ratios (ΔR/R) and normalized R-GECO1 fluorescence intensities (ΔF/F) calculated from ROIs 1–4 indicated in (A) and (C). Shown are representative experiments with n ≥ 6. Scale bars in (A) and (C) represent 50 μm and scale bars in (B) and (D) indicate ΔF/F (R-GECO1) and DR/R (NES-YC3.6) with y = 1.
Previous studies using aequorin as Ca2+ reporter detected similar signal durations in response to flg22 and chitin in whole seedlings. However, the Ca2+ response measured by aequorin was monophasic with a rapid increase followed by an exponential decay (Kwaaitaal et al., 2011; Ranf et al., 2011; Maintz et al., 2014). Mathematical simulations showed that different shapes of Ca2+ response curves simply reflect the number of measured cells (Dodd et al., 2006). To further illustrate the relation between the number of measured cells and the shape of the Ca2+ response curve, we analyzed regions of different size. Ca2+ signals extracted from a subcellular domain of two or three neighboring cells (Figure 4B region of interest [ROI] 1, Figure 4D, ROI3) exhibited oscillatory patterns. However, Ca2+ signals of single cells do no oscillate in phase (Supplemental Movies 2 and 3). Therefore, the oscillatory Ca2+ response in regions that cover several cells (Figure 4B ROI2, Figure 4D, ROI4) was less pronounced.
PAMP-Induced Signal Changes of R-GECO1 Are Ca2+-Dependent and Specific for flg22 or Chitin
Next we wanted to demonstrate that the flg22- and chitin-induced signal changes of R-GECO1 are both Ca2+ dependent and PAMP specific. For this, we performed control experiments in leaves in which we either inhibited Ca2+ transients by application of the plasma membrane Ca2+ channel blocker LaCl3 (Nathan et al., 1988; Demidchik et al., 2002) or we used inactive forms of the respective PAMPs. As shown before, treatment with 1 μM flg22 or 100 μg/ml chitin induced a clear transient increase of [Ca2+]cyt (Supplemental Figure 4A and 4B). However, if leaves where pre-treated for 30 min with 1 mM LaCl3, no significant increase of [Ca2+]cyt could be observed after application of 1 μM flg22 or 100 μg/ml chitin (Supplemental Figure 4C and 4D). These results are in line with previous observations (Kwaaitaal et al., 2011; Ranf et al., 2011) and demonstrate that flg22- and chitin-induced signal changes of R-GECO1 are truly Ca2+ dependent. Similarly, no transient increase of [Ca2+]cyt could be observed in leaves treated with 1 μM inactive flg15Δ5 (Felix et al., 1999; Ranf et al., 2011) or 1 μM inactive hexameric chitin (ch6; Zhang et al., 2002; Ranf et al., 2011; Supplemental Figure 4E and 4F), whereas application of inactive PAMPs did not evoke considerable changes in [Ca2+]cyt, treatment with 1 mM ATP-induced cytosolic Ca2+ transients, which demonstrates the competence of leaves to respond to external stimulations (Supplemental Figure 4E and 4F). Overall, these experiments verified that the PAMP-induced signal changes of R-GECO1 are Ca2+ dependent and that the changes in cytosolic Ca2+ are specifically induced by the bacterial elicitor flg22 and the fungal elicitor chitin.
Differences in Guard Cell Ca2+ Signaling in Response to flg22 and Chitin
Since stomatal pores represent putative entry points for bacteria (Melotto et al., 2008) and fungi (Guimarães and Stotz, 2004), we decided to study guard cell Ca2+ dynamics after bacterial and fungal elicitor treatment in more detail (Figure 5). For this reason, two different imaging setups were used: The lower leaf surface (abaxial site) of detached first true leaves was either imaged from the top (Supplemental Figure 5A) or from the bottom (Supplemental Figure 5B). For top imaging, the upper (adaxial) site of the leaf was facing the glass slide, whereas the abaxial site was oriented toward the objective and the site of PAMP application (Supplemental Figure 5A). For bottom imaging, the abaxial site of the leaf was facing the cover slip and oriented toward the objective, whereas the adaxial site was oriented toward the site of PAMP application (Supplemental Figure 5B). At indicated time points, we treated true leaves of 14- to 16-day-old Arabidopsis seedlings with 100 nM flg22 (Figure 5A, 5C, 5E, and 5F) or with 100 μg/ml chitin (Figure 5B, 5D, 5G, and 5H). To compare Ca2+ signals from guard cells and epidermal cells, we selected the central part of the stomatal pore and a nearby region of an epidermal cell for data analyses (Figure 5A–5D). With both imaging setups we were able to observe defined [Ca2+]cyt oscillations in epidermal leaf cells after application of 100 nM flg22 or 100 μg/ml chitin (Figure 5A – 5H ROI2, ROI4, ROI6, ROI8). When the site of PAMP application was identical to the site of imaging (top imaging, Supplemental Figure 5A), 66% of the guard cells (n = 66) responded to flg22 with [Ca2+]cyt oscillations (Figure 5A ROI1, 5E ROI1, 5I). Correspondingly, 61% of the guard cells (n = 74) showed [Ca2+]cyt oscillations after chitin treatment (Figure 5B ROI3, 5G ROI3, 5I) when the elicitor was applied to the site of imaging. However, during bottom imaging (Supplemental Figure 5B), guard cell [Ca2+]cyt oscillations were observed after chitin application (Figure 5D ROI7, 5H ROI7, and Supplemental Movie 5), but only rarely after treatment with flg22 (Figure 5C ROI5, 5F ROI5, and Supplemental Movie 4). In this case only, 19% (n = 34) of the stomatal guard cells responded to flg22, whereas 85% of the guard cells (n = 37) responded to chitin (Figure 5J). The fact that guard cells imaged in the bottom mode (Supplemental Figure 5B and Figure 5J) respond less frequently to flg22 than guard cells imaged in the top mode (Supplemental Figure 5A and Figure 5I) most likely indicates that PAMP accessibility to the tissue is restricted in the bottom mode since the leaf surface is in tight contact with the cover glass (Supplemental Figure 5B). The extended lag time observed between PAMP application and onset of Ca2+ signaling supports this idea. Ca2+ signaling was initiated 7.0 ± 2.6 min (n = 11) after flg22 and 8.2 ± 2.6 min (n = 6) after chitin treatment in cells that were facing the cover glass (Figure 5F and 5H). Cells that were in direct contact with the bathing solution and therefore closer to the site of PAMP application responded much faster to application of flg22 (1.6 ± 0.5 min, n = 8) and chitin (2.6 ± 1.0 min, n = 8; Figure 5E and 5G).
Figure 5. Ca2+ Signaling in Response to flg22 and Chitin in Guard Cells and Epidermal Cells.
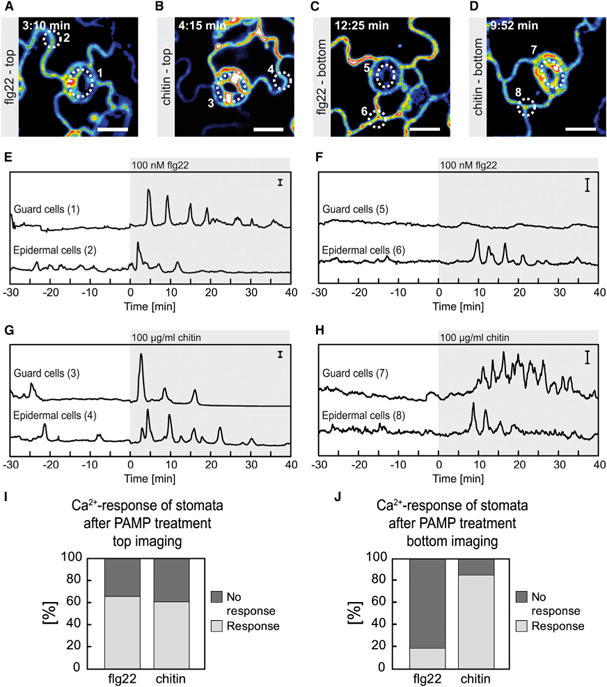
Ca2+-dependent signal changes in response to flg22 and chitin in true leaves of 14- to 16-day-old seedlings were measured with different experimental setups.
(A–D) Fluorescence images of R-GECO1. (A) Top imaging 3:10 min after flg22 application. (B) Top imaging 4:15 min after chitin application. (C) Bottom imaging 12:25 min after flg22 application.
(D) Bottom imaging 9:52 min after chitin application. (E–H) Graphs show time-dependent normalized R-GECO1 fluorescence intensities (ΔF/F) calculated from ROIs 1–8 outlined in (A–D). Different treatments are indicated by gray boxed areas.
(E) Top imaging 100 nM flg22.
(F) Bottom imaging 100 nM flg22.
(G) Top imaging 100 μg/ml chitin.
(H) Bottom imaging 100 μg/ml chitin.
(I) Percentage of guard cells that exhibited significant [Ca2+]cyt elevations in response to 100 nM flg22 (n = 66) or 100 μg/ml chitin (n = 74) as revealed in the top imaging setup.
(J) Percentage of guard cells that exhibited significant [Ca2+]cyt elevations in response to 100 nM flg22 (n = 37) or 100 μg/ml chitin (n = 34) as revealed in the bottom imaging setup.
(A–H) Shown are representative experiments with n ≥ 6. Scale bars in (A–D) represent 15 μm and scale bars in (E–H) indicate ΔF/F with y = 1.
Our results suggest that guard cells have to perceive flg22 cell autonomously, since they are symplastically isolated and signaling epidermal cells are not sufficient to elicit a Ca2+ response in an adjacent guard cell (Figure 5C and Supplemental Movie 4). The observed differences between guard cell Ca2+ signaling in response to flg22 and chitin could be due to different diffusion rates of the respective PAMPs or due to differences in Ca2+ signal propagation. The latter would suggest that additional signaling mechanisms, such as production of reactive oxygen species (ROS) in the apoplast and electrical signaling might be required to communicate signals between epidermal and guard cells (Romeis and Herde, 2014; Gilroy et al., 2014; Steinhorst and Kudla, 2014). These data show that R-GECO1 is well suited to study cell-specific Ca2+ responses in intact leaves and that chitin as shown before flg22 (Thor and Peiter, 2014), induces defined [Ca2+]cyt oscillations in epidermal and guard cells. Furthermore, our results suggest that guard cells perceive flg22 in a cell-autonomous way.
Flg22- and Chitin-Induced Ca2+ Signals in the Root Initiate from the Elongation Zone
Tissue specificity with respect to pathogen attack is not very well investigated. Most studies on PAMP-induced immunity have focused on responses associated with the aerial parts of the plant, most likely due to the fact that in most experimental systems, roots have been more difficult to access than leaves. A quantitative approach in roots and shoots of Arabidopsis seedlings demonstrated that the amplitude of Ca2+ signals in response to PAMPs is dependent on the tissue context. It was shown that the majority of the Ca2+ response induced by flg22 could be attributed to the shoot part of the seedling, whereas, in response to the fungal elicitor N-acetylchitooctaose (ch8), the root contributed to a higher extent to the total Ca2+ response of the seedling (Ranf et al., 2011). To study PAMP-induced Ca2+ dynamics in roots in more detail, we performed Ca2+ imaging of 6- to 7-day-old seedlings that had been challenged with flg22 or chitin. Seedlings were grown and imaged in RootChip16, a microfluidic platform that allows reversible and non-invasive application of elicitors via micro-perfusion (Grossmann et al., 2011, 2012; Jones et al., 2014). Since roots have been reported to be less sensitive to flg22 (Ranf et al., 2011), we used 1 μM flg22 for elicitation. In agreement with previous work (Ranf et al., 2011), we found that all the roots tested were clearly responsive to flg22 treatment. We detected a clear increase in [Ca2+]cyt after application of 1 μM flg22 (Figure 6A, 6C and 6E). Treatment with 100 μg/ml chitin (Figure 6B, 6D, and 6F) also elicited a clear increase in [Ca2+]cyt. However, the frequency of Ca2+-responsive roots was lower since three of nine chitin-treated roots did not show a clear Ca2+ response (Figure 6F, root 3). Kymograph analyses revealed two interesting facts (Figure 6C and 6D). The Ca2+ signal initiated in the root elongation zone from where it spread toward the root tip and base and the signal amplitude was at maximum within the elongation zone and decreased as the signal spread (Figure 6A, 6B, 6E, 6F and Supplemental Movies 6, 7).
Figure 6. Flg22- and Chitin-Induced [Ca2+]cyt Transients in the Root Originate from the Elongation Zone.
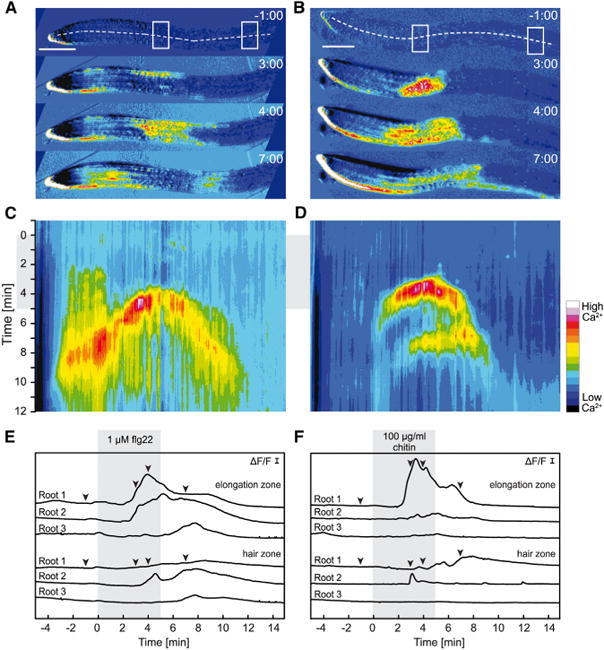
Ca2+-dependent signal changes in response to 1 μM flg22 (A, C, E) and 100 μg/ml chitin (B, D, F) in roots of 6- to 7-day-old seedlings. Ca2+ imaging was performed in the RootChip16.
(A and B) Time series of normalized R-GECO1 fluorescence images (ΔF/F).
(C and D) Kymographs were extracted along three pixel-wide dashed lines indicated in (A) and (B).
(E and F) Normalized R-GECO1 fluorescence intensities (ΔF/F) were measured from ROIs in the elongation and the root hair zone indicated by the boxed areas in (A) and (B). Shown are [Ca2+]cyt dynamics in response to flg22 and chitin of three independent roots. Arrowheads correspond to the images shown in (A) and (B). Gray boxes in (C–F) indicate a 5-min square pulse of flg22 or chitin, respectively. Scale bars in (A) and (B) indicate 200 μm and scale bars in (E) and (F) indicate ΔF/F with y = 0.1. Time format, m:ss. Note that the apparent increase in signal at the root cap in (A) and (B) does not indicate high levels of [Ca2+]cyt. It is a result of image calculation due to the growth of the root. This area was not included in the analysis.
These observations raise several interesting questions about tissue and cell specificity of immune responses but also about directionality and propagation of Ca2+ signals. Remarkably, the spatial onset of the Ca2+ response in the elongation zone correlated with the activation of defense genes. Several immune responsive genes are specifically upregulated in the elongation zone within 3–5 h after flg22 treatment (Millet et al., 2010). In addition, flg22-induced callose deposition was found to be restricted to the elongation zone (Millet et al., 2010). In contrast, no such correlation between initiation of Ca2+ signaling and gene expression in the elongation zone was observed for chitin. It has been speculated that tissue-specific immune responses of different PAMPs could reflect different infection strategies (Millet et al., 2010). Our data show that root Ca2+ imaging with R-GECO1 allowed the identification of tissue-specific Ca2+ responses. Flg22 as well as chitin induced Ca2+ transients in the root elongation zone, which spread toward the root tip and base. Whether such local Ca2+ signals are able to trigger systemic immune responses in other parts of the root or even in the shoot remains to be determined.
In this study we established Ca2+ measurements in Arabidopsis using the intensity-based reporter R-GECO1. Comparative in vivo analysis demonstrated that R-GECO1 shows significantly increased Ca2+-dependent signal changes compared with NES-YC3.6. The increased sensitivity of R-GECO1 enabled visualization of flg22- and chitin-induced Ca2+ signals on a cellular scale. We have proved that flg22- and chitin-induced signal changes of R-GECO1 are Ca2+-dependent and specific for the respective elicitors. We identified that chitin induces defined [Ca2+]cyt oscillations in guard cells and suggest that guard cells perceive flg22 in a cell-autonomous way. Moreover, we found that flg22- and chitin-induced Ca2+ signals in the root initiate from the elongation zone. Overall, our data show that R-GECO1 is a useful tool that greatly facilitates Ca2+ imaging in plants. Due to the single-fluorophore nature of GECO-based indicators, they hold enormous potential for future applications such as multi-compartment and multi-parameter imaging.
Experimental Procedures
Cloning Procedure
R-GECO1 (Zhao et al., 2011) was amplified from pTor-PE-R-GECO1 (Addgene plasmid 32465) using oligonucleotides R-GECO1-SpeF (5′-tttactagtatggtcgactcttcacgtc-3′) and R-GECO1-XmaR (5′-tttcccgggc tacttcgctgtcatcatttg-3′). The resulting fragment was inserted via SpeI/XmaI into a modified pUC19 plasmid pUC-pUBQ10 (Waadt et al., 2014) and subcloned into the barII-UT plasmid (Waadt et al., 2014), which contains a glufosinate resistance cassette for plant herbicide selection and an expression cassette for R-GECO1 consisting of the UBQ10 promoter (Norris et al., 1993) and the HSP18.2 terminator (Nagaya et al., 2010).
Plant Materials and Growth Conditions for Arabidopsis
To generate transgenic Arabidopsis thaliana (Col-0) lines that express two Ca2+ sensors simultaneously, the cytosolic yellow cameleon reporter line NES-YC3.6 (Krebs et al., 2012) was transformed with the binary vector barII-UT-R-GECO1, according to standard procedures (Hellens et al., 2000). Transgenic lines were selected for BASTA resistance on plates containing 10 μg/ml BASTA. For in vitro culture, seeds were surface sterilized using EtOH followed by stratification for 48 h at 4°C. Seedlings were grown at 22°C with cycles of 16 h light and 8 h darkness on plates containing half strength Murashige and Skoog (MS) basal salt mixture (Duchefa; www.duchefa-biochemie.com) supplemented with 0.5% sucrose. Medium pH was set to 5.8 using KOH and medium was solidified using 0.5% phytoagar (Duchefa). Pollen germination was performed as described previously (Hicks et al., 2004).
Chemicals, Buffers, and Elicitors
Stock solutions of 100 mM MgATP (pH 7.0 KOH; Sigma-Aldrich, www.sigmaaldrich.com), 100 μM flg22 (EZBiolab, www.ezbiolab.com), 1 mM flg15Δ5, 1 mM ch6, 200 mg/ml chitin, 1 M LaCl3 (Sigma-Aldrich), and 100 mM EGTA (Sigma-Aldrich) were prepared in water. The chitin stock solution was freshly prepared for each experiment by grinding chitin powder from shrimp cells (Sigma-Aldrich) for 10 min with a mortar and a pestle. The inactive PAMPs flg15Δ5 and ch6 were a kind gift from Justin Lee (IPB Halle, Germany; Ranf et al., 2011). The stock solution of 10 mM BAPTA-AM (Life Technologies, www.lifetechnologies.com) was dissolved in DMSO. The pH equilibration buffers (Yoshida, 1994; Krebs et al., 2010) and the de- and hyperpolarization buffers (Allen et al., 2000) were prepared as described previously.
Ca2+ and pH Imaging
Confocal laser scanning microscopy was performed on a Leica SP5II equipped with a DMI6000 inverted stand (Leica Microsystems, www.leica-microsystems.com). NES-YC3.6 was excited with 458 nm and fluorescence emission was detected between 465 and 505 nm (ECFP) and between 530 nm and 570 (cpVenus). R-GECO1 was excited with 561 nm and its emission was detected between 620 and 650 nm. pHGFP was sequentially excited with 405 and 488 nm and fluorescence emission was detected between 500 and 530 nm. Laser and gain settings were adjusted individually to have comparable baseline intensity values for each experiment. Images for NES-YC3.6, R-GECO1 and pHGFP were recorded using HyD detectors with a frame rate of 5 s. Samples were mounted for either top or bottom imaging (Supplemental Figure 5). For top imaging, the imaging chamber was formed from modeling clay (Supplemental Figure 5A). A thin film of medical adhesive was used to fix detached true leaves with the upper leaf surface facing the glass slide and the lower leaf surface facing the bathing solution. Leaves were covered with liquid half strength MS medium. If not stated otherwise, samples were imaged in the bottom imaging mode (Supplemental Figure 5B) and sample mounting was performed as described previously with minor modifications (Krebs and Schumacher, 2013). Instead of cotton, rock wool was used as spacer between the seedling and the imaging chamber. For imaging, seedlings were placed in liquid half strength MS medium. For ATP, flg22, and chitin treatments, two-fold concentrations of the respective agent were prepared in liquid half strength MS medium and added in a 1:1 volume ratio to the imaging chamber to achieve rapid concentration equilibrium. For plasma membrane hyperpolarization and treatments with pH equilibration buffers, a peristaltic pump was connected to the imaging chamber to perfuse the seedlings with the respective bathing solutions.
Ca2+ Imaging on Roots in the RootChip16
Epifluorescent imaging was performed on a Nikon Eclipse Ti microscope equipped with a 20× 0.75 NA multi-immersion objective (Nikon, www.nikon.com) and an Andor iXon plus electron multiplying charge coupled device (Andor, www.andor.com) camera. R-GECO1 was excited using an Obis 561-50 DPSS diode laser (Omicron Laserage, www.omicron-laser.com). Fluorescence emission was detected between 570 and 640 nm. Images were recorded with a time interval of 1.5 s. RootChip16 sample preparation was done as described previously (Grossmann et al., 2011, 2012), using the advanced RootChip16 (Jones et al., 2014). In brief, seeds were surface sterilized and germinated on cut pipette tips, prefilled with solidified Hoagland's media (Sigma-Aldrich), and plugged into the chip. Seven-day-old roots grown inside the RootChip16's observation chambers were imaged and perfused with half strength liquid Hoagland's medium. Treatments were done with 5-min square pulses of flg22 or chitin dissolved in half strength liquid Hoagland's medium.
Image Processing and Data Analysis
For data analyses, fluorescence intensity values of each channel were extracted from the ROIs indicated using ImageJ (imagej.nih.gov/ij/). When ROIs were not specified, the entire image frame was used for data analyses. For NES-YC3.6 and pHGFP, fractional ratio changes (ΔR/R) were calculated from background corrected intensity values as (R – R0)/R0, where R0 is the average ratio of the baseline (25 frames, 2 min) of a measurement. Correspondingly, fractional fluorescence changes (ΔF/F) for R-GECO1 were calculated from background corrected intensity values of R-GECO1 as (F – F0)/F0, where F0 represents the average fluorescence intensity of the baseline (25 frames, 2 min) of a measurement. To compare the performance of NES-YC3.6 with R-GECO1, different sensor parameters were evaluated. The SD of the baseline was calculated from 25 frames, representing a 2-min time period. The maximum signal change represents the mean of three individual frames that cover the maximum peak amplitude (15-s time period). Accordingly, the SNR was calculated by dividing the mean maximum peak amplitude by the SD of the baseline. Ratiometric images were calculated as described previously (Kardash et al., 2011). For quantification of stomata that show a significant change in [Ca2+]cyt after elicitor treatment, the following criteria were applied. Stomata were considered to respond if the Ca2+ signal after elicitor treatment was three times higher than the SD of the baseline. The SD of the baseline was calculated from 360 frames that represent 30 min prior to elicitor application.
Supplementary Material
Acknowledgments
The authors would like to thank Beate Schöfer and Mónica Fajardo-López for excellent technical assistance. We are grateful to Justin Lee (IPB Halle, Germany) for the inactive PAMPs flg15Δ5 and ch6.
Funding: This work was funded by grants from Deutsche Forschungsgemeinschaft to N.K. (KE 1719/2-1) and K.S. (FOR964) and by grants from National Institute of Health (GM060396-ES010337) and National Science Foundation (MCB1414339) to J.I.S.
Footnotes
Supplemental Information: Supplemental Information is available at Molecular Plant Online.
No conflict of interest declared.
References
- Akerboom J, Rivera JDV, Rodríguez Guilbe MM, Malavé ECA, Hernandez HH, Tian L, Hires SA, Marvin JS, Looger LL, Schreiter ER. Crystal structures of the GCaMP calcium sensor reveal the mechanism of fluorescence signal change and aid rational design. J Biol Chem. 2009;284:6455–6464. doi: 10.1074/jbc.M807657200. [DOI] [PMC free article] [PubMed] [Google Scholar]
- Akerboom J, Chen TW, Wardill TJ, Tian L, Marvin JS, Mutlu S, Calderón NC, Esposti F, Borghuis BG, Sun XR, et al. Optimization of a GCaMP calcium indicator for neural activity imaging. J Neurosci. 2012;32:13819–13840. doi: 10.1523/JNEUROSCI.2601-12.2012. [DOI] [PMC free article] [PubMed] [Google Scholar]
- Akerboom J, Carreras Calderón N, Tian L, Wabnig S, Prigge M, Tolö J, Gordus A, Orger MB, Severi KE, Macklin JJ, et al. Genetically encoded calcium indicators for multi-color neural activity imaging and combination with optogenetics. Front Mol Neurosci. 2013;6:2. doi: 10.3389/fnmol.2013.00002. [DOI] [PMC free article] [PubMed] [Google Scholar]
- Allen GJ, Chu SP, Schumacher K, Shimazaki CT, Vafeados D, Kemper A, Hawke SD, Tallman G, Tsien RY, Harper JF, et al. Alteration of stimulus-specific guard cell calcium oscillations and stomatal closing in Arabidopsis det3 mutant. Science. 2000;289:2338–2342. doi: 10.1126/science.289.5488.2338. [DOI] [PubMed] [Google Scholar]
- Baubet V, Le Mouellic H, Campbell AK, Lucas-Meunier E, Fossier P, Brúlet P. Chimeric green fluorescent protein-aequorin as bioluminescent Ca2+ reporters at the single-cell level. Proc Natl Acad Sci USA. 2000;97:7260–7265. doi: 10.1073/pnas.97.13.7260. [DOI] [PMC free article] [PubMed] [Google Scholar]
- Bibikova TN, Zhigilei A, Gilroy S. Root hair growth in Arabidopsis thaliana is directed by calcium and an endogenous polarity. Planta. 1997;203:495–505. doi: 10.1007/s004250050219. [DOI] [PubMed] [Google Scholar]
- Bibikova TN, Jacob T, Dahse I, Gilroy S. Localized changes in apoplastic and cytoplasmic pH are associated with root hair development in Arabidopsis thaliana. Development. 1998;125:2925–2934. doi: 10.1242/dev.125.15.2925. [DOI] [PubMed] [Google Scholar]
- Blume B, Nürnberger T, Nass N, Scheel D. Receptor-mediated increase in cytoplasmic free calcium required for activation of pathogen defense in parsley. Plant Cell. 2000;12:1425–1440. doi: 10.1105/tpc.12.8.1425. [DOI] [PMC free article] [PubMed] [Google Scholar]
- Boller T, Felix G. A renaissance of elicitors: perception of microbe-associated molecular patterns and danger signals by pattern-recognition receptors. Annu Rev Plant Biol. 2009;60:379–406. doi: 10.1146/annurev.arplant.57.032905.105346. [DOI] [PubMed] [Google Scholar]
- Boudsocq M, Sheen J. Stress signaling II: calcium sensing and signaling. In: Pareek A, Sopory SK, Bohnert HJ, editors. Abiotic Stress Adaptation in Plants SE - 4. Netherlands: Springer; 2010. pp. 75–90. [Google Scholar]
- Brini M. Calcium-sensitive photoproteins. Methods. 2008;46:160–166. doi: 10.1016/j.ymeth.2008.09.011. [DOI] [PubMed] [Google Scholar]
- Choi WG, Swanson SJ, Gilroy S. High-resolution imaging of Ca2+, redox status, ROS and pH using GFP biosensors. Plant J. 2012;70:118–128. doi: 10.1111/j.1365-313X.2012.04917.x. [DOI] [PubMed] [Google Scholar]
- Choi J, Tanaka K, Cao Y, Qi Y, Qiu J, Liang Y, Lee SY, Stacey G. Identification of a plant receptor for extracellular ATP. Science. 2014;343:290–294. doi: 10.1126/science.343.6168.290. [DOI] [PubMed] [Google Scholar]
- Demidchik V, Davenport RJ, Tester M. Nonselective cation channels in plants. Annu Rev Plant Biol. 2002;53:67–107. doi: 10.1146/annurev.arplant.53.091901.161540. [DOI] [PubMed] [Google Scholar]
- Dodd AN, Jakobsen MK, Baker AJ, Telzerow A, Hou SW, Laplaze L, Barrot L, Scott Poethig R, Haseloff J, Webb A. Time of day modulates low-temperature Ca2+ signals in Arabidopsis. Plant J. 2006;48:962–973. doi: 10.1111/j.1365-313X.2006.02933.x. [DOI] [PubMed] [Google Scholar]
- Dodd AN, Kudla J, Sanders D. The language of calcium signaling. Annu Rev Plant Biol. 2010;61:593–620. doi: 10.1146/annurev-arplant-070109-104628. [DOI] [PubMed] [Google Scholar]
- Feijó JA, Sainhas J, Hackett GR, Kunkel JG, Hepler PK. Growing pollen tubes possess a constitutive alkaline band in the clear zone and a growth-dependent acidic tip. J Cell Biol. 1999;144:483–496. doi: 10.1083/jcb.144.3.483. [DOI] [PMC free article] [PubMed] [Google Scholar]
- Felix G, Duran JD, Volko S, Boller T. Plants have a sensitive perception system for the most conserved domain of bacterial flagellin. Plant J. 1999;18:265–276. doi: 10.1046/j.1365-313x.1999.00265.x. [DOI] [PubMed] [Google Scholar]
- Fendrych M, Van Hautegem T, Van Durme M, Olvera-Carrillo Y, Huysmans M, Karimi M, Lippens S, Guérin CJ, Krebs M, Schumacher K, et al. Programmed cell death controlled by ANAC033/SOMBRERO determines root cap organ size in Arabidopsis. Curr Biol. 2014;24:931–940. doi: 10.1016/j.cub.2014.03.025. [DOI] [PubMed] [Google Scholar]
- Gilroy S, Suzuki N, Miller G, Choi WG, Toyota M, Devireddy A, Mittler R. A tidal wave of signals: calcium and ROS at the forefront of rapid systemic signaling. Trends in Plant Science. 2014;19:623–630. doi: 10.1016/j.tplants.2014.06.013. [DOI] [PubMed] [Google Scholar]
- Grefen C, Donald N, Hashimoto K, Kudla J, Schumacher K, Blatt MR. A ubiquitin-10 promoter-based vector set for fluorescent protein tagging facilitates temporal stability and native protein distribution in transient and stable expression studies. Plant J. 2010;64:355–365. doi: 10.1111/j.1365-313X.2010.04322.x. [DOI] [PubMed] [Google Scholar]
- Grossmann G, Guo WJ, Ehrhardt DW, Frommer WB, Sit RV, Quake SR, Meier M. The RootChip: an integrated microfluidic chip for plant science. Plant Cell. 2011;23:4234–4240. doi: 10.1105/tpc.111.092577. [DOI] [PMC free article] [PubMed] [Google Scholar]
- Grossmann G, Meier M, Cartwright HN, Sosso D, Quake SR, Ehrhardt DW, Frommer WB. Time-lapse fluorescence imaging of Arabidopsis root growth with rapid manipulation of the root environment using the RootChip. J Vis Exp. 2012 doi: 10.3791/4290. http://dx.doi.org/10.3791/4290. [DOI] [PMC free article] [PubMed]
- Guimarães RL, Stotz HU. Oxalate production by Sclerotinia sclerotiorum deregulates guard cells during infection. Plant Physiol. 2004;136:3703–3711. doi: 10.1104/pp.104.049650. [DOI] [PMC free article] [PubMed] [Google Scholar]
- Heim N, Griesbeck O. Genetically encoded indicators of cellular calcium dynamics based on troponin C and green fluorescent protein. J Biol Chem. 2004;279:14280–14286. doi: 10.1074/jbc.M312751200. [DOI] [PubMed] [Google Scholar]
- Hellens R, Mullineaux P, Klee H. A guide to Agrobacterium binary Ti vectors. Trends Plant Sci. 2000;5:446–451. doi: 10.1016/s1360-1385(00)01740-4. [DOI] [PubMed] [Google Scholar]
- Hicks GR, Rojo E, Hong S, Carter DG, Raikhel NV. Geminating pollen has tubular vacuoles, displays highly dynamic vacuole biogenesis, and requires VACUOLESS1 for proper function. Plant Physiol. 2004;134:1227–1239. doi: 10.1104/pp.103.037382. [DOI] [PMC free article] [PubMed] [Google Scholar]
- Horikawa K, Yamada Y, Matsuda T, Kobayashi K, Hashimoto M, Matsura T, Miyawaki A, Michikawa T, Mikoshiba K, Nagai T. Spontaneous network activity visualized by ultrasensitive Ca2+ indicators, yellow Cameleon-Nano. Nat Methods. 2010;7:729–732. doi: 10.1038/nmeth.1488. [DOI] [PubMed] [Google Scholar]
- Ikura M, Clore GM, Gronenborn AM, Zhu G, Klee CB, Bax A. Solution structure of a calmodulin-target peptide complex by multidimensional NMR. Science. 1992;256:632–638. doi: 10.1126/science.1585175. [DOI] [PubMed] [Google Scholar]
- Jeworutzki E, Roelfsema MRG, Anschütz U, Krol E, Elzenga JTM, Felix G, Boller T, Hedrich R, Becker D. Early signaling through the Arabidopsis pattern recognition receptors FLS2 and EFR involves Ca2+-associated opening of plasma membrane anion channels. Plant J. 2010;62:367–378. doi: 10.1111/j.1365-313X.2010.04155.x. [DOI] [PubMed] [Google Scholar]
- Jones AM, Danielson JÅH, Manojkumar SN, Lanquar V, Grossmann G, Frommer WB. Abscisic acid dynamics in roots detected with genetically encoded FRET sensors. Elife. 2014;3:e01741. doi: 10.7554/eLife.01741. [DOI] [PMC free article] [PubMed] [Google Scholar]
- Kardash E, Bandemer J, Raz E. Imaging protein activity in live embryos using fluorescence resonance energy transfer biosensors. Nat Protoc. 2011;6:1835–1846. doi: 10.1038/nprot.2011.395. [DOI] [PubMed] [Google Scholar]
- Kiegle E, Moore CA, Haseloff J, Tester MA, Knight MR. Cell-type-specific calcium responses to drought, salt and cold in the Arabidopsis root. Plant J. 2000;23:267–278. doi: 10.1046/j.1365-313x.2000.00786.x. [DOI] [PubMed] [Google Scholar]
- Kneen M, Farinas J, Li Y, Verkman AS. Green fluorescent protein as a noninvasive intracellular pH indicator. Biophys J. 1998;74:1591–1599. doi: 10.1016/S0006-3495(98)77870-1. [DOI] [PMC free article] [PubMed] [Google Scholar]
- Knight MR, Campbell AK, Smith SM, Trewavas AJ. Transgenic plant aequorin reports the effects of touch and cold-shock and elicitors on cytoplasmic calcium. Nature. 1991;352:524–526. doi: 10.1038/352524a0. [DOI] [PubMed] [Google Scholar]
- Knight H, Trewavas AJ, Knight MR. Cold calcium signaling in Arabidopsis involves two cellular pools and a change in calcium signature after acclimation. Plant Cell. 1996;8:489–503. doi: 10.1105/tpc.8.3.489. [DOI] [PMC free article] [PubMed] [Google Scholar]
- Krebs M, Schumacher K. Live cell imaging of cytoplasmic and nuclear Ca2+ dynamics in Arabidopsis roots. Cold Spring Harb Protoc. 2013;2013:776–780. doi: 10.1101/pdb.prot073031. [DOI] [PubMed] [Google Scholar]
- Krebs M, Beyhl D, Gö rlich E, Al-Rasheid KAS, Marten I, Stierhof YD, Hedrich R, Schumacher K. Arabidopsis V-ATPase activity at the tonoplast is required for efficient nutrient storage but not for sodium accumulation. Proc Natl Acad Sci USA. 2010;107:3251–3256. doi: 10.1073/pnas.0913035107. [DOI] [PMC free article] [PubMed] [Google Scholar]
- Krebs M, Held K, Binder A, Hashimoto K, Den Herder G, Parniske M, Kudla J, Schumacher K. FRET-based genetically encoded sensors allow high-resolution live cell imaging of Ca2+ dynamics. Plant J. 2012;69:181–192. doi: 10.1111/j.1365-313X.2011.04780.x. [DOI] [PubMed] [Google Scholar]
- Kwaaitaal M, Huisman R, Maintz J, Reinstadler A, Panstruga R. Ionotropic glutamate receptor (iGluR)-like channels mediate MAMP-induced calcium influx in Arabidopsis thaliana. Biochem J. 2011;440:355–365. doi: 10.1042/BJ20111112. [DOI] [PubMed] [Google Scholar]
- Lecourieux D, Mazars C, Pauly N, Ranjeva R, Pugin A. Analysis and effects of cytosolic free calcium increases in response to elicitors in Nicotiana plumbaginifolia cells. Plant Cell. 2002;14:2627–2641. doi: 10.1105/tpc.005579. [DOI] [PMC free article] [PubMed] [Google Scholar]
- Luan S. The CBL-CIPK network in plant calcium signaling. Trends Plant Sci. 2009;14:37–42. doi: 10.1016/j.tplants.2008.10.005. [DOI] [PubMed] [Google Scholar]
- Maintz J, Cavdar M, Tamborski J, Kwaaitaal M, Huisman R, Meesters C, Kombrink E, Panstruga R. Comparative analysis of MAMP-induced calcium influx in arabidopsis seedlings and protoplasts. Plant Cell Physiol. 2014;55:1813–1825. doi: 10.1093/pcp/pcu112. [DOI] [PubMed] [Google Scholar]
- Mank M, Santos AF, Direnberger S, Mrsic-Flogel TD, Hofer SB, Stein V, Hendel T, Reiff DF, Levelt C, Borst A, et al. A genetically encoded calcium indicator for chronic in vivo two-photon imaging. Nat Methods. 2008;5:805–811. doi: 10.1038/nmeth.1243. [DOI] [PubMed] [Google Scholar]
- Martí MC, Stancombe MA, Webb AAR. Cell- and stimulus type-specific intracellular free Ca2+ signals in Arabidopsis. Plant Physiol. 2013;163:625–634. doi: 10.1104/pp.113.222901. [DOI] [PMC free article] [PubMed] [Google Scholar]
- McAinsh MR, Pittman JK. Shaping the calcium signature. New Phytol. 2009;181:275–294. doi: 10.1111/j.1469-8137.2008.02682.x. [DOI] [PubMed] [Google Scholar]
- Melotto M, Underwood W, He SY. Role of stomata in plant innate immunity and foliar bacterial diseases. Annu Rev Phytopathol. 2008;46:101–122. doi: 10.1146/annurev.phyto.121107.104959. [DOI] [PMC free article] [PubMed] [Google Scholar]
- Millet YA, Danna CH, Clay NK, Songnuan W, Simon MD, Werck-Reichhart D, Ausubel FM. Innate immune responses activated in Arabidopsis roots by microbe-associated molecular patterns. Plant Cell. 2010;22:973–990. doi: 10.1105/tpc.109.069658. [DOI] [PMC free article] [PubMed] [Google Scholar]
- Mithöfer A, Ebel J, Bhagwat AA, Boller T, Neuhaus-Url G. Transgenic aequorin monitors cytosolic calcium transients in soybean cells challenged with β-glucan or chitin elicitors. Planta. 1999;207:566–574. [Google Scholar]
- Miyawaki A, Llopis J, Heim R, McCaffery JM, Adams JA, Ikura M, Tsien RY. Fluorescent indicators for Ca2+ based on green fluorescent proteins and calmodulin. Nature. 1997;388:882–887. doi: 10.1038/42264. [DOI] [PubMed] [Google Scholar]
- Monshausen GB. Visualizing Ca2+ signatures in plants. Curr Opin Plant Biol. 2012;15:1–6. doi: 10.1016/j.pbi.2012.09.014. [DOI] [PubMed] [Google Scholar]
- Monshausen GB, Messerli MA, Gilroy S. Imaging of the yellow cameleon 3.6 indicator reveals that elevations in cytosolic Ca2+ follow oscillating increases in growth in root hairs of Arabidopsis. Plant Physiol. 2008;147:1690–1698. doi: 10.1104/pp.108.123638. [DOI] [PMC free article] [PubMed] [Google Scholar]
- Moseyko N, Feldman LJ. Expression of pH-sensitive green fluorescent protein in Arabidopsis thaliana. Plant Cell Environ. 2001;24:557–563. doi: 10.1046/j.1365-3040.2001.00703.x. [DOI] [PubMed] [Google Scholar]
- Muto A, Ohkura M, Kotani T, Higashijima S, Nakai J, Kawakami K. Genetic visualization with an improved GCaMP calcium indicator reveals spatiotemporal activation of the spinal motor neurons in zebrafish. Proc Natl Acad Sci USA. 2011;108:5425–5430. doi: 10.1073/pnas.1000887108. [DOI] [PMC free article] [PubMed] [Google Scholar]
- Nagai T, Sawano A, Park ES, Miyawaki A. Circularly permuted green fluorescent proteins engineered to sense Ca2+ Proc Natl Acad Sci USA. 2001;98:3197–3202. doi: 10.1073/pnas.051636098. [DOI] [PMC free article] [PubMed] [Google Scholar]
- Nagai T, Yamada S, Tominaga T, Ichikawa M, Miyawaki A. Expanded dynamic range of fluorescent indicators for Ca2+ by circularly permuted yellow fluorescent proteins. Proc Natl Acad Sci USA. 2004;101:10554–10559. doi: 10.1073/pnas.0400417101. [DOI] [PMC free article] [PubMed] [Google Scholar]
- Nagaya S, Kawamura K, Shinmyo A, Kato K. The HSP terminator of Arabidopsis thaliana increases gene expression in plant cells. Plant Cell Physiol. 2010;51:328–332. doi: 10.1093/pcp/pcp188. [DOI] [PubMed] [Google Scholar]
- Nakai J, Ohkura M, Imoto K. A high signal-to-noise Ca2+ probe composed of a single green fluorescent protein. Nat Biotechnol. 2001;19:137–141. doi: 10.1038/84397. [DOI] [PubMed] [Google Scholar]
- Nathan RD, Kanai K, Clark RB, Giles W. Selective block of calcium current by lanthanum in single bullfrog atrial cells. J Gen Physiol. 1988;91:549–572. doi: 10.1085/jgp.91.4.549. [DOI] [PMC free article] [PubMed] [Google Scholar]
- Ngo QA, Vogler H, Lituiev DS, Nestorova A, Grossniklaus U. A calcium dialog mediated by the FERONIA signal transduction pathway controls plant sperm delivery. Dev Cell. 2014;29:491–500. doi: 10.1016/j.devcel.2014.04.008. [DOI] [PubMed] [Google Scholar]
- Norris SR, Meyer SE, Callis J. The intron of Arabidopsis thaliana polyubiquitin genes is conserved in location and is a quantitative determinant of chimeric gene expression. Plant Mol Biol. 1993;21:895–906. doi: 10.1007/BF00027120. [DOI] [PubMed] [Google Scholar]
- O'Connor N, Silver RB. Ratio imaging: practical considerations for measuring intracellular Ca2+ and pH in living cells. Methods Cell Biol. 2013;114:387–406. doi: 10.1016/B978-0-12-407761-4.00016-6. [DOI] [PubMed] [Google Scholar]
- Palmer AE, Tsien RY. Measuring calcium signaling using genetically targetable fluorescent indicators. Nat Protoc. 2006;1:1057–1065. doi: 10.1038/nprot.2006.172. [DOI] [PubMed] [Google Scholar]
- Pérez Koldenkova V, Nagai T. Genetically encoded Ca2+ indicators: properties and evaluation. Biochim Biophys Acta. 2013;1833:1787–1797. doi: 10.1016/j.bbamcr.2013.01.011. [DOI] [PubMed] [Google Scholar]
- Porumb T, Yau P, Harvey TS, Ikura M. A calmodulin-target peptide hybrid molecule with unique calcium-binding properties. Protein Eng. 1994;7:109–115. doi: 10.1093/protein/7.1.109. [DOI] [PubMed] [Google Scholar]
- Ranf S, Eschen-Lippold L, Pecher P, Lee J, Scheel D. Interplay between calcium signalling and early signalling elements during defence responses to microbe- or damage-associated molecular patterns. Plant J. 2011;68:100–113. doi: 10.1111/j.1365-313X.2011.04671.x. [DOI] [PubMed] [Google Scholar]
- Reiss HD, Herth W. Visualization of the Ca2+-gradient in growing pollen tubes of Lilium longiflorum with chlorotetracycline fluorescence. Protoplasma. 1978;97:373–377. [Google Scholar]
- Romeis T, Herde M. From local to global: CDPKs in systemic defense signaling upon microbial and herbivore attack. Curr Opin Plant Biol. 2014;20:1–10. doi: 10.1016/j.pbi.2014.03.002. [DOI] [PubMed] [Google Scholar]
- Shaner NC, Lin MZ, McKeown MR, Steinbach PA, Hazelwood KL, Davidson MW, Tsien RY. Improving the photostability of bright monomeric orange and red fluorescent proteins. Nat Methods. 2008;5:545–551. doi: 10.1038/nmeth.1209. [DOI] [PMC free article] [PubMed] [Google Scholar]
- Steinhorst L, Kudla J. Calcium - a central regulator of pollen germination and tube growth. Biochim Biophys Acta. 2013;1833:1573–1581. doi: 10.1016/j.bbamcr.2012.10.009. [DOI] [PubMed] [Google Scholar]
- Steinhorst L, Kudla J. Signaling in cells and organisms -calcium holds the line. Curr Opin Plant Biol. 2014;22:14–21. doi: 10.1016/j.pbi.2014.08.003. [DOI] [PubMed] [Google Scholar]
- Tanaka K, Swanson SJ, Gilroy S, Stacey G. Extracellular nucleotides elicit cytosolic free calcium oscillations in Arabidopsis. Plant Physiol. 2010;154:705–719. doi: 10.1104/pp.110.162503. [DOI] [PMC free article] [PubMed] [Google Scholar]
- Thestrup T, Litzlbauer J, Bartholomäus I, Mues M, Russo L, Dana H, Kovalchuk Y, Liang Y, Kalamakis G, Laukat Y, et al. Optimized ratiometric calcium sensors for functional in vivo imaging of neurons and T lymphocytes. Nat Methods. 2014;11:175–182. doi: 10.1038/nmeth.2773. [DOI] [PubMed] [Google Scholar]
- Thor K, Peiter E. Cytosolic calcium signals elicited by the pathogen-associated molecular pattern flg22 in stomatal guard cells are of an oscillatory nature. New Phytologist. 2014;204:873–881. doi: 10.1111/nph.13064. [DOI] [PubMed] [Google Scholar]
- Waadt R, Hitomi K, Nishimura N, Hitomi C, Adams SR, Getzoff ED, Schroeder JI. FRET-based reporters for the direct visualization of abscisic acid concentration changes and distribution in Arabidopsis. Elife. 2014;3:1–28. doi: 10.7554/eLife.01739. [DOI] [PMC free article] [PubMed] [Google Scholar]
- Wu J, Liu L, Matsuda T, Zhao Y, Rebane A, Drobizhev M, Chang YF, Araki S, Arai Y, March K, et al. Improved orange and red Ca2+ indicators and photophysical considerations for optogenetic applications. ACS Chem Neurosci. 2013;4:963–972. doi: 10.1021/cn400012b. [DOI] [PMC free article] [PubMed] [Google Scholar]
- Xiong TC, Ronzier E, Sanchez F, Corratgé-Faillie C, Mazars C, Thibaud JB. Imaging long distance propagating calcium signals in intact plant leaves with the BRET-based GFP-aequorin reporter. Front Plant Sci. 2014;5:1–13. doi: 10.3389/fpls.2014.00043. [DOI] [PMC free article] [PubMed] [Google Scholar]
- Yoshida S. Low temperature-induced cytoplasmic acidosis in cultured Mung Bean (Vigna radiata [L.] Wilczek) cells. Plant Physiol. 1994;104:1131–1138. doi: 10.1104/pp.104.4.1131. [DOI] [PMC free article] [PubMed] [Google Scholar]
- Young JJ, Mehta S, Israelsson M, Godoski J, Grill E, Schroeder JI. CO2 signaling in guard cells: calcium sensitivity response modulation, a Ca2+-independent phase, and CO2 insensitivity of the gca2 mutant. Proc Natl Acad Sci USA. 2006;103:7506–7511. doi: 10.1073/pnas.0602225103. [DOI] [PMC free article] [PubMed] [Google Scholar]
- Young B, Wightman R, Blanvillain R, Purcel SB, Gallois P. pH-sensitivity of YFP provides an intracellular indicator of programmed cell death. Plant Methods. 2010;6:27. doi: 10.1186/1746-4811-6-27. [DOI] [PMC free article] [PubMed] [Google Scholar]
- Zhang B, Ramonell K, Somerville S, Stacey G. Characterization of early, chitin-induced gene expression in Arabidopsis. Mol Plant Microbe Interact. 2002;15:963–970. doi: 10.1094/MPMI.2002.15.9.963. [DOI] [PubMed] [Google Scholar]
- Zhao Y, Araki S, Wu J, Teramoto T, Chang YF, Nakano M, Abdelfattah AS, Fujiwara M, Ishihara T, Nagai T, et al. An expanded palette of genetically encoded Ca2+ indicators. Science. 2011;333:1888–1891. doi: 10.1126/science.1208592. [DOI] [PMC free article] [PubMed] [Google Scholar]
Associated Data
This section collects any data citations, data availability statements, or supplementary materials included in this article.