Abstract
With the shift toward individualized treatment, cost-effectiveness models need to incorporate patient and tumor characteristics that may be relevant to treatment planning. In this study, we used multistate statistical modeling to inform a microsimulation model for cost-effectiveness analysis of individualized radiotherapy in lung cancer. The model tracks clinical events over time and takes patient and tumor features into account. Four clinical states were included in the model: alive without progression, local recurrence, metastasis, and death. Individual patients were simulated by repeatedly sampling a patient profile, consisting of patient and tumor characteristics. The transitioning of patients between the health states is governed by personalized time-dependent hazard rates, which were obtained from multistate statistical modeling (MSSM). The model simulations for both the individualized and conventional radiotherapy strategies demonstrated internal and external validity. Therefore, MSSM is a useful technique for obtaining the correlated individualized transition rates that are required for the quantification of a microsimulation model. Moreover, we have used the hazard ratios, their 95% confidence intervals, and their covariance to quantify the parameter uncertainty of the model in a correlated way. The obtained model will be used to evaluate the cost-effectiveness of individualized radiotherapy treatment planning, including the uncertainty of input parameters. We discuss the model-building process and the strengths and weaknesses of using MSSM in a microsimulation model for individualized radiotherapy in lung cancer.
Keywords: multi-state modeling, survival analysis, patient heterogeneity, uncertainty, decision making
To support reimbursement decisions in health care, cost-effectiveness studies that compare a new treatment to standard care have become a prerequisite in many countries. Traditionally, cost-effectiveness studies in cancer care are either health-economic evaluations alongside clinical trials or relatively simple health-economic models in which a homogeneous cohort of patients is simulated. Cancer treatment nowadays is shifting toward individualized therapy, with treatments being increasingly tailored to the specific characteristics of a patient and a tumor. To obtain clinical predictions that accurately estimate patient outcomes, integration of the clinical, molecular, and imaging information on patient and tumors is needed.1 Likewise, in the field of health technology assessment, this means that for a proper evaluation of long-term costs and effects of individualized strategies, cost-effectiveness models need to incorporate patient and tumor features that may affect treatment decisions, disease progression, survival, adverse events, and quality of life.
Building on previously published prediction models for chemoradiotherapy treatment in non–small-cell lung cancer (NSCLC),2–6 we present here the development of a decision model that can simulate individual disease progression of patients with NSCLC undergoing radiotherapy, taking multiple health outcomes into account. The technique of multistate statistical modeling (MSSM) has been shown to be suitable for modeling time-to-event data that describe the transitioning of patients between any number of health states over time.7–9 The technique allows inclusion of covariates as well as the occurrence and timing of previous events in the statistical model. We hypothesized that MSSM would be highly suitable to simultaneously estimate all parameters in a decision model, together with their joint correlations.
Therefore, the objective of the current study was to parameterize a microsimulation model of radiotherapy in NSCLC by using the technique of MSSM. Model structure, model assumptions, quantification of the model parameters, and internal validation of the microsimulation model for a range of intermediate outcomes are presented. Furthermore, model predictions are compared with the Netherlands Cancer Registry data. Finally, we discuss the model-building process and the strengths and weaknesses of using MSSM for the quantification of a microsimulation model.
METHODS
Design of the Microsimulation Model
The NSCLC radiotherapy model simulates the disease progression of individual lung cancer patients until they are deceased or have reached a prespecified time-horizon using a microsimulation approach. The model simulates the timing of events, rather than simulating the transitioning between health states in discrete time intervals.
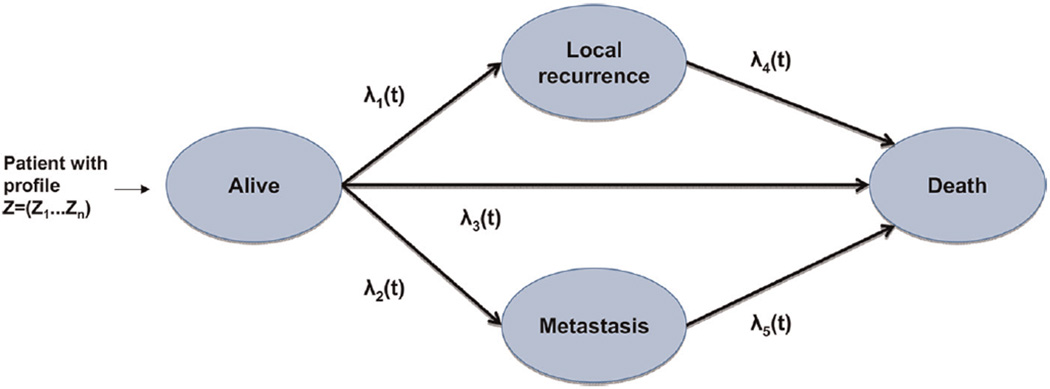
Patients in the simulation have a number of clinical features and tumor features Z = (Z1, … , Zm) that are randomly drawn from prespecified correlated distributions. Once a specific individual patient profile z = (z1 … , zm) is drawn, the disease progression after radiotherapy treatment is simulated for that individual. Figure 1 shows a flowchart of the model. The model contains 4 clinical states: alive without local recurrence or metastasis (A), local recurrence (LR), metastasis (M),and death. All patients start in state A, where they are assumed to receive radiotherapy treatment. Over time, they can develop a local recurrence (LR; transition 1), they can develop distant metastases (M; transition 2), or they can die without the detection of LR or M (death; transition 3). After the occurrence of LR or M, they are again at risk for death (transitions 4 and 5, respectively).
Figure 1.
Structure of the microsimulation model, corresponding to the structure of the multistate model.
In our model, transitions 1, 2, and 3 (LR, M, and death without previous LR or M) were treated as competing events. Note that in practice, the detection of LR and M may occur simultaneously or sequentially. In the data that were available for model estimation, however, few patients experienced both LR and M, and, if so, detection mostly occurred simultaneously. Since prognosis is poorest in patients with metastases, we considered patients with both LR and M to be similar to patients with M only.
Time-to-Event Data
Data for model quantification were provided by the Maastro Clinic, Maastricht. Between 2002 and 2009, 674 NSCLC patients with inoperable stage I–IIIB NSCLC receiving curative chemoradiation or radiation were included. Data were collected on patient and tumor characteristics, toxicity, and follow-up.2–4 For the current study, we used a subpopulation of patients who received sequential chemoradiation or radiation alone and had complete follow-up on all covariates of interest, the occurrence of local recurrence and metastasis, and the timing of these events (n = 200). The remaining patients (n = 474) received experimental radiotherapy or concurrent chemoradiation (n = 167), had missings on timing and/or occurrence of intermediate events (n = 266), or had missings on 1 or more covariates of interest (n = 41). For patients included in the study before July 2005, radiotherapy planning was based on computed tomography (CT) imaging, selecting the primary tumor and affected lymph nodes anatomically. Patients included in the study from August 2005 onward received radiotherapy with treatment planning based on positron emission tomography (PET)-CT. This means that the lymph nodes are identified by tumor activity and visualized through fluorodeoxyglucose (FDG), a PET tracer. This planning strategy is believed to be beneficial in terms of tumor coverage, the isolated nodal failure rate, and the volume of healthy tissues irradiated.10
Both planning strategies are accepted as standard care; however, RT2 is not operational in all hospitals. In detail, the radiotherapy treatment strategies are as follows:
RT1: Patients received a radiation dose of either 70 Gy (Stage I–II) or 60 Gy (Stage III), in daily 2-Gy fractions.
RT2: Patients received a radiation dose of 54.0–79.2 Gy, delivered in 1.8-Gy fractions, twice daily, depending on the mean lung dose or spinal cord dose constraint, as calculated from the FDG-PET image.
In the model, the 2 strategies for radiotherapy planning were included by allowing the transition rates between health states to depend on the treatment strategy. Patient characteristics in both groups are summarized in Table 1.
Table 1.
Patient Characteristics
| Variable | RT1 (n = 92) | RT2 (n = 108) |
|---|---|---|
| Mean age, years | 67.4 | 67.7 |
| Gender, n (%) | ||
| Male | 72 (78.3) | 69 (63.9) |
| Female | 20 (21.7) | 39 (36.1) |
| WHO performance status, n (%) | ||
| 0–1 | 80 (87) | 85 (78.7) |
| ≥2 | 12 (13) | 23 (21.3) |
| TNM stage, n (%) | ||
| I | 12 (13) | 18 (16.7) |
| II | 9 (9.8) | 8 (0.1) |
| IIIA | 29 (31.5) | 24 (22.2) |
| IIIB | 42 (45.7) | 56 (51.9) |
| Missing | 2 (0.0) | |
| Mean gross tumor volume, cc3 | 86.8 | 61.7 |
| N stage, n (%) | ||
| 0–1 | 38 (41.3) | 46 (42.6) |
| ≥2 | 54 (58.7) | 62 (57.4) |
| Chemotherapy, n (%) | 61 (66.3) | 73 (67.6) |
| Histological subtype, n (%) | ||
| Adenocarcinoma | 13 (14.1) | 10 (9.3) |
| Squamous cell carcinoma | 32 (34.8) | 33 (30.6) |
| Large cell | 31 (33.7) | 43 (39.8) |
| Other | 3 (3.3) | 13 (12) |
| Unknown | 13 (14.1) | 9 (8.3) |
| Days of follow-up, mean, median (min–max) | 562, 409 (50–2200) | 600, 548 (43–1500) |
Note: RT1 = radiotherapy planning based on computed tomography; RT2 = radiotherapy planning based on positron emission tomography and computed tomography; WHO = World Health Organization.
The Procedure of Model Quantification
Two groups of parameters can be distinguished that need quantification in the model:
The distribution of baseline clinical features and tumor features and the correlations among these features
For each transition: the baseline time-dependent hazard as well as the hazard rate ratios that describe the proportional increase or decrease in risk of making a transition for different clinical and tumor features
The first group of parameters is directly based on the observed data. To evaluate the model fit for both treatment strategies, the patient cohort in the microsimulation model was adjusted to the distribution of patient features in the data for the specific treatment strategy under evaluation. That is, to evaluate the model fit for RT1, the patient cohort was adjusted according to the distribution of patient features in the data for RT1, and likewise for RT2. Estimation of the parameters in group 2 is a 2-step procedure. Briefly, in the first step, we estimated the effect of prognostic factors on the transition rates by using the mstate package for MSSM in R.9 Three statistical models with different assumptions were estimated. In the second step, the results of the 3 statistical models were implemented as microsimulation models in Excel. These models were subsequently used to simulate individual disease pathways. The model with the closest fit to the observed data for a range of (intermediate) outcomes was selected for external validation and uncertainty analysis. Details of the 2 steps, the external validation, and uncertainty analysis are provided subsequently.
The Multistate Statistical Model
MSSM is a technique for time-to-event data in which all patients begin in 1 or more starting states and end up in 1 or more absorbing states (often death).11 The method is an extension of the Cox proportional hazards model. It allows for simultaneously estimating the hazard rate ratios for each included clinical or tumor feature for all transitions as well as their covariance.
For each transition k in the model (k = 1, … , 5) and individual patient profile z = (z1, … , zm), the hazard rate equals
| (1) |
where, λk,0 (t) is the baseline time-dependent hazard for each transition k, and βk for each transition k(k = 1, … , 5) is a vector of coefficients specifying the personal hazard rate, that is, the natural logarithm of the hazard rate ratio for each of the patient and tumor features included in the model. Note that the time t is time since the previous event. This means that for transitions 1–3, t is time since the start of treatment, and for transitions 4 and 5, t is time since the occurrence of LR or M, respectively.
In the MSSM model, we included factors that were available in the database; WHO performance status, N-stage, gross tumor volume (GTV), history of chemotherapy, age, and gender. We first tested whether these covariates and the RT2 treatment (RT2 v. RT1) were prognostic for any of the 5 transitions in our simulation model. We used backward selection to identify the variables that were most significantly associated with timing of LR, M, and death. In addition, we discussed and revised the variable selection with clinical experts, to ensure a conceptually valid model. Time to event was expressed in days.
Next, we tested 3 MSSM models with different model assumptions. Model 1 contained all aforementioned covariates, and the coefficients for these covariates were allowed to vary over transitions 1–3. For transitions 4 and 5, we included only RT2 as a covariate because of the small number of patients at risk after the occurrence of the first event. Model 2 was a simplification of model 1, in which the coefficients for covariates were kept identical over transitions 1–3 in as much as this was appropriate on the basis of likelihood ratio tests. Model 3 was an extension of model 1, in which the Markov assumption was relaxed by adding time to the intermediate events LR and M as separate covariates for transitions 4 and 5, respectively. All models were estimated using the mstate package in R version 2.15.9 The 3 resulting statistical models were tested for the proportional hazards assumption for each covariate separately using Schoenfeld residuals.
To allow prediction of individual life histories in the microsimulation model, an estimate of the baseline hazard is required. The msfit function in the mstate package is designed to obtain patient-specific transition hazards for a patient of interest based on the covariate values of that patient. In Equation 1, when the personal time-independent hazard ratios are equal to 1, the obtained personal hazard rate narrows down to the baseline hazard λ0,k (t) for each transition k. Thus, the baseline hazards were obtained by applying the estimated MSSM model to a hypothetical patient with scores 0 on all covariates. In that case, the msfit function, similarly as the survfit function, reduces to the Fleming-Harrington estimate of survival.
Implementation in the Microsimulation Model
For each of the 3 multistate statistical models, the obtained baseline hazards and the hazard ratios for all transitions were programmed in a microsimulation model, by using Microsoft Excel 2003 and the Visual Basic Editor.
Note that, in our previous step we estimated cause-specific hazard rates for each transition, which means that individuals experiencing a competing event are treated as censored for the event of interest. As LR, M, and death are mutually exclusive events in the microsimulation model, a competing risk correction is required. This is done by calculating the cumulative incidence from the separate cause-specific hazards as follows. The cumulative probability S(t) of not having experienced any of the Q competing events at time t is given by
| (2) |
The probability to fail from a specific cause q at time point j is then given by the hazard of failing from cause q multiplied by the probability of not having failed from any cause up till that time point. That is,
| (3) |
for any of the competing events q. The corrected cumulative risk until time t for each event q is then given by
| (4) |
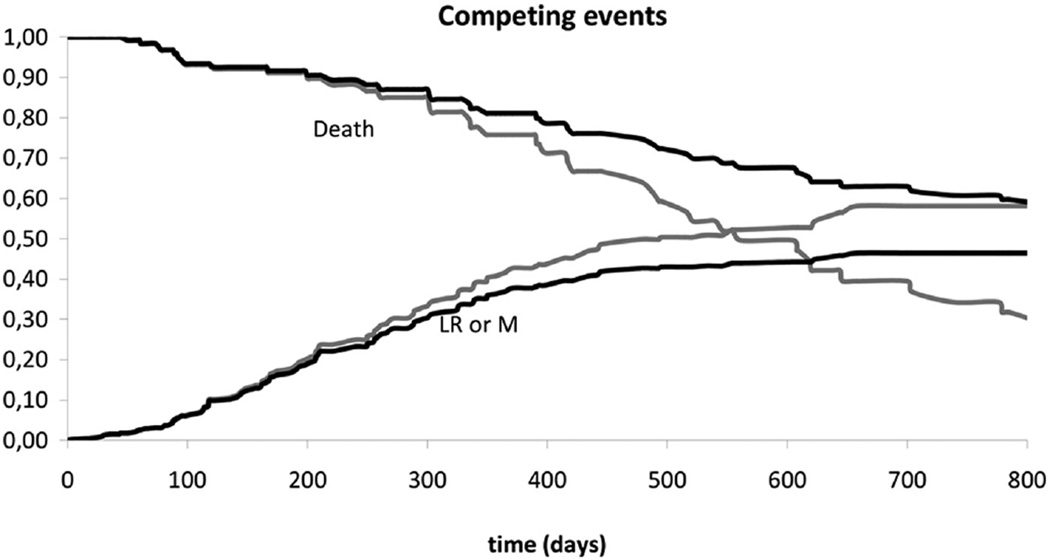
In Figure 2, the effect of this competing risk correction is shown for a simplified example. The 2 gray lines reflect the cumulative risk of recurrence (a single variable consisting of LR and M combined) and 1 minus the cumulative risk of death as observed in the database (derived from Kaplan-Meier survival tables). The gray lines cross, while the sum of both risks should be below 1 for all time points. The black lines showing the corrected cumulative risk of recurrence and 1 minus the cumulative risk of death do not cross and their sum remains below 1 at all time points.
Figure 2.
Risk prediction for recurrence and death, based on Kaplan-Meier estimates, with (black) and without (gray) correction for competing risks. For the sake of the example, local recurrence and metastasis are combined in a single variable “Recurrence.”
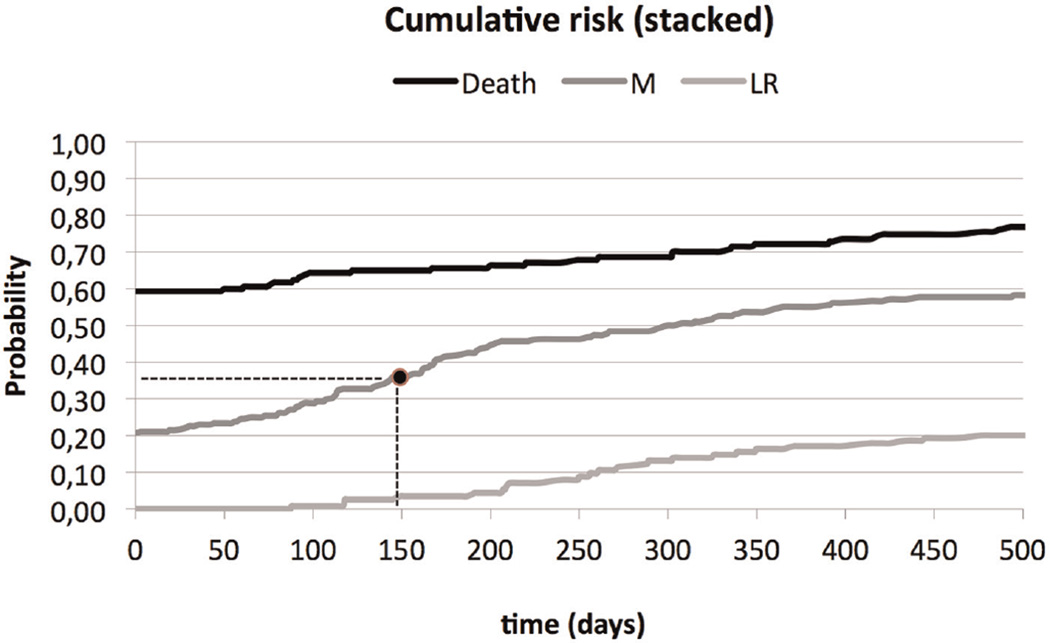
By using the baseline hazard and the covariate effects for each transition in this manner, 5 cumulative incidence curves can be derived for a specific patient profile. In Figure 3, the 3 cumulative risk curves for transitions 1–3 are depicted in a stacked manner. This presentation allows for easy inspection of the cumulative risk of each event over the whole time frame as well as the cumulative risk that no event occurs.
Figure 3.
Stacked cumulative risk: a random draw between 0 and 1 determines the event (death, local recurrence [LR], or metastasis [M]) and the timing of the event. As an example, a random draw of 0.36 results in a metastasis after 150 days.
Choice of MSSM Model, External Validation, and Uncertainty
To test which of the 3 implemented models provides the closest fit to the data, we simulated 5000 randomly drawn patient profiles with each model and compared the resulting predictions to the data.
The patient profiles were created based on the distribution of baseline clinical features and tumor features in the data and the correlations among these features (group 1 parameters). For each generated patient profile, the model calculates the personalized risks as illustrated for LR, M, and death in Figure 3. A random number between 0 and 1 is drawn and used to read from the figure the type of event and the time to that event. Next, in a similar fashion, a random number is drawn to define the occurrence of death and time to death after LR or M (transitions 4 and 5).
To select one of the MSSM models for future use in cost-effectiveness analysis, the following criteria were used. First, predicted overall survival was required to lie between the 95% confidence intervals of the observed Kaplan-Meier survival curve. Second, among models satisfying the first criterion, we selected the one with predictions for intermediate outcomes—time to LR, time to M, time from start of treatment to death, time from LR to death, and time from M to death—that were closest to the point estimates of the data (visual inspection).
There were no other datasets available in which the 2 radiotherapy treatment strategies were monitored over time. Therefore, it was impossible to perform a truly external validation of the model. However, we compared the results of the model to data from the Netherlands Cancer Registry. Patients who were diagnosed between 2000 and 2009, treated with radiation or chemoradiation, not eligible for surgery, and without distant metastases were selected from the registry. As a proxy for treatment strategy, we assumed that all patients who were treated before 2005 received a treatment that is similar to the RT1 strategy in our data, as that was the treatment protocol at that time. Patients who were treated after 2005 were assumed to have received treatment comparable to the strategy RT2 in our data, because this treatment protocol has gradually been adopted in clinical practice since 2005. Model predictions for overall survival for RT1 and RT2 were compared with overall survival in these 2 groups from the registry.
Parameter uncertainty is an important issue for future applications of the microsimulation model. To gain insight into the effect of uncertainty in the estimated covariate effects of the selected model on model predictions for overall survival, we obtained the joint correlation of the coefficients by using the chol function in R. This function provides a Cholesky matrix, which is used to draw correlated values for the coefficients of the MSSM model in sensitivity analyses.12 For the selected model, in this manner a probabilistic sensitivity analysis was carried out to show the variation in predictions for overall survival.
Finally, since we include patient heterogeneity in the model, the fit of the selected model for subgroups of the prognostic factors in the model was checked.
Role of the Funding Source
The funding sources had no role in the study design, data collection, data analysis, data interpretation, or writing of the report. The corresponding author had full access to all the data in the study and had final responsibility for the decision to submit for publication.
RESULTS
Multistate Statistical Modeling
We found the following factors to be prognostic in our MSSM model: WHO performance status, N-stage, GTV, gender, age, and RT2. After consultations with clinical experts, “history of chemotherapy” was added to the model, and gender and age were removed. The final selection of covariates consisted of WHO performance status, N-stage, GTV, history of chemotherapy, and RT2 for transitions 1–3. For transitions 4 and 5, only RT2 was included in the model, by forced entry.
In the first model, the coefficients of all prognostic covariates differed over the transitions. However, likelihood ratio tests showed that all covariates— with the exception of chemotherapy and N-stage— were identical over transitions 1–3. This resulted in our second model. According to the likelihood ratio test, the first model showed a better fit with the data than the second model, although the change in log likelihood with the second model was not significant. For model 3, time to LR and time to M were added as covariates to the transitions 4 and 5 of model 1, respectively. The hazard ratio for time to M (transition 5) was 1, indicating no effect (data not shown). Therefore, only time to LR only was maintained in the third model. Model 3 did not fit statistically significantly better than model 1.
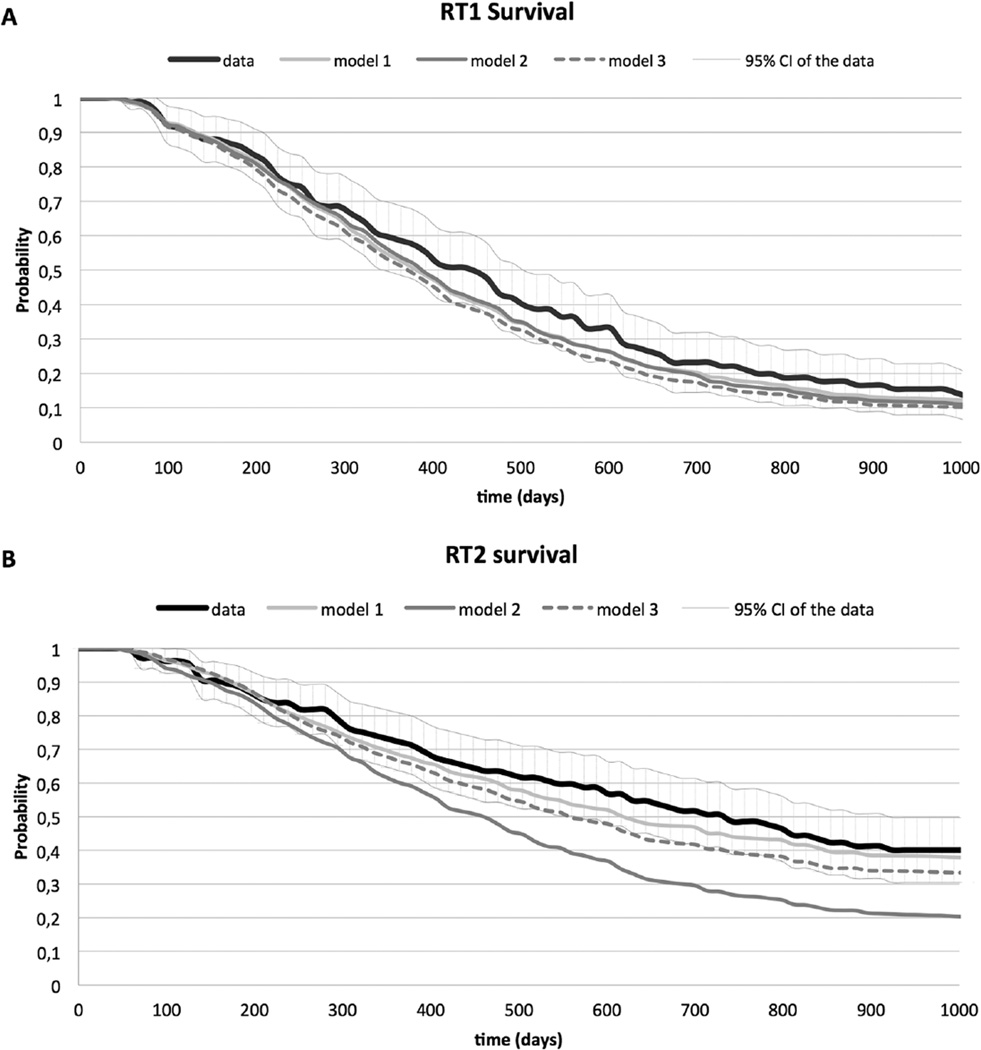
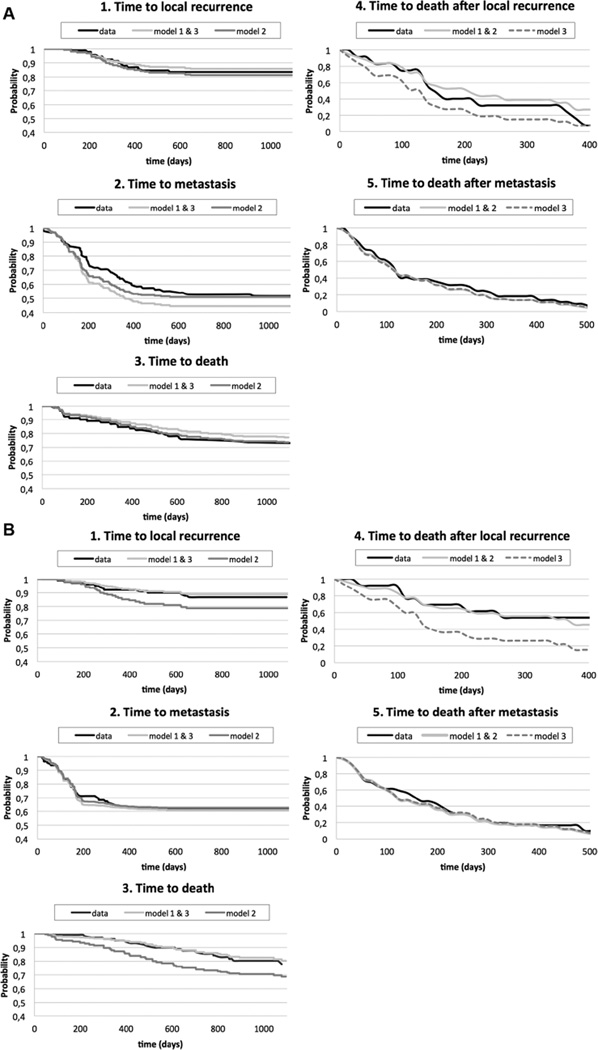
Figure 4 shows the predictions for overall survival obtained by microsimulation for the 3 models and the data. For all 3 models, the prediction of overall survival for RT1 is close to the observed survival in the data and within the 95% confidence intervals. For RT2, the predictions of the models are less close to the data. However, the predictions for model 1 fall within the 95% confidence intervals of the data. In Figure 5, the data and the simulation results for the 3 models are plotted for all transitions separately. As for overall survival, model 1 provides the closest fit to the data. The covariate estimates of the best fitting multistate model, which is model 1, are presented in Table 2.
Figure 4.
Overall survival estimated by all 3 models and overall survival with 95% CI obtained from the data for RT1 (A) and RT2 (B).
Figure 5.
(A) Fit of the 3 models for transitions 1–5 for RT1 (A) and RT2 (B). Note the different scaling for each transition on the x and y axes.
Table 2.
Parameter Estimates and Standard Errors for All Covariates and All Transitions for Model 1
| Transition 1: Timing of LR |
Transition 2: Timing of M |
Transition: 3 Timing of Death |
Transition 4: Timing of Death after LR |
Transition 5: Timing of Death after M |
||||||
|---|---|---|---|---|---|---|---|---|---|---|
| Coefficient (95% CI) |
P Value | Coefficient (95% CI) |
P Value | Coefficient (95% CI) |
P Value | Coefficient (95% CI) |
P Value | Coefficient (95% CI) |
P Value | |
| WHO performance status |
0.85 (−0.12, 1.82) |
0.09 | 0.84 (0.22, 1.46) |
0.01 | 0.54 (−0.33, 1.42) |
0.22 | ||||
| N status | −0.28 (−1.12, 0.55) |
0.51 | 0.41 (−0.11, 0.93) |
0.12 | 1.09 (0.40, 1.78) |
0.00 | ||||
| RT2 | −0.74 (−1.54, 0.05) |
0.07 | −2.27 (−2.98,-1.55) |
<0.001 | −0.91 (−1.55,-0.27) |
0.01 | −0.35 (−1.21, 0.50) |
0.42 | −0.14 (−0.59, 0.30) |
0.52 |
| GTV (per 10 cc) |
0.01 (−0.04,0.07) |
0.66 | −0.02 (−0.01–0.04) |
0.13 | 0.03 (0.01–0.06) |
0.02 | ||||
| Chemotherapy | 0.86 (−0.07, 1.79) |
0.07 | 1.17 (0.50, 1.83) |
<0.001 | −0.47 (−1.14, 0.20) |
0.17 | ||||
Note: CI = confidence interval; GTV = gross tumor volume; LR = local recurrence; M = metastasis; RT2 = radiotherapy planning based on positron emission tomography and computed tomography; WHO = World Health Organization.
The proportional hazard assumption was violated for the variable RT2. We constructed 2 variables for RT2: t1 for the coefficient for t < 200 days and t2 for the coefficient for t > 200 days. However, the predicted time-to-event curves for transition 2 showed inadequate fit to the data. From Figure 5, we see that observed Kaplan Meier curves for both treatment groups are similar up to t = 200, after which time the curve for RT1 drops as a result of relatively more events. Therefore, we assumed no effect of RT2 compared with RT1 before 200 days (hazard ratio = 1). The estimated hazard ratio for RT2 compared with RT1 after 200 days was 0.10 (e−22.27).
Calibration, Validation, and Uncertainty of the Final Model
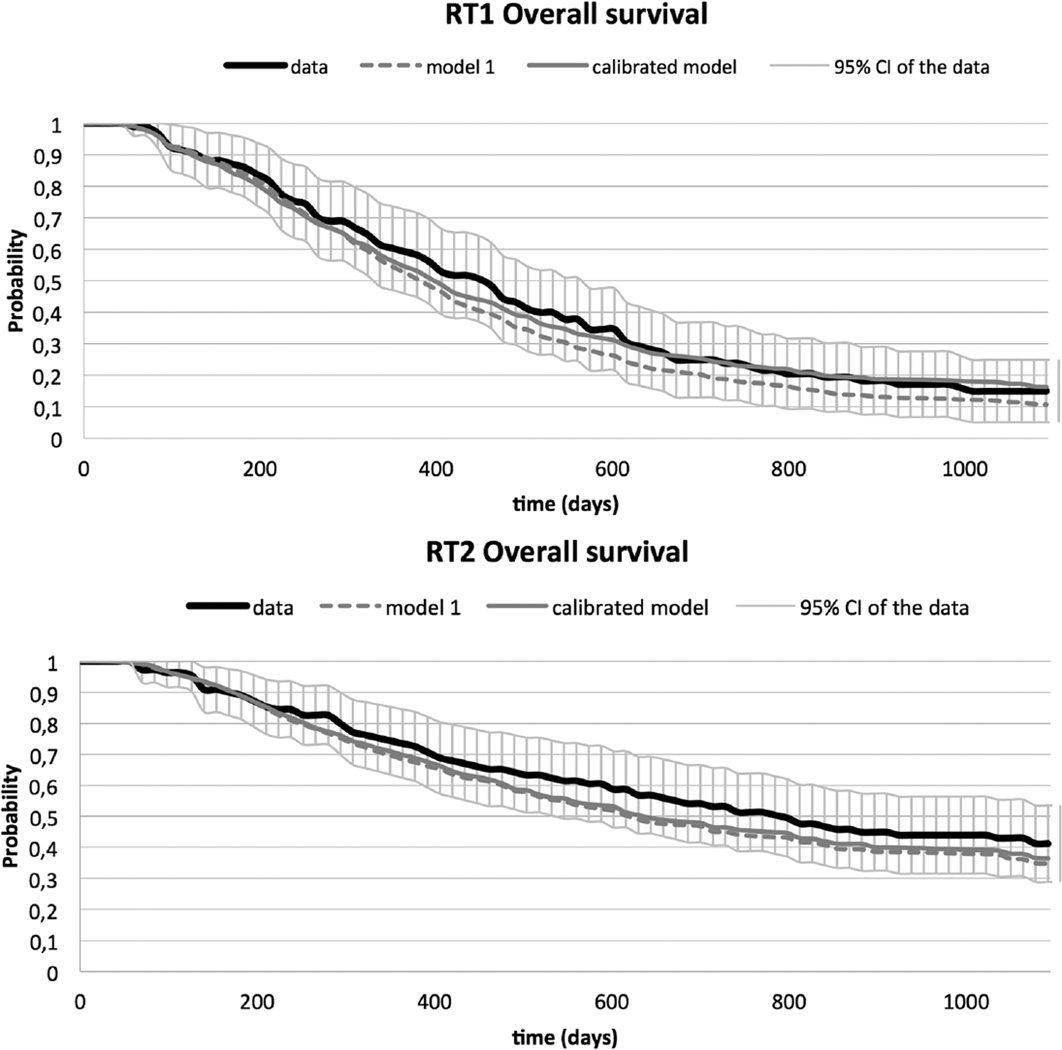
The model fit of model 1 for overall survival in both treatment groups was reasonably good; the curves for both strategies fell well within the 95% confidence intervals. This also held for the transitions separately, apart from transition 2. Based on discussions with clinical experts, model adaptations were considered and tested, the proportionality assumption was tested, and interaction terms were added to the model. These efforts, however, did not lead to a better model fit for transition 2. For future cost-effectiveness analysis, accurate estimation of time to metastasis is important. Therefore, we calibrated the baseline hazard λ0,k (t) for transition 2 for t < 150 by multiplication with a factor x that was step-wise decreased from x = 1 to x = 0.6 in steps of 0.05. Using x = 0.8 gave the best fit for transition 2 in both RT groups. The model fit of transition 2 as well as overall survival in RT1 was improved by the calibration, which is shown in Supplementary Figure 1 and in Figure 6, respectively. Supplementary Table 1 shows the survival outcomes of simulated patients predicted by the microsimulation model versus the observed survival outcomes as observed in the data.
Figure 6.
Model 1 with and without calibration for overall survival in both strategies.
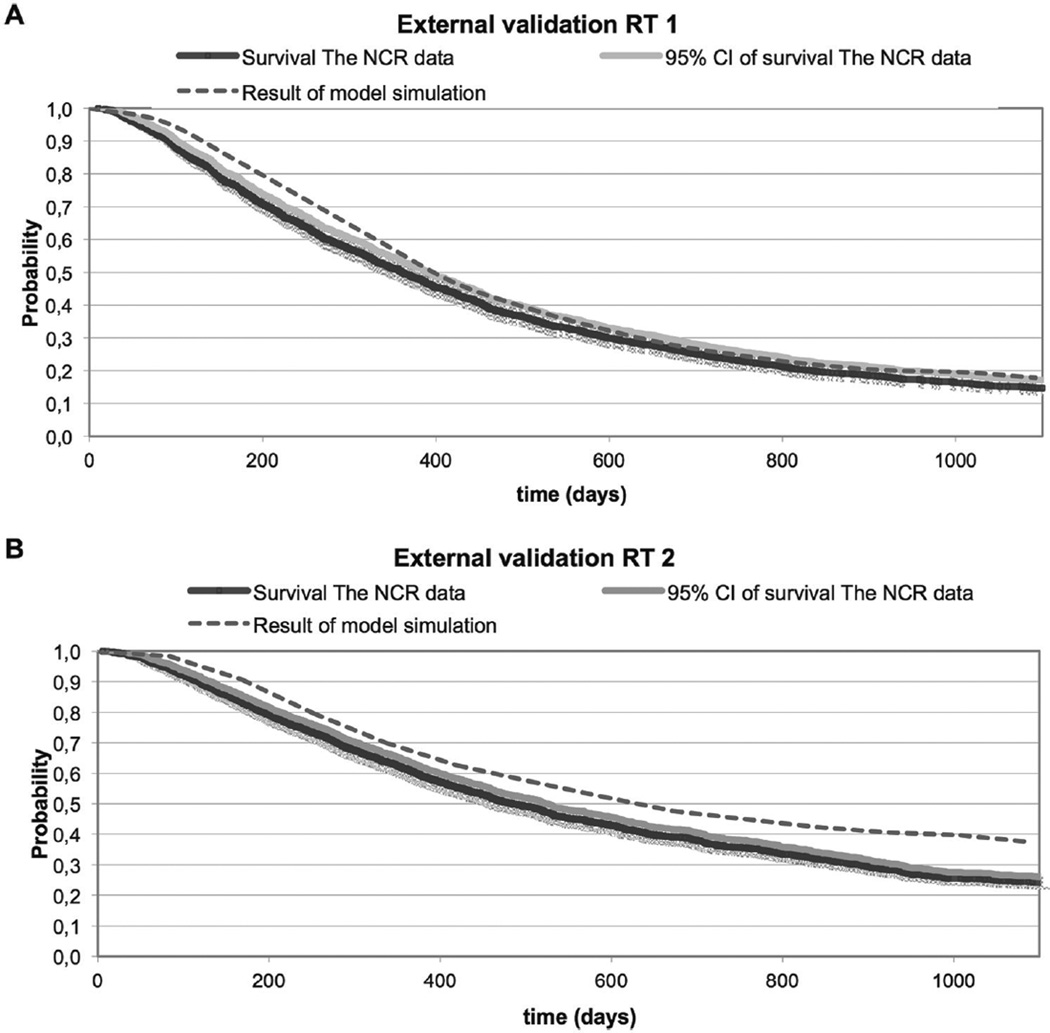
The external validity of the model for both treatment groups is presented in Figure 7. The model reproduced the overall survival for RT1 quite well, but the overall survival for RT2 is overestimated by the model compared with the data of the Netherlands Cancer Registry.
Figure 7.
The results of a simulation round of the model for strategy RT1 (A) and RT2 (B) compared with the survival curve obtained from the Netherlands Cancer Registry (NCR) data.
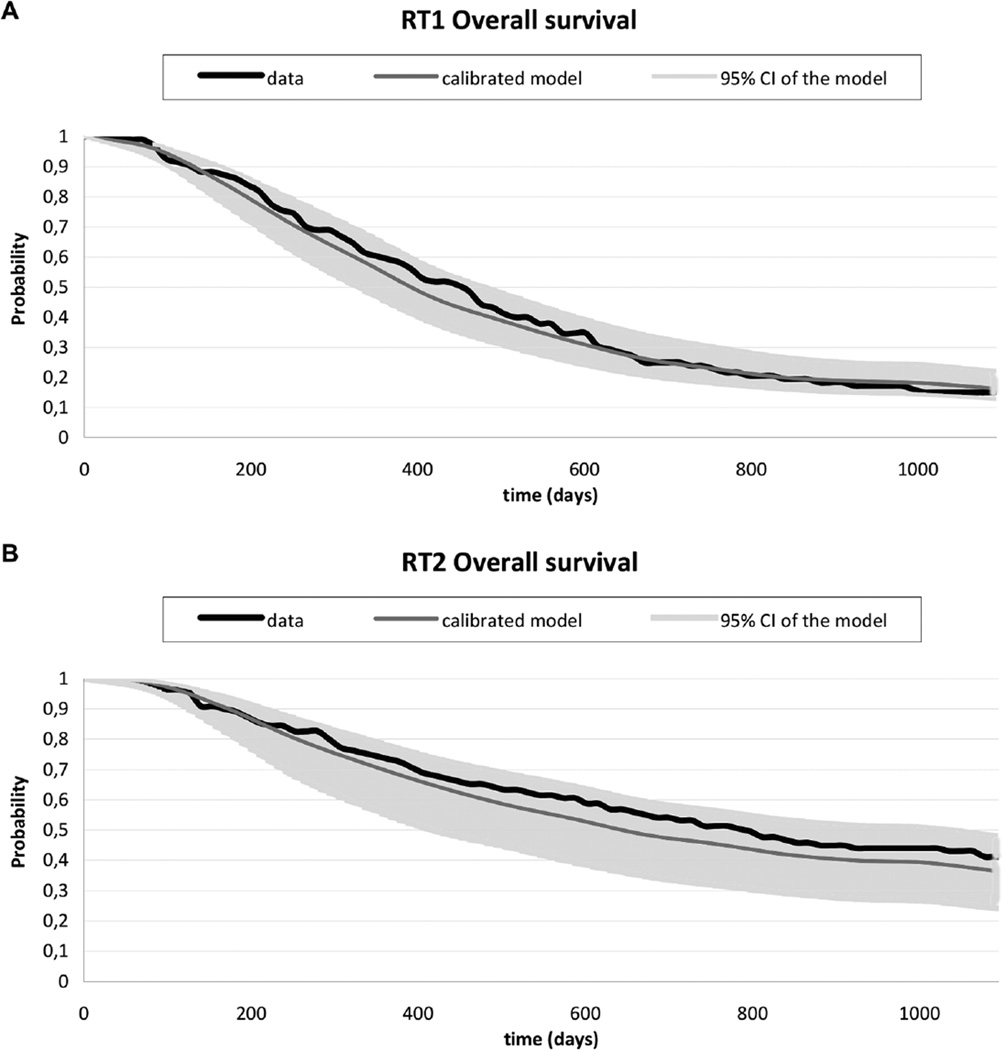
The results of the probabilistic sensitivity analyses of model 1 are presented in Figure 8. The uncertainty in the parameters is reflected by the variation in the predictions for overall survival.
Figure 8.
Survival curves of the data and the calibrated model for RT1 (A) and RT2 (B), with a 95% confidence interval based on the joint correlations of the log hazard ratios, representing the parameter uncertainty.
Conditional survival curves, separated by the prognostic factors of the model, showed a reasonable fit for most subgroups of patients (Supplementary Figure 2).
DISCUSSION
In this study, we applied the technique of MSSM to simultaneously estimate the transition rates of a microsimulation model in NSCLC. The final disease model describes the joint influence of clinical features, tumor features, and type of radiotherapy treatment on a range of relevant outcomes, such as the rates of local recurrence and metastasis and overall survival. In the model, patient heterogeneity as well as joint parameter uncertainty is taken into account. Both patient heterogeneity and uncertainty analyses are important issues in decision modeling when evaluating the cost-effectiveness of individualized treatments,13,14 and it is considered a challenge to include both in microsimulation models.15,16
With the progress of individualized medicine and the demand for the use of real-world data from registries, this type of modeling will become more and more important.1
In the final multistate model, we found WHO performance status, N-stage, GTV, history of chemotherapy, and RT2 to be prognostic factors for the cause-specific hazards of the events local recurrence, metastases, and death. In previously published models, performance status and disease stage were also found to be prognostic for survival.17 However, direct comparison of our estimates for the hazard rate ratios of different covariates to those published in other studies is not possible. The reason is that the coefficients in our model were estimated by means of cause-specific hazards under the assumption of censoring of the competing events. As a consequence, the resulting hazard rate ratios do not reflect the effect of covariates on the cumulative risk of an event of interest.8,18
Although a direct comparison is not possible, the following results need some discussion. We found a large positive effect of chemotherapy on the timing of metastases. The reason may be that patients with aggressive cancers are more likely to have received chemotherapy prior to radiotherapy. These patients are also more likely to develop an early metastasis. For RT2 as a predictor for the timing of death after both local recurrence and metastasis, we found small negative effects with wide confidence intervals. This can be explained by the small sample size for these transitions. In fact, we forced entry of RT2 in the model because we intend to use the model for a cost-effectiveness evaluation of strategy RT2. Note that the uncertainty in these coefficients will be taken into account in sensitivity analyses.
In the model-building process, we fitted 3 multistate models and ran a microsimulation to assess the fit to the data. The best fit was obtained by a model in which all covariate effects were allowed to vary over the transitions. This model reproduced the overall survival curves of the data reasonably well. Moreover, the occurrence and the timing of the intermediate outcomes were best approached by this model.
In the second model, only the covariate effects that were significantly different over transitions were allowed to vary. The difference in log likelihood of the second model compared with the first model was not statistically significant. From a statistical point of view this is the optimal model, since this model is statistically as likely to fit the data as the first model but with fewer covariates. However, it was not our aim to develop the optimal prediction model but rather to build a model that fits a range of targets as accurately as possible.
Relaxing the Markov property by including time to local recurrence as a predictor for time to death after local recurrence (model 3) did not result in a better prediction. This implies that time from a local recurrence or metastasis to death does not depend on the length of recurrence-free period. This finding is consistent with the study of Laporte and others,19 where correlations between progression-free survival and overall survival for advanced NSCLC were not statistically significant. However, evidence for a strong positive correlation between progression-free survival or locoregional control and overall survival has also been reported.20
An external validation of the model was conducted using data provided by the Netherlands Cancer Registry. As data on patient characteristics and detection of local recurrence or metastases were not available from the registry, only overall survival was compared. Model predictions of overall survival for the CT-based radiotherapy planning strategy closely corresponded to the overall survival of NSCLC patients treated with radiotherapy before 2005. Before 2005, the Dutch guidelines recommended CT-based planning in patients eligible for radiotherapy, and at that time PET-CT-based planning was hardly available. As such, the national data provide a good reference against which to compare the model predictions for CT-based planning. From 2005 onward, PET-based planning for NSCLC patients eligible for radiotherapy was introduced in Dutch hospitals. However, model-based predictions for overall survival under the PET-based radiotherapy planning strategy were more optimistic than was observed in the registry since 2005. The difference was in fact to be expected because this protocol is not operational in all hospitals since its introduction in 2005. More optimistic model predictions seem justified, but further external validation of the model using data from patients known to have been treated with PET-CT-based radiotherapy planning is desirable. In addition, there is a need to validate the model using a more complete external dataset that not only contains information on long term survival but also incorporates information on the prognostic variables that were included in the model and progression-free survival.
A number of challenges were encountered and dealt with in the construction of the radiotherapy model. First, because we chose to build the model using the technique of MSSM, the model structure was to a large extent driven by the type of events recorded in the database and the manner of recording these events. For example, in the model, the events local recurrence and metastasis were treated as if it were competing events, whereas in reality a local recurrence and a metastasis can occur sequentially or simultaneously. In individuals with both a local recurrence and a metastasis in the database, detection was mostly recorded to have occurred simultaneously. This is because patients undergo increased screening for distant metastasis when a local recurrence is diagnosed. In the model, these patients were assumed to have a metastasis rather than a local recurrence and the 2 types of event are considered mutually exclusive.
Second, due to the small number of patients at risk after local recurrence or metastasis, we were not able to add more covariates than type of radiotherapy to predict time till death from local recurrence and metastasis. Surely more factors are relevant for these transitions, such as WHO performance status at the time of diagnosis of the recurrence and type of subsequent treatment. Therefore, the simulation model is not applicable for the economic evaluation of treatments for recurrent disease. Moreover, the transition from local recurrence to metastasis could not be estimated due to a small number of patients who were registered with a metastasis after local recurrence. It is likely that patients who died after a local recurrence had undetected metastasis. So implicitly, this transition is included in the estimate for local recurrence to death. Our relatively crude model of progressed disease is not expected to be problematic, as long as the model is used to evaluate first-line radiotherapy strategies without changes in treatment for local recurrence or metastasis and as long as time between progression and death is estimated well. Moreover, for future cost-effectiveness analyses, we will limit the time horizon to 3 years, because of uncertainty in the tail of the survival curves. That is the model will be used to estimate truncated mean of life years gained.
Third, complete information on local recurrence and metastasis was not available for all patients in the database, so for parameter estimation we included patients with a known status of local recurrence and metastasis occurrence only. The selection of patients for whom information on intermediate events was known in the dataset did not bias the estimates for survival, since the selected patients have a similar survival as the nonselected patients with the same treatment.
Fourth, potential bias may have occurred as the treatments under evaluation were assigned as standard treatment over different time periods, namely before and after 2005. There may be factors other than treatment that were not included in the database but that affected the outcome. However, as both treatments were standard treatments at the time, we expect that selection of patients for either CT-based or PET-based radiotherapy planning proceeded in a similar fashion. In addition, we have included the most relevant and well known factors that affect clinical outcome in the model.
Finally, after selection of the most appropriate statistical model, we considered whether further model calibration was necessary. Calibration is the process of varying unobserved parameters until model outputs match the observed data, and it is typically used to inform the unknown parameters of disease simulation models.21 As the ultimate purpose of the microsimulation model is to carry out economic evaluations of radiotherapy treatment strategies, accurate estimation of the number and timing of events is necessary. The selected statistical model showed reasonable fit to the data for all transitions except for the transition to metastasis. Therefore, we calibrated the model by introducing a multiplication factor for the baseline hazard for this transition. Since only 1 transition needed improved prediction outcomes at this point, we chose this rather pragmatic approach for calibration. However, ideally, the model should have been calibrated against external data sources such that its validity is strengthened by additional evidence, rather than using this ad hoc and pragmatic calibration approach. This issue of external validation and model refinement will be the focus of future improvements to our lung cancer treatment model.
There are many approaches other than MSSM to estimate the parameters of microsimulation models. For example, transitions between states are often estimated independently using different sources of information. Patient-level data may be available for some transitions, whereas other parameters are essentially unobservable and are calibrated such that model predictions correspond to a number of defined targets. No consensus exists on how to perform calibration,22,23 partly because existing calibration methods are too time-consuming in combination with microsimulation. An example is Bayesian calibration, which is attractive because of its ability to provide both a best-fitting parameter set and credible intervals for all parameters. However, the technique is computationally prohibitive for microsimulation applications.24
The reason that we opted for MSSM for the quantification of our microsimulation model was the technique’s ability to simultaneously estimate all model parameters and provide an estimate of the joint uncertainty. Different types of multistate statistical models exist, with different assumptions about the dependence of transition rates on time, such as constant rates over time (time-homogeneous models), rates depending only on the current state of the individual (Markov models), and rates depending on time since entry of the current state (semi-Markov models).25 Also, different methods for parameter estimation exist, both parametric and nonparametric. Our NSCLC model is semi-Markov, and rates are allowed to vary over time through the nonparametric specification of the baseline hazards. However, since covariates are taken into account, we have focused on Cox-like transition rates, using the mstate package in R.9 We have not attempted to use other estimation methods, to quantify a structurally simpler model, or to incorporate a cross-validation procedure in the model estimation process. Therefore, we cannot exclude that a better fit to the data could have been achieved. Nevertheless, the technique by Putter and others9 allowed us to satisfactorily incorporate patient heterogeneity in the simulation model as well as the joint correlation among covariate effects for all transitions. Subgroup analyses with the model resulted in moderately well-fitted curves, permitting us to use the model to explore treatment strategies for specific target groups. Alternatively, a randomized controlled trial may be simulated, eliminating bias due to differences in baseline characteristics between treatment groups. Finally, our model is now well suited to carry out uncertainty analysis.
To our knowledge, this is the first time that a microsimulation model for cost-effectiveness analysis was built using MSSM. As a first application, the model is currently used in the evaluation of the cost-effectiveness of PET-CT-based isotoxic accelerated radiotherapy treatment planning in NSCLC.26
We consider the technique valuable for this purpose, because of its ability to simultaneously estimate the parameters for all transitions as well as their joint uncertainty.
Acknowledgments
This research was performed within the framework of CTMM, the Center for Translational Molecular Medicine, project AIRFORCE (grant 03O-103). The authors also acknowledge partial financial support from EU 7th framework program (METOXIA, EURECA, ARTFORCE).
Footnotes
The work in this manuscript was presented at ISPOR (International Society for Pharmacoeconomics and Outcomes Research) 16th Annual Meeting, Dublin, 3–6 Nov 2013.
Supplementary material for this article is available on the Medical Decision Making Web site at http://mdm.sagepub.com/supplemental.
REFERENCES
- 1.Lambin P, van Stiphout RGPM, Starmans MHW, et al. Predicting outcomes in radiation oncology—multifactorial decision support systems. Nat Rev Clin Oncol. 2013;10(1):27–40. doi: 10.1038/nrclinonc.2012.196. [DOI] [PMC free article] [PubMed] [Google Scholar]
- 2.Dehing-Oberije C, Yu S, DeRuysscher D, et al. Development and external validation of prognostic model for 2-year survival of non-small-cell lung cancer patients treated with chemoradiotherapy. Int J Radiat Oncol Biol Phys. 2009;74(2):355–362. doi: 10.1016/j.ijrobp.2008.08.052. [DOI] [PubMed] [Google Scholar]
- 3.Dehing-Oberije C, De Ruysscher D, van Baardwijk A, Yu S, Rao B, Lambin P. The importance of patient characteristics for the prediction of radiation-induced lung toxicity. Radiother Oncol. 2009;91(3):421–426. doi: 10.1016/j.radonc.2008.12.002. [DOI] [PubMed] [Google Scholar]
- 4.Dehing-Oberije C, De Ruysscher D, Petit S, et al. Development, external validation and clinical usefulness of a practical prediction model for radiation-induced dysphagia in lung cancer patients. Radiother Oncol. 2010;97(3):455–461. doi: 10.1016/j.radonc.2010.09.028. [DOI] [PubMed] [Google Scholar]
- 5.Dehing-Oberije C, Aerts H, Yu S, et al. Development and validation of a prognostic model using blood biomarker information for prediction of survival of non-small-cell lung cancer patients treated with combined chemotherapy and radiation or radiotherapy alone (NCT00181519, NCT00573040, and NCT00572325) Int J Radiat Oncol Biol Phys. 2011;81(2):360–368. doi: 10.1016/j.ijrobp.2010.06.011. [DOI] [PubMed] [Google Scholar]
- 6.Jayasurya K, Fung G, Yu S, et al. Comparison of Bayesian network and support vector machine models for two-year survival prediction in lung cancer patients treated with radiotherapy. Med Phys. 2010;37(4):1401–1407. doi: 10.1118/1.3352709. [DOI] [PubMed] [Google Scholar]
- 7.Houwelingen van JC, Putter H. Dynamic Prediction in Clinical Survival Analysis. Boca Raton (FL): CRC Press; 2012. [Google Scholar]
- 8.Putter H, van der Hage J, de Bock GH, Elgalta R, van de Velde CJH. Estimation and prediction in a multi-state model for breast cancer. Biom J. 2006;48(3):366–380. doi: 10.1002/bimj.200510218. [DOI] [PubMed] [Google Scholar]
- 9.Putter H, Fiocco M, Geskus RB. Tutorial in biostatistics: competing risks and multi-state models. Stat Med. 2007;26(11):2389–2430. doi: 10.1002/sim.2712. [DOI] [PubMed] [Google Scholar]
- 10.Ung YC, Bezjak A, Coakley N, Evans WK Lung Cancer Disease Site Group. Positron emission tomography with 18Fluorodeoxyglucose in radiation treatment planning for non-small cell lung cancer: a systematic review. J Thorac Oncol. 2011;6(1):86–97. [Google Scholar]
- 11.De Wreede LC, Fiocco M, Putter H. The mstate package for estimation and prediction in non-and semi-parametric multi-state and competing risks models. Comput Methods Programs Biomed. 2010;99(3):261–274. doi: 10.1016/j.cmpb.2010.01.001. [DOI] [PubMed] [Google Scholar]
- 12.Briggs AH, Claxton K, Sculpher MJ. Decision Modelling for Health Economic Evaluation. Oxford (UK): Oxford University Press; 2006. [Google Scholar]
- 13.Grutters JPC, Sculpher M, Briggs AH, et al. Acknowledging patient heterogeneity in economic evaluation: a systematic literature review. Pharmacoeconomics. 2013;31(2):111–123. doi: 10.1007/s40273-012-0015-4. [DOI] [PubMed] [Google Scholar]
- 14.Grutters JPC, Pijls-Johannesma M, Ruysscher DD, et al. The cost-effectiveness of particle therapy in non-small cell lung cancer: exploring decision uncertainty and areas for future research. Cancer Treat Rev. 2010;36(6):468–476. doi: 10.1016/j.ctrv.2010.02.018. [DOI] [PubMed] [Google Scholar]
- 15.Koerkamp BG, Stijnen T, Weinstein MC, Hunink MGM. The combined analysis of uncertainty and patient heterogeneity in medical decision models. Med Decis Making. 2011;31(4):650–661. doi: 10.1177/0272989X10381282. [DOI] [PubMed] [Google Scholar]
- 16.Koerkamp BG, Weinstein MC, Stijnen T, Heijenbrok-Kal MH, Hunink MGM. Uncertainty and patient heterogeneity in medical decision models. Med Decis Making. 2010;30(2):194–205. doi: 10.1177/0272989X09342277. [DOI] [PubMed] [Google Scholar]
- 17.Berghmans T, Paesmans M, Sculier J-P. Prognostic factors in stage III non-small cell lung cancer: a review of conventional, metabolic and new biological variables. Ther Adv Med Oncol. 2011;3(3):127–138. doi: 10.1177/1758834011401951. [DOI] [PMC free article] [PubMed] [Google Scholar]
- 18.Andersen PK, Geskus RB, de Witte T, Putter H. Competing risks in epidemiology: possibilities and pitfalls. Int J Epidemiol. 2012;41(3):861–870. doi: 10.1093/ije/dyr213. [DOI] [PMC free article] [PubMed] [Google Scholar]
- 19.Laporte S, Squifflet P, Baroux N, et al. Prediction of survival benefits from progression-free survival benefits in advanced non-small-cell lung cancer: evidence from a meta-analysis of 2334 patients from 5 randomised trials. BMJ Open. 2013;3(3):e001802. doi: 10.1136/bmjopen-2012-001802. [DOI] [PMC free article] [PubMed] [Google Scholar]
- 20.Mauguen A, Pignon J-P, Burdett S, et al. Surrogate endpoints for overall survival in chemotherapy and radiotherapy trials in operable and locally advanced lung cancer: a re-analysis of meta-analyses of individual patients’ data. Lancet Oncol. 2013;14(7):619–626. doi: 10.1016/S1470-2045(13)70158-X. [DOI] [PMC free article] [PubMed] [Google Scholar]
- 21.Weinstein MC. Recent developments in decision-analytic modelling for economic evaluation. Pharmacoeconomics. 2006;24(11):1043–1053. doi: 10.2165/00019053-200624110-00002. [DOI] [PubMed] [Google Scholar]
- 22.Kong CY, McMahon PM, Gazelle GS. Calibration of disease simulation model using an engineering approach. Value Health. 2009;12(4):521–529. doi: 10.1111/j.1524-4733.2008.00484.x. [DOI] [PMC free article] [PubMed] [Google Scholar]
- 23.Vanni T, Karnon J, Madan J, et al. Calibrating models in economic evaluation: a seven-step approach. Pharmacoeconomics. 2011;29(1):35–49. doi: 10.2165/11584600-000000000-00000. [DOI] [PubMed] [Google Scholar]
- 24.Rutter CM, Miglioretti DL, Savarino JE. Bayesian calibration of microsimulation models. J Am Stat Assoc. 2009;104(488):1338–1350. doi: 10.1198/jasa.2009.ap07466. [DOI] [PMC free article] [PubMed] [Google Scholar]
- 25.Meira-Machado L, de Uña-Alvarez J, Cadarso-Suárez C, Andersen PK. Multi-state models for the analysis of time-to-event data. Stat Methods Med Res. 2009;18(2):195–222. doi: 10.1177/0962280208092301. [DOI] [PMC free article] [PubMed] [Google Scholar]
- 26.Bongers ML, Coupé VHM, De Ruysscher D, Oberije C, Lambin P, Uyl-de Groot CAML. Individualized PET-based isotoxic accelerated radiotherapy is cost effective compared to conventional radiotherapy: a model-based evaluation. Int J Radiat Oncol Biol Phys. 2015;91(4):857–865. doi: 10.1016/j.ijrobp.2014.12.012. [DOI] [PubMed] [Google Scholar]


