Abstract
Background:
Liver cancer exhibits geographic and ethnic differences in its prevalence and biology, which implies that it is impractical to develop universal guidelines for all patients. Thus, a meta-analysis was conducted to identify the accuracy of apparent diffusion coefficients (ADCs) for discriminating malignant from benign liver lesions in Asians.
Methods:
Eligible studies published in PubMed, Ovid, and Embase/Medline were updated onto October 2014. STATA 12.0 and Meta-Disc 1.4 were used to perform this meta-analysis.
Results:
Eight studies comprising 661 benign liver lesions and 598 malignant liver lesions fulfilled all the inclusion criteria. The pooled sensitivity, specificity, positive likelihood ratio, negative likelihood ratio, and diagnostic odds ratio were 0.88 (95% confidence interval [CI] 0.75–0.95), 0.93 (95% CI 0.86–0.97), 12.42 (95% CI 6.09–25.31), 0.13 (95% CI 0.06–0.29), and 95.58 (95% CI 35.29–258.89), respectively. Overall, the area under the summary receiver-operating characteristic curve was 0.96 (95% CI 0.94–0.98). Heterogeneity was found to originate potentially from the type of benign lesion. A subgroup analysis showed that differentiating between hemangiomas, cysts, and malignant liver lesions produced a significantly higher diagnostic accuracy than that of solid liver lesions.
Conclusion:
Our meta-analysis indicated that ADC could be promising for characterizing liver lesions among Asians, indicating that the ADC value is a promising diagnostic criterion candidate. Meanwhile, the use of dual b values could be sufficient for liver lesion characterization. However, large-scale, high-quality trials should be conducted to identify specific standards, including cut-off values for further development of diffusion-weighted imaging as a routine clinical application among Asian populations.
Keywords: apparent diffusion coefficients, diagnostic accuracy, liver cancer, meta-analysis
1. Introduction
Globally, the prevalence of liver cancer in the general population has been increasing dramatically. Because of its late diagnosis and poor prognosis, liver cancer has become the second leading cause of cancer-related mortality worldwide.[1] A large amount of data show that the incidence of liver cancer varies significantly worldwide. According to the latest research by the International Cancer Research Center (IARC), liver cancer occurs more often in Eastern countries, and Asian males are the most vulnerable population.[1,2] In contrast to other malignancies, the prevalence and biology of liver cancer display large differences between Asian and Western countries; these differences indicate the potential existence of geographic and ethnic differences.[3]
Approximately 748,300 new cases are diagnosed with liver cancer in 2008, whereas over 80% of them live in developing countries.[1] The highest rate of yearly diagnosis is reported to appear in Asian-Pacific regions, the medium in black, and the lowest in the white and American Indian/Alaska natives.[1,4,5] Particularly, China alone is host to nearly half of the world's total new cases.[6] The geographic and ethnic variability in the prevalence and diagnosis rates is largely explained by different risk factors of liver cancer. The hepatitis B virus (HBV) or hepatitis C virus (HCV) infection, which accounts for the overwhelming majority of all the liver cancer cases, is more prevalent in the Asian-Pacific nations.[5,7–9] Meanwhile, aflatoxin is an important risk factor for the development of liver cancer in parts of Africa and Asia. For example, aflatoxin exposure lead to 27% to 60% of primary liver cancer in Sudan.[10] However, the majority of liver cancer in the United States and several other low-risk Western countries are thought to result from alcohol-related cirrhosis and nonalcoholic fatty liver disease, associated with metabolic syndrome.[11–13] Furthermore, the differences of liver cancer between Western and Asian countries produce significant impacts on making treatment choices and evaluating prognosis. In Asia, the proportion of patients presenting with resectable hepatocellular carcinoma (HCC) is as low as 10% to 15%, which is half that of lower incidence regions, such as the United States and Europe.[14] When advanced HCCs were treated with sorafenib, which was the only approved systemic therapy, the median overall survival was 10.7 months in Western patients and 6.5 months in Asian patients.[15,16]
The above-mentioned evidences demonstrate the remarkable difference in the diagnostic rates, susceptibility, etiology, treatment, and prognosis of liver cancer between Western and Asian nations. Therefore, it is impractical to develop universal guidelines for all patients with liver cancer. Since an early and accurate diagnosis is important for determining the appropriate treatment modality and improving the prognosis of liver cancer,[17–19] it is very essential to provide a novel, unique, and powerful diagnostic method to distinguish malignant liver lesions from benign ones, especially for Asians who are at high risk for liver cancer from both the geographic and ethnic perspectives. Currently, early diagnosis mainly depends on medical imaging. However, the differential diagnosis between malignant tumors (eg, HCC and metastases) and benign liver lesions (cysts, hemangiomas, and focal nodular hyperplasia) remains a formidable challenge for radiologists. To accurately diagnose liver lesions, a large array of imaging modalities, such as liver ultrasound, spiral computed tomography (CT), and magnetic resonance imaging (MRI), have been widely used in clinical practice.
With recent progresses in imaging techniques, MRI has developed into a valuable tool for the noninvasive diagnosis and characterization of liver lesions. Diffusion-weighted imaging (DWI), as a new parametric MRI approach, has gained significant attention in oncologic imaging, because it allows not only a morphological evaluation but also functional and pathological evaluations of various diseases.[20–23] DWI is a noninvasive MRI method based on the information of water proton mobility, which is well-known as Brownian motion. Brownian motion has primarily been applied in brain imaging, mainly for the evaluation of ischemic stroke, intracranial tumors, and demyelinating diseases.[24–26] With the current development of the advanced respiratory gating technique and sensitivity encoding, abdominal DW-MRI has been increasingly used in diseases of the liver, the imaging of which was formerly restricted by respiratory movement. DWI has been used to assess the degree of hepatic fibrosis,[27–30] detect hepatic lesions,[31–34] and differentiate malignant from benign lesions[32,35–41] independently from T1 and T2 relaxation times and without the need for contrast agent administration.
The apparent diffusion coefficient (ADC), as a quantitative parameter of DWI, can reflect tissue diffusibility by monoexponential fitting of DWI data obtained through different field gradients (b values). Due to microstructural tissue changes, malignant tumors generally restrict water diffusion, whereas benign lesions do not. Benign lesions have significantly higher ADC values than malignant lesions. Therefore, the ADC was thought to have the potential to differentiate benign from malignant hepatic lesions. Several studies[32,35–41] have indicated that the reported ADC values of benign and malignant hepatic lesions ranged from 1.55 to 7.58 and 0.68 to 3.15 (×10−3 mm2/s), respectively, resulting in several recommended ADC cut-off values, but there were also variable degrees of overlap between these values. In these studies, different DWI sequence parameters, such as the set of b values or the use of the parallel imaging technique, may lead to different ADC values for liver lesions, consequently resulting in various cut-off values for differentiating malignant and benign lesions, and overlapping ADC values for malignant and benign lesions.
A previous meta-analysis of 6 studies was performed to evaluate the diagnostic value of quantitative diffusion-weighted MRI for differentiating between malignant and benign focal liver lesions (FLLs).[42] However, one-third of the selected studies were from HBV-endemic Asian populations, whereas the remaining studies were from Western countries. As mentioned above, the neglect of the regional differences in liver cancer may produce a certain deviation in the pooled results. In a meta-analysis of diseases with obvious regional differences, the previous results may cover up the notable heterogeneity between the studies. Therefore, a study that limited the research subjects to Asian individuals would be more likely to reveal the accuracy of the ADC in the quantitative diagnosis of liver cancer in endemic areas, which is more valuable for diagnostic purposes in practice. In our meta-analysis, the related articles were updated, and the overall accuracy of the ADC for the differential diagnosis between benign and malignant liver lesions was assessed only in Asian patients.
2. Methods
2.1. Search strategy
A literature search of PubMed, Ovid, and Embase/Medline was performed using the following keywords and MeSH terms: [“Diffusion Magnetic Resonance Imaging,” “Diffusion weighted images,” “apparent diffusion coefficient,” “DWI,” “ADC”] and [“cancer,” “neoplasm” and “liver,” “Hepatocellular Carcinoma”] without language restrictions. The last search was updated on May 27, 2014. We also performed a manual search of the reference lists of the included studies and review articles to identify additional eligible studies. Since a meta-analysis is a systematic summary and statistical analysis of the results of published studies, ethical approval was not necessary for this study.
2.2. Study selection
Two reviewers independently reviewed all the studies that met the following inclusion criteria: the patients of the included studies were Asian; the ADC values for the differential diagnosis between benign and malignant liver lesions were calculated and were not combined with other MR series; the reference standards included a histopathological analysis (performed at surgery and biopsy) or follow-up; and the published data must be sufficient to form 2 × 2 tables. Studies that did not meet all the inclusion criteria were excluded. Animal studies, reviews, and letters were also excluded. The most recent publication or publication with the largest sample size was included when the authors published several studies using the same subjects.
2.3. Data extraction
The full manuscripts of the included articles were independently reviewed by 2 reviewers. We extracted the following data: author, country of origin, publication year, number of patients, patient enrollment, study design, ADC values of malignant and benign lesions, “gold standard,” and b values. The numbers of true-positive, false-positive, true-negative, and false-negative data were collected to construct a 2 × 2 table. Any disagreements were resolved by consensus.
2.4. Quality assessment
Two observers independently assessed the methodological quality of the included studies using the Quality Assessment of Diagnostic Studies (QUADAS) instrument.[43] Each item was scored as “yes” (1), “no” (−1), or “unclear” (0). The disagreements were resolved by consensus discussion. QUADAS scores range from 0 to 14, and a score ≥10 indicates a high-quality study.
2.5. Statistical analysis
STATA version 12.0 and Meta-Disc version 1.4 (Universidad Completeness, Madrid, Spain) software were used for the meta-analysis. For each study, the sensitivity (Sen), specificity (Spe), positive likelihood ratio (LR+), negative likelihood ratio, and diagnostic odds ratio (DOR), along with their 95% confidence intervals (CIs), were graphically displayed using forest plots. We constructed summary receiver-operating characteristic (SROC) curves on a per-study basis to show the summary trade-off between sensitivity and specificity. The threshold effect was assessed by Spearman rank correlation test and the shape of the SROC curve. If the threshold effect was thought to be absent, a bivariate model was used. Cochran Q test was used to assess the presence of statistical heterogeneity, and the I2 test was used to estimate the magnitude of heterogeneity. If the Q test showed a P value <0.05 or the I2 test revealed a heterogeneity >50%, a random-effects model was constructed. Then, we performed subgroup and meta-regression analyses based on patient enrollment, sample size, number of b factors, quality score, and type of benign lesions to investigate potential sources of heterogeneity. If the heterogeneity analysis could not identify the data sources, a descriptive analysis was then performed among the groups or a sensitivity analysis was conducted to verify the stability of the results. Publication bias was examined visually by inspecting the funnel plots.
3. Results
3.1. Characteristics of the included studies
Figure 1 outlines the selection process. Initially, the searched keywords identified 405 articles after removing duplications. We reviewed the titles and abstracts of all the articles and excluded 317 articles. After reading the full texts of the remaining articles, 8 studies, including a total of 661 benign lesions and 598 malignant lesions that met all the inclusion criteria, were included, and a 2 × 2 contingency table was completed. Five, 1, and 2 studies were conducted in Japan, China, and Korea, respectively. The extracted useable data and the study characteristics of each article are summarized in Table 1. In the study by Yang et al,[32] an analysis of DWI images was performed independently by 2 observers; thus, 2 subsets of data from the study were included. Therefore, we extracted 9 subsets of data from all 8 studies.
Figure 1.
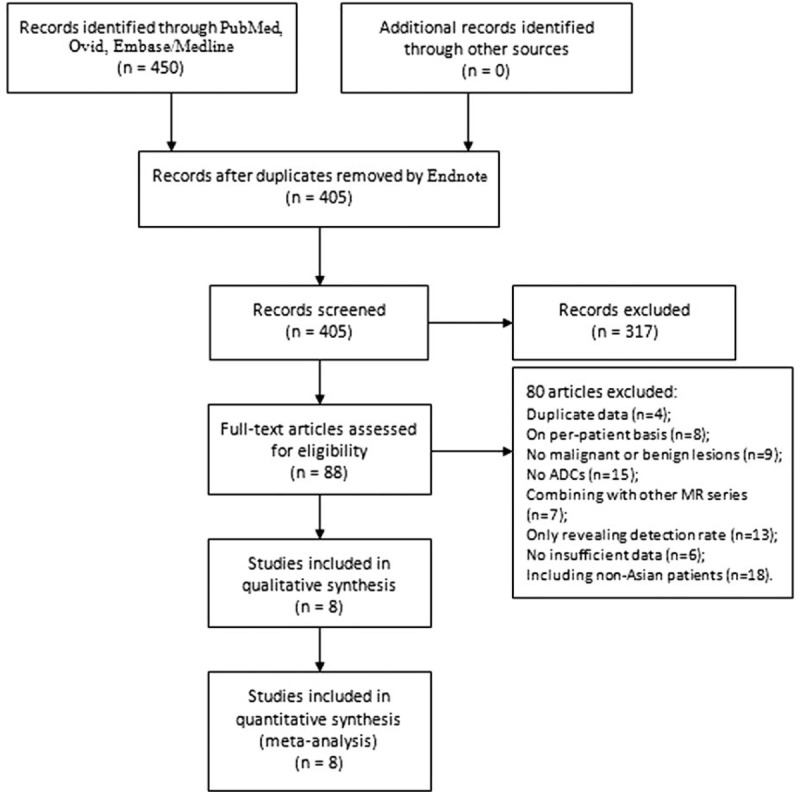
Flow chart of the articles identified and included in this meta-analysis.
Table 1.
Baseline characteristics and methodological quality of all the included studies.

3.2. Assessment of study quality
The quality of the included studies affects the quality and reliability of a meta-analysis. Using the QUADAS tool, we scored every item of the included papers, and the results are shown in Table 1. Most of the included studies in this meta-analysis lacked consensus regarding a gold standard and used a “histopathology analysis and/or intraoperative sonography and/or careful surgical inspection and palpation of the liver and/or cross-sectional image follow-up (at least 6 months).” The absence of a time interval between the histopathological confirmation and the index tests in most studies was another major problem. The interval time information is crucial because the disease can progress fast. Furthermore, in test accuracy studies, the interpretation of the results of the index test may be influenced by knowledge of the results of the reference standard, and vice versa. This is known as review bias and may exaggerate the diagnostic accuracy. As the index test, DWI was always performed first, and the interpretation of the DWI results was usually conducted without knowledge of the results of the reference standard. However, only a few articles provided detailed information on whether the individuals interpreting the pathology were blinded from the DWI results. Additionally, descriptions of the selection criteria, available clinical data, and uninterpretable results were often not reported.
3.3. Threshold effect analysis and publication bias
The threshold effect analysis was assessed using Spearman rank correlation test and the shape of the SROC curve. Spearman correlation coefficient (r = 0.367, P = 0.332) and the lack of a “shoulder-arm” shape in the SROC curve indicated the absence of a threshold effect that could cause variations in accuracy estimates among the individual studies. Deek funnel plot was assessed and revealed no presence of publication bias (P = 0.167).
3.4. Quantitative data synthesis
Figures 2–6 show the forest plots of the Sen, Spe, DOR, LR+, and LR− for the differential diagnosis between benign and malignant liver lesions in 9 subsets of data from all 8 studies. We plotted the fitted SROC curve (Fig. 7); overall, the AUC was 0.96 (95% CI 0.94–0.98). The SROC curve suggested that the ADC was a very good tool for differentiating malignant from benign liver lesions. Based on a P value <0.05 and I2 >50% of the pooled DOR, notable heterogeneities were likely to exist.
Figure 2.
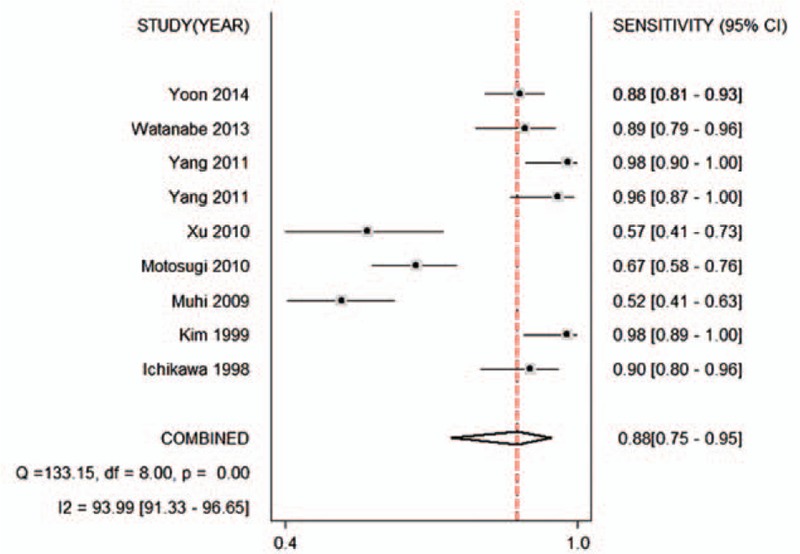
Forest plot of the pooled sensitivity of the ADC for the differential diagnosis of benign and malignant lesions in Asian populations. The summary sensitivity was 0.88 (95% CI 0.75–0.95). ADC = apparent diffusion coefficient, CI = confidence interval.
Figure 6.
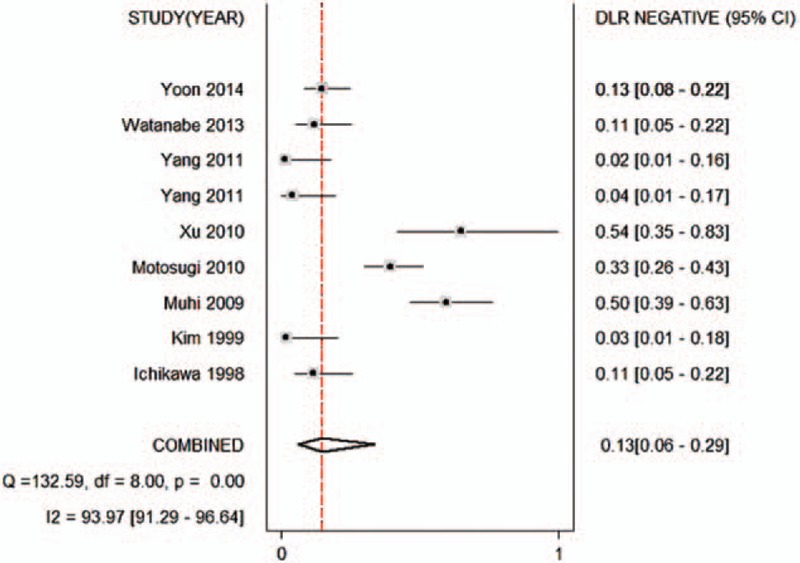
Forest plot of the negative likelihood ratio of the ADC for the differential diagnosis of benign and malignant lesions in Asian populations. The summary negative likelihood ratio was 0.13 (95% CI 0.06–0.29). ADC = apparent diffusion coefficient, CI = confidence interval.
Figure 7.
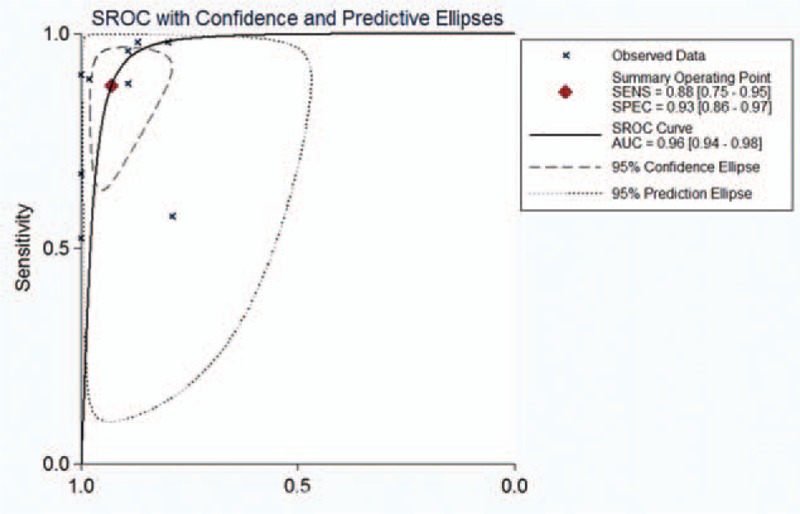
Summary receiver operating characteristic (SROC) curves of the ADC for the differential diagnosis of benign and malignant lesions in Asian populations. ADC = apparent diffusion coefficient.
Figure 3.
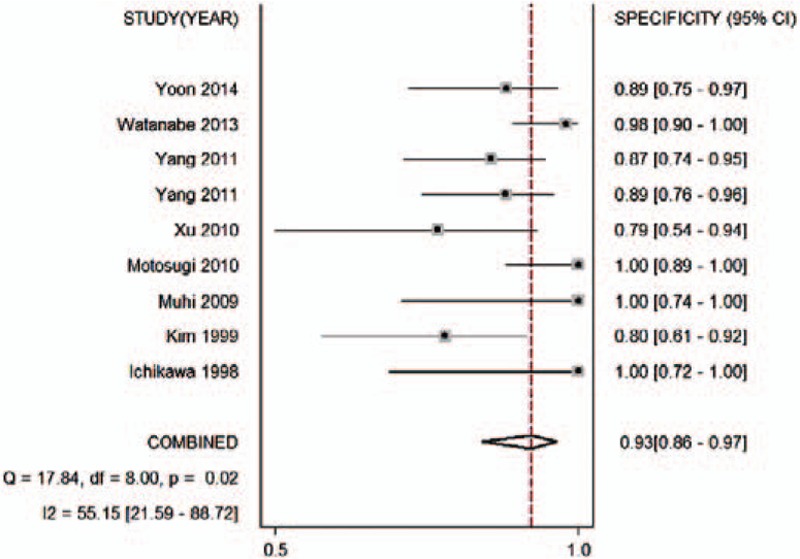
Forest plot of the pooled specificity of the ADC for differential diagnosis of benign and malignant lesions in Asian populations. The summary specificity was 0.93 (95% CI 0.86–0.97). ADC = apparent diffusion coefficient, CI = confidence interval.
Figure 4.
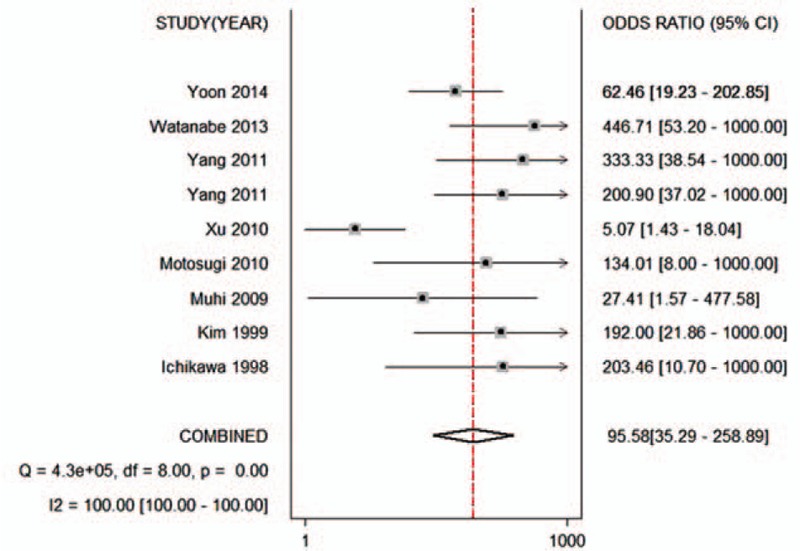
Forest plot of the pooled odds ratio of the ADC for differential diagnosis of benign and malignant lesions in Asian populations. The summary odds ratio was 95.58 (95% CI 35.29–258.89). ADC = apparent diffusion coefficient, CI = confidence interval.
Figure 5.
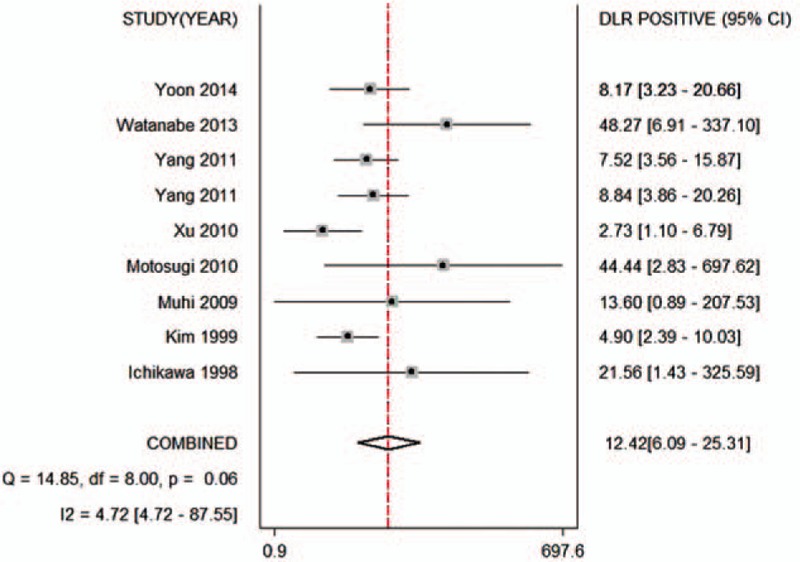
Forest plot of the positive likelihood ratio of the ADC for the differential diagnosis of benign and malignant lesions in Asian populations. The summary positive likelihood ratio was 12.42 (95% CI 6.09–25.31). ADC = apparent diffusion coefficient, CI = confidence interval.
3.5. Subgroup and meta-regression analyses
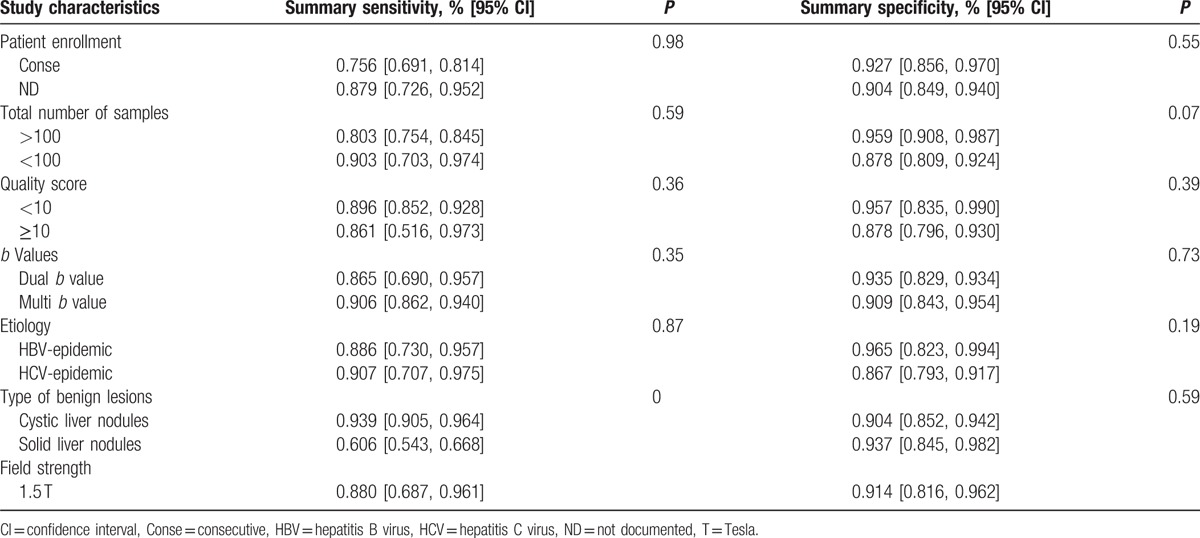
The results of the subgroup analysis are presented in Table 2. The patients’ enrollment (consecutive vs nonconsecutive or unclear), sample size, number of b factors, and quality scores did not significantly influence the sensitivity of the diagnostic accuracy of the test. The subgroup and meta-regression analyses confirmed that the ADC for the differential diagnosis between hemangiomas, cysts, and malignant liver lesions yielded a significantly higher sensitivity than that of solid lesions. We included articles performed with 3.0-T and 1.5-T device. We attempted to reveal whether magnetic field strength influenced the pooled accuracy, but failed due to the relatively small number of included studies (2 reports) utilizing 3.0-T devices. Then we excluded these 2 reports and calculated an overall sensitivity of 0.880 (95% CI 0.687, 0.961) and specificity of 0.914 (95% CI 0.816, 0.962).
Table 2.
Subgroup analysis.
4. Discussion
The ADC value, which is a quantitative parameter of DWI technology, is extremely sensitive to the pathological changes associated with liver cancer. Low ADC values were found in malignant tumors as a result of high cellularity, increased nuclear/cytoplasmic ratios, and massive macromolecular proteins, which restricted the diffusion of water molecules in the intracellular space.[44,45] In addition, DWI can suppress the signals of other structures, such as vascular structures and bile ducts.[46] Therefore, DWI is thought to be a new and excellent MRI approach that can provide information on oncological, morphological, and pathological changes.
The incidence of liver cancer varies widely worldwide, with high rates in sub-Saharan Africa and eastern and south-eastern Asia, and a low incidence in Europe and the Americas.[1,47] Liver cancer in adults occurs primarily as 3 histological types: HCC, cholangiocarcinoma, and metastasis. According to data from the World Health Organization (WHO), the most common form of liver cancer is HCC, which accounts for 70% to 85% of the total primary liver cancer burden worldwide.[48] The pathology of this type of liver cancer exhibits some ethnic and regional differences between Asian and Western countries. According to Song et al's[49] comparative study using the paraffin sections of resected HCC specimens from American and Korean patients, tumor size was significantly larger in the American group (mean 10.96 ± 5.37 cm) compared with the Asian group (mean 5.60 ± 4.11 cm). Regarding tumor pathology, tumors in Asians were more often poorly differentiated and accompanied by invasions of adjacent organs and blood vessels. The data showed that pathological differences in liver cancer were indeed present between regions.
This phenomenon subsequently results in subtle differences in diagnostic criteria and clinical management. Currently, ultrasound has been commonly used for the early detection of HCC in clinical practice. Patients with an increased risk of developing HCC from the United States are recommended to undergo screening with ultrasound and serum AFP measurements every 6 to 12 months, whereas the Asian Oncology Summit suggested that these screening tests should be conducted every 3 to 6 months,[3,14,50] which implies that regional diversities may be a factor influencing the diagnostic performance of various diagnostic methods. Similar to ultrasound, ethnic and regional differences should also be considered as important influential factors in other types of radiology studies. In this study, DWI was chosen as the diagnostic method for malignant neoplasms in the liver. For further study, we extracted the ADC values of primary liver lesions derived from both European and Asian patients. The relevant data are summarized in Table 3. In Asia, the ranges of the mean ADC values of HCC, hepatic metastasis, and hemangiomas were approximately 0.68 to 3.15, 1.06 to 2.55, and 2.00 to 7.58 (×10−3 mm2/s), respectively,[35–39,41] whereas the corresponding ADC values for European patients were 0.94 to 1.19, 0.87 to 1.16, and 1.55 to 1.89 (×10−3 mm2/s), respectively.[51–55] The ADC ranges for each lesion in Asia vary greatly from those in Europe, which supports our viewpoint that geographic heterogeneity cannot be ignored when estimating the diagnostic accuracy of ADC values in liver diseases.
Table 3.
The ADC values (×10−3 mm2/s) of the main types of FLLs and the cut-off values (×10−3 mm2/s) for differentiating between malignant and benign FLLs in both Asian and European studies.

For the above reasons, we attempted to analysis the diagnosis performance of ADC for both Asian and Western countries, but failed. The probable reason was that the population of Western countries is quite transient and has complicated composition, and the articles included for Western countries did not provide definite information of clinical value of ADC for different races and ethnicities. On the contrary, Asian population is relatively simple, and the majority of the Asians belong to yellow race. Therefore, in this meta-analysis, we only focused on studies performed in Asia and identified 8 independent studies in the literature. Finally, a total of 661 benign liver lesions and 598 malignant liver lesions were included. Based on systematic calculations of the relevant data, the overall Sen, Spe, and DOR of the ADC were 0.88 (95% CI 0.75–0.95), 0.93 (95% CI 0.86–0.97), and 95.58 (95% CI 35.29–258.89), respectively. Overall, the area under the SROC curve was 0.96 (95% CI 0.94–0.98). These results indicate that the ADC value is a good tool for differentiating between benign lesions and malignant tumors in Asian patients. Regardless of geographic differences, a previous meta-analysis of 6 diagnostic studies revealed pooled Sen and Spe values of 0.86 (95% CI 0.83–0.90) and 0.84 (95% CI 0.78–0.88), respectively.[42] Compared with previous data, the relatively better results revealed by our analysis suggested that the ADC value may be more applicable for discriminating malignant from benign liver lesions in Asian populations.
However, there was notable heterogeneity in the Sen and DOR values in the studies analyzed. Therefore, an exploration of the source of heterogeneity to determine the potential impact factors rather than the computation of a single summary measure was an important goal of our meta-analysis.[56] First, the influences of the threshold effect and publication bias on the heterogeneity of the systematic reviews were assessed, but no evidence of influence was found. Second, meta-regressions were performed, which demonstrated that none of the study designs, sample sizes, or quality scores directly influenced the calculation of the ADC value for differentiation between malignant and benign hepatic lesions. Furthermore, HBV infection was the most common cause of liver cancer among Asians, except in Japan, where HCV positivity was detected in 80% of patients (1–3).[57–59] The regression analysis showed no significant differences between HBV-endemic (Korea and China) and HCV-endemic countries (Japan), indicating that etiology was not sufficient to influence the diagnostic accuracy of the ADC in Asians. DW-MRI examinations performed with a 3.0-T device seemed to result in nudging sensitivity and sensitivity upward. After we excluded 2 articles that utilized DW-MRI examinations with a 3.0-T device, the pooled Sen of 0.880 (95% CI 0.687, 0.961) and Spe of 0.914 (95% CI 0.816, 0.962) showed little difference from the primary results. These results revealed that there are other factors causing variations in accuracy estimates across individual studies.
The type of benign lesion can directly affect the diagnostic accuracy of ADC values. “Benign” lesions in 4 papers included predominantly cysts and hemangiomas and very few focal nodular hyperplasias (FNHs) or adenomas. In the other 3 articles, benign lesions consisted of only solid liver nodules (focal nodular hyperplasia or adenoma). As revealed previously, the ADC values of cysts and hemangiomas were significantly higher due to their higher fluid content, resulting in more freedom of water molecules. In contrast, malignant lesions showed the lowest ADC values, likely because of their increased cellular density and the resultant restricted diffusion of water molecules.[60,61] Therefore, ADC values were extremely reliable for distinguishing cysts and hemangiomas from malignant lesions, which were mainly solid lesions. However, ADC values were not effective in distinguishing between benign and malignant solid lesions. Considerable overlap of solid benign lesions and solid malignant lesions was observed. This resemblance was likely attributable to a similar restriction of water motion and a hypercellular nature. This overlap of solid benign lesions and malignant lesions limited the value of DWI in differentiating solid liver masses. The above results showed that ADC values were more helpful in differentiating malignant lesions from cysts and hemangiomas. Given that ADC values exhibited an excellent diagnostic performance for cystic lesions of the liver, we suggest that an analysis of ADC values should be routinely applied when it is difficult to make a definite diagnosis for complicated hepatic cystic lesions.
Diffusion gradient factor b (number, range, first b value, maximum b value) was 1 of the most important parameters affecting the results of the ADC calculation. To date, there has been a lack of consensus regarding optimal b values for diagnosing liver diseases. The various b values in the included studies made the ranges and thresholds of the ADC values difficult to interpret; therefore, we explored whether b values were the source of heterogeneity. Six sets of data distinguished malignancies from benign liver lesions with a dual b value, whereas the other sets used multi b values. In some studies,[62] ADC values resulting from at least 3 b values were associated with optimal imaging. Woo et al[63] reported that 8 b values would be better than 3 or 4 b values and that intravoxel incoherent motion imaging-derived parameters would provide more accurate and comprehensive information. However, Taouli et al[64] found equivalent results for the characterization of focal hepatic lesions by using dual b values and 4 b values. Similar to Taouli et al, our results revealed that the number of b values used for the ADC calculation was not sufficient to cause significant heterogeneity. No statistically significant difference was found between the diagnostic accuracy of dual b values and multi b values. Because multi b values cannot provide extra information, but instead require long measurement times,[65] we suggest that the use of dual b values is sufficient for the characterization of FLLs.
In our study, we performed thorough literature searches and careful data extraction to assess the diagnostic accuracy of the ADC among Asian patients. The results based on a meta-analysis showed that the ADC values had excellent performance in assessing the malignancy of FLLs. Therefore, we reviewed all the relevant articles and extracted the ADC values of the main types of liver lesions to attempt to identify relative standardized criteria. Unfortunately, the heterogeneities of the data were too significant to achieve unified data with high clinical significance in Asia. For example, the maximum cut-off values (1.6 × 10⁻³ mm2/s) were almost double the minimum values (0.81 × 10⁻³ mm2/s), which confused doctors regarding their clinical application. This notable difference may be attributed to the different tumor sizes, pathological types, and range of b values described in various studies. Although existing data made it impossible to provide definite cut-off values, the results showed that ADC values play an excellent role in the differential diagnosis of hepatic lesions. Thus, ADC values are anticipated to be a promising diagnostic criterion for distinguishing malignant and benign FLLs, and should be routinely used in clinical practice. Similar meta-analyses are required to investigate the best cut-off values that are applicable for Asian patients when more relevant studies have been published.
5. Conclusions
In conclusion, ADC values showed a high diagnostic performance in distinguishing malignant from benign liver lesions. Ethnic and regional differences do exist in the clinical management of liver cancer, and ADC values may be particularly applicable for the Asian population. ADC values showed a better diagnostic performance for cystic lesions than solid lesions, and could be used as a promising method for definitively diagnosing hepatic cystic lesions. Meanwhile, dual b values could be sufficient for the characterization of FLLs, whereas multi b values may be unnecessary. Because it is a high-risk area for liver cancer, Asia urgently requires an accurate, efficient, and early diagnostic method to improve prognosis and reduce cancer-related mortality. Therefore, as a promising candidate, ADC data-sharing between different Asian countries and large-sample, multicenter clinical trials are required to establish specific standards for DWI analysis protocols and cut-off values for diagnosis.
Acknowledgments
We would like to acknowledge the helpful comments on this paper received from our reviewers. Additionally, we would like to thank all our colleagues in the Department of Radiology, The Second Hospital of Tianjin Medical University.
Footnotes
Abbreviations: ADC = apparent diffusion coefficient, AFB1= aflatoxin B1, CI = confidence interval, CT = computed tomography, DOR = diagnostic odds ratio, DWI = diffusion-weighted imaging, FLLs = focal liver lesions, HBV= hepatitis B virus, HCC = hepatocellular carcinoma, HCV = hepatitis C virus, IARC = International Cancer Research Center, IVIM = intravoxel incoherent motion imaging, LR = likelihood ratio, MRI = magnetic resonance imaging, QUADAS = Quality Assessment of Diagnostic Studies, Sen = sensitivity, Spe = specificity, SROC = summary receiver-operating characteristic, WHO = World Health Organization.
JP, J-JL, and JL are co-first authors.
Funding: This work was supported by the Tianjin Natural Science Foundation (No: 13JCYBJC23800). This work was also supported by the China Scholarship Council (CSC) to Yang Zhao.
The authors have no conflicts of interest to disclose.
References
- [1].Jemal A, Bray F, Center MM, et al. Global cancer statistics. CA Cancer J Clin 2011;61:69–90. [DOI] [PubMed] [Google Scholar]
- [2].The World Cancer Report: the major findings. Cent Eur J Public Health 2003;11:177–9. [PubMed] [Google Scholar]
- [3].Fong ZV, Tanabe KK. The clinical management of hepatocellular carcinoma in the United States, Europe, and Asia: a comprehensive and evidence-based comparison and review. Cancer Am Cancer Soc 2014;120:2824–38. [DOI] [PubMed] [Google Scholar]
- [4].McGlynn KA, Tsao L, Hsing AW, et al. International trends and patterns of primary liver cancer. Int J Cancer 2001;94:290–6. [DOI] [PubMed] [Google Scholar]
- [5].Ananthakrishnan A, Gogineni V, Saeian K. Epidemiology of primary and secondary liver cancers. Semin Intervent Radiol 2006;23:47–63. [DOI] [PMC free article] [PubMed] [Google Scholar]
- [6].Yang JD, Roberts LR. Hepatocellular carcinoma: a global view. Nat Rev Gastroenterol Hepatol 2010;7:448–58. [DOI] [PMC free article] [PubMed] [Google Scholar]
- [7].Parkin DM. The global health burden of infection-associated cancers in the year 2002. Int J Cancer 2006;118:3030–44. [DOI] [PubMed] [Google Scholar]
- [8].Lim SG, Mohammed R, Yuen MF, et al. Prevention of hepatocellular carcinoma in hepatitis B virus infection. J Gastroenterol Hepatol 2009;24:1352–7. [DOI] [PubMed] [Google Scholar]
- [9].Ueno Y, Sollano JD, Farrell GC. Prevention of hepatocellular carcinoma complicating chronic hepatitis C. J Gastroenterol Hepatol 2009;24:531–6. [DOI] [PubMed] [Google Scholar]
- [10].Omer RE, Kuijsten A, Kadaru AM, et al. Population-attributable risk of dietary aflatoxins and hepatitis B virus infection with respect to hepatocellular carcinoma. Nutr Cancer 2004;48:15–21. [DOI] [PubMed] [Google Scholar]
- [11].El-Serag HB. Epidemiology of hepatocellular carcinoma in USA. Hepatol Res 2007;37suppl 2:S88–94. [DOI] [PubMed] [Google Scholar]
- [12].Scalera A, Tarantino G. Could metabolic syndrome lead to hepatocarcinoma via non-alcoholic fatty liver disease? World J Gastroenterol 2014;20:9217–28. [DOI] [PMC free article] [PubMed] [Google Scholar]
- [13].Piscaglia F, Svegliati-Baroni G, Barchetti A, et al. Clinical patterns of hepatocellular carcinoma in nonalcoholic fatty liver disease: a multicenter prospective study. Hepatology 2016;63:827–38. [DOI] [PubMed] [Google Scholar]
- [14].Poon D, Anderson BO, Chen LT, et al. Management of hepatocellular carcinoma in Asia: consensus statement from the Asian Oncology Summit 2009. Lancet Oncol 2009;10:1111–8. [DOI] [PubMed] [Google Scholar]
- [15].Cheng AL, Kang YK, Chen Z, et al. Efficacy and safety of sorafenib in patients in the Asia-Pacific region with advanced hepatocellular carcinoma: a phase III randomised, double-blind, placebo-controlled trial. Lancet Oncol 2009;10:25–34. [DOI] [PubMed] [Google Scholar]
- [16].Llovet JM, Ricci S, Mazzaferro V, et al. Sorafenib in advanced hepatocellular carcinoma. N Engl J Med 2008;359:378–90. [DOI] [PubMed] [Google Scholar]
- [17].Figueras J, Jaurrieta E, Valls C, et al. Resection or transplantation for hepatocellular carcinoma in cirrhotic patients: outcomes based on indicated treatment strategy. J Am Coll Surg 2000;190:580–7. [DOI] [PubMed] [Google Scholar]
- [18].Njei B, Rotman Y, Ditah I, et al. Emerging trends in hepatocellular carcinoma incidence and mortality. Hepatology 2015;61:191–9. [DOI] [PMC free article] [PubMed] [Google Scholar]
- [19].Altekruse SF, McGlynn KA, Dickie LA, et al. Hepatocellular carcinoma confirmation, treatment, and survival in surveillance, epidemiology, and end results registries, 1992–2008. Hepatology 2012;55:476–82. [DOI] [PMC free article] [PubMed] [Google Scholar]
- [20].Braren R, Altomonte J, Settles M, et al. Validation of preclinical multiparametric imaging for prediction of necrosis in hepatocellular carcinoma after embolization. J Hepatol 2011;55:1034–40. [DOI] [PubMed] [Google Scholar]
- [21].Taouli B, Ehman RL, Reeder SB. Advanced MRI methods for assessment of chronic liver disease. AJR Am J Roentgenol 2009;193:14–27. [DOI] [PMC free article] [PubMed] [Google Scholar]
- [22].Gluskin JS, Chegai F, Monti S, et al. Hepatocellular carcinoma and diffusion-weighted MRI: detection and evaluation of treatment response. J Cancer 2016;7:1565–70. [DOI] [PMC free article] [PubMed] [Google Scholar]
- [23].Mannelli L, Nougaret S, Vargas HA, et al. Advances in diffusion-weighted imaging. Radiol Clin North Am 2015;53:569–81. [DOI] [PMC free article] [PubMed] [Google Scholar]
- [24].Souillard-Scemama R, Tisserand M, Calvet D, et al. An update on brain imaging in transient ischemic attack. J Neuroradiol 2015;42:3–11. [DOI] [PubMed] [Google Scholar]
- [25].Svolos P, Kousi E, Kapsalaki E, et al. The role of diffusion and perfusion weighted imaging in the differential diagnosis of cerebral tumors: a review and future perspectives. Cancer Imaging 2014;14:20. [DOI] [PMC free article] [PubMed] [Google Scholar]
- [26].Rovira A, Leon A. MR in the diagnosis and monitoring of multiple sclerosis: an overview. Eur J Radiol 2008;67:409–14. [DOI] [PubMed] [Google Scholar]
- [27].Asbach P, Klatt D, Schlosser B, et al. Viscoelasticity-based staging of hepatic fibrosis with multifrequency MR elastography. Radiology 2010;257:80–6. [DOI] [PubMed] [Google Scholar]
- [28].Do RK, Chandarana H, Felker E, et al. Diagnosis of liver fibrosis and cirrhosis with diffusion-weighted imaging: value of normalized apparent diffusion coefficient using the spleen as reference organ. AJR Am J Roentgenol 2010;195:671–6. [DOI] [PubMed] [Google Scholar]
- [29].Fujimoto K, Tonan T, Azuma S, et al. Evaluation of the mean and entropy of apparent diffusion coefficient values in chronic hepatitis C: correlation with pathologic fibrosis stage and inflammatory activity grade. Radiology 2011;258:739–48. [DOI] [PubMed] [Google Scholar]
- [30].Wang Y, Ganger DR, Levitsky J, et al. Assessment of chronic hepatitis and fibrosis: comparison of MR elastography and diffusion-weighted imaging. AJR Am J Roentgenol 2011;196:553–61. [DOI] [PMC free article] [PubMed] [Google Scholar]
- [31].Low RN, Gurney J. Diffusion-weighted MRI (DWI) in the oncology patient: value of breathhold DWI compared to unenhanced and gadolinium-enhanced MRI. J Magn Reson Imaging 2007;25:848–58. [DOI] [PubMed] [Google Scholar]
- [32].Yang DM, Jahng GH, Kim HC, et al. The detection and discrimination of malignant and benign focal hepatic lesions: T2 weighted vs diffusion-weighted MRI. Br J Radiol 1000;84:319–26. [DOI] [PMC free article] [PubMed] [Google Scholar]
- [33].Baltzer PA, Schelhorn J, Benndorf M, et al. Diagnosis of focal liver lesions suspected of metastases by diffusion-weighted imaging (DWI): systematic comparison favors free-breathing technique. Clin Imaging 2013;37:97–103. [DOI] [PubMed] [Google Scholar]
- [34].Li H, Xiao E, Xiao L, et al. High field magnetic resonance background suppression diffusion imaging in the diagnosis of liver foci of space occupying lesion. Zhong Nan Da Xue Xue Bao Yi Xue Ban 2013;38:237–44. [DOI] [PubMed] [Google Scholar]
- [35].Ichikawa T, Haradome H, Hachiya J, et al. Diffusion-weighted MR imaging with a single-shot echoplanar sequence: detection and characterization of focal hepatic lesions. AJR Am J Roentgenol 1998;170:397–402. [DOI] [PubMed] [Google Scholar]
- [36].Motosugi U, Ichikawa T, Sou H, et al. Distinguishing hypervascular pseudolesions of the liver from hypervascular hepatocellular carcinomas with gadoxetic acid-enhanced MR imaging. Radiology 2010;256:151–8. [DOI] [PubMed] [Google Scholar]
- [37].Muhi A, Ichikawa T, Motosugi U, et al. High-b-value diffusion-weighted MR imaging of hepatocellular lesions: estimation of grade of malignancy of hepatocellular carcinoma. J Magn Reson Imaging 2009;30:1005–11. [DOI] [PubMed] [Google Scholar]
- [38].Watanabe H, Kanematsu M, Goshima S, et al. Characterizing focal hepatic lesions by free-breathing intravoxel incoherent motion MRI at 3.0 T. Acta Radiol 2014;55:1166–73. [DOI] [PubMed] [Google Scholar]
- [39].Xu PJ, Yan FH, Wang JH, et al. Contribution of diffusion-weighted magnetic resonance imaging in the characterization of hepatocellular carcinomas and dysplastic nodules in cirrhotic liver. J Comput Assist Tomogr 2010;34:506–12. [DOI] [PubMed] [Google Scholar]
- [40].Yoon JH, Lee JM, Yu MH, et al. Evaluation of hepatic focal lesions using diffusion-weighted MR imaging: comparison of apparent diffusion coefficient and intravoxel incoherent motion-derived parameters. J Magn Reson Imaging 2014;39:276–85. [DOI] [PubMed] [Google Scholar]
- [41].Kim T, Murakami T, Takahashi S, et al. Diffusion-weighted single-shot echoplanar MR imaging for liver disease. AJR Am J Roentgenol 1999;173:393–8. [DOI] [PubMed] [Google Scholar]
- [42].Li Y, Chen Z, Wang J. Differential diagnosis between malignant and benign hepatic tumors using apparent diffusion coefficient on 1.5-T MR imaging: a meta-analysis. Eur J Radiol 2012;81:484–90. [DOI] [PubMed] [Google Scholar]
- [43].Whiting PF, Weswood ME, Rutjes AW, et al. Evaluation of QUADAS: a tool for the quality assessment of diagnostic accuracy studies. BMC Med Res Methodol 2006;6:9. [DOI] [PMC free article] [PubMed] [Google Scholar]
- [44].Koh DM, Collins DJ. Diffusion-weighted MRI in the body: applications and challenges in oncology. AJR Am J Roentgenol 2007;188:1622–35. [DOI] [PubMed] [Google Scholar]
- [45].Sugahara T, Korogi Y, Kochi M, et al. Usefulness of diffusion-weighted MRI with echo-planar technique in the evaluation of cellularity in gliomas. J Magn Reson Imaging 1999;9:53–60. [DOI] [PubMed] [Google Scholar]
- [46].Nasu K, Kuroki Y, Nawano S, et al. Hepatic metastases: diffusion-weighted sensitivity-encoding versus SPIO-enhanced MR imaging. Radiology 2006;239:122–30. [DOI] [PubMed] [Google Scholar]
- [47].Srivatanakul P, Sriplung H, Deerasamee S. Epidemiology of liver cancer: an overview. Asian Pac J Cancer Prev 2004;5:118–25. [PubMed] [Google Scholar]
- [48].Perz JF, Armstrong GL, Farrington LA, et al. The contributions of hepatitis B virus and hepatitis C virus infections to cirrhosis and primary liver cancer worldwide. J Hepatol 2006;45:529–38. [DOI] [PubMed] [Google Scholar]
- [49].Song TJ, Fong Y, Cho SJ, et al. Comparison of hepatocellular carcinoma in American and Asian patients by tissue array analysis. J Surg Oncol 2012;106:84–8. [DOI] [PMC free article] [PubMed] [Google Scholar]
- [50].Benson AR, Abrams TA, Ben-Josef E, et al. NCCN clinical practice guidelines in oncology: hepatobiliary cancers. J Natl Compr Canc Netw 2009;7:350–91. [DOI] [PMC free article] [PubMed] [Google Scholar]
- [51].Cieszanowski A, Anysz-Grodzicka A, Szeszkowski W, et al. Characterization of focal liver lesions using quantitative techniques: comparison of apparent diffusion coefficient values and T2 relaxation times. Eur Radiol 2012;22:2514–24. [DOI] [PMC free article] [PubMed] [Google Scholar]
- [52].Filipe JP, Curvo-Semedo L, Casalta-Lopes J, et al. Diffusion-weighted imaging of the liver: usefulness of ADC values in the differential diagnosis of focal lesions and effect of ROI methods on ADC measurements. MAGMA 2013;26:303–12. [DOI] [PubMed] [Google Scholar]
- [53].Girometti R, Del PM, Pullini S, et al. Accuracy of visual analysis vs. apparent diffusion coefficient quantification in differentiating solid benign and malignant focal liver lesions with diffusion-weighted imaging. Radiol Med 2013;118:343–55. [DOI] [PubMed] [Google Scholar]
- [54].Onur MR, Cicekci M, Kayali A, et al. The role of ADC measurement in differential diagnosis of focal hepatic lesions. Eur J Radiol 2012;81:e171–6. [DOI] [PubMed] [Google Scholar]
- [55].Soyer P, Corno L, Boudiaf M, et al. Differentiation between cavernous hemangiomas and untreated malignant neoplasms of the liver with free-breathing diffusion-weighted MR imaging: comparison with T2-weighted fast spin-echo MR imaging. Eur J Radiol 2011;80:316–24. [DOI] [PubMed] [Google Scholar]
- [56].Petitti DB. Approaches to heterogeneity in meta-analysis. Stat Med 2001;20:3625–33. [DOI] [PubMed] [Google Scholar]
- [57].Fasani P, Sangiovanni A, De Fazio C, et al. High prevalence of multinodular hepatocellular carcinoma in patients with cirrhosis attributable to multiple risk factors. Hepatology 1999;29:1704–7. [DOI] [PubMed] [Google Scholar]
- [58].Stroffolini T, Andreone P, Andriulli A, et al. Gross pathologic types of hepatocellular carcinoma in Italy. Oncol Basel 1999;56:189–92. [DOI] [PubMed] [Google Scholar]
- [59].Yoshizawa H. Hepatocellular carcinoma associated with hepatitis C virus infection in Japan: projection to other countries in the foreseeable future. Oncol Basel 2002;62suppl 1:8–17. [DOI] [PubMed] [Google Scholar]
- [60].Abdel RA, Kandeel AY, Soliman N, et al. Role of diffusion-weighted echo-planar MR imaging in differentiation of residual or recurrent head and neck tumors and posttreatment changes. AJNR Am J Neuroradiol 2007;28:1146–52. [DOI] [PMC free article] [PubMed] [Google Scholar]
- [61].Charles-Edwards EM, DeSouza NM. Diffusion-weighted magnetic resonance imaging and its application to cancer. Cancer Imaging 2006;6:135–43. [DOI] [PMC free article] [PubMed] [Google Scholar]
- [62].Chandarana H, Taouli B. Diffusion and perfusion imaging of the liver. Eur J Radiol 2010;76:348–58. [DOI] [PubMed] [Google Scholar]
- [63].Woo S, Lee JM, Yoon JH, et al. Intravoxel incoherent motion diffusion-weighted MR imaging of hepatocellular carcinoma: correlation with enhancement degree and histologic grade. Radiology 2014;270:758–67. [DOI] [PubMed] [Google Scholar]
- [64].Taouli B, Vilgrain V, Dumont E, et al. Evaluation of liver diffusion isotropy and characterization of focal hepatic lesions with two single-shot echo-planar MR imaging sequences: prospective study in 66 patients. Radiology 2003;226:71–8. [DOI] [PubMed] [Google Scholar]
- [65].Koh DM, Collins DJ, Orton MR. Intravoxel incoherent motion in body diffusion-weighted MRI: reality and challenges. AJR Am J Roentgenol 2011;196:1351–61. [DOI] [PubMed] [Google Scholar]


