

Supplemental Digital Content is available in the text
Keywords: Barrett surveillance, biomarker, cancer risk
Abstract
The value of endoscopic Barrett esophagus (BE) surveillance based on histological diagnosis of low-grade dysplasia (LGD) remains debated given the lack of adequate risk stratification. The aim of this study was to evaluate the predictive value of cyclin A expression and to combine these results with our previously reported immunohistochemical p53, AMACR, and SOX2 data, to identify a panel of biomarkers predicting neoplastic progression in BE.
We conducted a case–control study within a prospective cohort of 720 BE patients. BE patients who progressed to high-grade dysplasia (HGD, n = 37) or esophageal adenocarcinoma (EAC, n = 13), defined as neoplastic progression, were classified as cases and patients without neoplastic progression were classified as controls (n = 575). Cyclin A expression was determined by immunohistochemistry in all 625 patients; these results were combined with the histological diagnosis and our previous p53, AMACR, and SOX2 data in loglinear regression models. Differences in discriminatory ability were quantified as changes in area under the ROC curve (AUC) for predicting neoplastic progression.
Cyclin A surface positivity significantly increased throughout the metaplasia–dysplasia–carcinoma sequences and was seen in 10% (107/1050) of biopsy series without dysplasia, 33% (109/335) in LGD, and 69% (34/50) in HGD/EAC. Positive cyclin A expression was associated with an increased risk of neoplastic progression (adjusted relative risk (RRa) 2.4; 95% CI: 1.7–3.4). Increases in AUC were substantial for P53 (+0.05), smaller for SOX2 (+0.014), minor for cyclin A (+0.003), and none for AMARC (0.00).
Cyclin A immunopositivity was associated with an increased progression risk in BE patients. However, compared to p53 and SOX2, the incremental value of cyclin A was limited. The use of biomarkers has the potential to significantly improve risk stratification in BE.
1. Introduction
Barrett esophagus (BE) is a premalignant condition of the distal esophagus in which the normal squamous epithelium is replaced by columnar epithelium containing goblet cells, as a result of chronic acid exposure.[1–3] Patients with BE have an increased risk to develop esophageal adenocarcinoma (EAC) with an estimated incidence of 0.2% to 0.5% per year.[4–7] The transition from BE to EAC is a gradual process, in which intestinal metaplasia evolves via low-grade dysplasia (LGD), to high-grade dysplasia (HGD) and finally to EAC, a cancer with an overall 5-year survival of less than 20%.[8,9] Current guidelines recommend endoscopic surveillance of BE patients to detect HGD or EAC at an early and potentially curable stage when endoscopic treatment is still feasible.[10,11] However, the applied endoscopic surveillance strategy to date based on histological diagnosis alone remains debated given the overall low incidence of neoplastic progression, and the lack of discriminative power to stratify BE patients at high risk for neoplastic progression from those at low risk.
Histological diagnosis of LGD is nowadays used for the risk assessment of neoplastic progression in BE surveillance and more intensive follow-up is recommended in LGD patients (yearly instead of every 3 years).[10–12] However, diagnosis of LGD has a low predictive value, owing to sample error and a considerable inter- and intraobserver variation.[13–15] The use of (a panel of) biomarkers in addition to histology may improve risk stratification in BE patients, and several immunohistochemical biomarkers are under investigation. Our group previously reported on the predictive value for neoplastic progression of p53, AMACR, and SOX2 in a large prospective cohort of patients with BE.[16–18]
Another potential biomarker is cyclin A, a protein that plays an important role in the G1-S transition of the cell cycle. Overexpression of cell-cycle related proteins, including cyclin A, has been linked to the metaplasia–dysplasia–carcinoma sequence in BE and associated with an increased risk of neoplastic progression.[19–21] However, clinical validation of cyclin A in a large prospective cohort of BE patients is still missing. In addition, there is a lack of studies testing performance of multiple biomarker simultaneously in the same cohort of BE patients.
The aim of the present study was to assess the value of cyclin A immunohistochemistry to predict neoplastic progression in a large cohort of BE patients and to combine the results obtained with our previously reported p53, AMACR, and SOX2 immunohistochemical data in the same prospective cohort, to identify a panel of biomarkers predictive for neoplastic progression in patients with BE.
2. Methods
2.1. Study design
We conducted a case–control study nested within a large multicenter prospective cohort of 720 BE patients. All patients were included between November 2003 and December 2004 from 3 university medical centers and 12 regional hospitals throughout the Netherlands and received endoscopic surveillance according to the guidelines of the American College of Gastroenterology (ACG) (Appendix 1).[11] Inclusion criterion was known or newly diagnosed BE of at least 2 cm according to the Prague C&M criteria, histologically confirmed by the presence of intestinal metaplasia on initial biopsies.[22] Patients with a history of HGD or esophageal malignancy were excluded. All endoscopic procedures were performed according to a standardized protocol, by an experienced gastroenterologist with at least several years of experience in endoscopic procedures and with interest for BE. Before taking biopsies, endoscopic landmarks such as the diaphragm impression, gastroesophageal junction, and squamocolumnar junction were reported. The presence of esophagitis was graded according to the Los Angeles Classification, and abnormalities were noted, including nodules, ulcers, and erosions.[23] At each endoscopic procedure targeted biopsies were taken from mucosal abnormalities and quadrant biopsies were taken every 2 cm from the most distal to the most proximal part of the Barrett segment, according to the Seattle protocol.[24] Patients without dysplasia in the biopsy samples, based on histological consensus diagnosis, underwent endoscopy surveillance with biopsy sampling every 3 years and patients with LGD every year.
2.2. Histology
According to standard procedure, all biopsy samples were fixated with buffered formalin and embedded in paraffin. From each biopsy set, 4-μm thick sections were cut and stained with hematoxylin–eosin to assess the presence of BE and grade of dysplasia. After assessment of all the biopsies, the highest degree of abnormality was reported for each endoscopy. Slides were graded first by a local pathologist and secondly by an expert academic pathologist. In case of disagreement on the grade of dysplasia between the local pathologist and expert academic pathologist, the slides were reviewed by a second expert academic pathologist. Pathologists were blinded for each other's diagnosis and a final diagnosis was made if at least 2 pathologists agreed on the grade of dysplasia. When there was still disagreement, a panel of expert pathologists reviewed the slides and a final diagnosis was made based on consensus agreement. Given the equal surveillance strategy according to the ACG guidelines, the biopsies (n = 7) with the final diagnosis of indefinite for dysplasia were included in the group of biopsies with the diagnosis of LGD.
2.3. Patient selection
We collected formalin-fixed paraffin-embedded (FFPE) material suitable for immunohistochemistry from all 720 BE patients in our cohort. However, no material or not enough material was available in 95 patients, leaving 625 patients to be included in this analysis. Patients with progression to HGD or EAC during follow-up were classified as cases and patients without neoplastic progression were classified as controls. In accordance with our previous analyses, the minimal time interval between the index endoscopy and diagnosis of HGD or EAC was 9 months to prevent inclusion of prevalent cases. Immunohistochemistry was performed on the complete series of FFPE material of all surveillance endoscopies of patients who developed any form of dysplasia, that is, LGD, HGD, or EAC during follow-up. This included the total number of biopsies taken during surveillance at different levels of the Barrett segment. In patients without any form of dysplasia during follow-up, immunohistochemistry was performed on biopsies of a random surveillance endoscopy.
2.4. Immunohistochemistry
For cyclin A immunohistochemistry, FFPE tissue sections were deparaffinized in xylene and rehydrated in graded alcohols. Antigen retrieval was done by heating in Tris buffer and endogenous peroxidase activity was blocked by incubating the slides in a solution of 0.3% hydrogen peroxide in phosphate-buffered saline. Primary antibody (Leica, Novocastra, Newcastle upon Tyne, United Kingdom: monoclonal, mouse) with a dilution of 1:200 was incubated overnight at 4°C. Rabbit antimouse (1:150; E0413, Dako, Heverlee, Belgium) was used as secondary antibody. Visualization was achieved by using the horseradish peroxidase avidin–biotin complex (HRP-ABC) method and diaminobenzidine (DAB) substrate. Finally, slides were counterstained with hematoxylin. A negative control was obtained by omission of the primary antibody. Positive nuclei in the proliferation zone of the BE epithelium were used as internal positive control. Immunohistochemical staining for p53, AMACR, and SOX2 was performed as previously described.[16–18]
2.5. Scoring of immunohistochemistry
Immunohistochemically stained slides were examined in tandem with the hematoxylin–eosin stained slides to determine cyclin A, and previously p53, AMACR, and SOX2 expression in areas with dysplasia.[16–18] Nuclear cyclin A expression was scored on a 2-point scale; negative or positive expression. The surface cells were counted up to a maximum of 600 cells to determine the percentage of cyclin A positive cells. Only surface cells with strong nuclear staining were considered as positive. The epithelial surface was defined as the columnar cells at the luminal side of the biopsy, as described previously.[25] Based on published data, a cut-off value of 1% or more was used for cyclin A positivity.[21] Cyclin A expression was scored in BE epithelium with the highest percentage of positive cyclin A cells and in biopsy series with dysplasia, cyclin A expression was scored in the dysplastic area. After scoring all biopsies, the highest degree of abnormality was reported for each surveillance endoscopy. All stained slides were scored by 2 independent expert investigators who were blinded for long-term outcome as well as each other's results. When there was disagreement between the 2 investigators, slides were reviewed by an experienced academic pathologist (KB or MD) and final diagnosis was made if 2 investigators agreed on the extend of cyclin A expression.
P53, AMACR, and SOX2 expression was scored as previously described.[16–18] Briefly, nuclear p53 and cytoplasmatic AMACR expression were scored on a 3-point scale (p53; normal expression, overexpression, or loss of expression and for AMACR; no expression, mild expression, or strong expression). Only intense nuclear staining for p53 was scored as overexpression and aberrant p53 expression was defined as either overexpression or complete loss of expression in at least 1 gland. Nuclear SOX2 expression was scored on a 2-point scale; positive or loss of expression. Positive expression included strong as well as weak nuclear SOX2 positivity and was interpreted as normal expression. Loss of SOX2 expression in a cluster of glands, excluding BE glands containing many goblet cells was defined as aberrant SOX2 expression.
2.6. Ethics
The study protocol was approved by the institutional review board of the Erasmus University Medical Center, including those of all participating hospitals. Before the first endoscopy, written informed consent was obtained from all 720 BE patients.
2.7. Statistical analysis
Patient characteristics of cases and controls were compared using Mann–Whitney U test for continuous variables and χ2 test for categorical variables. To compare cyclin A expression in biopsy series of cases and controls with different grade of dysplasia, the Mann–Whitney U test and Kruskal–Wallis test were used, thereby ignoring that multiple biopsy series could be from the same patient. Neoplastic progression was defined as the development of HGD or EAC at least 9 months after inclusion in the study, and follow-up time was defined as the time between 2 consecutive surveillance endoscopies. The value of cyclin A immunohistochemistry to predict neoplastic progression was estimated in loglinear regression models. Previous stained slides for p53, AMACR, and SOX2 expression in the same cohort of BE patients were reevaluated in this study to explore the classification performance of different combinations of biomarkers for predicting neoplastic progression in BE. Because immunohistochemical staining was not performed on all biopsy series, data were split up by endoscopy (1243 in 575 controls, 142 in 50 cases). Loglinear models were used to calculate relative risks (RRs) and 95% confidence intervals (CIs) with the logarithm of follow-up time (time between 2 consecutive endoscopies) as offset variable. In multivariable analysis we adjusted for gender, age, BE length, and esophagitis to estimate adjusted RRs and 95% CIs. For each of the biomarkers the sensitivity, specificity, positive predictive value (PPV), and negative predictive value (NPV) was calculated. The areas under the receiver operating characteristic (ROC) curves for neoplastic progression were calculated for the individual markers as well as for the comparison between a selection of models, in which the studied biomarkers were included or excluded. These included pathological diagnosis of grade of dysplasia alone, pathological diagnosis in combination with p53 and SOX2 immunohistochemistry and pathological diagnosis in combination with p53, SOX2, and cyclin A immunohistochemistry. The incremental value of each biomarker was calculated by the change in area under the curve (AUC) after exclusion of the concerning biomarker in the “fully adjusted model” (model including histological diagnosis, cyclin A, p53, AMACR, and SOX2 immunohistochemistry) as described earlier.[26] Interobserver agreement for cyclin A expression was determined by Cohen kappa statistics. Kappa value of below 0.21 were considered “poor,” 0.21 to 0.40 “fair,” 0.41 to 0.60 “moderate,” 0.61 to 0.8 “substantial,” and above 0.81 “very good.”[27] Two-sided P values of <0.05 were considered statistically significant. Data were analyzed using SPSS statistical software (V.21.0; IBM SPSS, Chicago, IL).
3. Results
3.1. Patient characteristics
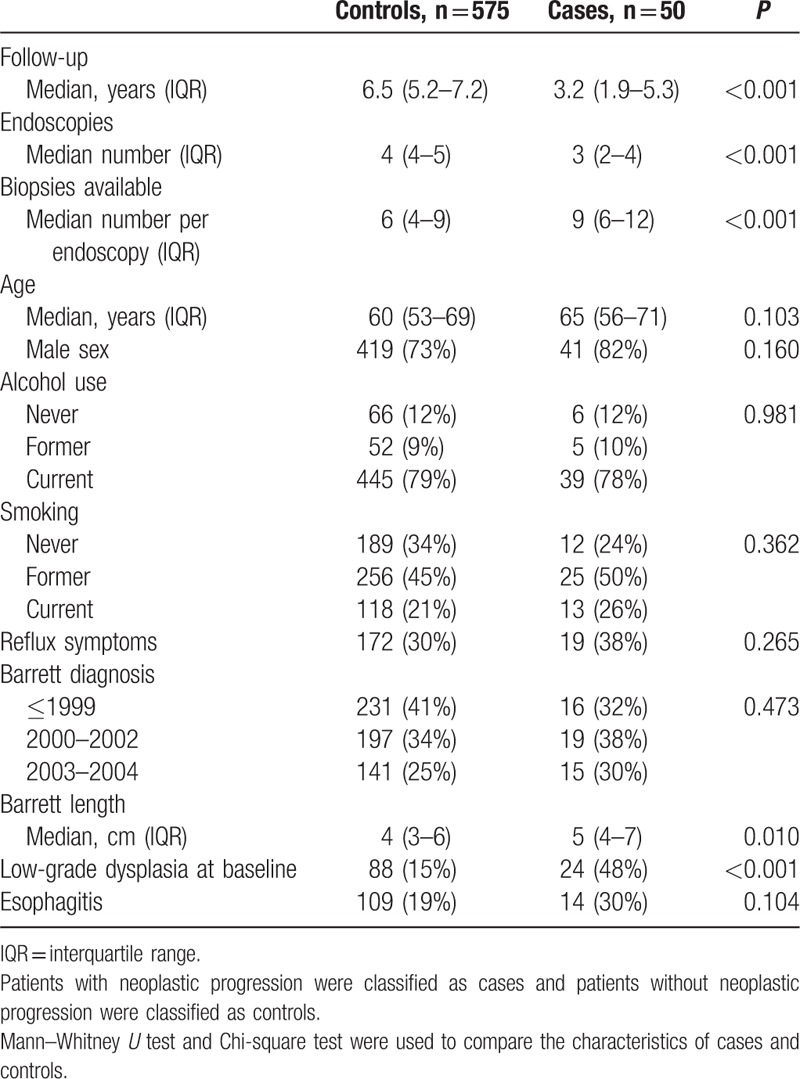
Six hundred twenty-five patients with BE were included in this study (74% men, median age of 60 years (interquartile range (IQR) 53–69)) and followed for a median duration of 6.7 years (IQR 5.0–7.4). Thirty-seven (6%) patients developed HGD and 13 (2%) patients developed EAC during surveillance after a median follow-up of 3.2 years (IQR 1.9–5.3). These 50 (8%) BE patients with neoplastic progression were classified as cases and the remaining 575 (92%) patients without neoplastic progression were classified as controls. Cyclin A expression was scored separately and subsequently correlated with histological diagnosis and expression of p53, AMACR, and SOX2 in biopsy series of 1432 endoscopies: 189 endoscopies were performed in 50 cases and 1243 endoscopies in 575 controls. Biopsy series were defined as the total number of biopsies from 1 endoscopy and the highest degree of abnormality was reported for each surveillance endoscopy after evaluation of all biopsies taken at that respective endoscopy procedure. Except for a smaller number of endoscopies, a higher number of biopsies per endoscopy, longer BE length and more frequent diagnosis of LGD at baseline there were no significant differences between the cases and controls (Table 1).
Table 1.
Baseline characteristics of cases and controls.
3.2. Histology
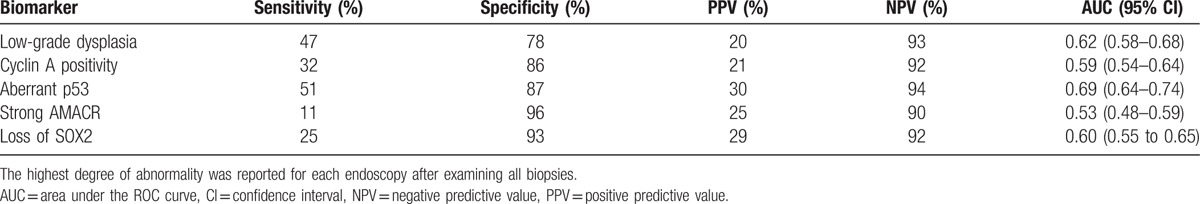
Consensus histology assessments included, 1050 (73%) biopsy series with nondysplastic BE (NDBE), 335 (23%) with LGD, 34 (3%) with HGD, and 13 (1%) with EAC. The local pathologist and expert academic pathologist disagreed on grade of dysplasia in 421 (29%) biopsy series and these samples were reviewed by a second expert pathologist (kappa-value of 0.34; 95% CI: 0.32–0.36). In 22 (19%) biopsy series there was still disagreement and a second expert pathologist or a panel of expert pathologists reviewed the slides for a final diagnosis. The presence of LGD was more frequent in biopsy series of cases (47%) than in biopsy series of controls (22%) and was associated with an increased risk of neoplastic progression after adjusting for gender, age, BE length, and esophagitis (adjusted RR of 3.9; 95% CI: 2.8–5.4), with an AUC of 0.62 (95% CI: 0.58–0.68) (Table 2 and Fig. 1). The sensitivity of histological diagnosis of LGD for predicting neoplastic progression was 47%, with a specificity of 78%. The PPV and NPV were respectively 20% and 93% (Table 3).
Table 2.
Histology and cyclin A immunohistochemistry in biopsy series of cases and controls.
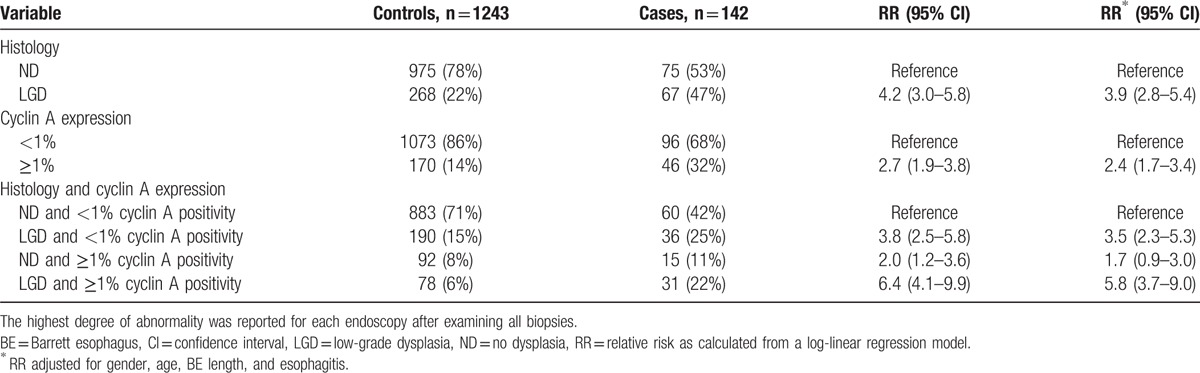
Figure 1.
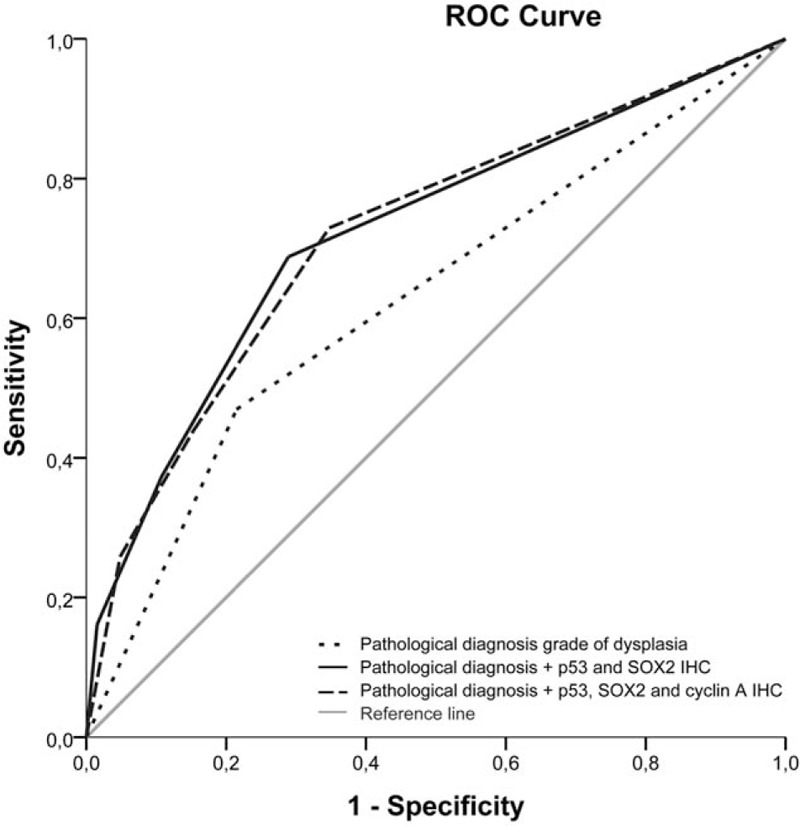
Receiver operating characteristic (ROC) comparing different biomarker models with the basic pathological diagnosis of grade of dysplasia. Area under the curve (AUC) for predicting neoplastic progression was calculated (pathological diagnosis grade of dysplasia AUC of 0.62 (95% CI: 0.58–0.68), pathological diagnosis + p53 and SOX2 immunohistochemistry AUC of 0.72 (95% CI: 0.67–0.77) and pathological diagnosis + p53, SOX2, and cyclin A immunohistochemistry AUC of 0.72 (95% CI: 0.67–0.77)).
Table 3.
Performance of each individual marker for predicting neoplastic progression.
3.3. Cyclin A immunohistochemistry
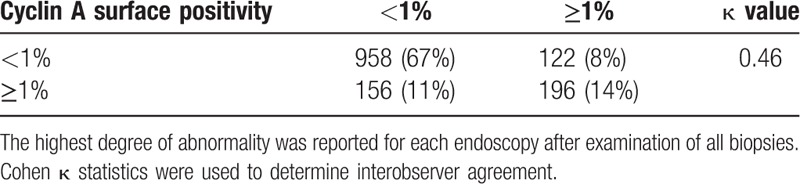
A positive cyclin A expression was seen in 250/1432 (17%) of the biopsy series. The interobserver agreement for cyclin A expression was moderate with a kappa-value of 0.46 (95% CI: 0.43–0.49). The observers disagreed on cyclin A surface expression in 278 (19%) biopsy series (Table 4). Cyclin A surface positivity was seen in 107 (10%) biopsy series without dysplasia, and was more common in dysplastic BE, including 109 (33%) biopsy series with LGD, 26 (76%) biopsy series with HGD, and 8 (62%) with EAC (P < 0.001). Positive cyclin A surface expression was more common in biopsy series of cases (32%) than in biopsy series of controls (14%), and it was associated with an increased risk of neoplastic progression with a RR of 2.7 (95% CI: 1.9–3.8). This association remained after adjusting for gender, age, BE length, and esophagitis (adjusted RR of 2.4; 95% CI: 1.7–3.4) and was particularly seen in biopsy series with LGD (adjusted RR of 5.8; 95% CI: 3.7–9.0) (Table 2). In per-biopsy analysis, cyclin A had an AUC of 0.59 (95% CI: 0.54–0.64) for predicting neoplastic progression with a sensitivity of 32%, a specificity of 86%, a PPV of 21%, and a NPV of 92% (Table 3).
Table 4.
Interobserver agreement for cyclin A expression.
3.4. P53, AMACR, and SOX2 immunohistochemistry and incremental value of cyclin A
The pattern of p53, AMACR, and SOX2 expression were previously studied and discussed elsewhere.[16–18] Aberrant p53 expression, as well as strong AMACR expression and aberrant SOX2 expression were more common in biopsy series of cases than in biopsy series of controls (p53; 51% vs 13%, AMACR; 11% vs 4%, SOX2; 25% vs 7%) and were associated with an increased risk of neoplastic progression with adjusted RR of 5.6 (95% CI: 4.0–7.8) for aberrant p53 expression, 2.8 (95% CI: 1.6–4.8) for strong AMACR expression, and 4.4 (95% CI: 3.0–6.5) for aberrant SOX2 expression, respectively (Supplementary Table 1) (Table 3). The highest risk of neoplastic progression was detected in patients with LGD and concurrent aberrant p53 expression (adjusted RR of 9.9; 95% CI: 6.6–14.9) (Supplementary Table 1). The addition of p53 immunohistochemistry improved the AUC compared to the histological diagnosis alone (from AUC 0.62 to AUC 0.70; 95% CI: 0.66–0.76).
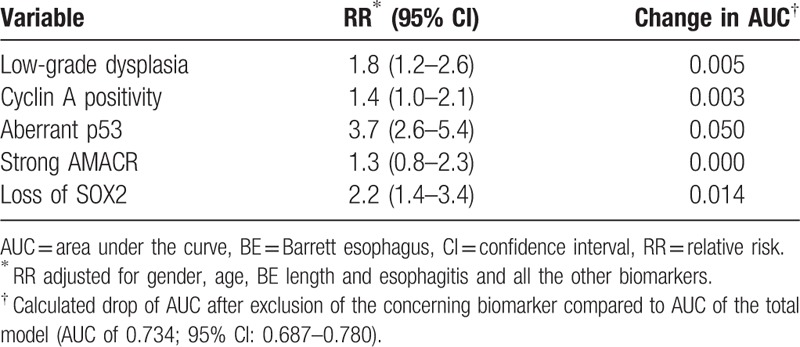
Next, we combined the information on histology, cyclin A, p53, AMACR, and SOX2 immunohistochemistry in a fully adjusted model for predicting neoplastic progression in BE (Table 5). Aberrant p53 expression showed the highest change in AUC (0.05), to a lesser extent aberrant SOX2 expression (0.014) and histological diagnosis of LGD (0.005). The biomarkers cyclin A and AMACR only showed a minimal drop or no drop in AUC after exclusion (cyclin A: 0.003 and AMACR: 0.0). Importantly, the addition of SOX2 slightly improved the AUC compared with the model including only histological diagnosis and p53 immunohistochemistry (from AUC 0.70 to AUC 0.72; 95% CI: 0.67–0.77) (Fig. 1).
Table 5.
Fully adjusted model with histology, cyclin A, p53, AMACR, and SOX2 immunohistochemistry in biopsy series of cases and controls.
4. Discussion
In this large case–control study we evaluated the value of cyclin A expression for predicting neoplastic progression in patients with BE. These results were combined with our previously reported p53, AMACR, and SOX2 immunohistochemical data within the same cohort using AUC in ROC analysis, to explore the classification performance of different combinations of biomarkers. This modeling is a valuable tool for the overall judgment of the incremental value of the biomarkers studied but not intended as an exact analytic method.[26] Cyclin A surface positivity significantly increased throughout the metaplasia–dysplasia–carcinoma progression steps and was associated with an increased risk of neoplastic progression. However, the incremental value of cyclin A expression was limited compared to histological diagnosis of LGD, p53, and SOX2.
Surveillance of BE patients is under significant debate given the lack of discriminative tools for adequate risk stratification. Additionally, with the introduction of minimally invasive endoscopic therapy and the evidence of cancer prevention by radiofrequency ablation in patients with LGD, there is an increasing need for accurate dysplasia detection during BE surveillance.[28,29] Previous studies demonstrated repeatedly the value of LGD as a risk factor for neoplastic progression, albeit with a low predictive value due to sampling error and considerable interobserver variation.[4,6,12–15] Even though the predictive value of LGD increases with consensus of multiple pathologists, approximately one-third of the patients with BE are diagnosed with LGD during surveillance, whereas the 5-year cumulative incidence of neoplastic progression is only between 5% and 30% in this group.[15,30,31] Although the result of our study support the use of LGD diagnosed by expert GE pathologists, as indicator for increased risk of neoplastic progression, its sensitivity is only 47% and specificity 78%, despite using a consensus diagnosis of dysplasia. These results exemplify the interest in identifying molecular biomarkers to improve risk stratification and eventually cost-effectiveness of BE surveillance.
In the present study, cyclin A expression was confined to the base of the crypts in normal columnar gastrointestinal epithelium, as well as in most NDBE. With increasing grades of dysplasia the expression of cyclin A progressively shifted toward the surface epithelium. The percentage of biopsy series with a positive cyclin A surface expression increased from 10% in NDBE to 62% in biopsy series with EAC, which corresponds to previous studies.[20,21] A recent study identified cyclin A expression as 1 of a 3-biomarker panel which provides a more accurate and objective diagnosis of dysplasia in BE.[20] Our results confirmed the correlation between dysplasia and cyclin A expression and hence potential as diagnostic tool for dysplasia detection.
Positive cyclin A surface expression was detected more frequently in cases than in controls, and was significantly associated with an increased risk of developing HGD or EAC (adjusted RR of 2.4; 95% CI: 1.7–3.4), particularly in dysplastic BE. The results of previous studies evaluating the value of cyclin A expression for predicting neoplastic progression are conflicting. A small case–control study showed that cyclin A surface expression was significantly associated with an increased risk of neoplastic progression (OR 7.6; 95% CI: 1.6–37.0), whereas a more recent larger population-based study could not confirm this correlation and only found a trend toward an increased risk of progression, which eventually lost significance in a multivariate analysis (OR 1.32; 95% CI: 0.66–2.66).[19,21] These conflicting results might be explained by a rather challenging interpretation of cyclin A immunohistochemistry. We found a moderate interobserver agreement with a kappa value of 0.46. This is low compared to the interobserver agreement of the other biomarkers p53 and SOX2 (kappa values between 0.70 and 0.86).[17,18,32]
The biomarker with the greatest body of evidence remains aberrant p53 expression (adjusted RR in fully adjusted model of 3.7 (95% CI: 2.6–5.4), change in AUC 0.05) and to a lesser extent aberrant SOX2 expression (change in AUC 0.014). Cyclin A positivity showed only a minimal drop in AUC after exclusion (0.003). These findings might have important and clinically relevant implications. Assessment of p53 and SOX2 are promising to select high-risk patients for either intensified surveillance or ablation therapy and may eventually contribute to a more cost-effective management. Although routine p53 and SOX2 staining and assessment incur higher costs than histology alone, application of this panel of biomarkers has the potential to reduce the overall costs related of Barrett surveillance. Patients at low-risk of neoplastic progression, that is, the majority of the patients with LGD, might be followed-up less intensively with the potential to eventually discharge them. However, a more detailed cost-effectiveness analysis should be performed to evaluate the economic value of p53 and SOX2 immunohistochemistry, which is beyond the scope of this study.
Our study has several strengths. The large cohort of BE patients was prospectively followed-up according to a stringent scheme during a long follow-up time, clinical, endoscopic, and pathological data were collected. Additionally, a standardized endoscopy and biopsy protocol was used. All stained slides were assessed by at least 2 experienced observers blinded for clinical outcome and in case of disagreement an expert pathologist reviewed the slides for final diagnosis. Another major strength of this study was that we tested multiple biomarkers in the same cohort of BE patients so we could identify the smallest panel of biomarkers with the highest predictive value for neoplastic progression, and which can be performed on routine clinical collected FFPE tissue.
Our study also has some limitations. Although immunohistochemistry is an established clinical examination method and easily applicable to standard clinical pathological laboratories, the scoring of the expression is a subjective assessment. It will require standardization of processing and scoring for reliable routine clinical application. In spite of this, our previous studies have shown good interobserver agreement for both p53 and SOX2 and they were relatively simple and straightforward to interpret.[17,18] Further validation of this panel of biomarkers in large prospective studies is required to confirm our findings. Secondly, as all patients with BE, the patients considered as controls in this study still have the potential to progress to HGD or EAC during the future follow-up. However, since their median follow-up time was 6.5 years (which is more the twice the follow-up time of the cases), and the incidence of progression in only 2.6/1000 patients per year, the chance of progression in the controls is slim.[6]
In conclusion, cyclin A surface expression was associated with an increased risk of neoplastic progression in BE patients, but its ability to predict neoplastic progression is limited compared to the biomarkers p53 and SOX2. The use of biomarkers has the potential to significantly improve risk stratification in Barrett surveillance and hence the cost-effectiveness of Barrett surveillance programs.
Supplementary Material
Supplementary Material
Footnotes
Abbreviations: ACG = American College of Gastroenterology, AUC = area under the curve, BE = Barrett esophagus, CI = confidence interval, DAB = diaminobenzidine, EAC = esophageal adenocarcinoma, FFPE = formalin-fixed paraffin-embedded, HGD = high-grade dysplasia, HRP-ABC = horseradish peroxidase avidin–biotin complex, IQR = interquartile range, LGD = low-grade dysplasia, NDBE = nondysplastic BE, NPV = negative predictive value, PPV = positive predictive value, ROC = receiver operating characteristic, RR = relative risk.
LHJL, MJB, and KB contributed equally to the work.
Authors’ contributions: SvO: Study concept and design, acquisition of data, analysis and interpretation of data, drafting of the manuscript and statistical analysis. FtK: Study concept and design, analysis and interpretation of data, critical revision of the manuscript. MD: Analysis and interpretation of data, critical revision of the manuscript. FK: Critical revision of the manuscript and technical support. EWS: Analysis and interpretation of data, critical revision of the manuscript and statistical analysis. HAS: Critical revision of the manuscript and technical support. MCWS: Analysis and interpretation of data, critical revision of the manuscript and technical support. LHJL: Study concept and design, analysis and interpretation of data, critical revision of the manuscript, technical support and study supervision. MJB: Study concept and design, analysis and interpretation of data, critical revision of the manuscript, technical support and study supervision. KB: Study concept and design, analysis and interpretation of data, critical revision of the manuscript, technical support, and study supervision.
The authors have no conflicts of interest to disclose.
Supplemental Digital Content is available for this article.
References
- [1].Spechler SJ, Sharma P, Souza RF, et al. American Gastroenterological Association. American Gastroenterological Association medical position statement on the management of Barrett's esophagus. Gastroenterology 2011;140:1084–91. [DOI] [PubMed] [Google Scholar]
- [2].Kastelein F, Spaander MC, Biermann K, et al. Role of acid suppression in the development and progression of dysplasia in patients with Barrett's esophagus. Dig Dis 2011;29:499–506. [DOI] [PubMed] [Google Scholar]
- [3].Winters C, Jr, Spurling TJ, Chobanian SJ, et al. Barrett's esophagus. A prevalent, occult complication of gastroesophageal reflux disease. Gastroenterology 1987;92:118–24. [PubMed] [Google Scholar]
- [4].Bhat S, Coleman HG, Yousef F, et al. Risk of malignant progression in Barrett's esophagus patients: results from a large population-based study. J Natl Cancer Inst 2011;103:1049–57. [DOI] [PMC free article] [PubMed] [Google Scholar]
- [5].Desai TK, Krishnan K, Samala N, et al. The incidence of oesophageal adenocarcinoma in non-dysplastic Barrett's oesophagus: a meta-analysis. Gut 2012;61:970–6. [DOI] [PubMed] [Google Scholar]
- [6].Hvid-Jensen F, Pedersen L, Drewes AM, et al. Incidence of adenocarcinoma among patients with Barrett's esophagus. N Engl J Med 2011;365:1375–83. [DOI] [PubMed] [Google Scholar]
- [7].Sikkema M, de Jonge PJ, Steyerberg EW, et al. Risk of esophageal adenocarcinoma and mortality in patients with Barrett's esophagus: a systematic review and meta-analysis. Clin Gastroenterol Hepatol 2010;8:235–44. quiz e232. [DOI] [PubMed] [Google Scholar]
- [8].Buttar NS, Wang KK. Mechanisms of disease: carcinogenesis in Barrett's esophagus. Nat Clin Pract Gastroenterol Hepatol 2004;1:106–12. [DOI] [PubMed] [Google Scholar]
- [9].van Hagen P, Hulshof MC, van Lanschot JJ, et al. Preoperative chemoradiotherapy for esophageal or junctional cancer. N Engl J Med 2012;366:2074–84. [DOI] [PubMed] [Google Scholar]
- [10].Fitzgerald RC, di Pietro M, Ragunath K, et al. British Society of Gastroenterology guidelines on the diagnosis and management of Barrett's oesophagus. Gut 2014;63:7–42. [DOI] [PubMed] [Google Scholar]
- [11].Wang KK, Sampliner RE. Practice Parameters Committee of the American College of Gastroenterology. Updated guidelines 2008 for the diagnosis, surveillance and therapy of Barrett's esophagus. Am J Gastroenterol 2008;103:788–97. [DOI] [PubMed] [Google Scholar]
- [12].Sikkema M, Looman CW, Steyerberg EW, et al. Predictors for neoplastic progression in patients with Barrett's Esophagus: a prospective cohort study. Am J Gastroenterol 2011;106:1231–8. [DOI] [PubMed] [Google Scholar]
- [13].Curvers WL, ten Kate FJ, Krishnadath KK, et al. Low-grade dysplasia in Barrett's esophagus: overdiagnosed and underestimated. Am J Gastroenterol 2010;105:1523–30. [DOI] [PubMed] [Google Scholar]
- [14].Kerkhof M, van Dekken H, Steyerberg EW, et al. Grading of dysplasia in Barrett's oesophagus: substantial interobserver variation between general and gastrointestinal pathologists. Histopathology 2007;50:920–7. [DOI] [PubMed] [Google Scholar]
- [15].Skacel M, Petras RE, Gramlich TL, et al. The diagnosis of low-grade dysplasia in Barrett's esophagus and its implications for disease progression. Am J Gastroenterol 2000;95:3383–7. [DOI] [PubMed] [Google Scholar]
- [16].Kastelein F, Biermann K, Steyerberg EW, et al. Value of alpha-methylacyl-CoA racemase immunochemistry for predicting neoplastic progression in Barrett's oesophagus. Histopathology 2013;63:630–9. [DOI] [PubMed] [Google Scholar]
- [17].Kastelein F, Biermann K, Steyerberg EW, et al. Aberrant p53 protein expression is associated with an increased risk of neoplastic progression in patients with Barrett's oesophagus. Gut 2013;62:1676–83. [DOI] [PubMed] [Google Scholar]
- [18].van Olphen S, Biermann K, Spaander MC, et al. SOX2 as a novel marker to predict neoplastic progression in Barrett's esophagus. Am J Gastroenterol 2015;110:1420–8. [DOI] [PubMed] [Google Scholar]
- [19].Bird-Lieberman EL, Dunn JM, Coleman HG, et al. Population-based study reveals new risk-stratification biomarker panel for Barrett's esophagus. Gastroenterology 2012;143:927.e3–35.e3. [DOI] [PubMed] [Google Scholar]
- [20].di Pietro M, Boerwinkel DF, Shariff MK, et al. The combination of autofluorescence endoscopy and molecular biomarkers is a novel diagnostic tool for dysplasia in Barrett's oesophagus. Gut 2015;64:49–56. [DOI] [PMC free article] [PubMed] [Google Scholar]
- [21].Lao-Sirieix P, Lovat L, Fitzgerald RC. Cyclin A immunocytology as a risk stratification tool for Barrett's esophagus surveillance. Clin Cancer Res 2007;13(2 Pt 1):659–65. [DOI] [PubMed] [Google Scholar]
- [22].Sharma P, Dent J, Armstrong D, et al. The development and validation of an endoscopic grading system for Barrett's esophagus: the Prague C & M criteria. Gastroenterology 2006;131:1392–9. [DOI] [PubMed] [Google Scholar]
- [23].DiBaise JK. The LA classification for esophagitis: a call for standardization. Am J Gastroenterol 1999;94:3403–4. [DOI] [PubMed] [Google Scholar]
- [24].Levine DS, Haggitt RC, Blount PL, et al. An endoscopic biopsy protocol can differentiate high-grade dysplasia from early adenocarcinoma in Barrett's esophagus. Gastroenterology 1993;105:40–50. [DOI] [PubMed] [Google Scholar]
- [25].Sirieix PS, O’Donovan M, Brown J, et al. Surface expression of minichromosome maintenance proteins provides a novel method for detecting patients at risk for developing adenocarcinoma in Barrett's esophagus. Clin Cancer Res 2003;9:2560–6. [PubMed] [Google Scholar]
- [26].Steyerberg EW, Pencina MJ, Lingsma HF, et al. Assessing the incremental value of diagnostic and prognostic markers: a review and illustration. Eur J Clin Invest 2012;42:216–28. [DOI] [PMC free article] [PubMed] [Google Scholar]
- [27].Landis JR, Koch GG. The measurement of observer agreement for categorical data. Biometrics 1977;33:159–74. [PubMed] [Google Scholar]
- [28].Shaheen NJ, Sharma P, Overholt BF, et al. Radiofrequency ablation in Barrett's esophagus with dysplasia. N Engl J Med 2009;360:2277–88. [DOI] [PubMed] [Google Scholar]
- [29].Phoa KN, van Vilsteren FG, Weusten BL, et al. Radiofrequency ablation vs endoscopic surveillance for patients with Barrett esophagus and low-grade dysplasia: a randomized clinical trial. JAMA 2014;311:1209–17. [DOI] [PubMed] [Google Scholar]
- [30].Duits LC, Phoa KN, Curvers WL, et al. Barrett's oesophagus patients with low-grade dysplasia can be accurately risk-stratified after histological review by an expert pathology panel. Gut 2015;64:700–6. [DOI] [PubMed] [Google Scholar]
- [31].Kaye PV, Haider SA, Ilyas M, et al. Barrett's dysplasia and the Vienna classification: reproducibility, prediction of progression and impact of consensus reporting and p53 immunohistochemistry. Histopathology 2009;54:699–712. [DOI] [PubMed] [Google Scholar]
- [32].Murray L, Sedo A, Scott M, et al. TP53 and progression from Barrett's metaplasia to oesophageal adenocarcinoma in a UK population cohort. Gut 2006;55:1390–7. [DOI] [PMC free article] [PubMed] [Google Scholar]
Associated Data
This section collects any data citations, data availability statements, or supplementary materials included in this article.