

Summary
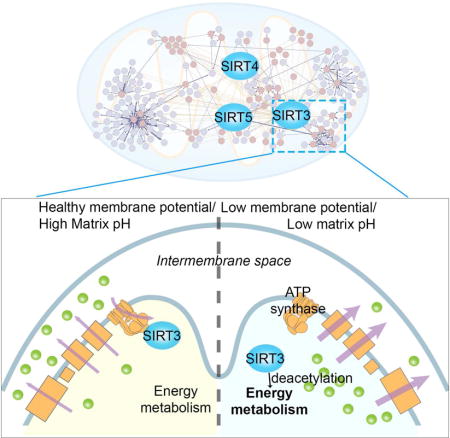
Mitochondrial sirtuins, SIRT3-5, are NAD+-dependent deacylases and ADP-ribosyltransferases critical for stress responses. However, a comprehensive understanding of sirtuin targets, regulation of sirtuin activity, and the relationships between sirtuins remains a key challenge in mitochondrial physiology. Here, we employ systematic interaction proteomics to elucidate the mitochondrial sirtuin protein interaction landscape. This work reveals sirtuin interactions with numerous functional modules within mitochondria, identifies candidate sirtuin substrates, and uncovers a fundamental role for sequestration of SIRT3 by ATP synthase in mitochondrial homeostasis. In healthy mitochondria, a pool of SIRT3 binds ATP synthase, but upon matrix pH reduction with concomitant loss of mitochondrial membrane potential, SIRT3 dissociates. This release correlates with rapid deacetylation of matrix proteins and SIRT3 is required for recovery of membrane potential. In vitro reconstitution experiments, as well as Crispr/Cas9 engineered cells, indicate that pH-dependent SIRT3 release requires H135 in ATP5O. Our SIRT3-5 interaction network provides a framework for discovering novel biological functions regulated by mitochondrial sirtuins.
ETOC blurb
Upon loss of mitochondrial membrane potential SIRT3 is released from the mitochondrial matrix and its return is neccesary for a rapid restoration of mitochondrial health
Introduction
The conserved sirtuin superfamily of NAD+-dependent protein deacetylases, deacylases and ADP-ribosyltransferases regulates a range of cellular functions through post-translational modification of protein substrates. Three sirtuins, SIRT3, SIRT4 and SIRT5, reside within the mitochondrion, an organelle that specializes in energy production, fuel partitioning, stress responses, and signaling (Verdin et al., 2010). SIRT3 is the most thoroughly studied mitochondrial sirtuin. It possesses robust deacetylase activity towards a cadre of metabolic targets, including subunits of the electron transport chain (ETC), as well as enzymes involved in fatty acid oxidation, amino acid metabolism, redox balance, and the tricarboxylic acid (TCA) cycle (Kumar and Lombard, 2015). Indeed, previous studies have shown that enzymes central to mitochondrial oxidative metabolism are modified by lysine acetylation and many of these proteins are hyperacetylated when SIRT3 is absent (Hebert et al., 2013). By contrast, much less is understood about the functions of SIRT4 and SIRT5. SIRT4 acts upon glutamate dehydrogenase and malonyl-CoA decarboxylase to regulate amino acid and fatty acid utilization, respectively (Csibi et al., 2013; Haigis et al., 2006; Jeong et al., 2013; Laurent et al., 2013), and has been shown to possess weak deacylase and lipoamidase activity (Mathias et al., 2014). SIRT5 possesses deacylase activity and has been implicated in pyruvate metabolism via control of oxidative phosphorylation (Park et al., 2013).
Surveys of the mitochondrial proteome revealed that a surprisingly large number of mitochondrial proteins are acetylated or succinylated (Kim et al., 2006). However, our global understanding of sirtuin-substrate relationships is limited, and only a fraction of mitochondrial deacetylation is thought to be mediated by SIRT3 (Hebert et al., 2013). A comprehensive analysis of the sirtuin protein interaction network may aid in the elucidation of mechanisms controlling sirtuin activity and facilitate the identification of candidate targets not previously associated with sirtuins.
In this study, we utilized a proteomic approach to systematically define the mitochondrial sirtuin interacting proteins and their subnetwork topology. Sirtuins associated with numerous functional modules critical for mitochondrial homeostasis and also protein assemblies not previously linked to sirtuins, including protein synthesis and transcription modules. Moreover, analysis of the network uncovered a dynamic redistribution of SIRT3 via binding with ATP5O upon membrane potential stress, providing a fundamental mechanism by which the cell is able to acutely toggle mitochondrial acetylation and fuel utilization in response to cellular stress.
Results
Defining the Mitochondrial Sirtuin Interactome
To generate the mitochondrial sirtuin network, we employed a two-tiered proteomic approach (Figure 1A) in order to: 1) identify specific SIRT3-5 interacting proteins (SIPs), and 2) define mitochondrial subnetworks associated with sirtuins by mapping the architecture of the SIPs using reciprocal interaction proteomics (Figure 1A). This strategy allowed us to generate a comprehensive, high confidence map of SIRT3-5 binding partners and to place these partners within an architectural framework linked with mitochondrial biology.
Figure 1. Generating a Mitochondrial Sirtuin interactome.
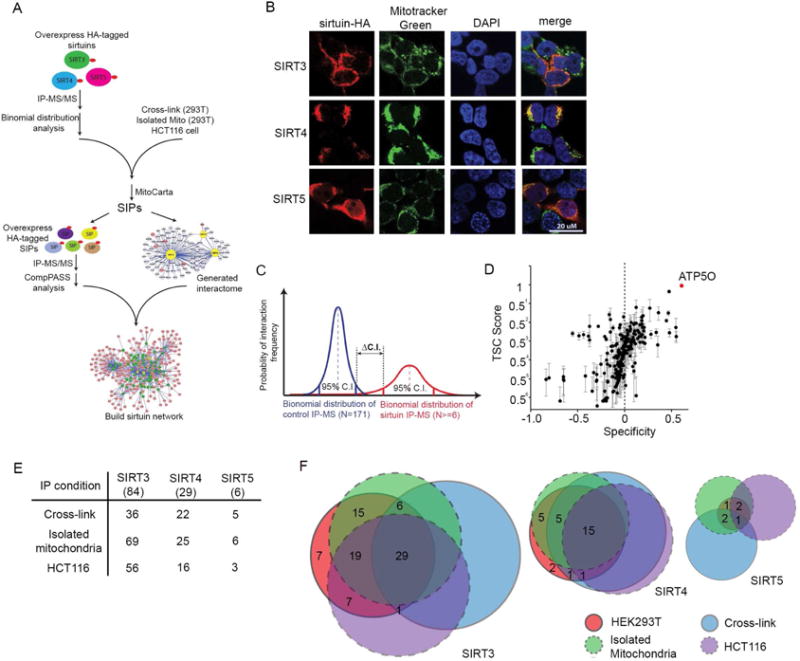
(A) Workflow. SIRT3-5-HA or mtDSRED-HA constructs were stably overexpressed in 293T cells. Following IP-MS experiments (n=6–9), sirtuin interacting proteins, termed SIPs, were determined. After validation by IHC, 81 baits were stably expressed in 293T cells with a C-terminal HA tag, and a second round of IP-MS experiments were performed to build the mitochondrial sirtuin interaction network.
(B) Subcellular localization of SIRT3-5HA was determined by immunohistochemistry of HA-tagged sirtuins and co-localization with Mitotracker Green. DAPI staining indicates nuclei.
(C) SIPs were identified using an IP-MS dataset from 171 unrelated IPs as a negative control. The binomial distribution of each mitochondrial sirtuin interacting protein was calculated from: 1) control sirtuin unrelated IP-MS datasets (blue line), and 2) sirtuin IP-MS datasets (red line). SIPs were considered specific when the 95% confidence interval for control IPs and sirtuin IP-MS data did not overlap.
(D) Representative SIRT3 IP-MS data from 293T cells plotted as total spectral count (TSC) and specificity of SIRT3 interacting proteins. ATP5O is indicated by a red dot. Error bars indicate standard error (n=9 individual IPs).
(E) Overlap in 84 SIRT3, 30 SIRT4 and 6 SIRT5 interacting proteins comparing IPs from HEK293T whole cell lysates (n=6–9) with interacting proteins identified from: HEK293T whole cell lysates after chemical crosslinking with DTBP (Cross-link, n=5), HEK293T isolated mitochondria (isolated mitochondria, n=3), or HCT116 whole cell lysates (HCT116, n=3).
(F) Venn Diagram comparing the sirtuin specific interacting proteins from HEK293T whole cell lysates (pink; as described in panel A) with overlapping interacting proteins obtained from isolated mitochondria (green), HEK293T cells crosslinked with DTBP (blue), and from HCT116 whole cell lysates (purple).
See also Figure S1 and Table S1–S4
We utilized HEK293T cells stably expressing SIRT3, SIRT4, or SIRT5 with a C-terminal HA epitope tag (Figure 1B), validated their localization to mitochondria, and performed immunoprecipitation followed by LC-MS/MS (IP-MS) in a total of 6–9 biological replicates. One challenge of defining the SIRT3-5 interactomes is that these sirtuin-substrate interactions may be weaker than more stable protein complexes. Our solution for deconvoluting the sirtuin network involved identifying mitochondrial proteins that physically associated with each sirtuin with a frequency that was higher than their interaction with a non-sirtuin related protein, using a database of 171 immunoprecipitations of unrelated baits using the same conditions (Sowa et al., 2009). To identify specific interacting proteins, we compared proteins identified in sirtuin IPs to analogous datasets for non-sirtuin bait proteins (n=171 IPs) using binomial distribution and a 95% confidence interval (C.I.) cut-off (Figures 1C and 1D, Figure S1 and Table S1). This approach allowed us to identify interacting proteins of low abundance but high specificity for sirtuins, which may be of particular relevance for transient enzyme–substrate interactions. We analyzed mitochondria-targeted DSRED interacting proteins as a negative control and identified only HSPE1, indicating that this method removed hundreds of non-specific, spurious binding proteins. We utilized DLAT as a positive control and identified known DLAT binding partners (PDHA, PDHB and PDHX) (Figure S2A, Table S1). To define the mitochondrial connectivity, we generated a final list, including only proteins previously established to reside in mitochondria (Pagliarini et al., 2008). In total, we identified 84 SIRT3, 30 SIRT4, and 6 SIRT5 high confidence candidate binding partners (Figure 1E and Table S1).
The fidelity and reproducibility of SIPs were validated by performing IP-MS/MS under different experimental conditions, including from chemically crosslinked 293T lysates, from mitochondria isolated from 293T cells, and from HCT116 cell lysates (Figure 1E, 1F and Tables S2–S4). Of note, 29 SIRT3, 15 SIRT4, and 1 SIRT5 interacting proteins were identified across all four experimental conditions (Figure 1F and Table S5).
Sirtuin Interacting Proteins Span Many Areas of Mitochondrial Biology
High confidence SIRT3-5 binding proteins spanned many more areas of mitochondrial biology (Figure 2A). SIRT3 interacting proteins were enriched in biological processes involving translation and energy metabolism (Figures 2–2B, S2B). SIRT4 interacting proteins demonstrated a similar enrichment as SIRT3, with an additional enrichment in anion transporters (Figures 2A–B, S2C). SIRT5 associated with the fewest proteins, and was primarily involved in metabolism and translation (Figures 2A–B). Compared to SIRT3 and SIRT4, there were more SIRT5 interacting proteins localized outside of the mitochondria consistent with SIRT5 being present in other compartments (Table S1). Across all conditions, we identified several previously reported SIRT3 substrates, such as GLUD1, NDUFA9, and PDHB (Figure S2A) (German and Haigis, 2015). Importantly, as 87% of the candidate interactions across SIRT3-5 have not previously been linked with sirtuins, this sirtuin interactome serves as a hypothesis generating resource for exploring new areas of sirtuin biology and for understanding the molecular points of convergence of sirtuin activity.
Figure 2. Specificity and Pathways of the Mitochondrial Sirtuin Interactome.
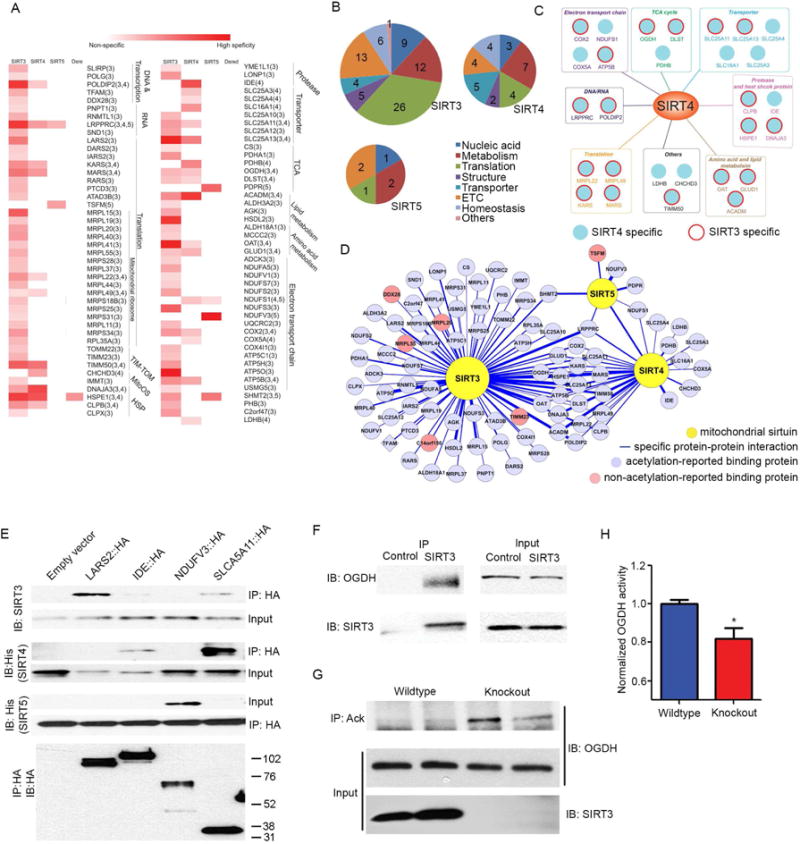
(A) Heatmap of significant mitochondrial sirtuin interacting proteins (SIPs), compared to significant interacting proteins of mitochondria-targeted DSRED. Color is based on the frequency of SIPs identified from individual IPs (n=9 individual experiments for SIRT3-5): white denotes proteins not identified in corresponding sirtuin IP-MS experiments, dark red indicates proteins identified in every IP. Columns represent data from IP-MS experiments of each mitochondrial sirtuin, and SIPs are identified in each row. Red rectangle indicates the candidate protein (row) that was identified as a SIP for each individual sirtuin (column).
(B) Pie charts depict the abundance and distribution of SIPs for SIRT3, SIRT4 and SIRT5. Numbers indicate the number of SIPs identified across indicated categories of mitochondrial biology.
(C) Diagram of SIRT4 specific SIPs (shown as blue circle), or common SIRT3 and SIRT4 SIPs (blue circle with red outline).
(D) Mitochondrial sirtuin interactome demonstrates unique and shared binding partners. Yellow circles indicate SIRT3-5. Blue circles represent acetylated proteins, while red circles indicate proteins not reported to be acetylated.
(E) Validation of the specificity of SIPs was determined in HEK293T cells overexpressing C-terminal HA-tagged LARS2 (SIRT3 specific), IDE (SIRT4 specific), NDUFV3 (SIRT5 specific) or SLC25A11 (SIRT3 and SIRT4 specific). α-HA immunoprecipitations were performed from 5 cell lines each stably overexpressing one of the HA-tagged SIPs or vector control and transiently overexpressing SIRT4-His or SIRT5-His. IP’s were immunoblotted with α-His antibodies to detect recombinant SIRT4 or SIRT5 or α-SIRT3 antibodies to detect SIRT3. Lower panel: HA antibody was used to detect overexpressed candidate proteins from the input lysate.
(F) Endogenous immunoprecipitation of OGDH pulls down endogenous SIRT3 from HEK293T cell lysates. 1% of lysate was used for the input control (n=3 experiments).
(G) Anti-acetyl lysine was used to immunoprecipitate proteins from 2 wildtype and 2 SIRT3 KO mouse brain lysates. Immunoprecipitants were immunoblotted with anti-OGDH antibody. 1% of input was used for a loading control. (n=6 mice/genotype tested total, n=2 representative/genotype shown).
(H) OGDH complex activity was measured in brain lysates of wildtype or SIRT3 KO mice (n=4–5). * indicates p<0.05.
See also Figure S2 and Table S5
One purpose of this study was to identify specificity and overlap in proteins associated with sirtuins. SIRT3 and SIRT4 displayed the most extensive overlap, with 19 common binding partners (Figured 2C–D). Importantly, we also identified interacting proteins that were unique to each mitochondrial sirtuin (Figure 2A and Figures 2C–E). For example, LARS2 was specific for binding to SIRT3, while NDUFV3 was specific for binding to SIRT5 (Figure 2E).
Acetylated Proteins Interact with Sirtuins
A major goal of this proteomic approach was to identify candidate sirtuin substrates. Indeed, five proteins in the high confidence network have previously been characterized as SIRT3-5 substrates/interacting proteins, including PDHB, ATP5O, and ATP5B for SIRT3, GLUD1 for SIRT3 and SIRT4, and IDE for SIRT4 (German and Haigis, 2015). Thus, we systematically examined the interactome for reported acetylation (http://www.phosphosite.org/), finding that 90% of high confidence SIPs are acetylated (Figure 2D) (Hornbeck et al., 2015). Moreover, 30% of SIRT3 interacting proteins were reported to be hyperacetylated in SIRT3 knockout mouse tissues (Figure S2C) (Hebert et al., 2013). We also identified two protein domains enriched in the SIRT3 interactome; using the InterPro database: ATPase AAA+ type and mitochondrial substrate carrier (https://www.ebi.ac.uk/interpro/) (Figure S2F), which may be linked to acetylation.
Among new proteins associating with SIRT3 and SIRT4 was 2-oxoglutarate dehydrogenase (OGDH) (Figure 2A, 2D), a TCA enzyme that converts 2-oxoglutarate to succinyl-CoA. We observed binding between SIRT3 and OGDH at endogenous levels (Figure 2F). Consistent with a role for SIRT3 in deacetylating OGDH, acetylation levels of OGDH was elevated in SIRT3−/− in brain lysates, while OGDH protein levels were unchanged (Figure 2G). Finally, OGDH enzymatic activity was reduced in lysates from SIRT3−/− mouse brain (Figure 2H). Taken together, these data are consistent with the hypothesis that OGDH acetylation and activity is regulated by SIRT3, and suggests that some acetylated proteins found in association with SIRT3 may be substrates of this enzyme.
Generating the Mitochondrial Sirtuin Network
A critical step in evaluating the sirtuin network is the validation of candidate SIPs, coupled with a detailed understanding of the individual networks of candidate SIPs. We selected 59 SIPs distributed across all major biological categories identified in the initial sirtuin network (Figure 2A and Table S1–4), and stably expressed these genes via lentiviral transduction with a C-terminal HA-FLAG tag. We tested 42 SIPs and observed co-localization with Mitotracker Green in the mitochondria (Figures 3A–B, and S3D). To validate interactions with SIRT3, 40 individual SIPs were immunoprecipitated with α-HA antibodies and examined for association with endogenous SIRT3 using immunoblotting. Except for KARS, all proteins passed this criteria for validated SIRT3 binding (Figure 3A, 3C and Figure S3A, Table S6). All 9 SIRT4 and 4 SIRT5 SIPs tested were found to associate in this assay (Figure 3C, Figure S3B–C and Table S6). Thus the sirtuin network appears to be robust.
Figure 3. Mitochondrial Sirtuin Network.
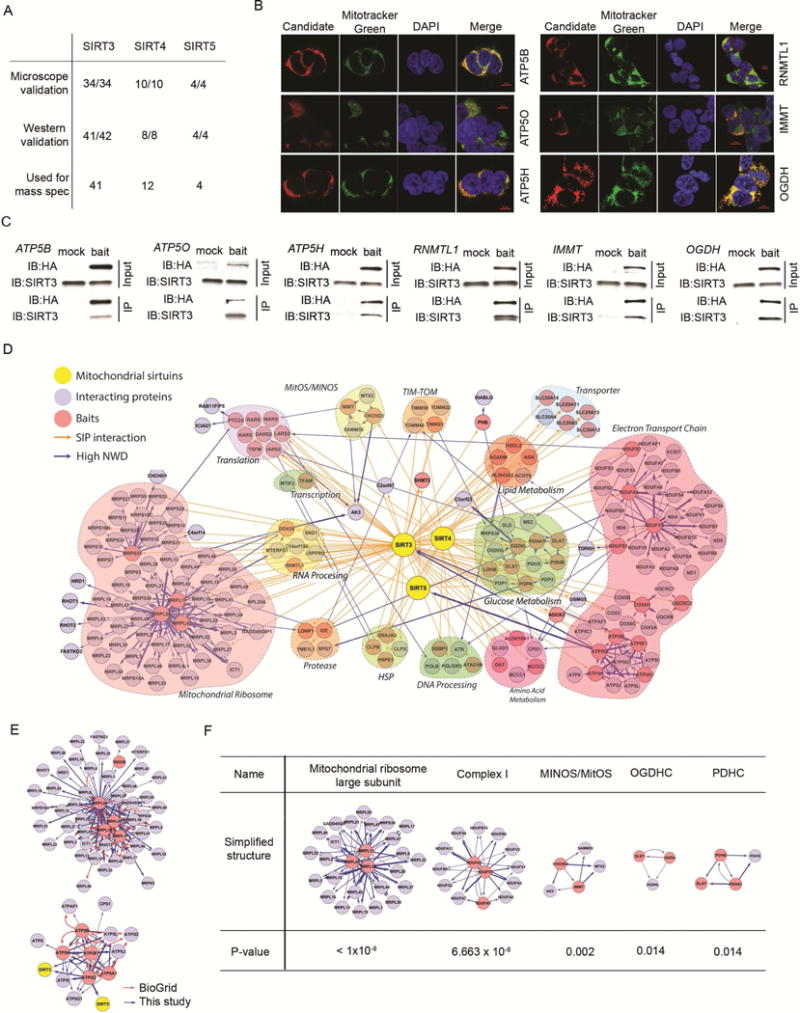
(A) Summary of IP-Western blotting and mitochondrial localization validation of SIPs.
(B) Subcellular localization of C-terminal HA tagged ATP5O, ATP5B, ATP5H, RNMTL1, IMMT, and OGDH (red) was measured in 293T cells (from panel A) and determined by IHC (α-HA) and colocalization with Mitotracker Green. DAPI staining indicates nuclei.
(C) IP-Western blotting validation of SIRT3 interacting partners. C-terminal HA-tagged ATP5O, ATP5B, ATP5H, RNMTL1, IMMT, and OGDH were stably overexpressed in 293T cells and complexes were immunoprecipitated by α-HA, followed by immunoblotting using antibodies against HA and SIRT3. Mock lanes represent IPs from cells overexpressing a vector control, while bait lanes are from IPs from cells overexpressing the indicated HA-tagged protein. Input lanes represent loading of 1% of total lysates.
(D) Model depicting the mitochondrial sirtuin network. This model was generated by superimposing information from two steps: 1) sirtuin IP-MS and 2) SIP IP-MS. The diagram includes mitochondrial sirtuins (yellow), SIPs identified in Figure 2D used as baits (red), and interacting proteins for each bait determined by COMPASS (blue). Connections between sirtuins and SIPs are denoted by an orange arrow. Interactions between baits and their interacting proteins are denoted by a blue arrow. Heavy line width correlates with high NWD score. Functionally related proteins are grouped as indicated.
(E) Subnetworks for mitochondrial ribosome large subunit (above) and ATP synthase (below) were isolated from mitochondrial sirtuin network and compared to BioGrid. Baits selected to construct the subnetworks are red circles, and bait-interacting proteins are blue circles. Mitochondrial sirtuins are yellow circles. Interactions identified by BioGrid are denoted by a red arrow, and interactions identified by this study are denoted by a blue arrow.
(F) ClusterOne analysis of the mitochondrial sirtuin network identified 5 subnetworks containing known protein complexes, including mitochondrial ribosome large subunit (MRPL), complex I, mitochondrial inner membrane organization system (MitOS/MINOS), oxoglutarate dehydrogenase complex (OGDHC) and pyruvate dehygrogenase complex (PDHC). SIP baits are in red circles and their interacting partners are in blue circles.
See also Figure S3 and Table S6
To assemble SIPs into defined mitochondrial subnetworks, we performed immunoprecipitation and LC-MS/MS for candidate SIPs, followed by Comparative Proteomic Analysis Software Suite (CompPASS) analysis. CompPASS uses a metric (normalized weighed D-score, NWD) involving protein frequency, reproducibility, and abundance across a large set of parallel immunoprecipitation/LC-MS2 experiments (in this case > 200 immunoprecipitations, Table S7) to identify high confidence interacting proteins (HCIPs) present in stable complexes (Sowa et al., 2009). From 58 SIP baits, we identified 136 mitochondrial HCIPs with an NWD score higher than 0.8 and z-score higher than 9 with a FDR of <2% on both peptide and protein level (Figures 3D, and S5A) (https://haigis.hms.harvard.edu/mitochondrial-sirtuin-network). These mitochondrial HCIPs were incorporated into network maps together with the direct sirtuin network (Figure 2D) to create an integrated network model (Figure 3D). The topology of the network was defined for 41, 13, and 14 SIPs for SIRT3, SIRT4 and SIRT5, respectively (Figure 4). The resulting mitochondrial sirtuin network defines a comprehensive interactome for mitochondrial sirtuins and reveals insight into the complex subnetworks associated with sirtuin-protein interactions.
Figure 4. Organization for Each Mitochondrial Sirtuin Network.
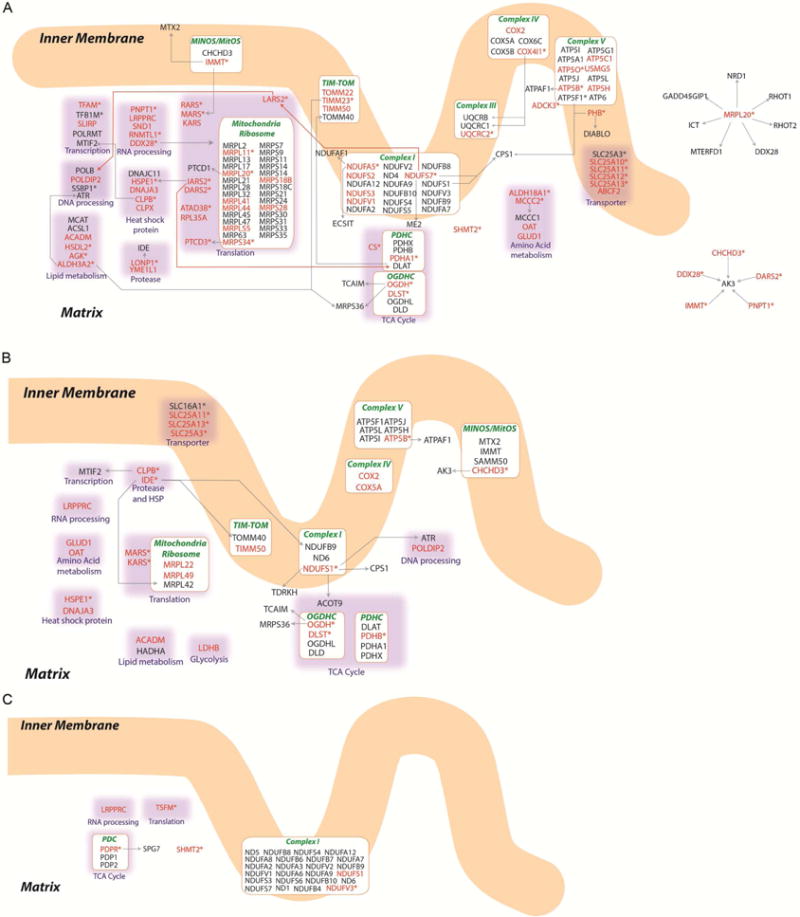
Organization for each individual mitochondrial sirtuin network is shown for SIRT3 (A), SIRT4 (B) and SIRT5 (C). SIPs are shown in red text, asterisks (*) indicate bait proteins used to build the network, and bait interacting proteins are in black text. Protein-protein interactions are indicated by arrows (from baits to targets). Protein-protein interactions between subunits of protein complexes were omitted from these panels for simplicity. See Figure S4 and Table S7
The Mitochondrial Sirtuin Network Contains Defined Protein Complexes Involved in Diverse Functions
The mitochondrial sirtuin network identified here consisted of 197 proteins and 341 interactions (Figure 3D, Figure 4), yielding insight into the architecture of mitochondrial protein complexes within the sirtuin network. To probe this network, two subnetworks were generated from our dataset containing SIPs from the mitochondrial ribosome (MR) (5 SIPs) or ATP synthase (5 SIPs) (Figure 3E). We identified 48 proteins in the MR subnetwork, of which 40 (83% of the subnetwork) were previously identified as bona fide subunits of MR. In the ATP synthase subnetwork, we identified 13 proteins, of which 10 (77% of the subnetwork) are known subunits, as well as SIRT3, consistent with experiments described above (Figure 3A). Furthermore, the MR and ATP synthase subnetworks displayed a 41% and 32% overlap, respectively, with reported interactomes from BioGRID (Stark et al., 2006).
We next performed an unbiased identification of protein subnetworks within the mitochondrial sirtuin interactome using two independent analyses of clustering (ClusterOne and Hierarchical clustering) (Figure 3F, S4, S5). Based on ClusterOne analysis, we identified 6 protein complexes within the mitochondria (Nepusz et al., 2012). The top ranked complex (p<0.000006) was for the MR large subunit, followed by ATP synthase, complex I, mitochondrial inner membrane organizing system (MINOS), OGDHC, and PDH (Figure 3F and S4). Five of these protein complexes were also identified by NWD score-based hierarchical clustering analysis (Figures S5B–E).
SIRT3 Dynamically Associates with ATP Synthase
Among the most specific SIRT3 interactors identified across all conditions was ATP5O (oligomycin sensitivity conferring protein), a subunit of mitochondrial ATP synthase (Figure 1D, Table S1–3). Unbiased clustering analysis grouped SIRT3 with subunits of ATP synthase (Figure 5A and 5B), consistent with previous reports (Rahman et al., 2014; Vassilopoulos et al., 2014). Finally, the ATP5O subunit of ATP synthase demonstrated a unique signature of both high specificity (Figure 5C) and high NWD score (Figure 5D). We also examined their co-migration under non-denaturing conditions and SIRT3 co-migrated with the ATP synthase complex at 500 kDa, consistent with co-association (Figures 5E and 5F). Thus, multiple approaches identified an association between SIRT3 and ATP synthase.
Figure 5. SIRT3 Associates with ATP Synthase.
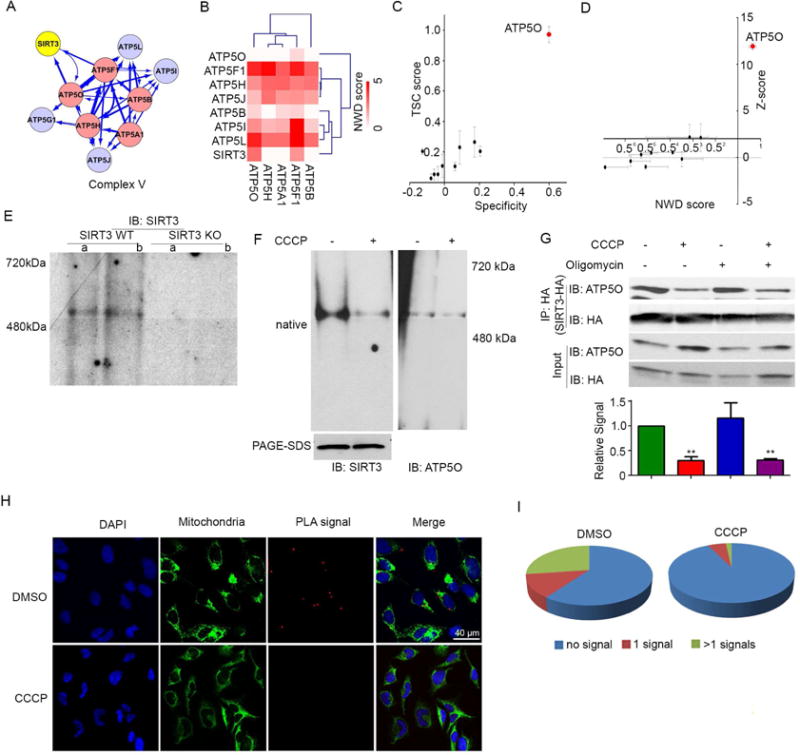
(A) ATP synthase subnetwork identified by ClusterOne analysis (P-value = 1.76 × 10⁻⁵). SIRT3, baits, and bait-interacting proteins are denoted as yellow, red, and blue circles, respectively. Thicker line width represents higher NWD score.
(B) Hierarchical clustering analysis reveals that SIRT3 clusters with ATP synthase subunits. Heat map is based on NWD score where darker red indicates a higher NWD score.
(C) TSC score, specificity (C) as well as NWD score and Z-score (D) of SIRT3 interacting subunits of ATP synthase. ATP5O is highlighted in red. Error bars indicate standard error (n=9).
(E) Native gel electrophoresis using mitochondrial lysates from wildtype (WT) and SIRT3 knockout (KO) MEFs were immunoblotted with α-SIRT3 antibodies. SIRT3 migrates at a size corresponding to 500kDa. Lanes a and b represent biological duplicates.
(F) HEK293T cells were treated with DMSO control (−) or CCCP (+) for 10 minutes, then crosslinked by DTBP treatment. Mitochondria were isolated, lysed by digitonin, separated by native gel electrophoresis and immunoblotted with α-SIRT3 antibodies. Untreated HEK293T cells were crosslinked and treated as above and immunoblotted with α-ATP5O antibody. Similar lysates were treated with DTT to remove crosslinking, and then analyzed by SDS-PAGE for total levels of SIRT3.
(G) SIRT3-HA overexpressing HEK293T cells were treated −/+ CCCP or −/+ oligomycin for 10 min and then SIRT3 complexes were immunoprecipitated and separated by SDS-PAGE. SIRT3-HA and ATP5O were detected by immunoblotting with antibodies against HA and ATP5O. Lower panel: bands were quantified by ImageJ, with IP signals normalized to input signal; all samples are compared to DMSO control. n=2.
(H) PLA signals co-localized with mitochondria as indicated by Alexa Fluor® 488 conjugate Anti-Mitochondria antibody. DAPI staining indicates nuclei.
(I) Quantification of PLA signals in DMSO treated versus CCCP treated HeLa cells. n=2 experiments.
See Figure S5
Because ATP synthase activity is intrinsically linked to the mitochondrial proton gradient, we tested whether its interaction with SIRT3 was sensitive to disruption of the membrane potential. A ten minute treatment with carbonyl cyanide m-chlorophenyl hydrazine (CCCP), an ionophore that allows protons to cross the mitochondrial inner membrane, disrupted binding between SIRT3 and ATP synthase, while total levels of SIRT3 were unchanged (Figure 5F). Likewise, CCCP treatment disrupted the interaction between SIRT3-HA and endogenous ATP5O (Figures 5G). We next tested the effect of oligomycin, which blocks the proton channel of the F0 subunit of ATP synthase, inhibiting ATP production without reducing mitochondrial membrane potential. Surprisingly, while CCCP treatment decreased binding between SIRT3-HA and ATP5O, oligomycin had little effect (Figure 5G), suggesting that CCCP treatment disassociates SIRT3 from ATP synthase via decreasing the mitochondrial proton gradient.
We examined the dynamics of SIRT3 and ATP5O binding in situ using a proximity ligation assay (PLA) (Soderberg et al., 2006). With DMSO treatment, we found up to 10 spot-like signals per cell in 40% of cells, which colocalized with mitochondria, indicating physical binding between SIRT3 and ATP5O. PLA signals were not detected in negative controls lacking SIRT3-HA overexpression (Figure S5G–I and Figure 5H). By contrast, CCCP treatment diminished the number of cells with PLA signal (7%) and number of signals per cell, indicating that uncoupling dissociated the SIRT3-ATP5O interaction in situ (Figure 5H–I).
SIRT3 Binding to ATP5O is pH-Dependent
The discovery that SIRT3-ATP5O binding correlated with membrane potential led us to explore the biochemical mechanisms for their dissociation. Disrupting the mitochondrial membrane potential is known to reduce the matrix pH from pH 7.8 to a more acidic pH, ranging from 6.3 to 7 (Llopis et al., 1998). To examine whether changes in pH may underlie SIRT3-ATP5O dissociation, we re-examined how CCCP affects pH using HeLa cells expressing SypHer, a pH sensitive fluorescent protein, targeted to the mitochondrial matrix (Poburko et al., 2011). Treatment with 0.5 μM CCCP for 10 minutes reduced the mitochondrial matrix pH from 7.8 to 6.5–6.7 (Figure 6A). Next, we performed SIRT3-HA immunoprecipitations in a physiological range of lysis buffers (pH 6.5–8.0). Consistent with results from depolarized mitochondria, ATP5O binding with SIRT3-HA was efficient at high pH ranges from 7 to 8, but less apparent at a pH of 6.5 or lower (Figure 6B). We considered if pH-dependent interaction applied to other SIRT3 substrates, and was therefore an intrinsic property of SIRT3. SIRT3 binding to several previously characterized substrates ACADM, HADHA, GLUD1 and UQCRC2 did not show a similar dependence on pH (Figure 6B), suggesting that this pH-driven dissociation reaction was selective for the SIRT3-ATP5O interaction.
Figure 6. pH-Dependent Association Between SIRT3 and ATP5O.
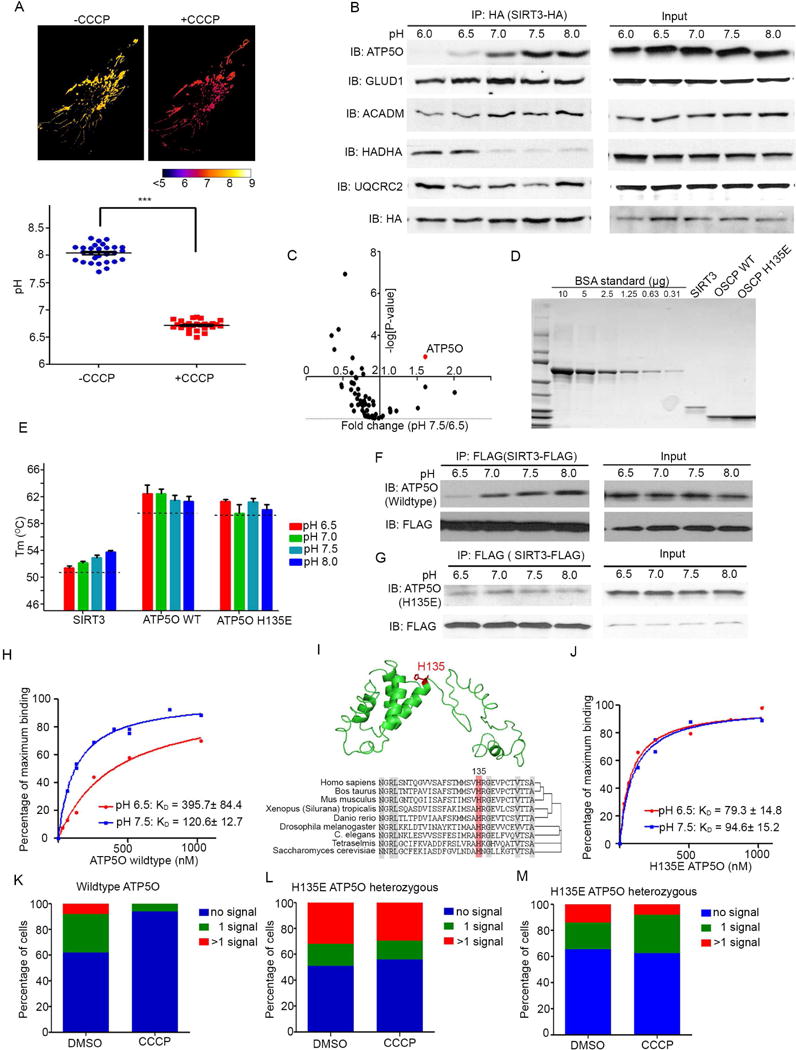
(A) Upper panel: HeLa cells overexpressing SypHer fluorescent protein targeted to the mitochondrial matrix were treated −/+ CCCP for 10 minutes. Image was pseudo-colored based on pH evaluation. pH was detected by measuring the ratio of emission at 510–560 after excitation at 480 nm versus 430 nm. Ratios were converted to pH values using a standard curve. Lower panel: pH values from > 20 cells were quantified before and after 5 minute CCCP treatment. ***indicates p-value < 0.001.
(B) SIRT3-HA was immunoprecipitated from HEK293T cells at pH 6.0–8.0. Immunoprecipitates were separated by SDS-PAGE and blotted with α-ATP5O, α-GLUD1, α-ACADM, α-HADHA, α-UQCRC2, and α-HA antibodies. 1/100 of input from each IP was used for input control.
(C) SIRT3-HA was stably overexpressed in HEK293T cells and immunoprecipitated at pH 6.5 or 7.5. Immunoprecipitated proteins were digested, isobarically labeled, and analyzed by quantitative mass spectrometry. Data were pooled from 3 biological repeats, and each biological repeat contained 3 technical repeats. Proteins identified were plotted by the fold change pH 7.5/6.5 (X-axis) and their corresponding −log(P-value) (Y-axis) between the replicates.
(D) Coomassie blue staining of recombinant SIRT3-Flag, ATP5O and H135E ATP5O proteins, compared to a BSA standard loading control.
(E) Melting temperature of recombinant SIRT3, ATP5O, or H135E ATP5O. 2 μg of proteins was diluted in 20 μl thermal shift buffer, and thermal stability was measured by Differential Scanning Fluorimetry. Error bars indicate standard error (n=3).
(F–G) C-terminal FLAG-tagged SIRT3 and ATP5O (F) or H135E ATP5O (G) were purified from BL21 cells. 40 ng of each protein was incubated in lysis buffer at pH ranges of 6.5–8.0. IPs were performed using α-FLAG antibodies, and protein complexes were determined by blotting for SIRT3-FLAG (α-FLAG) and ATP5O (α-ATP5O). 1/100 of input from each IP was used for analogous blots on the right panel.
(H) Binding affinity for SIRT3 and ATP5O was determined at pH 6.5 (red line) and pH 7.5 (blue line) using BLItz Bio-Layer Interferometer. SIRT3-FLAG protein was loaded onto the biosensor as the ligand and increasing concentrations of ATP5O protein were used as the analyte to bind with SIRT3 (n=6).
(I) Upper panel: structure of ATP5O protein obtained from protein data bank (PDB 2wss.1.J), highlighting histidine 135 (H135) in red. Lower panel: H135 is conserved from yeast to human.
(J) Binding curves for SIRT3 and H135E ATP5O at pH 6.5 (red line) and pH 7.5 (blue line). SIRT3-FLAG protein was loaded onto the biosensors as the ligand and increasing concentrations (as indicated) of H135E ATP5O were used as the analyte to bind with SIRT3 (n=6).
(K–M) Quantification of PLA signals in DMSO or CCCP treated wildtype HeLa cells (K) and two individual heterozygous H135E ATP5O HeLa cell lines (L, M) as performed in panel 5H–I. n>50 and 2 repeats for each experiment. p =0.007 (K), p=0.586 (L) and p=0.774 (M).
See Figure S6
To rigorously test this idea, we performed unbiased, quantitative mass spectrometry to measure the SIRT3 binding distribution under a pH of 6.5 or 7.5. Strikingly, among SIRT3 SIPs, only SIRT3 binding to ATP5O significantly (p value<0.01) increased under a pH of 7.5, compared with a pH of 6.5 (Figures 6C, S6A). By contrast, the majority of SIRT3 binding partners trended towards increased association with SIRT3 at pH 6.5, providing clear evidence that the binding profile of SIRT3 is dynamic and changes under conditions of low mitochondrial matrix pH. These data suggest that in healthy mitochondria, a pool of SIRT3 is tightly associated and perhaps sequestered in a complex with ATP5O, but upon reduction in matrix pH, SIRT3 redistributes to other binding partners and candidate substrates.
Reconstitution of pH-dependent SIRT3-ATP5O Dissociation in vitro
We next examined the unique pH-dependent association between SIRT3 and ATP5O using an in vitro, reconstituted system with purified, recombinant proteins (Figures 6D and S6B–C). After confirming that both proteins retained thermal stability at pH 6.5-pH 8.0, as measured by their melting temperatures (Figure 6E), we performed SIRT3-ATP5O binding assays at a pH range from 6.0 to 8.0. We observed interactions between SIRT3 and ATP5O at pH 7.5 and 8.0, but this binding was reduced in immunoprecipitations at pH 6.5 (Figure 6F). We next measured the binding affinity between SIRT3 and ATP5O and observed a tight association, with a KD of 100 nM at pH 7.5 (Figure 6H), 10-fold lower than reported sirtuin-substrate binding KD’s (Smith et al., 2011). Notably, the KD increased to 400 nM at pH 6.5, demonstrating that the binding affinity between SIRT3 and the ATP5O subunit of ATP synthase weakened at low pH (Figure 6H).
To elucidate the mechanism underlying pH-dependent binding between SIRT3 and ATP5O, we examined pH sensitive residues in ATP5O. ATP5O has a single histidine residue (H135) that is conserved from yeast to humans (Figure 6I), which has potential to be a pH sensor via its physiologically relevant pKa (Faccenda and Campanella, 2012). This residue is located within the hinge region of ATP5O and lies in one of the lowest surface potential regions on the protein (Antoniel et al., 2014). To probe the role of H135, we mutated this residue to glutamic acid, which cannot be protonated in this pH range, and produced recombinant H135E ATP5O protein (Figure 6D and Figure S6D). H135E ATP5O was thermally stable at the pH ranges tested (Figure 6E). At pH 7.5, SIRT3 binding to H135E ATP5O was similar to that of wild-type ATP5O binding (Figures 6H,J). Strikingly, binding between SIRT3 and H135E ATP5O was pH insensitive (Figure 6J), indicating that H135 is important for this pH-dependent change in binding affinity. To test this idea further, we performed pH-dependent immunoprecipitations in vitro using purified recombinant proteins, and observed that H135E ATP5O failed to immunoprecipitate with SIRT3 in a pH-dependent manner (Figure 6G).
To assess the import of H135E ATP5O in cells we utilized the Crispr/Cas9 system to generate H135E ATP5O heterozygous cells (Figure S6E). CCCP treatment of control HeLa cells reduced PLA interaction signals between SIRT3 and ATP5O (Figure 5H and 6K, p=0.007). However, CCCP treatment failed to reduce PLA signals in H135E ATP5O heterozygous cell lines (Figure 6L–M and S6E, p=0.59 and 0.77). Of note, H135E ATP5O mutant cells displayed a stronger PLA signal than ATP5O control cells. Thus, H135 protonation at low pH weakens the interaction between ATP5O and SIRT3.
Low Membrane Potential Decreases Acetylation Level of SIRT3 Substrates
We estimated the stoichiometry of ATP5O:SIRT3 within HeLa cells to be 15:1, based on a standard curve generated by purified recombinant proteins, suggesting that ATP5O is in substantial excess to SIRT3 (Figure S7A). Because the SIRT3-ATP synthase interaction was 10-fold tighter than that known for several sirtuin substrates (Smith et al., 2011), this stoichiometry favors a model whereby SIRT3 interacts primarily with ATP synthase in healthy cells, but its distribution shifts upon conditions of mitochondrial stress associated with pH reduction in the matrix. Thus, we hypothesized that upon mitochondrial uncoupling, SIRT3 redistribution would result in the deacetylation of a cohort of SIRT3 substrates within mitochondria. We first tested whether intrinsic SIRT3 deacetylase activity was altered by pH using an in vitro deacetylase activity assay at pH 6, 7 and 8 and observed that SIRT3 retained measurable deacetylase activity (Figure 7A). Treating HeLa cells with CCCP for 10 minutes resulted in decreased acetylation of known SIRT3 targets (GLUD1, OGDH and HADHA; Figure 7B), while SIRT3 knockdown attenuated this affect (Figure 7C), demonstrating that CCCP treatment stimulates deacetylation in a SIRT3-dependent manner.
Figure 7. Mitochondrial Depolarization Leads to SIRT3-dependent Deacetylation and Regulation of Membrane Potential.
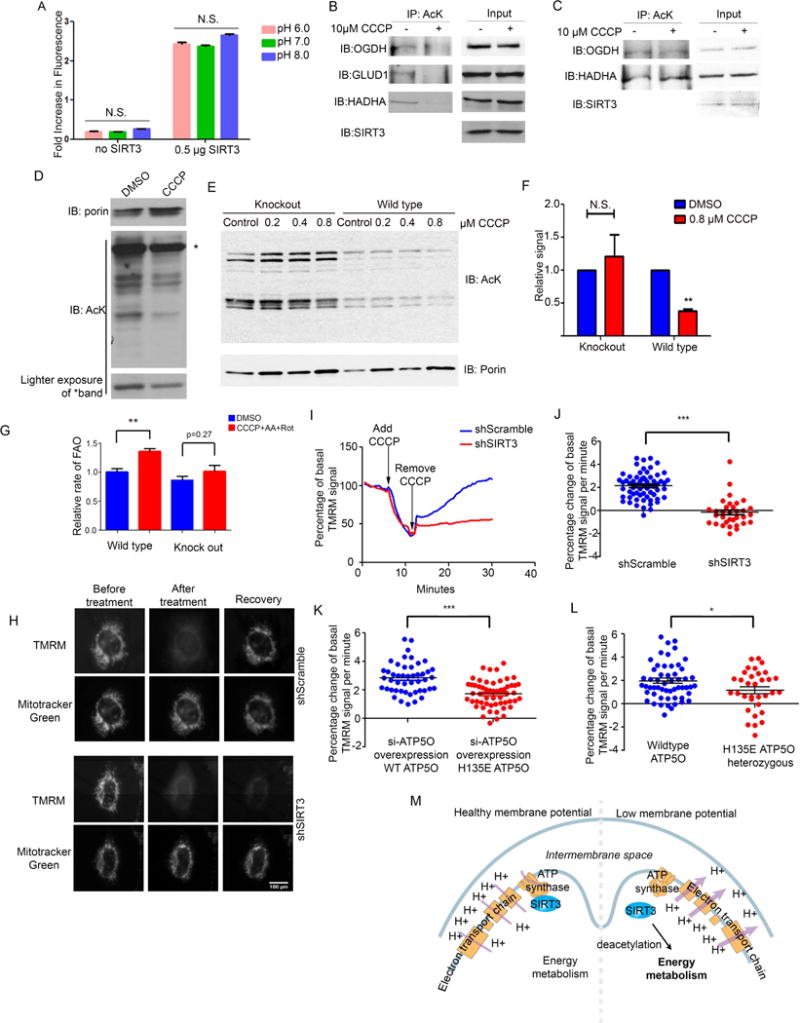
(A) SIRT3 deacetylase assays were performed by incubating purified, recombinant SIRT3 (0.5 μg) with acetylated substrate, NAD+ and Pnc1. Deacetylase activity was monitored by measuring nicotinamide production after reaction with ortho-pthalaldehyde.
(B) HeLa cells were treated with 10 μM CCCP (+) or DMSO control (−) for 10 min. Then, cells were lysed, and acetyl-proteins were immunoprecipitated using α-AcK antibodies. Immunoprecipitates were separated by SDS-PAGE and analyzed by Western blotting with α-OGDH, α-SIRT3, and α-GLUD1 antibodies. 1:100 of the lysate was loaded for input controls.
(C) SIRT3 knockdown HeLa cells were treated −/+ CCCP and analyzed as described for panel B.
(D) Purified HeLa cell mitochondria were treated with 10 μM CCCP or DMSO control for 10 min in K-Pi buffer containing succinate, glutamate and malate. Mitochondria were lysed, separated by SDS-PAGE, and analyzed by Western blotting with α-AcK and α-porin antibodies. Porin was used as loading control.
(E–F) Mitochondria isolated from wildtype and SIRT3−/− mouse hearts were treated with indicated concentrations of CCCP or DMSO control for 10 min in K-Pi buffer containing succinate, glutamate and malate. Mitochondria were lysed, separated by SDS-PAGE, and acetylation was assessed as for panel D. (F) Acetylation was quantified using ImageJ. ** indicates p-value < 0.01 (3 biological repeats/genotype).
(G) MEFs were treated with 10 μM CCCP, 1 μM of rotenone and antimycin A. Fat oxidation assays were performed in basal growth medium containing labeled palmitic acid for 30 min. Released 3H2O was measured and normalized to protein content. n = 2 experiments. (p<0.01).
(H) Representative microscope images of membrane potential in SIRT3 inducible knockdown HeLa cells (shSIRT3) and shRNA scramble control HeLa cells treated with 0.2 μM CCCP for 5 minutes. The TMRM signal was monitored and compared with mitochondrial staining by Mitotracker Green. n=4–5 individual experiments.
(I) Representative quantification of depletion and recovery of TMRM signal in SIRT3 scramble shRNA control (blue line) or SIRT3-inducible knockdown (shSIRT3, red line) HeLa cells (from panel H). Pictures were taken every 30 sec, mitochondria were detected by Mitotracker Green, and mean value of TMRM signal was calculated using ImageJ.
(J–L) TMRM recovery rates collected from 30–40 cells/group demonstrates a significant difference between SIRT3 scramble shRNA control or shSIRT3 HeLa cells (J); TMRM recovery rates in HeLa cells which were transfected with ATP5O siRNA, and then siRNA resistant variants of wildtype ATP5O H135E ATP5O were overexpressed (K); TMRM recovery in H135E ATP5O Crispr/Cas9 heterozygous cells or control HeLa cells (p=0.03). n=3–5 individual experiments.
(M) Model of membrane potential regulation of SIRT3 activity through its binding with ATP synthase. In healthy cells with intact mitochondrial membrane potential, SIRT3 binds to ATP synthase. In conditions of disrupted membrane potential and low matrix pH, SIRT3 dissociates from ATP synthase and binds to other targets, which promote restoration of mitochondrial membrane potential.
See Figure S7
As SIRT3 is a major mitochondrial deacetylase, we assessed global acetylation in purified, intact mitochondria +/− CCCP treatment. We observed a reduction in the acetylation of several mitochondrial proteins in CCCP-treated cells, compared with control cells, indicating a cohort of mitochondrial proteins are rapidly deacetylated upon depolarization (Figure 7D). Using mitochondria isolated from hearts of wildtype mice we observed decreased mitochondrial acetylation following CCCP treatment, while acetylation was not decreased in mitochondria from SIRT3−/− hearts, demonstrating that SIRT3 was required for the reduction in global acetylation after CCCP treatment (Figures 7E–7F and S7B).
A plethora of SIRT3 targets function in concert to promote flux through oxidative metabolism, generating the electrons needed to restore the proton gradient, which we hypothesized would provide a mechanism for cells to maintain membrane potential homeostasis. For example, SIRT3 deacetylates FAO enzymes to boost fat oxidation during nutrient deprivation (Hallows et al., 2011; Hirschey et al., 2010). Thus, we tested whether SIRT3 induced FAO in the acute response to membrane potential uncoupling. Short-term treatment with CCCP induced FAO in minutes, in a SIRT3-dependent manner (Figure 7G, Figure S7C). Finally, as metabolic flux plays a central role in generating reducing equivalents needed for the membrane potential, we probed the role of SIRT3 in the recovery of the membrane potential after transient stress. CCCP treatment decreased mitochondrial membrane potential in wild-type and SIRT3 knockdown HeLa cells (Figure 7G). The membrane potential of wild-type cells recovered within 10 minutes after CCCP removal. However, SIRT3 knockdown cells failed to recover membrane potential over the time course of the experiment (Figure 7H–J, Figure S7D).
Since His135 in ATP5O was critical for pH dependent binding with SIRT3, we tested whether H135E ATP5O would affect the mitochondrial membrane potential recovery rate. Indeed, transient knockdown of wildtype ATP5O with concomitant overexpression of RNAi-insensitive H135E ATP5O (Figure S7E) decreased membrane potential recovery rate compare to control cells that overexpressed wildtype ATP5O (Figures 7K, S7F). Next, we tested heterozygous H135E ATP5O HeLa cells generated by a Crispr/Cas9 approach, which also displayed pH-insensitive binding with SIRT3 (Figures 6K–M, S7G). These cells displayed intermediate phenotypes, including reduced membrane potential recovery rate (Figure 7L and S7G), and less deacetylation of OGDH following CCCP treatment or hypoxia-reperfusion conditions (Figure S7H and S7I). Taken together, these data demonstrate a fundamental role for SIRT3 and ATP5O in maintaining mitochondrial membrane potential homeostasis in response to cellular stress.
Discussion
This study utilizes proteomics to reveal a comprehensive analysis of interaction partners for mitochondrial sirtuins, and dissection of subnetwork architecture led us to identify a fundamental role for SIRT3 in membrane potential homeostasis. In total, 89 interacting proteins were identified, and extensive validation points to the robustness of the derived network. Moreover, through detailed analysis of selected interaction partners and their emergent networks, we provide an architectural framework for future analysis of the sirtuin network (Figure 3D, Figure 4).
A major finding from this work is that individual mitochondrial sirtuins display distinct interaction profiles, consistent with non-overlapping roles in mitochondrial biology. SIRT3 associated with the largest number of SIPs, while SIRT5 was found to associate with a limited set of proteins, with only 3 SIPs in common with SIRT3 and SIRT4. The most extensive overlap was observed between SIRT3 and SIRT4, which displayed 19 SIPs in common (Figure 3D), suggesting these sirtuins work in concert. For instance, SIRT3 and SIRT4 may function together to protect cells from stress and DNA damage (Jeong et al., 2013; Yang et al., 2007) potentially via common targets. Although we observed some overlap in binding partners, it is unlikely that association of SIRT4 with these common SIPs occurs via SIRT3, as many strong SIRT3 interacting proteins failed to bind SIRT4 (Figure 2A).
Are SIPs sirtuin substrates? While approximately 50% of the mitochondrial proteome is reported to be acetylated (Hornbeck et al., 2015), our SIRT3 network contains an enrichment in acetylated proteins, as >90% of the SIRT3 interactome is acetylated (Figure 2D). Indeed, several SIPs, including complex I, ATP synthase, fatty acid oxidation enzymes, pyruvate dehydrogenase and glutamate dehydrogenase were previously reported as SIRT3 substrates (Ahn et al., 2008; German and Haigis, 2015; Hallows et al., 2011; Hirschey et al., 2010; Lombard et al., 2007) (Figure S2A). Among candidate SIRT3 substrates identified in our network, we validated OGDH as a deacetylation target whose catalytic activity is regulated by its acetylation status (Figures S1B–D). Thus, further mining of the sirtuin interaction network may reveal additional direct substrates of these enzymes.
Within the sirtuin subnetworks, we identified several new connections of potential biological import. For instance, the RNA helicase, DDX28, binds the mitochondrial ribosome, and MRPL20 interacts with MTERFD1, which regulates initiation of transcription (Figure S3B, Figure S7C). Indeed, a recent study revealed that DDX28 is a component of RNA granules within the mitochondrial matrix critical for ribosomal biogenesis (Antonicka and Shoubridge, 2015). Hence, this network provides a roadmap for analysis of interacting modules, which may reveal mechanistic insights important for a deeper knowledge of mitochondrial biology.
To demonstrate the value of the network for biological discovery, we examined the interaction between SIRT3 and the ATP5O subunit of ATP synthase in detail. SIRT3 associated tightly with ATP5O in vitro, suggesting it is a direct binding partner. Unexpectedly, we found that reduced pH, as occurs upon loss of membrane potential, results in reduced association between SIRT3 and ATP synthase in vivo, and between SIRT3 and the ATP5O subunit in vitro. In contrast, the association between SIRT3 and several other SIPS, including other subunits of ATP synthase, was unaltered by pH, indicating a particularly important role for ATP5O in this regard. Our study did not address whether other subunits of ATP synthase bind directly to SIRT3 or through binding with ATP5O, but they do not interact as strongly as ATP5O (Figure 5C&D). SIRT3 dissociation correlates with removal of acetylation from a cohort of mitochondrial proteins, consistent with the idea that association of a pool of SIRT3 with ATP synthase serves to sequester SIRT3 from other matrix-localized substrates.
pH-dependent dissociation of SIRT3 from ATP synthase provides cells with a rapid means to reset mitochondrial acetylation in response to stress. Such a mechanism occurs on a much faster time scale than can be accomplished using solely transcriptional responses, and would allow cells a rapid means to regain mitochondrial homeostasis. This mechanism also provides a more efficient way for cells to handle depolarized mitochondria than relying upon mitophagy after transient injury. We hypothesize that upon stress, cells would first attempt to recover membrane potential, and if this fails, then induce mitophagy. This homeostatic mechanism may contribute to age-associated declines associated with SIRT3 and mitochondria, in diseases linked to mitochondrial homeostasis, such as Parkinson’s Disease (Henchcliffe and Beal, 2008), or in pathological states, like the recovery from hypoxia (Okada et al., 2013), also associated with low matrix pH. Indeed, reperfusion after hypoxia also weakened the binding between SIRT3 and ATP5O in primary cardiomyocytes (Figure S5F).
Previous studies have identified other relevant mitochondrial pH switches. In the inhibition of ATP synthase by ATPIF1, low matrix pH disrupts ATPIF1 oligomers and releases free active dimers, which bind to ATP synthase and prevent its rotation (Faccenda and Campanella, 2012). Further studies are necessary to understand how SIRT3 and ATP5O interact and how pH alters association. The identification of H135 in ATP5O as a critical residue in the low pH-dependent dissociation of SIRT3 suggests a mechanism involving protonation of the imidazole of H135 to expel SIRT3 from the complex. Moreover, SIRT3 also contains several histidine residues, including a catalytic H248, which would be sensitive to pH. However, in the range of our endpoint activity assays, SIRT3 retained activity (Figure 6E).
In sum, this study reveals a comprehensive mitochondrial sirtuin network, thereby uncovering the diversity and complexity of sirtuin functions within mitochondria. This knowledge provides a roadmap for future studies defining substrates for mitochondrial sirtuins and new areas of mitochondrial biology connected to sirtuin function. The interactome also yields new clues into mechanisms of intra-mitochondrial communication. Finally, studies of how these physical associations change with stress will reveal important mechanistic insight into how mitochondria, as stress-responsive organelles, maintain homeostasis under dynamic conditions.
CONTACT FOR REAGENT AND RESOURCE SHARING
Further information and requests for reagents may be directed to, and will be fulfilled by the corresponding author Marcia C. Haigis (Marcia_haigis@hms.harvard.edu), Department of Cell Biology, Harvard Medical School, Boston, MA, USA.
EXPERIMENTAL MODEL AND SUBJECT DETAILS
Mice
All animal experiments and care were performed according to protocols approved by the Institutional Animal Care and Use Committee (IACUC), the Standing Committee on Animals at Harvard. 129-Sirt3tm1.1Fwa/J were purchased from The Jackson Laboratory.
METHOD DETAILS
Immunoprecipitation and Mass Spectrometry
Immunoprecipitation and mass spectrometry were performed as previously described (Sowa et al., 2009). Briefly, cells from two 15 cm tissue culture dishes at ~80% confluence were lysed at 4°C in a total volume of 3 ml of lysis buffer (50 mM Tris-HCl, pH 7.5, 150 mM NaCl, 0.5% Nonidet P-40, Roche Complete EDTA-free protease inhibitor cocktail). Lysates were cleared using centrifugation (13,000 rpm, 10 min). The supernatant was filtered through spin filters to further remove cell debris, and the resulting material was subjected to immunoprecipitation with 60 μl of immobilized α-HA resin (50% slurry) overnight at 4°C with gentle inversion. After washing, the binding protein complex was eluted by HA peptide. Eluted samples were TCA-precipitated and resuspended in 30 μl of 100 mM ammonium bicarbonate at pH 8.0 with 10% acetonitrile and 500 ng sequencing-grade trypsin and incubated at 37°C for 4 hr. Digested samples were loaded onto stage tips and desalted as described previously (Rappsilber et al., 2007). Peptides were eluted with 50% acetonitrile, 5% formic acid, dried using a speed-vac apparatus, and resuspended in 10 μl of 5% acetonitrile, 5% formic acid. For each liquid chromatography (LC)-MS/MS run using an LTQ linear ion trap mass spectrometer (Thermo Fisher), 4 μl was loaded onto a C18 column (18 cm by 100 μm ID), and peptides were eluted using a 50-min 8 to 26% acetonitrile gradient. Spectra were acquired in a data-dependent fashion using a Top-10 method. Each sample was loaded twice in succession, followed by a wash with 70% acetonitrile, 30% isopropanol. The resulting MS/MS spectra were recorded for each run and then searched against a SEQUEST-based in-house tool against a target-decoy database of human tryptic peptides and with a linear discriminant based analysis based false discovery rate of 2% (Huttlin et al., 2010).
Acetylation Immunoprecipitation
HeLa cells were collected from 15 cm plates using a cell scraper on ice and lysed in NP-40 lysis buffer (50 mM Tris-HCl, pH 7.5, 150 mM NaCl, 1% Nonidet P-40) with addition of 20 mM nicotinamide, 4 μM TSA, and Roche Complete EDTA-free protease inhibitor cocktail, followed by 1 hr incubation at 4°C. Lysates were cleared using centrifugation (13,000 rpm, 10 min), and the supernatant was subjected to immunoprecipitation with α-AcK antibodies 4°C overnight. Immune complexes were incubated with α-rabbit IgG agarose (Bioscience) for 2 hr at 4°C, washed five times with NP-40 buffer, and eluted with SDS-PAGE loading dye. Resulting proteins were separated by SDS-PAGE and immunoblotted. For IPs from tissues, mouse tissue was washed 3 times with ice-cold PBS, and homogenized with 5 ml Teflon-glass homogenizer. Lysates were subjected to the IP procedure described for HeLa cells.
Live Cell Imaging
HeLa cells were cultured in 12 well glass bottom culture plates (MatTek P12G-1.5-14-F) at 1500 cells/well. Cells were induced with 500 ng/ml doxycycline for 48 hours. Before imaging, cells were stained with 100 nM Mitotracker Green (Invitrogen M7514) and 200 nM tetramethylrhodamine methyl ester (TMRM) in non-phenol Red DMEM media (8.3 g DMEM powder, 4.5 g glucose, 3.9 g HEPES, 1 g L-glutamine, 110 mg pyruvate, pH 7.5 with NaOH in 1L) for 30 min, washed 3 times and subjected to live cell imaging using a Nikon Ti Automated Inverted Microscope w/Perfect Focus and 37°C Incubation Chamber.
Immunofluorescence
Cells cultured on glass coverslips at 40–60% confluence were first stained by incubation with 50 nM Mitotracker Green in culture media for 20 min, washed and then stained by indirect immunofluorescence. In brief, cells were rinsed in PBS and fixed with 3.7% formaldehyde in PBS for 15 min at room temperature. Cells were permeabilized with PBS plus 0.2% Triton X-100 for 10 min and blocked for 1 h at 4°C, with PBS containing 5% normal goat serum. Cells were incubated with primary antibodies: mouse anti-HA (1:100) in PBS overnight at 4°C. After 3 washes with PBS, 5 min at room temperature, cells were incubated for 2 h with goat anti-mouse IgG conjugated to the fluorescent Alexa 633 dye (1:400) in PBS. After 3 washes, nuclei were detected with 1 μg/ml DAPI. After 3 washes in PBS and 1 wash with 75% ethanol, cells were mounted in ProLong Gold Antifade reagent for viewing with a confocal microscope (Nikon TE2000 w/C1 Point Scanning Confocal).
Crude mitochondrial isolation
Mitochondrial were isolated based on previously published methods with modifications (Frezza et al., 2007). Briefly, freshly isolated mouse tissues were homogenized in a 5 ml Teflon-glass homogenizer in mitochondrial isolation buffer (225 mM mannitol, 75 mM sucrose, 1 mM EGTA, 20 mM MOPS, 2 mM magnesium chloride, 50 mM potassium chloride, 0.5% BSA (w/w) pH 7.4). Lysates were centrifuged at 600 × g for 10 min. The resulting supernatant was centrifuged at 6000 × g for 15 min, and the pellet containing mitochondria was washed once with an equal volume of lysis buffer. Mitochondria were kept on ice and used immediately or aliquoted and frozen at −80 °C.
Sucrose Density Barrier (SDB) mitochondrial isolation
1–1.5 M SDB was created by layering 2 ml of 1M sucrose to the top of 2 ml of 1.5 M sucrose in an Ultra centrifuge tube. Fresh crude mitochondria (see above) was resuspended in 100 μl EDTA-TRIS buffer (1 mM EDTA, 10 mM Tris-Cl pH 7.5) and applied to the top of the 1–1.5 M SDB, and centrifuged at 60000 × g for 20 min at 4°C. Pure mitochondria were recovered from the interface between 1 and 1.5 M sucrose, diluted to 250 mM sucrose, and washed twice in mitochondrial isolation buffer (by centrifugation at 6000g).
OGDHC activity assay
The activity of OGDHC was assayed spectrophotometrically at 30°C by measuring the rate of increase of NADH absorbance at 340 nm as previous published (Lai and Cooper, 1986). Briefly, the assay mixture contained: 0.2 mM thiamine pyrophosphate, 0.5 mM magnesium chloride, 2 mM NAD, 0.1 mM EGTA, 0.1% (vol/vol) Triton X-100, 0.01 mM calcium chloride and 50 mM MOPs, pH 7.4. Additionally, 2 μM rotenone (to block the usage of NADH by NADH-ubiquinone dehydrogenase) and 8 mM diethyl malonate (to block the usage of succinate by succinate dehydrogenase) were added to the assay buffer before experiment. After 3 freeze-thaw cycles in liquid nitrogen and on ice, 5 μl of crude mitochondria was added to 1 ml assay buffer and monitored for NADH generation for 3 min to establish background reading. The reaction was initiated by the addition of 0.2 mM CoA and 10 mM α-ketoglutarate, and the initial rate was measured. Background controls included samples without α-ketoglutarate, or samples with α-ketoglutarate replaced by succinate (data not shown). Protein determination was carried out by the procedure of Lowry et al. with fatty acid-free bovine serum albumin as standard (LOWRY et al., 1951).
Immunoprecipitations
Plasmids containing C-terminal His-tagged SIRT4 or SIRT5 were transfected into HEK 293T cell stably overexpressing C-terminal HA tagged SIPs in 10 cm tissue culture dish. Cells were collected and lysed with 0.5% NP-40 lysis buffer at 4°C for 30 min. Lysates were cleared using centrifugation (13,000 rpm, 10 min), and the supernatant was subjected to immunoprecipitation with 20 μl of immobilized anti-HA (Sigma) resin (50% slurry) overnight at 4°C with gentle inversion, washed 5 times with lysis buffer, and eluted with SDS-PAGE loading dye. Resulting proteins were separated by SDS-PAGE and immunoblotted with rabbit anti-His antibody.
For endogenous immunoprecipitations, 1 μg of the indicated antibody was added to 1 mg of pre-cleared lysate and rocking gently at 4°C overnight. Immune-complexes were incubated with protein G affinity gel (Sigma E3403) for at 4°C for 2 h, washed once with 0.5% NP-40 lysis buffer, 3 times with high salt lysis buffer (300 mM NaCl), and twice with PBS. Proteins were then eluted, mixed with SDS-PAGE loading dye, and separated by SDS-PAGE for immunodetection with indicated antibodies.
Native gel electrophoresis
Isolated mitochondrial were disrupted in native lysis buffer (50 mM Tris.HCl, 150 mM NaCl, 1% digitonin pH 7.5). Samples were mixed with 4× sample buffer (62.5 mM Tris-HCL, pH 7.5 25% glycerol, 0.01% bromophenol blue) and separated by 3–8% native gel electrophoresis (Criterion™ XT Tris-Acetate Gel from Bio-Rad). For Western blotting, gels were soaked in 2% SDS and 1 mM DTT for 10 min before transferring in the presence of 0.05% SDS.
Cross-linking
Cells were harvested in culture media. Cross linker DTBP (Pierce #20665) was added to a final concentration of 5 mM. After rotating for 10 min, 125 mM (final concentration) of glycine was added to quench DTBP. Cells were collected by centrifugation, washed with PBS, followed by immunoprecipitation for SIRT3 (or ATP5O), as described above. Prior to SDS-PAGE, to reverse the cross-link, the disulfide bond of the crosslinking arm was reduced with 150 mM DTT.
Protein purification
Sequences encoding 118–399 of human SIRT3 or 46–213 of human ATP5O plus N-terminal hexahistidine (HIS) and Small Ubiquitin-like Modifier (SUMO) were cloned into a pET28a vector using NcoI and BamHI restriction enzymes. SIRT3 plasmid also possessed a C-terminal FLAG-tag. The proteins were expressed in Escherichia coli BL21(DE3) and lysed using protein lysis buffer (50 mM Tris.HCl, 500 mM NaCl, 0.2% Triton X-100, 10% glycerol, 1 mM PMSF, 5 mM DTT and proteinase inhibitor (cOmplete, EDTA-free Protease Inhibitor Cocktail Tablets from Roche)). Proteins were purified by affinity chromatography with HisPur Cobalt beads (Thermo scientific 89964) in 100 ml Econo-Column. Elution samples were further purified with size exclusive gel filtration. Fractions containing proteins of interest were pooled and digested by ULP1 at 4°C overnight. HIS-SUMO fragments were absorbed by HisPur Cobalt beads, and then purified by size exclusive gel filtration. Purified proteins were concentrated by Amicon Ultra-15 Centrifugal Filter (Millipore UFC9 010 24), Protein Stabilizing Cocktail (Thermo 89806) was added, and proteins were used immediately or aliquoted and stored at −80°C.
Thermal stability assay
1 μg of each protein was added to the wells of a microAMP Fast Optical 96 well plate (Applied Biosystems 4346906), containing 100 μl of assay buffer (50 mM Tris, 100 mM NaCl, pH 7.4), and 1X Thermal shift dye (ThermoFisher 4461146). Samples were heated at 0.05°C per second, from 4°C to 99°C, and the fluorescence intensity was measured every second using 470±15 nm excitation and 586±10 nm emission using QuantStudio 7 Flex System.
Binding Assays
Protein samples were diluted in Anti-FLAG biosensors (Pall Corporation Forte Bio 18-5110) and incubated in assay buffer (50 mM Tris, 100 mM NaCl, 0.01% NP-40 pH 7.4) for 10 min at room temperature. Purified, recombinant SIRT3-FLAG protein was diluted to 1 μM in assay buffer and loaded onto biosensors as the ligand. Increasing concentration of purified, recombinant ATP5O (16 nM-1 μM) were used as the analyte to detect binding with SIRT3 using the BLItz System (Forte Bio). All reactions were performed in triplicate.
SIRT3 in vitro activity assay
Activity assays were performed as described previously (Hubbard and Sinclair, 2013). Briefly, 100μL reactions containing 0.5 μg purified SIRT3, 100 μM acetylated peptide (APVLFN-K(Ac)-EMIESM, Peptide 2.0), 150 μM NAD+ and 1.3 μg recombinant 6XHis-yPnc1 were incubated at 37° for 1 h in 1 mM DTT/PBS reaction buffer at either pH 6, 7 or 8. Negative control reactions lacking SIRT3 enzyme and positive control reactions containing 1.3 μg recombinant 6XHis-yPnc1 and 150 μM nicotinamide were performed in parallel. 100 μl OPT Developer Solution (10 mM ortho-pthalaldehdye (Sigma Aldrich), 10 mM DTT, 30% ethanol, 70% PBS, pH 7.4) was subsequently added to the reactions and incubated at room temperature for 1 h on an orbital shaker, protected from light. Fluorescence was read on a Varian Cary Eclipse fluorimeter at 420ex/460em wavelengths. Data was normalized to readings for the yPnc1 control reactions at each pH. All reactions were performed in triplicate.
Quantitative mass spectrometry
As previously described, HEK293T cells stably overexpressing C-terminal HA tagged SIRT3 were lysed and immunoprecipitated in either pH 6.0 or pH 7.5 lysis buffer. Resin containing immune complexes was washed and eluted in pH 6.0 and pH 7.5 PBS buffer. Protein samples were precipitated and desalted using stage tips. After eluted from stage tips using pH 8.5 50 mM HEPES, proteins were digested overnight with Lys-C and trypsin. Following digestion, samples from each pH condition were aliquoted to 20 μl/tube (3 tubes). The TMT reagents were dissolved in 40 μL of dry acetonitrile (ACN), and 2 μL of the solution was added to each tube. After incubating for 1 h at room temperature (22 °C), the reaction was quenched by adding 3 μL of 5% w/v hydroxylamine. 6 differentially labeled samples (3 from each pH condition) were subsequently desalted by C18 StageTips (3M Empore).
LC-MS/MS experiments were performed on an LTQ Orbitrap-Velos Elite (Thermo Fisher) equipped with Agilent 1200 binary HPLC pump (Agilent Technologies) and a Famos auto sampler (LC Packings). Peptides were separated onto an 100 μm I.D. microcapillary column, packed first with ~1 cm of Magic C4 resin (5 μm, 100 Å, Michrom Bioresources) followed by ~25 cm of Maccel C18AQ resin (3 μm, 200 Å, Nest Group). Peptide were separated by applying a gradient from 10 to 30% ACN in 0.5% FA over 180 min at ~250 nL/min. Electrospray ionization was enabled through applying a voltage of 1.85 kV using an inert gold electrode.
The mass spectrometer was operated in data-dependent mode for both MS2 and MS3 scans. For the MS2 scans, the survey scan was performed in the Orbitrap in the range of 400–1400 m/z at a 3×10⁴ resolution followed by the selection of the ten most intense ions (TOP 10) for HCD-MS2 fragmentation using a precursor isolation width window of 2 m/z. The AGC settings were 3 × 10⁶ and 2.5 × 10⁵ ions for survey and MS2 scans, respectively. Ions were selected for MS2 when their intensity reached a threshold of 500 counts and an isotopic envelope was assigned. Maximum ion accumulation times were set to 1000 ms for survey MS scans and to 200 ms for MS2 scans. The normalized collision energy for HCD-MS2 experiments was set to 45% at a 30 ms activation time. Singly charged ion species were not subjected to MS2. Ions within a 10 ppm m/z window around ions selected for MS2 were excluded from further selection for fragmentation for 90 seconds.
The survey MS scan settings were identical for the MS3 method, where the ten most intense ions were first isolated for ion trap CID-MS2 at a precursor ion isolation width of 2 m/z, using an AGC setting of 2 × 10³, a maximum ion accumulation time of 150 ms, and wide band activation. Directly following each MS2 event, 6–10 of most intense fragment ion in an m/z range between 110–160% of the precursor m/z was selected for HCD-MS3. The fragment ion isolation width was set to 4 m/z, AGC was set to 20,000, the maximum ion time was 250ms, normalized collision energy was set to 60% and an activation time of 50ms for each MS3 scan.
In vivo mitochondrial pH measurement
Mitochondrial pH in live-cell was detected by using ratiometric pH sensor, SypHer-mito Imaging of mitochondrial pH was performed based on the method described in the original report with some modifications(Poburko et al., 2011). HeLa cells transfected SypHer-mito were grown on No. 1.5 glass coverslips and mounted in a stage-top incubation system (Tokai Hit) warmed to 37°C. Hanks’ balanced salt solution (HBSS, 21-023-CV, Corning) was used during image acquisition using live-cell pH measurement. All images were collected with a Nikon Ti inverted microscope equipped with 60× Plan Apo NA 1.4 objective lens and the Perfect Focus System for continuous maintenance of focus. For pH imaging, pairs of fluorescence images were obtained using SypHer-mito. For detecting pH-sensitive fluorescence change, SypHer-mito was excited at 480nm (selected with a HQ480/40× filter, Chroma) and collected with a long-pass dichroic mirror (Q505lp, Chroma), and a 535/50 emission filter (ET535/50m, Chroma). For detecting internal standard fluorescence, SypHer-mito was excited at 430nm (selected with an ET430/24× filter, Chroma) and collected with a dual band pass dichroic mirror (69008bs, Chroma), and a 535/30 emission filter (ET535/30m, Chroma). Images were acquired with a Hamamatsu ORCA-R2 cooled CCD camera controlled with MetaMorph 7 software. For timelapse experiments, pairs of images were collected every 1 min, using an exposure time of 500 ms with illumination light shuttered between acquisitions. Cells were preincubated in HBSS for 30 min. After that, images for basal pH measurements were acquired for 10 min, then cells were treated with 0.5 μM CCCP and traced the pH change for 15 min. Fluorescence ratios (F480/F430) were calculated in ImageJ 1.49 (NIH) and analyzed in Excel (Microsoft) and GraphPad Prism 6 (GraphPad). After each experiment, mitochondrial pH was calibrated using nigericin (5 μg/mL) and monensin (5 μM) in 125 mM KCl, 20 mM NaCl, 0.5 mM MgCl2, 0.2 mM EGTA, and 50 mM HEPES (pH 8.0), PIPES (pH 6.5 – 7.5), and MES (pH 6.0). Absolute pH value was calculated by fitting to the calibration curve.
Isolation of Cardiomyocytes from Adult Mice
For isolating cardiomyocytes from adult mice, 8–12-week-old SirT3 WT and SirT3 KO mice (C57BL/6J background) were used. Cardiomyocyte isolation was performed as described (O’Connell et al., 2007) with minor modification. Briefly, mice were lightly anesthetized with isoflurane, heparinized (50 units, i.p.), anesthetized deeply with isoflurane followed by euthanasia. The heart was quickly dissected from the chest cavity and retrogradely perfused with the cardiac perfusion solution without calcium through the cannula inserted into the aorta. Enzymatic digestion of the heart was performed by adding the myocyte digestion buffer containing collagenase type 2 (Worthington Biochemical) in the cardiac perfusion solution, and then the heart tissue was minced and the cells were dispersed by gentle pipetting. Calcium was reintroduced into isolated cardiomyocytes by stepwise increase of CaCl2 concentration up to 1.2 mM with plating media [minimum essential medium with Hank’s balanced salt solution, supplemented with fetal bovine serum (10% vol/vol), 2,3-butanedione monoxime (10 mM), penicillin-streptomycin (100 units/mL), glutamine (2 mM), and ATP (2 mM).], and then counted the rod-shaped cardiomyocytes for following experiments.
Cell Culture and Hypoxia-Reoxygenation Treatment
Cardiac myocytes were plated onto laminin-coated 10 cm culture dishes (400,000–500,000 rod-shaped cardiomyocytes per dish) in plating media. After incubating the cells under 21% O2 and 2% CO2 condition for more than 1 h until rod-shaped cells were attached, the plating medium was changed to culture medium [minimum essential medium with Hank’s balanced salt solution, supplemented with (S)-(−)-blebbistatin (25 μM, Toronto Research Chemicals), insulin-transferrin-sodium selenite media supplement (10 μg/mL, 5.5 μg/mL, and 5 ng/mL, respectively), fatty-acid free bovine serum albumin (1 mg/mL, Millipore), penicillin-streptomycin (100 units/mL), and glutamine (2 mM)], and the cells were cultured for 1–2 h or overnight under 21% O2 and 2% CO2 condition. For hypoxia-reoxygenation treatment, cardiomyocytes were treated with 10 mM 2-deoxyglucose followed by incubating under 1% O2 and 2% CO2 condition for 6 h using the multi-gas incubator. After the hypoxia period, culture media was changed to the fresh one without 2-deoxyglucose, and incubate cells under 1% O2 and 2% CO2 condition for reoxygenation. After the reoxygenation period, cells were collected for further analyses.
Proximity Ligation Assay
The interaction between SIRT3 and ATP5O was detected in situ using the Duolink II secondary antibodies and detection kit (Sigma catalog. 92101). HeLa cells were transiently transfected with SIRT3-HA constructs, and grown on glass coverslides to 60% confluence. After fixation, slides were incubated for 10 minutes at 95°C in antigen retrieval buffer (100mM Tris, 5% urea, pH 9.5). Slides were then blocked for 4 h at 4°C, with PBS containing 5% normal goat serum. ATP5O (Abcam ab110276) and HA (3724) primary antibodies were mixed (diluted 1: 100 in blocking buffer) and incubated in a humidity chamber overnight at 4°C. Slides were further blocked at 37°C in Duolink blocking buffer for 1 h in humidity chamber. Slides were washed in Duolink Wash Buffer A twice at room temperature. PLA PLUS Anti-mouse and PLA MINUS Anti-rabbit probes were then incubated with slides in a preheated humidity chamber for 1 h at 37°C. After washed in Wash Buffer A twice for 5 min slides were incubated with Duolink Ligation Stock, for 30 min at 37°C. After that slides were washed in Wash Buffer A and incubated with Duolink Polymerase in Duolink Amplification Stock for 100 min at 37°C. Anti-Mitochondria Antibody, clone 113-1 & Alexa Fluor® 488 conjugate was applied for 30 minutes and followed by two washes with PBS. After two washes with Wash Buffer B slides were then mounted with Duolink Mounting Medium with DAPI.
Fatty acid oxidation (FAO)
For FAO assays, cells in 6 well-plates were treated with small molecules as indicated. Pulsing was performed in basal growth medium containing 1 mM carnitine with 0.75 μCi [9,10(n)-3H]palmitic acid (Perkin Elmer) for 30 min. The medium was collected and eluted in columns packed with DOWEX 1×2–400 ion exchange resin (Sigma) to analyze the released 3H2O. 3H2O was measured in counts per minute (CPM) and normalized to total cellular protein using BCA Protein Assay Kit (Thermo Scientific). CCCP was used to cause acidification of matrix while rotenone and Antimycine A were used to block electron transport to prevent depletion of NADH.
QUANTIFICATION AND STATISTICAL ANALYSIS
Sirtuin specific binding protein analysis
Specific high confident sirtuin binding partners were identified by determining the 95% confident interval (C.I.) using Clopper-Pearson method (Table S1). We calculated the C.I. from sirtuin IPs (n=6–9 for each sirtuin) compared to a negative control dataset from 171 control IPs (deubiquitinating enzymes [Dubs] and proteins from the Autophagy Interaction Network https://harper.hms.harvard.edu/). For each candidate sirtuin interacting protein the following parameters were defined and measured: sirtuin IP – the number of sirtuin IP-MS experiments in which a peptide from the candidate protein was identified; total number of sirtuin IPs – the number of all sirtuin IP-MS experiments (SIRT3 n=9, SIRT4 n=7, SIRT5 n=6); control IP – the number of control IP-MS experiments in which a candidate interacting protein was identified; total number of control IPs – the number of all control IP-MS experiments (n=171). Based on these parameters, 95% confident interval (C.I.) was calculated using Clopper-Pearson, Wilson score and adjusted Wade (Table S1). C.I. analysis used the lower limit of sirtuin IPs to compare to the upper limit of control IP. If the 95% CI did not overlap then the candidate protein was considered to be a sirtuin interacting protein. The same set of data was also subjected to a two proportions (TP) test and a continuous corrected two proportions (CTP) test. Candidate proteins with a p-value of less than 0.01 (for both tests) were considered specific sirtuin binding proteins (Supplementary Table S1. C.I. analysis using Clopper-Pearson method is the most rigorous C.I. analysis, and also generated a SIP list very similar to the continuous corrected two proportions test (Supplementary Table S1). Thus, C.I. analysis using Clopper-Pearson method was used to generate the sirtuin specific binding protein list for this study. Heat maps were built with Multiple Experiment Viewer (MEV, http://mev-tm4.sourceforge.net) software platform.
CompPASS Analysis
Mass spectral data were processed using CompPASS, as previously described, with modifications (Sowa et al., 2009). SEQUEST searches were processed into a high-threshold data set on the basis of a 2% protein false-positive rate as described earlier. Processed data sets were merged for each duplicate run and used to populate a Statistical Table consisting of approximately 200 unrelated proteins (deubiquitinating enzymes [Dubs], proteins from the Autophagy Interaction Network, and unrelated mitochondrial proteins; see Table S8) [https://harper.hms.harvard.edu/]). The normalized D scores (ND) were calculated from average assembled peptide spectral matches (APSMs) for each protein found in association with each bait. Proteins identified in each LC-MS/MS experiment with a ND score of ⩾.8 and z score >9 were considered to be high-confidence candidate interaction proteins (HCIPs).
Network Construction and Analysis
Output files from CompPASS for network analysis are compatible with the Cytoscape software platform (http://www.cytoscape.org). Before import into Cytoscape, mitochondrial data was selected based on Mitocarta (Pagliarini et al., 2008) and non-mitochondrial proteins and interactions were omitted from the network. Additional files containing both node and edge attributes were generated. Attribute files were used in Cytoscape to assign values for nodes and edges, as indicated.
Data processing, spectra assignment and filtering for quantitative mass spectrometry
A compendium of in-house developed software tools was used to convert mass spectrometric data from the RAW file to the mzxml format and to correct erroneous assignments of peptide ion charge state and monoisotopic m/z. The Sequest algorithm was used to assign MS/MS spectra by searching the data against a protein sequence database including Human Uniprot Database (download date June, 2014) and known contaminants such as porcine trypsin. This forward (target) database component was followed by a decoy component including all listed protein sequences. Searches were performed using a 20 ppm precursor ion tolerance and requiring both peptide termini to be consistent with trypsin specificity, while allowing up to two missed cleavages. Six-plex TMT tags on lysine residues and peptide N termini (+ 229.16293 Da) were set as static modifications and oxidation of methionine residues (+ 15.99492 Da) as variable modification. An MS2 spectra assignment false discovery rate (FDR) of less than 1% was achieved by applying the target-decoy database search strategy (Elias and Gygi, 2007). Filtering was performed using a linear discrimination analysis method to create one combined filter parameter from the following peptide ion and MS2 spectra properties: Sequest parameters XCorr and ΔCn, peptide ion mass accuracy, and peptide length. Linear discrimination scores were used to assign probabilities to each MS2 spectrum for being assigned correctly and these probabilities were further used to filter the dataset with an MS2 spectra assignment FDR to obtain a protein identification FDR of smaller than 1 % (Huttlin et al., 2010).
For quantification, a 0.03 m/z window centered on the theoretical m/z value of each reporter ion was monitored for ions, and the maximum intensity of the signal to the theoretical m/z value was recorded. Reporter ion intensities were de-normalized by multiplication with the ion accumulation time for each MS2 or MS3 spectrum and adjusted based on the overlap of isotopic envelopes of all reporter ions. Following reporter ion signal extraction, the isotopic impurities of the TMT reagent were corrected using the values specified by the manufacturer. Total signal to noise values for all peptides were summed for each TMT channel, and all values were adjusted to account for variance in sample handling. For each peptide, a total minimum signal to noise value of 100 was required.
DATA AND SOFTWARE AVAILABILITY
Mass spec data of SIRT3-5 using HEK293T cell: Table S1.
Mass spec data of SIRT3-5 using HEK293T cell after crosslinking using DTBP treatment: Table S2.
Mass spec data of SIRT3-5 using HCT116 cell: Table S3.
Mass spec data of SIRT3-5 using isolated mitochondria from HEK293T cell: Table S4.
SIPs that has been identified across all IP-mass spec conditions and gene annotation: Table S5.
Summary of IP western validation of SIPs: Table S6.
List of IP/mass spec data (name of the bait genes) used to generate state table for each category of genes: Table S7.
Mitochondrial sirtuin network: https://haigis.hms.harvard.edu/mitochondrial-sirtuin-network
Supplementary Material
Highlights.
Comprehensive mitochondrial sirtuin interactome elucidates sirtuin binding partners
Mitochondrial sirtuin network identifies SIRT3-ATP synthase association
SIRT3 binds ATP5O in a stress and pH sensitive manner
SIRT3 links fuel utilization with membrane potential homeostasis
Acknowledgments
W.Y. was supported by a Charles A. King Trust postdoctoral fellowship. M.C.H. was supported by funding from NIH R01 DK103295, Takeda Pharmaceuticals Company Limited, and the Glenn Foundation for Medical Research. S.P.G. and J.W.H. were supported by NIH grants U41HG006673. J.W.H. was supported by NIH grant R37 NS083524. C.M. was supported by a postdoctoral fellowship from the European Molecular Biology Organization. M.C.H. and J.W.H. are SAB members of Takeda Oncology. Microscopy was performed in the Nikon Imaging Center at Harvard Medical School. Kelly Arnett from the Center for Macromolecular Interactions provided advice on protein purification. Kevin Haigis, Natalie German and Lydia Finley provided helpful suggestions on the manuscript.
Author Contributions
W.Y. designed experiments, performed the research, analyzed data, and wrote the manuscript. V.G.P., S.D.H. and C.M. performed mass spectrometry experiments. S.J. and Y.X. assisted with cloning and immunoprecipitation. Y.X. also assisted with PLA assay and Crispr cloning. K.N. & K.S. assisted with IP-Western blotting validation. K.N. also performed pH measurements. S.V. performed in vitro deacetylation assay. E.Z performed FAO assay. A.R. helped analyze the data. M.P.J. and S.G. assisted with quantitative mass spectrometry. J.W.H. assisted with experimental design, data analysis and writing the manuscript. M.C.H. conceived and designed the experiments, analyzed data, and wrote the manuscript.
KEY RESOURCES TABLE
| REAGENT or RESOURCE | SOURCE | IDENTIFIER |
|---|---|---|
| Antibodies | ||
| HA-probe antibody | Santa Cruz Biotechnology | SC-7392 |
| SIRT3 antibody | Cell Signaling | CS2627 |
| OGDH antibody | Abcam | ab87057 |
| ATP5O antibody | Abcam | Ab110276 |
| Anti-mitochondria clone 113-1 | EMD Millipore | MAB1273A4 |
| Anti-FLAG Tag antibody | Acam | Ab124462 |
| Anti-acetyl-lysine antibody | Immunechem | ICP0380 |
| Anti-His antibody | Genscript | A00174 |
| GLUD1 Rabbit Polyclonal antibody | Proteintech | 14299-1-AP |
| HADHA Rabbit Polyclonal antibody | Proteintech | 10758-1-AP |
| UQCRC2 Rabbit Polyclonal antibody | Proteintech | 14742-1-AP |
| Chemicals, Peptides, and Recombinant Proteins | ||
| Dulbecco Modified Eagle Medium | Life Technologies | 11995-065 |
| penicillin-streptomycin | Life Technologies | 15140-122 |
| L-glutamine | Life Technologies | 25030-081 |
| Fetal bovine serum | HyClone | 89133-098 |
| Tet System Approved FBS | Clontech | 631106 |
| Puromycin | InvivoGen | ant-pr-1 |
| Doxycycline hyclate | Sigma | D9891 |
| Monoclonal anti-HA-agarose | Sigma | A2095 |
| Influenza hemagglutinin (HA) peptide | Sigma | I2149 |
| Centrifugal Filters | Millipore | UFC40HV00 |
| Sequencing-grade trypsin | Promega | V5113 |
| Dimethyl 3,3′-dithiobispropionimidate•2 HCl | Pierce | 20665 |
| Mitotracker Green | Invitrogen | M7514 |
| Alexa 633 Goat anti-mouse IgG | Invitrogen | A21050 |
| Prolong Gold Antifade | Invitrogen | P36934 |
| DAPI | Sigma | D9564 |
| Normal Goat Serum | Jackson Immunoresearch | 005-000-121 |
| APVLFN-K(Ac)-EMIESM | Peptide 2.0 | N/A |
| 6XHis-yPnc1 | (Hubbard and Sinclair, 2013) | N/A |
| tetramethylrhodamine methyl ester | Life Technologies | T668 |
| EZview™ Red Protein G Affinity Gel | Sigma | E3403 |
| Palmitic Acid, [9,10-3H(N)]-, 1mCi (37MBq) | Perkin Elmer | NET043001MC |
| Critical Commercial Assays | ||
| bacteriophage lambda (BP) recombinase | Invitrogen | 11789-020 |
| LR recombinase | Invitrogen | 11791-020 |
| Thermal shift dye | Thermofisher | 4461146 |
| Anti-FLAG biosensors | Pall Corporation Forte Bio | 18-5110 |
| 3M Empore™ SPE Extraction Disks | Sigma | 66883 |
| Cas9 Nickase mRNA | TriLink | L-6116 |
| Duolink II secondary antibodies and detection kit | Sigma | 92101 |
| DOWEX 1×2-400 ion exchange resin | Sigma | 217395 |
| Deposited Data | ||
| Raw and analyzed data | This paper | |
| Experimental Models: Cell Lines | ||
| HEK293T | ATCC | CRL-11268 |
| HCT116 | ATCC | CCL-247 |
| HeLa | ATCC | CCL-2 |
| Primary cardiomyocytes | This paper | N/A |
| Experimental Models: Organisms/Strains | ||
| 129-Sirt3tm1.1Fwa/J | Jackson laboratory | 012755 |
| Recombinant DNA | ||
| SypHer mt | Addgene | 48251 |
| Tet-pLKO-puro | Addgene | 21915 |
| pPHAGE-CMV-C-FLAG-HA-PURO | Wade | N/A |
| pcDNA-DEST 40 | Thermofisher | 12274015 |
| Sequence-Based Reagents | ||
| scramble shRNA and siRNA: TGGAGTGACTGAATTCTGTAC | IDT | N/A |
| hSIRT3 shRNA1: CCCAACGTCACTCACTACTTT | IDT | N/A |
| hATP5O siRNA: AATACCCAAGGAGTCGTTTCT | IDT | N/A |
| Sequencing primer: 5′-AAGGTGACACATGTAATATCAAGG-3′ | IDT | N/A |
| ATP5O 1st gsRNA-GATGAGTGTCCATCGCGGAGAGG | IDT | N/A |
| ATP5O 2nd gsRNA-AAAAGGCAGAAACGACTCCTTGG | IDT | N/A |
| ssODN:ttactgagacaccttcactctggcagATTTGCTTGCTGAAAATGGTCGA TTAAGCAATACACAGGGCGTGGTGTCCGCTTTCTCCACTATGATG AGCGTGGAGCGAGGCGAAGTGCCTTGCACAGTGACCTCTGCATC Tgtaagtaacgggttgttgctgctgtgtttgccttga |
IDT | N/A |
| ATP5O Genotyping primer forward: CTGAGACACCTTCACTCTGGC | IDT | N/A |
| ATP5O Genotyping primer reverse:CCAGGTGACAAGTTACCTTTCC | IDT | N/A |
| Software and Algorithms | ||
| CompPASS | (Sowa et al., 2009) | http://besra.hms.harvard.edu/ipmsmsdbs/cgi-bin/tutorial.cgi |
| Cytoscape | (Shannon et al., 2003) | http://www.cytoscape.org/ |
| MeV | (Eisen et al., 1998) | http://www.tm4.org/mev.html |
| ClusterOne | (Nepusz et al., 2012) | http://www.paccanarolab.org/clusterone/ |
| Other | ||
| N/A | ||
Footnotes
Publisher's Disclaimer: This is a PDF file of an unedited manuscript that has been accepted for publication. As a service to our customers we are providing this early version of the manuscript. The manuscript will undergo copyediting, typesetting, and review of the resulting proof before it is published in its final citable form. Please note that during the production process errors may be discovered which could affect the content, and all legal disclaimers that apply to the journal pertain.
Reference List
- Ahn BH, Kim HS, Song S, Lee IH, Liu J, Vassilopoulos A, Deng CX, Finkel T. A role for the mitochondrial deacetylase Sirt3 in regulating energy homeostasis. Proc Natl Acad Sci U S A. 2008;105:14447–14452. doi: 10.1073/pnas.0803790105. [DOI] [PMC free article] [PubMed] [Google Scholar]
- Antonicka H, Shoubridge EA. Mitochondrial RNA Granules Are Centers for Posttranscriptional RNA Processing and Ribosome Biogenesis. Cell Rep. 2015;10:920–932. doi: 10.1016/j.celrep.2015.01.030. [DOI] [PubMed] [Google Scholar]
- Antoniel M, Giorgio V, Fogolari F, Glick GD, Bernardi P, Lippe G. The oligomycin-sensitivity conferring protein of mitochondrial ATP synthase: emerging new roles in mitochondrial pathophysiology. Int J Mol Sci. 2014;15:7513–7536. doi: 10.3390/ijms15057513. [DOI] [PMC free article] [PubMed] [Google Scholar]
- Csibi A, Fendt SM, Li C, Poulogiannis G, Choo AY, Chapski DJ, Jeong SM, Dempsey JM, Parkhitko A, Morrison T, et al. The mTORC1 pathway stimulates glutamine metabolism and cell proliferation by repressing SIRT4. Cell. 2013;153:840–854. doi: 10.1016/j.cell.2013.04.023. [DOI] [PMC free article] [PubMed] [Google Scholar]
- Eisen MB, Spellman PT, Brown PO, Botstein D. Cluster analysis and display of genome-wide expression patterns. Proc Natl Acad Sci U S A. 1998;95:14863–14868. doi: 10.1073/pnas.95.25.14863. [DOI] [PMC free article] [PubMed] [Google Scholar]
- Elias JE, Gygi SP. Target-decoy search strategy for increased confidence in large-scale protein identifications by mass spectrometry. Nat Methods. 2007;4:207–214. doi: 10.1038/nmeth1019. [DOI] [PubMed] [Google Scholar]
- Faccenda D, Campanella M. Molecular Regulation of the Mitochondrial F(1)F(o)-ATPsynthase: Physiological and Pathological Significance of the Inhibitory Factor 1 (IF(1)) Int J Cell Biol. 2012;2012:367934. doi: 10.1155/2012/367934. [DOI] [PMC free article] [PubMed] [Google Scholar]
- Frezza C, Cipolat S, Scorrano L. Organelle isolation: functional mitochondria from mouse liver, muscle and cultured fibroblasts. Nat Protoc. 2007;2:287–295. doi: 10.1038/nprot.2006.478. [DOI] [PubMed] [Google Scholar]
- German NJ, Haigis MC. Sirtuins and the Metabolic Hurdles in Cancer. Curr Biol. 2015;25:R569–583. doi: 10.1016/j.cub.2015.05.012. [DOI] [PMC free article] [PubMed] [Google Scholar]
- Haigis MC, Mostoslavsky R, Haigis KM, Fahie K, Christodoulou DC, Murphy AJ, Valenzuela DM, Yancopoulos GD, Karow M, Blander G, et al. SIRT4 inhibits glutamate dehydrogenase and opposes the effects of calorie restriction in pancreatic beta cells. Cell. 2006;126:941–954. doi: 10.1016/j.cell.2006.06.057. [DOI] [PubMed] [Google Scholar]
- Hallows WC, Yu W, Smith BC, Devries MK, Ellinger JJ, Someya S, Shortreed MR, Prolla T, Markley JL, Smith LM, et al. Sirt3 promotes the urea cycle and fatty acid oxidation during dietary restriction. Mol Cell. 2011;41:139–149. doi: 10.1016/j.molcel.2011.01.002. [DOI] [PMC free article] [PubMed] [Google Scholar]
- Hebert AS, Dittenhafer-Reed KE, Yu W, Bailey DJ, Selen ES, Boersma MD, Carson JJ, Tonelli M, Balloon AJ, Higbee AJ, et al. Calorie restriction and SIRT3 trigger global reprogramming of the mitochondrial protein acetylome. Mol Cell. 2013;49:186–199. doi: 10.1016/j.molcel.2012.10.024. [DOI] [PMC free article] [PubMed] [Google Scholar]
- Henchcliffe C, Beal MF. Mitochondrial biology and oxidative stress in Parkinson disease pathogenesis. Nat Clin Pract Neurol. 2008;4:600–609. doi: 10.1038/ncpneuro0924. [DOI] [PubMed] [Google Scholar]
- Hirschey MD, Shimazu T, Goetzman E, Jing E, Schwer B, Lombard DB, Grueter CA, Harris C, Biddinger S, Ilkayeva OR, et al. SIRT3 regulates mitochondrial fatty-acid oxidation by reversible enzyme deacetylation. Nature. 2010;464:121–125. doi: 10.1038/nature08778. [DOI] [PMC free article] [PubMed] [Google Scholar]
- Hornbeck PV, Zhang B, Murray B, Kornhauser JM, Latham V, Skrzypek E. PhosphoSitePlus, 2014: mutations, PTMs and recalibrations. Nucleic Acids Res. 2015;43:D512–D520. doi: 10.1093/nar/gku1267. [DOI] [PMC free article] [PubMed] [Google Scholar]
- Hubbard BP, Sinclair DA. Measurement of sirtuin enzyme activity using a substrate-agnostic fluorometric nicotinamide assay. Methods Mol Biol. 2013;1077:167–177. doi: 10.1007/978-1-62703-637-5_11. [DOI] [PMC free article] [PubMed] [Google Scholar]
- Huttlin EL, Jedrychowski MP, Elias JE, Goswami T, Rad R, Beausoleil SA, Villen J, Haas W, Sowa ME, Gygi SP. A tissue-specific atlas of mouse protein phosphorylation and expression. Cell. 2010;143:1174–1189. doi: 10.1016/j.cell.2010.12.001. [DOI] [PMC free article] [PubMed] [Google Scholar]
- Jeong SM, Xiao C, Finley LW, Lahusen T, Souza AL, Pierce K, Li YH, Wang X, Laurent G, German NJ, et al. SIRT4 has tumor-suppressive activity and regulates the cellular metabolic response to DNA damage by inhibiting mitochondrial glutamine metabolism. Cancer Cell. 2013;23:450–463. doi: 10.1016/j.ccr.2013.02.024. [DOI] [PMC free article] [PubMed] [Google Scholar]
- Kim SC, Sprung R, Chen Y, Xu Y, Ball H, Pei J, Cheng T, Kho Y, Xiao H, Xiao L, et al. Substrate and functional diversity of lysine acetylation revealed by a proteomics survey. Mol Cell. 2006;23:607–618. doi: 10.1016/j.molcel.2006.06.026. [DOI] [PubMed] [Google Scholar]
- Kumar S, Lombard DB. Mitochondrial sirtuins and their relationships with metabolic disease and cancer. Antioxid Redox Signal. 2015;22:1060–1077. doi: 10.1089/ars.2014.6213. [DOI] [PMC free article] [PubMed] [Google Scholar]
- Lai JC, Cooper AJ. Brain alpha-ketoglutarate dehydrogenase complex: kinetic properties, regional distribution, and effects of inhibitors. J Neurochem. 1986;47:1376–1386. doi: 10.1111/j.1471-4159.1986.tb00768.x. [DOI] [PubMed] [Google Scholar]
- Laurent G, German NJ, Saha AK, de Boer VC, Davies M, Koves TR, Dephoure N, Fischer F, Boanca G, Vaitheesvaran B, et al. SIRT4 coordinates the balance between lipid synthesis and catabolism by repressing malonyl CoA decarboxylase. Mol Cell. 2013;50:686–698. doi: 10.1016/j.molcel.2013.05.012. [DOI] [PMC free article] [PubMed] [Google Scholar]
- Llopis J, McCaffery JM, Miyawaki A, Farquhar MG, Tsien RY. Measurement of cytosolic, mitochondrial, and Golgi pH in single living cells with green fluorescent proteins. Proc Natl Acad Sci U S A. 1998;95:6803–6808. doi: 10.1073/pnas.95.12.6803. [DOI] [PMC free article] [PubMed] [Google Scholar]
- Lombard DB, Alt FW, Cheng HL, Bunkenborg J, Streeper RS, Mostoslavsky R, Kim J, Yancopoulos G, Valenzuela D, Murphy A, et al. Mammalian Sir2 homolog SIRT3 regulates global mitochondrial lysine acetylation. Mol Cell Biol. 2007;27:8807–8814. doi: 10.1128/MCB.01636-07. [DOI] [PMC free article] [PubMed] [Google Scholar]
- LOWRY OH, ROSEBROUGH NJ, FARR AL, RANDALL RJ. Protein measurement with the Folin phenol reagent. J Biol Chem. 1951;193:265–275. [PubMed] [Google Scholar]
- Mathias RA, Greco TM, Oberstein A, Budayeva HG, Chakrabarti R, Rowland EA, Kang Y, Shenk T, Cristea IM. Sirtuin 4 is a lipoamidase regulating pyruvate dehydrogenase complex activity. Cell. 2014;159:1615–1625. doi: 10.1016/j.cell.2014.11.046. [DOI] [PMC free article] [PubMed] [Google Scholar]
- Nepusz T, Yu H, Paccanaro A. Detecting overlapping protein complexes in protein-protein interaction networks. Nat Methods. 2012;9:471–472. doi: 10.1038/nmeth.1938. [DOI] [PMC free article] [PubMed] [Google Scholar]
- O’Connell TD, Rodrigo MC, Simpson PC. Isolation and culture of adult mouse cardiac myocytes. Methods Mol Biol. 2007;357:271–296. doi: 10.1385/1-59745-214-9:271. [DOI] [PubMed] [Google Scholar]
- Okada H, Lai NC, Kawaraguchi Y, Liao P, Copps J, Sugano Y, Okada-Maeda S, Banerjee I, Schilling JM, Gingras AR, et al. Integrins protect cardiomyocytes from ischemia/reperfusion injury. J Clin Invest. 2013;123:4294–4308. doi: 10.1172/JCI64216. [DOI] [PMC free article] [PubMed] [Google Scholar]
- Pagliarini DJ, Calvo SE, Chang B, Sheth SA, Vafai SB, Ong SE, Walford GA, Sugiana C, Boneh A, Chen WK, et al. A mitochondrial protein compendium elucidates complex I disease biology. Cell. 2008;134:112–123. doi: 10.1016/j.cell.2008.06.016. [DOI] [PMC free article] [PubMed] [Google Scholar]
- Park J, Chen Y, Tishkoff DX, Peng C, Tan M, Dai L, Xie Z, Zhang Y, Zwaans BM, Skinner ME, et al. SIRT5-mediated lysine desuccinylation impacts diverse metabolic pathways. Mol Cell. 2013;50:919–930. doi: 10.1016/j.molcel.2013.06.001. [DOI] [PMC free article] [PubMed] [Google Scholar]
- Poburko D, Santo-Domingo J, Demaurex N. Dynamic regulation of the mitochondrial proton gradient during cytosolic calcium elevations. J Biol Chem. 2011;286:11672–11684. doi: 10.1074/jbc.M110.159962. [DOI] [PMC free article] [PubMed] [Google Scholar]
- Rahman M, Nirala NK, Singh A, Zhu LJ, Taguchi K, Bamba T, Fukusaki E, Shaw LM, Lambright DG, Acharya JK, et al. Drosophila Sirt2/mammalian SIRT3 deacetylates ATP synthase beta and regulates complex V activity. J Cell Biol. 2014;206:289–305. doi: 10.1083/jcb.201404118. [DOI] [PMC free article] [PubMed] [Google Scholar]
- Rappsilber J, Mann M, Ishihama Y. Protocol for micro-purification, enrichment, pre-fractionation and storage of peptides for proteomics using StageTips. Nat Protoc. 2007;2:1896–1906. doi: 10.1038/nprot.2007.261. [DOI] [PubMed] [Google Scholar]
- Shannon P, Markiel A, Ozier O, Baliga NS, Wang JT, Ramage D, Amin N, Schwikowski B, Ideker T. Cytoscape: a software environment for integrated models of biomolecular interaction networks. Genome Res. 2003;13:2498–2504. doi: 10.1101/gr.1239303. [DOI] [PMC free article] [PubMed] [Google Scholar]
- Smith BC, Settles B, Hallows WC, Craven MW, Denu JM. SIRT3 substrate specificity determined by peptide arrays and machine learning. ACS Chem Biol. 2011;6:146–157. doi: 10.1021/cb100218d. [DOI] [PMC free article] [PubMed] [Google Scholar]
- Soderberg O, Gullberg M, Jarvius M, Ridderstrale K, Leuchowius KJ, Jarvius J, Wester K, Hydbring P, Bahram F, Larsson LG, et al. Direct observation of individual endogenous protein complexes in situ by proximity ligation. Nat Methods. 2006;3:995–1000. doi: 10.1038/nmeth947. [DOI] [PubMed] [Google Scholar]
- Sowa ME, Bennett EJ, Gygi SP, Harper JW. Defining the human deubiquitinating enzyme interaction landscape. Cell. 2009;138:389–403. doi: 10.1016/j.cell.2009.04.042. [DOI] [PMC free article] [PubMed] [Google Scholar]
- Stark C, Breitkreutz BJ, Reguly T, Boucher L, Breitkreutz A, Tyers M. BioGRID: a general repository for interaction datasets. Nucleic Acids Res. 2006;34:D535–D539. doi: 10.1093/nar/gkj109. [DOI] [PMC free article] [PubMed] [Google Scholar]
- Vassilopoulos A, Pennington JD, Andresson T, Rees DM, Bosley AD, Fearnley IM, Ham A, Flynn CR, Hill S, Rose KL, et al. SIRT3 deacetylates ATP synthase F1 complex proteins in response to nutrient- and exercise-induced stress. Antioxid Redox Signal. 2014;21:551–564. doi: 10.1089/ars.2013.5420. [DOI] [PMC free article] [PubMed] [Google Scholar]
- Verdin E, Hirschey MD, Finley LW, Haigis MC. Sirtuin regulation of mitochondria: energy production, apoptosis, and signaling. Trends Biochem Sci. 2010;35:669–675. doi: 10.1016/j.tibs.2010.07.003. [DOI] [PMC free article] [PubMed] [Google Scholar]
- Yang H, Yang T, Baur JA, Perez E, Matsui T, Carmona JJ, Lamming DW, Souza-Pinto NC, Bohr VA, Rosenzweig A, et al. Nutrient-sensitive mitochondrial NAD+ levels dictate cell survival. Cell. 2007;130:1095–1107. doi: 10.1016/j.cell.2007.07.035. [DOI] [PMC free article] [PubMed] [Google Scholar]
Associated Data
This section collects any data citations, data availability statements, or supplementary materials included in this article.