SAR-DEFICIENT4 (SARD4) encodes a key enzyme for pipecolic acid (Pip) biosynthesis and is required for the establishment of systemic acquired resistance to pathogen infection in Arabidopsis.
Abstract
Systemic acquired resistance (SAR) is an immune response induced in the distal parts of plants following defense activation in local tissue. Pipecolic acid (Pip) accumulation orchestrates SAR and local resistance responses. Here, we report the identification and characterization of SAR-DEFICIENT4 (SARD4), which encodes a critical enzyme for Pip biosynthesis in Arabidopsis thaliana. Loss of function of SARD4 leads to reduced Pip levels and accumulation of a Pip precursor, Δ1-piperideine-2-carboxylic acid (P2C). In Escherichia coli, expression of the aminotransferase ALD1 leads to production of P2C and addition of SARD4 results in Pip production, suggesting that a Pip biosynthesis pathway can be reconstituted in bacteria by coexpression of ALD1 and SARD4. In vitro experiments showed that ALD1 can use l-lysine as a substrate to produce P2C and P2C is converted to Pip by SARD4. Analysis of sard4 mutant plants showed that SARD4 is required for SAR as well as enhanced pathogen resistance conditioned by overexpression of the SAR regulator FLAVIN-DEPENDENT MONOOXYGENASE1. Compared with the wild type, pathogen-induced Pip accumulation is only modestly reduced in the local tissue of sard4 mutant plants, but it is below detection in distal leaves, suggesting that Pip is synthesized in systemic tissue by SARD4-mediated reduction of P2C and biosynthesis of Pip in systemic tissue contributes to SAR establishment.
INTRODUCTION
Systemic acquired resistance (SAR) is an evolutionarily conserved defense mechanism induced in the distal parts of plants after a locally restricted primary infection (Fu and Dong, 2013). Following local infection, mobile signals are generated in inoculated leaves and transported to other parts of the plant. Perception of the signals in the systemic tissue leads to activation of long-lasting protection against a broad spectrum of microbial pathogens. Salicylic acid (SA) is required for both SAR and local defense responses but is unlikely to function as a critical long distance signal in SAR (Vlot et al., 2009). Several metabolites including methyl salicylate, azelaic acid, dehydroabietinal, and a molecule derived from glycerol-3-phosphate have been shown to be involved in long distance signaling during SAR (Park et al., 2007; Jung et al., 2009; Chanda et al., 2011; Chaturvedi et al., 2012). The lipid transfer proteins DEFECTIVE IN INDUCED RESISTANCE1 and AZELAIC ACID INDUCED1 play critical roles in long-distance signaling mediated by some of these metabolites (Maldonado et al., 2002; Jung et al., 2009; Champigny et al., 2013; Yu et al., 2013).
Several genes encoding putative enzymes that are mainly related to amino acid metabolism had been found to play important roles in plant defense responses, suggesting that additional signal molecules are required for plant defense against pathogens (Zeier, 2013). Among them, ALD1 encodes an aminotransferase and FLAVIN-DEPENDENT MONOOXYGENASE1 (FMO1) encodes a putative flavin-dependent monooxygenase. ALD1 and FMO1 are required for SAR as well as local defense (Song et al., 2004a; Bartsch et al., 2006; Koch et al., 2006; Mishina and Zeier, 2006; Bernsdorff et al., 2016). Loss of function of ALD1 results in increased susceptibility to both virulent and avirulent pathogens and SAR deficiency. Overexpression of FMO1 leads to increased resistance against virulent pathogens, whereas loss of function of FMO1 leads to enhanced susceptibility to pathogens and complete loss of SAR (Bartsch et al., 2006; Koch et al., 2006; Mishina and Zeier, 2006). Pathogen resistance mediated by FMO1 had been shown to be independent of SA (Bartsch et al., 2006; Bernsdorff et al., 2016).
Analysis of amino acid metabolism following pathogen infection showed that ALD1 is required for the biosynthesis of pipecolic acid (Pip), which is an intermediate of lysine degradation (Návarová et al., 2012). Infection by Pseudomonas syringae pv maculicola (P.s.m.) ES4326 induces a strong increase in Pip accumulation in the wild type, but not in ald1 mutant plants. Defects in basal resistance and SAR in ald1, but not in fmo1 mutants, can be complemented by exogenous application of Pip, suggesting that lack of Pip production is responsible for the immune deficiency in ald1. Pretreatment with Pip leads to increased pathogen resistance and induces SAR-related defense priming in wild-type plants, suggesting that Pip functions as a critical regulator of inducible plant immunity (Návarová et al., 2012). However, whether Pip moves systemically during infection is unknown.
Previously we developed a high-throughput “brush and spray” assay for SAR and used it to carry out a forward genetic screen to search for SAR-deficient mutants (Jing et al., 2011). Among the mutants with strong SAR deficiency phenotypes, six are alleles of fmo1, four are alleles of ald1, and three are alleles of SA INDUCTION DEFICIENT2, highlighting the importance of SA and metabolites synthesized by FMO1 and ALD1 in SAR. Here, we report the identification and characterization of SAR DEFICIENT4 (SARD4), which encodes an enzyme involved in the final step of Pip biosynthesis.
RESULTS
Identification of sard4 Mutants
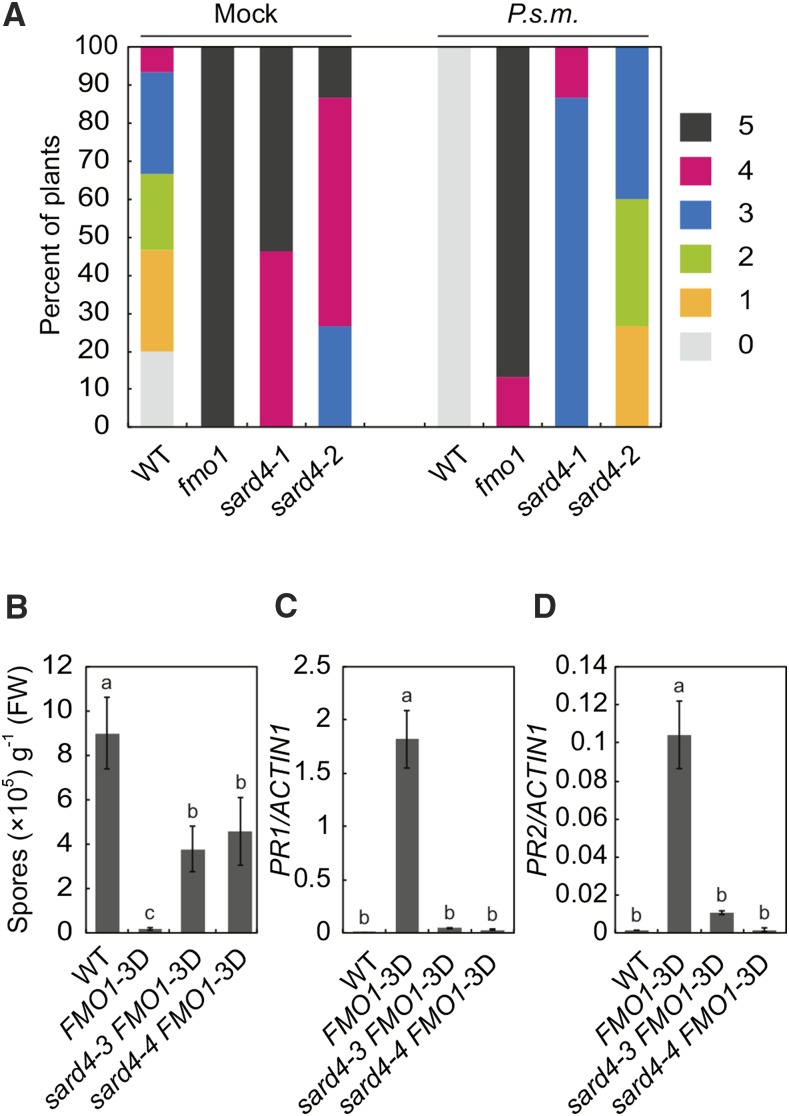
In a previously described forward genetic screen for SAR-deficient mutants (Jing et al., 2011), two sard4 alleles were identified. As shown in Figure 1A, both sard4-1 and sard4-2 displayed compromised SAR. The mock-treated sard4-1 and sard4-2 also appeared to be more susceptible to Hyaloperonospora arabidopsidis (H.a.) Noco2. In a separate genetic screen to identify genes required for enhanced basal resistance conditioned by overexpression of FMO1, FMO1-3D, an FMO1 overexpression mutant identified by activation tagging (Koch et al., 2006), was mutagenized with EMS. Screening ∼45,000 M2 plants representing ∼3000 M1 families for compromised resistance against H.a. Noco2 identified two mutants shown to be different alleles of sard4. They were named sard4-3 and sard4-4. As shown in Figure 1B, enhanced resistance against H.a. Noco2 in FMO1-3D is largely suppressed by sard4-3 and sard4-4. In FMO1-3D, the defense marker genes PR1 and PR2 are constitutively expressed. The elevated expression of PR1 and PR2 is largely suppressed in sard4-3 FMO1-3D and sard4-4 FMO1-3D (Figures 1C and 1D).
Figure 1.
Identification of sard4 Mutant Lines of Arabidopsis.
(A) Growth of H.a. Noco2 on the distal leaves of the wild type, sard4-1, and sard4-2. Three-week-old plants were first infiltrated with P.s.m. ES4326 (OD600 = 0.001) or 10 mM MgCl2 (mock) on two primary leaves and sprayed with H.a. Noco2 spores (5 × 10⁴ spores/mL) 2 d later. Infections on systemic leaves were scored 7 d after inoculation as described previously (Zhang et al., 2010). A total of 15 plants were scored for each treatment. Disease rating scores are as follows: 0, no conidiophores on the plants; 1, one leaf was infected with no more than five conidiophores; 2, one leaf was infected with more than five conidiophores; 3, two leaves were infected but no more than five conidiophores on each infected leaf; 4, two leaves were infected with more than five conidiophores on each infected leaf; 5 more than two leaves were infected with more than five conidiophores. Similar results were obtained in three independent experiments.
(B) Growth of H.a. Noco2 on the wild type, FMO1-3D, sard4-3 FMO1-3D, and sard4-4 FMO1-3D. Three-week-old seedlings were sprayed with H.a. Noco2 spores (5 × 10⁴ spores/mL). Infection was scored 7 d after inoculation by counting the numbers of spores per gram of leaf samples. Statistical differences between the samples are labeled with different letters (P < 0.01, one-way ANOVA; n = 4). Similar results were obtained in three independent experiments.
(C) and (D) Expression of PR1 (C) and PR2 (D) in the wild type, FMO1-3D, sard4-3 FMO1-3D, and sard4-4 FMO1-3D. Two-week-old seedlings grown on Murashige and Skoog plates were used for RT-qPCR analysis. Values were obtained from abundances of PR1 and PR2 normalized against that of ACTIN1, respectively. Statistical differences among the samples are labeled with different letters (P < 0.01, one-way ANOVA; n = 3). Similar results were obtained in three independent experiments.
SARD4 Encodes a Protein Similar to Bacterial Ornithine Cyclodeaminase
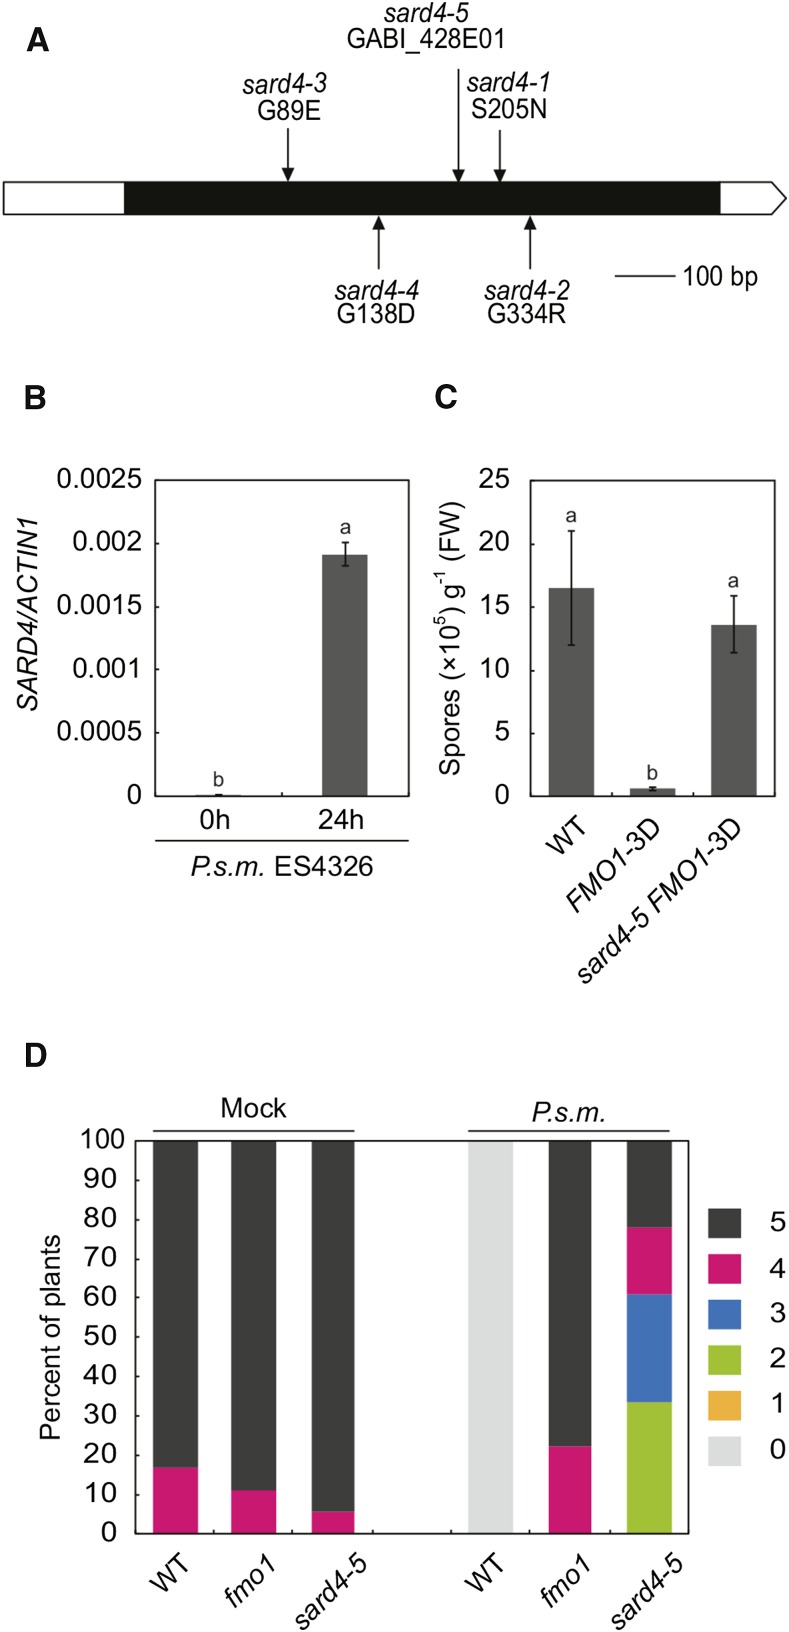
The sard4-3 and sard4-4 mutations were initially mapped to a region between marker K19E20 and MMN10 on chromosome 5. Further mapping of sard4-3 narrowed the mutation to a region between markers K10D11 and MYN8. In this region, At5g52810 encodes a protein with similarity to bacterial ornithine cyclodeaminase and it is induced by pathogen infection based on the TAIR microarray database. Sequencing At5g52810 in sard4-3 identified a G-to-A mutation in the gene, which results in a Gly-89-to-Glu amino acid substitution. Sequencing the At5g52810 locus in the sard4-1, sard4-2, and sard4-4 mutants showed that they all contain nonsynonymous mutations in the gene (Figure 2A), suggesting that At5g52810 is SARD4. Quantitative RT-PCR analysis confirmed that At5g52810 is induced by P.s.m. ES4326 (Figure 2B).
Figure 2.
Positional Cloning of SARD4, Expression of SARD4, and the sard4 Phenotype.
(A) Positions of the sard4 mutations in the gene.
(B) Induction of SARD4 transcription by P.s.m. ES4326. Leaves of 3-week old wild-type plants were infiltrated with P.s.m. ES4326 at a dose of OD600 = 0.01. The inoculated leaves were collected 24 h later for RT-qPCR analysis. Values were obtained from the abundance of SARD4 transcripts normalized against that of ACTIN1. Statistical differences among the samples are labeled with different letters (P < 0.01, one-way ANOVA; n = 3). Similar results were obtained in three independent experiments.
(C) Growth of H.a. Noco2 on the wild type, FMO1-3D, and sard4-5 FMO1-3D. Statistical differences between the samples are labeled with different letters (P < 0.01, one-way ANOVA; n = 4). The experiment was repeated twice with similar results.
(D) Growth of H.a. Noco2 on the distal leaves of the wild type, fmo1, and sard4-5 following mock or P.s.m. ES4326 treatment. The experiment was repeated twice with similar results.
We also obtained a T-DNA insertion mutant, sard4-5, from ABRC (Figure 2A) and crossed it into FMO1-3D to test whether At5g52810 is required for enhanced pathogen resistance in FMO1-3D. As shown in Figure 2C, the enhanced resistance against H.a. Noco2 in FMO1-3D is lost in the sard4-5 FMO1-3D double mutant. In addition, SAR is also compromised in sard4-5 (Figure 2D). These data confirm that At5g52810 is indeed SARD4 and it is required for SAR as well as enhanced pathogen resistance conferred by overexpression of FMO1.
Systemic Defense Responses Are Compromised in sard4 Plants
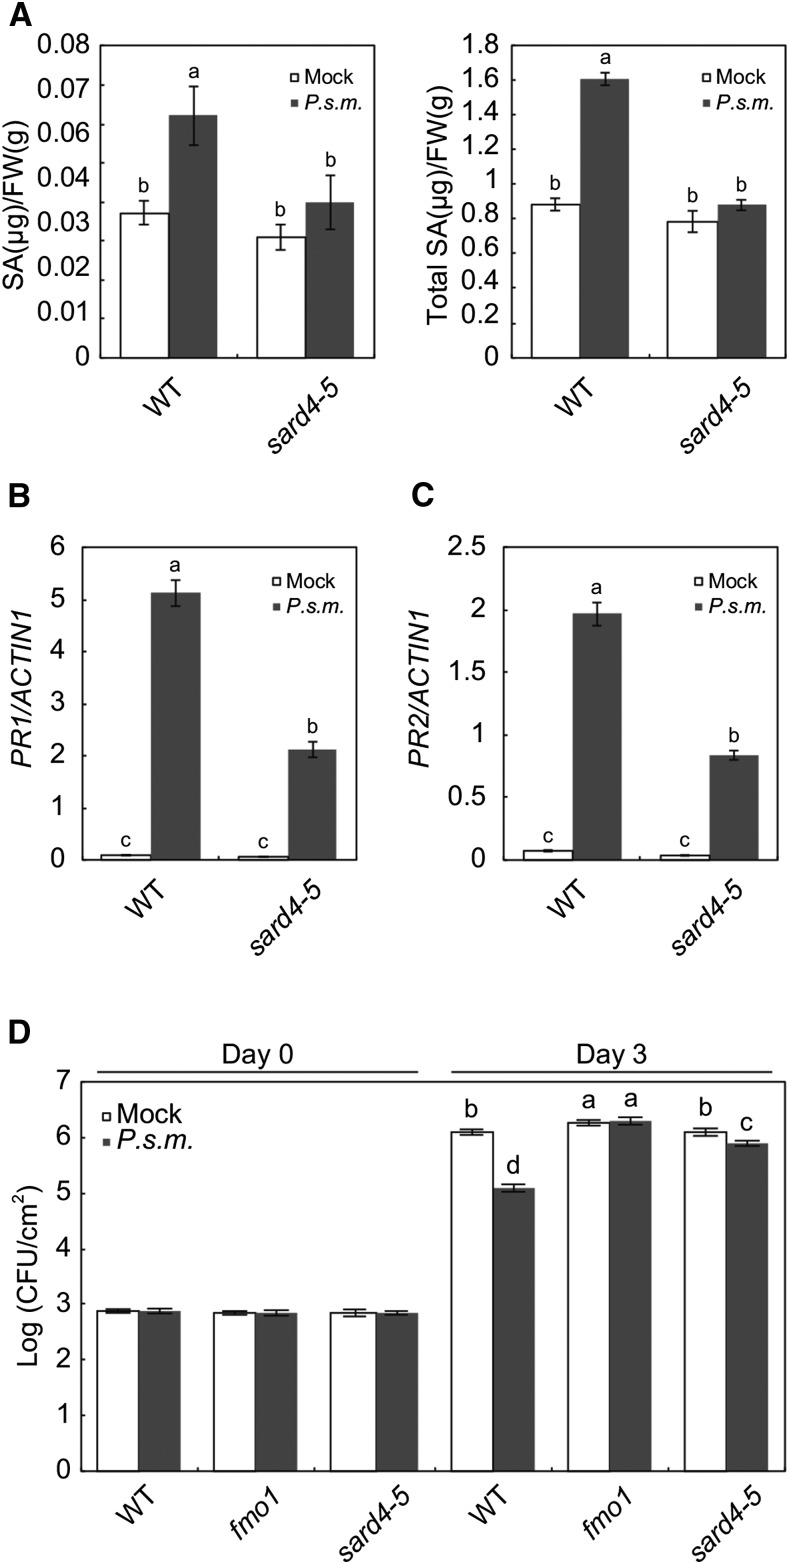
SA is an important signal molecule required for both local and systemic acquired resistance. The loss of SAR phenotype in sard4 mutants prompted us to test whether SA accumulation is affected in the mutant plants. As shown in Supplemental Figure 1, P.s.m. ES4326-induced accumulation of SA in local leaves is similar in sard4-5 and wild-type plants. However, induction of SA accumulation in systemic leaves is considerably reduced in sard4-5 (Figure 3A). Consistent with this, induction of PR1 and PR2 expression is reduced in systemic (Figures 3B and 3C) but not local leaves (Supplemental Figure 2).
Figure 3.
SARD4 Is Required for Systemic Defense Responses.
(A) Free SA and total SA accumulation in the systemic leaves in the wild type and sard4-5 following local infection by P.s.m. ES4326. Three leaves of 4-week-old plants were infiltrated with P.s.m. ES4326 (OD600 = 0.005), and the distal leaves were collected 48 h later for SA extraction and quantification. Statistical differences between the samples are labeled with different letters (P < 0.01, one-way ANOVA; n = 4). The experiment was repeated twice with similar results.
(B) and (C) Induction of systemic PR1 (B) and PR2 (C) expression in the wild type and sard4-5 by P.s.m. ES4326. Three-week-old plants were infiltrated with P.s.m. ES4326 (OD600 = 0.005) or 10 mM MgCl2 (mock) on two primary leaves, and distal leaves were collected 48 h later for RT-qPCR analysis. Values were obtained from abundances of PR1 and PR2 transcripts normalized against that of ACTIN1. Statistical differences among the samples are labeled with different letters (P < 0.01, one-way ANOVA; n = 3). Similar results were obtained in three independent experiments.
(D) Growth of P.s.m. ES4326 on the distal leaves of the wild type, fmo1, and sard4-5.
Three-week-old plants were first infiltrated with P.s.m. ES4326 (OD600 = 0.005) or 10 mM MgCl2 (mock) on two primary leaves, and two distal leaves were infected with P.s.m. ES4326 (OD600 = 0.0001) 2 d later. Bacterial growth in distal leaves was determined 3 d after inoculation. Statistical differences between the samples are labeled with different letters (P < 0.01, one-way ANOVA; n = 6). The experiment was repeated twice with similar results.
To test whether SARD4 is required for resistance against bacteria, we inoculated sard4-5 with P.s.m. ES4326 by infiltration. The npr1-1 mutant was used as a positive control. Growth of bacteria in the local leaves is much higher in npr1-1, but comparable between the wild-type and sard4-5 mutant plants (Supplemental Figure 3). In the systemic leaves of plants pretreated with P.s.m. ES4326, sard4-5 supports significantly higher bacterial growth than the wild type (Figure 3D). These data suggest that SARD4 is required for systemic but not local resistance to P.s.m. ES4326.
SARD4 Is Involved in Biosynthesis of Pip
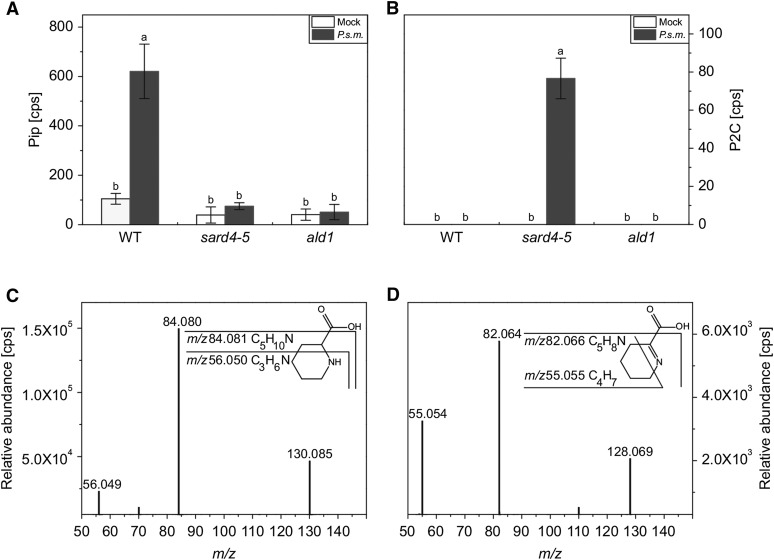
To identify the substrate for SARD4, we performed metabolite fingerprinting analysis of the systemic tissue of the wild type and sard4-5 after SAR induction. We hypothesized that the substrate of SARD4 should accumulate in the mutant upon infection. The accumulation of Pip was used as an indicator for the establishment of SAR in wild-type plants, using the ald1 (ald1-T2) mutant as a negative control. In this setup, we found 1250 high quality features (false discovery rate [FDR] < 10−2) that showed an altered accumulation pattern. Interestingly, Pip was nearly absent not only in ald1, but also in the sard4-5 mutant (Figure 4A). From these 1250 features, we detected only one that accumulated exclusively in sard4-5 upon infection (Figure 4B). A database query (Kyoto encyclopedia of genes and genomes [KEGG]) based on the accurate mass information acquired by high-resolution mass spectrometry (MS) suggested that the compound was most likely Δ1-piperideine-2-carboxylic acid (P2C), a catabolite of lysine and a precursor of Pip. The identity of both Pip and P2C were confirmed by MS/MS fragmentation (Figures 4C and 4D). However, lysine may be converted into Pip via two different pathways that can be distinguished by the structures of their intermediates immediately upstream of Pip: Δ1-piperideine-6-carboxylic acid (P6C) and P2C, respectively (Zeier, 2013). The specific formation of P2C was confirmed by spectroscopic and spectrometric methods (see below).
Figure 4.
SARD4 Is Involved in Biosynthesis of Pip.
(A) and (B) Relative abundance of Pip and P2C in systemic leaves of Arabidopsis wild type, ald1, and sard4-5 48 h after P.s.m. ES4326 (OD600 = 0.005) infection. The relative intensities of Pip (A) and P2C (B) are shown. Three biological replicates were analyzed twice by liquid chromatography-mass spectrometry. Statistical differences among the samples are labeled with different letters (P < 0.01, one-way ANOVA; n = 6). The data were obtained from the nontargeted metabolite fingerprint analysis. Similar results were obtained in two independent experiments.
(C) and (D) High-resolution MS/MS fragmentation patterns of Pip and P2C detected in the systemic leaves of P.s.m. ES4326-treated wild-type (C) or sard4-5 mutant plants (D). The fragmentation of Pip (C) and P2C (D) leads to a loss of the carboxyl group (m/z 84.080 and m/z 82.065, respectively). In Pip, the mass signal of m/z 56.049 represents a C3H6N-fragment. In P2C, the C=N double bond stays intact so that the mass signal of m/z 55.054 represents a C4H7-fragment.
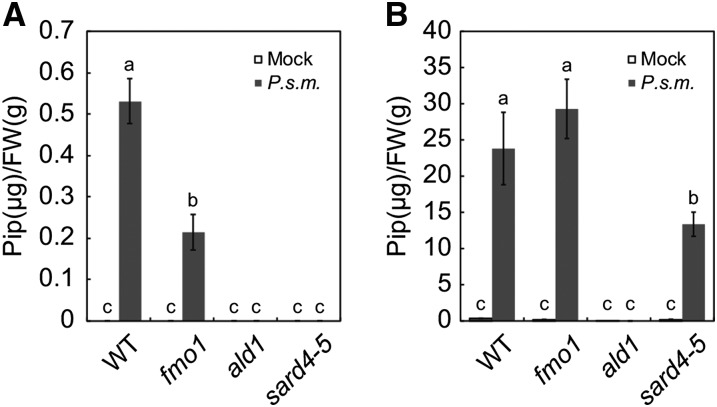
Next, we used gas chromatography-mass spectrometry (GC-MS) to analyze Pip levels in systemic tissue of sard4-5 following P.s.m. ES4326 infection. After bacterial treatment, Pip was below detectable levels in ald1 and sard4 mutants, but accumulated in substantial amounts in wild-type and fmo1 plants (Figure 5A). Using the same analytical method, we also quantified Pip levels in local leaves of sard4-5 inoculated with P.s.m. ES4326. Strong induction of Pip by P.s.m. ES4326 was observed in wild-type, fmo1, and sard4 plants, with a small but significant reduction of Pip induction in sard4-5 (Figure 5B). These data further support the hypothesis that SARD4 is involved in the biosynthesis of Pip.
Figure 5.
Pip Levels in Wild-Type, fmo1, ald1, and sard4-5 Plants.
(A) Pip levels in distal tissue of the wild type, fmo1, ald1, and sard4-5 following infection by P.s.m. ES4326. Primary leaves were infiltrated with a bacterial suspension of P.s.m. ES4326 at OD600 = 0.005. The distal leaves were collected 48 h later for amino acid analysis.
(B) Pip levels in local tissue of the wild type, fmo1, ald1, and sard4-5 following infection by P.s.m. ES4326. The inoculated leaves were collected for amino acid analysis 48 h after inoculation with the bacteria (OD600 = 0.005).
Statistical differences between the samples are labeled with different letters (P < 0.01, one-way ANOVA; n = 3). Similar results were obtained in two independent experiments.
Reconstitution of the Pip Biosynthesis Pathway by Heterologous Expression of ALD1 and SARD4 in Escherichia coli
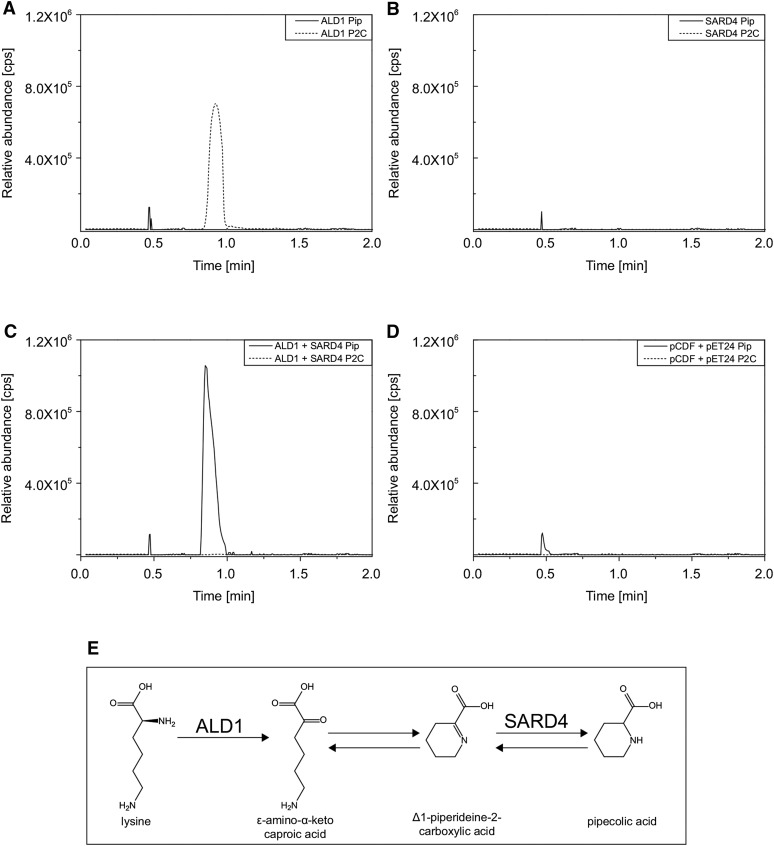
To further analyze the enzymatic activities of SARD4 and ALD1, we introduced Arabidopsis thaliana SARD4 and ALD1 separately and both together into E. coli for in-cell activity assays. We hypothesized that internal lysine could be used as a substrate for ALD1 and the resulting product will be further converted to Pip by SARD4. After induction of heterologous expression of both proteins (Supplemental Figure 4), complete cultures were extracted for analysis. In the E. coli culture that expressed ALD1 (Figure 6A), we could detect P2C (dashed line, m/z 128.070, RT 0.98 min), but no Pip (solid line). In the SARD4-expressing culture (Figure 6B), neither Pip nor P2C could be detected. However, the E. coli culture expressing both SARD4 and ALD1 in one strain yielded Pip (Figure 6C, solid line, m/z 130.086, RT 0.86 min), while in the control containing the empty vectors, neither Pip nor P2C was detectable (Figure 6D). Hence, we can exclude that P2C and Pip are E. coli-derived metabolites. The structures of both P2C and Pip were confirmed by high-resolution MS/MS analysis (Supplemental Figure 5). The exact mass, retention time, and fragmentation patterns were consistent with those of the compounds obtained from the plant material (Figure 4). Interestingly, ε-amino-α-keto caproic acid (Figure 6E), the proposed product of ALD1 (Zeier, 2013), was nearly undetectable in the samples from the in-cell activity assay. Most likely, it was completely converted into P2C under the applied conditions.
Figure 6.
Analysis of the Enzymatic Activity of ALD1 and SARD4 in E. coli.
(A) to (D) Extracted ion chromatograms for P2C (m/z 128.070, dotted lines) and Pip (m/z 130.086, solid lines). For the analysis, E. coli cultures expressing ALD1 (A), SARD4 (B), ALD1 and SARD4 together (C), or the two corresponding empty vectors (D) were used. Similar results were obtained in two independent experiments.
(E) Proposed scheme for the Pip biosynthesis pathway from lysine.
To summarize, we could identify P2C as a product of ALD1 and a substrate of SARD4, and Pip as a product of SARD4. These findings allow us to reconstruct one of the plant Pip biosynthesis pathways in E. coli (Figure 6E). As we did not detect accumulation of other metabolites in this in-cell assay upon expression of either SARD4 or ALD1 alone or both together, the data suggest that the proposed pathway may exclusively produce Pip using lysine as substrate.
Unequivocal Identification of P2C
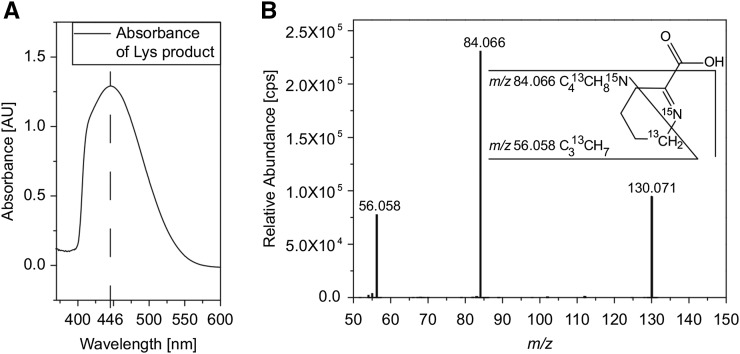
To further study the reaction of ALD1, we followed a previously published protocol to purify the heterologously expressed ALD1 (Sobolev et al., 2013). The homogenous enzyme (Supplemental Figure 6) was first tested for its in vitro activity with l-lysine to determine whether ALD1 produces P2C or P6C. These compounds can be distinguished by their different absorbance maxima when derivatized with o-aminobenzaldehyde (Soda et al., 1968). We treated the product of the ALD1/l-lysine reaction with o-aminobenzaldehyde and the formed reaction product showed an absorbance maximum at 446 nm (Figure 7A). This maximum corresponds with the reaction product of P2C (Soda et al., 1968) and confirms P2C as the product of ALD1. Next, we incubated ALD1 with l-lysine and l-lysine-6-13C,-15N separately and analyzed the products of the reactions by high resolution MS/MS. The fragmentation pattern of the l-lysine-derived product was highly similar to that of the compounds from both the leaf material (Figure 4) and the in-cell assay (Supplemental Figure 5). When we used l-lysine-6-13C,-15N as the substrate for ALD1, we detected the mass signal of m/z 130.0714 as base peak at 0.97 min, which represents the molecular ion of 6-13C-,15N-labeled P2C in the positive ionization mode (Figure 7B). The mass deviation between the calculated exact mass of positively charged ion of 6-13C-,15N-labeled P2C (m/z 130.0715) and the accurate mass of the molecular ion derived by our high-resolution MS analysis (see above) was 0.1 mD. The high-resolution MS/MS revealed the presence of both isotopes in the fragment of m/z 84.0658 (loss of the carboxyl group). The mass signal of m/z 56.0578 represents the C313CH7 fragment, containing only the labeled carbon. This fragmentation pattern corresponds to fragmentation of the unlabeled P2C from the leaf material (Figure 4D). As the photometric assay and the high-resolution MS analysis confirmed P2C as the product of ALD1, we concluded that ALD1 is an α-aminotransferase that can use l-lysine for the formation of P2C.
Figure 7.
Identification of P2C as the ALD1 Reaction Product.
(A) Absorption spectrum (background corrected) of the ALD1 reaction product after treatment with o-AB. To remove ALD1 from the solution, filter centrifugation was used. One hundred microliters of the sample was incubated with 890 μL sodium acetate buffer (0.2 M, pH 5) and 10 μL o-AB (0.4 M) for 1 h at 37°C. Similar results were obtained in two independent experiments.
(B) MS/MS fragmentation pattern of 6-13C-,15N-labeled P2C (m/z 130.070) from the Δ20-ALD1 reaction with l-lysine-6-13C,-15N as substrate. Analogous to the unlabeled P2C, fragmentation leads to a loss of the carboxyl group. In the corresponding fragment (m/z 84.066) both isotopes are still present. The mass signal of m/z 56.058 represents a C313CH7 fragment, containing the labeled carbon only. Consistent fragmentation pattern of the MS/MS spectra was obtained with 6-13C-,15N-labeled P2C as well as with unlabeled P2C.
SARD4 Converts P2C to Pip in Vitro
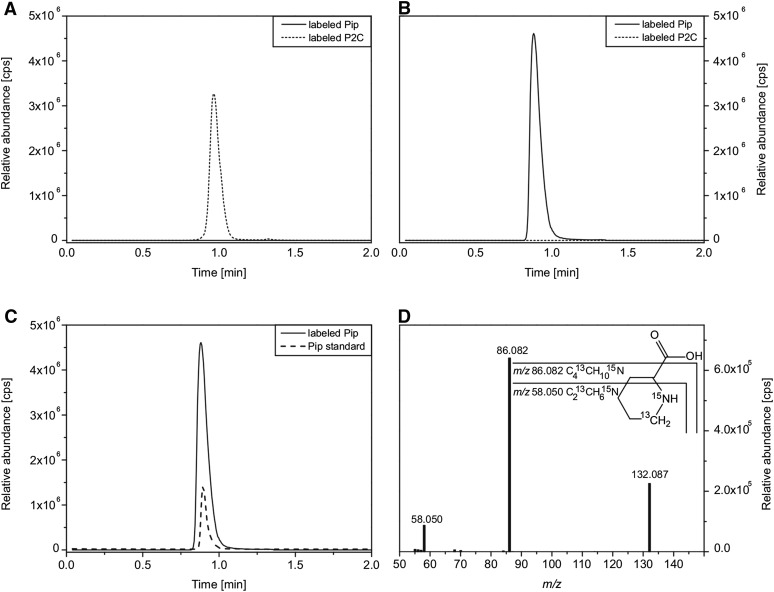
To assay the activity of SARD4, the protein was heterologously expressed in E. coli and purified to homogeneity (Supplemental Figure 7). As P2C is not commercially available, we used Δ20-ALD1 (a truncated ALD1) to generate P2C from l-lysine and 6-13C-,15N-labeled P2C from l-lysine-6-13C,-15N (see section above). Filter centrifugation was employed to remove Δ20-ALD1 from the product solution. As shown in Figure 8A, labeled P2C (dashed line, m/z 130.072, RT 0.97 min) but no labeled Pip (solid line) was present in the Δ20-ALD1-free product solution. The addition of purified SARD4 protein to this solution led to a complete conversion of labeled P2C to labeled Pip (Figure 8B, solid line; m/z 132.086, RT 0.87 min). To verify that the product was indeed Pip, we compared the retention time and MS/MS fragmentation pattern of commercial Pip standard with the SARD4 produced in vitro product (Figures 8C and 8D). Analogous to the unlabeled Pip, the fragmentation leads to a loss of the carboxyl group (m/z 86.082), in which both isotopes are still present. The mass signal of m/z 58.050 represents a C213CH615N fragment, which contains both the 13C and the 15N isotope. The retention time and the fragmentation pattern were identical for the SARD4-derived in vitro product, the compound identified in the leaf material (Figure 4), the in-cell assay (Figure 6; Supplemental Figure 5), and the commercial Pip standard. Together, these data strongly suggest that SARD4 catalyzes the reduction of P2C to Pip.
Figure 8.
SARD4 Can Convert P2C into Pip in Vitro.
(A) to (C) UHPLC-QTOF-MS analyses of substrates and products of the SARD4 catalyzed reaction. Extracted ion chromatograms of 6-13C-,15N-labeled Δ1-piperideine-2-carboxylic (labeled P2C, m/z 130.070, dotted lines) (A), 6-13C-,15N-labeled pipecolic acid (labeled Pip, m/z 132.086, solid lines) (B), and pipecolic acid standard (Pip, m/z 130.086, dashed line) (C). 6-13C-,15N-labeled Pip and commercial Pip standard show the same retention time.
(D) MS/MS fragmentation pattern of 6-13C-, 15N-labeled Pip from the SARD4 reaction. 6-13C-,15N-labeled P2C was used as the substrate, which was produced from l-lysine-6-13C,-15N by the Δ20-ALD1 reaction. Analogous to the unlabeled Pip, fragmentation leads to a loss of the carboxyl group. In the corresponding fragment (m/z 86.082), the 13C as well as the 15N isotopes are still present. The mass signal of m/z 58.050 represents a C213CH615N fragment, still containing both isotopes. Consistent results were obtained with 6-13C-,15N-labeled P2C as well as with unlabeled P2C.
Pip Restores PR Gene Expression in sard4-4 FMO1-3D
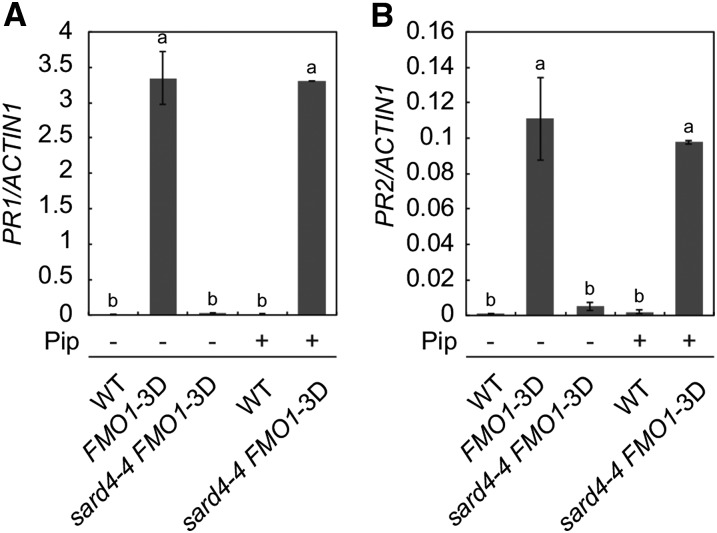
To test whether exogenous application of Pip can complement the defects in sard4-4, we grew sard4-4 FMO1-3D on media containing Pip and measured the expression levels of PR genes. As shown in Figures 9A and 9B, the expression of PR1 and PR2 in sard4-4 FMO1-3D seedlings was largely restored by Pip, indicating that treatment with Pip complements the defects in Pip biosynthesis in sard4 mutant plants.
Figure 9.
Pip Restores PR1 and PR2 Expression in sard4-4 FMO1-3D.
Two-week old seedlings of the wild type, FMO1-3D, and sard4-4 FMO1-3D grown on Murashige and Skoog plates with or without Pip (5 µM) were used for RT-qPCR analysis. Values were obtained from the abundance of PR1 and PR2 transcripts normalized against that of ACTIN1, respectively. Statistical differences among the samples are labeled with different letters (P < 0.01, one-way ANOVA; n = 3). Similar results were obtained in three independent experiments.
ALD1 Is Required for Enhanced Defense Responses in FMO1-3D
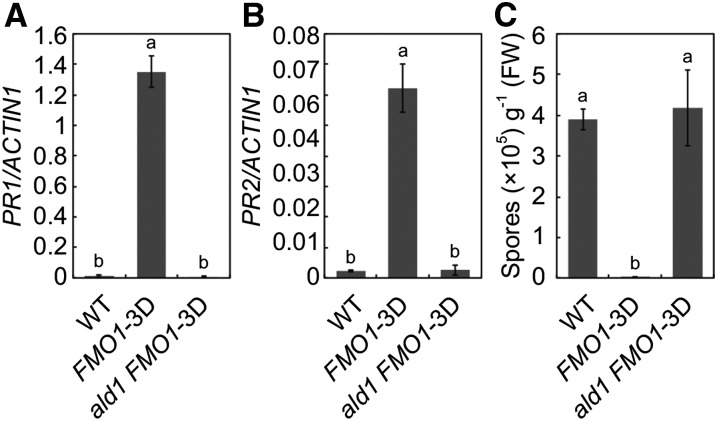
As Pip biosynthesis is blocked in ald1 mutant plants (Návarová et al., 2012), we tested whether ALD1 is also required for constitutive defense responses in FMO1-3D. We crossed ald1 into FMO1-3D and analyzed PR gene expression and resistance to H.a. Noco2 in ald1 FMO1-3D double homozygous plants. As shown in Figures 10A and 10B, constitutive expression of PR1 and PR2 in FMO1-3D is blocked in the double mutant. In addition, enhanced resistance to H.a. Noco2 in FMO1-3D is also abolished by ald1 (Figure 10C), which is consistent with loss of resistance to H.a. Noco2 in the sard4 FMO1-3D double mutant.
Figure 10.
ALD1 Is Required for Constitutive Defense Responses in FMO1-3D.
(A) and (B) PR1 (A) and PR2 (B) expression in 2-week-old seedlings of the wild type, FMO1-3D, and ald1 FMO1-3D determined by RT-qPCR. Values were obtained from abundances of PR1 and PR2 transcripts normalized against that of ACTIN1, respectively. Statistical differences among the samples are labeled with different letters (P < 0.01, one-way ANOVA; n = 3). Similar results were obtained in three independent experiments.
(C) Growth of H.a. Noco2 on the wild type, FMO1-3D, and ald1 FMO1-3D. Three-week-old seedlings were sprayed with H.a. Noco2 spores (5 × 10⁴ spores/mL). Infection was scored 7 d after inoculation by counting the numbers of spores per gram of leaf samples. Statistical differences between the samples are labeled with different letters (P < 0.01, one-way ANOVA; n = 4). Similar results were obtained in three independent experiments.
DISCUSSION
Pip has been shown to play important roles in orchestrating plant defense responses (Návarová et al., 2012) and SAR is abolished in the Pip-deficient mutant ald1 (Song et al., 2004b). A recent study had suggested that ALD1 is also involved in production of non-Pip metabolites critical for the induction of plant immunity (Cecchini et al., 2015). To what extent lack of Pip contributes to the SAR deficiency in ald1 mutant plants is unclear. In this study, we identified SARD4 as a critical enzyme involved in Pip biosynthesis. Compromised SAR in the sard4 mutants provides clear evidence that Pip is required for the establishment of SAR.
Analysis of local defense responses against P.s.m. ES4326 showed that there is no significant difference in PR gene expression and SA accumulation between wild-type and sard4 mutant plants, suggesting that Pip produced by SARD4 has little contribution to local resistance against P.s.m. ES4326. This is consistent with the relatively small effect of the sard4-5 mutation on pathogen-induced Pip accumulation in local tissue. Interestingly, mock-treated sard4-1 and sard4-2 mutants displayed enhanced susceptibility to H.a. Noco2, suggesting that SARD4 may play a role in basal resistance against the oomycete pathogen.
SARD4 shares sequence similarity with bacterial ornithine cyclodeaminases, but it does not show the corresponding enzyme activity, consistent with the observation that the three residues critical for activity of bacterial ornithine cyclodeaminases are not conserved in SARD4 (Sharma et al., 2013). Multiple lines of evidence suggest that SARD4 functions as a reductase that converts P2C to Pip. sard4 mutant plants not only have reduced Pip levels, they also accumulate P2C, a proposed Pip precursor, in distal leaves following infection with P.s.m. ES4326 (Figure 4). In addition, P2C is converted to Pip in E. coli when SARD4 is expressed and it can also be converted to Pip in vitro by purified SARD4 protein (Figures 6 and 8).
ALD1 was predicted to use lysine as a substrate and catalyze its conversion to ε-amino-α-keto caproic acid, which then could spontaneously cyclize to form P2C (Song et al., 2004a; Zeier, 2013). In E. coli expressing ALD1, we detected high levels of P2C but no ε-amino-α-keto caproic acid, suggesting that ε-amino-α-keto caproic acid does indeed spontaneously cyclize to form P2C. We further tested whether addition of lysine to the media leads to increased production of P2C. Interestingly, supplementation of lysine did not affect P2C levels (data not shown), suggesting that lysine abundance did not limit P2C production in the bacterial cells. When ALD1 and SARD4 are coexpressed in E. coli, Pip accumulates to high levels and almost no P2C was detected, suggesting that P2C is an intermediate in Pip biosynthesis and that it was entirely converted into Pip by SARD4 in the bacterial culture. Reconstitution of the Pip biosynthesis pathway in E. coli strongly supports the hypothesis that Pip is synthesized through reduction of P2C by SARD4.
In local tissue, a small reduction of the Pip level was observed in sard4 compared with wild-type plants and there is still high level of Pip accumulation following infection by P.s.m. ES4326, suggesting that loss of function of SARD4 does not completely block Pip synthesis in local tissue. Because SARD4 is a single copy gene in Arabidopsis, this is probably not caused by simple functional redundancy. It is likely that P2C can be converted to Pip by another unrelated dehydrogenase, which is only induced in local tissue. However, we cannot rule out the possibility that Pip is also synthesized in local tissue through an intermediate other than P2C. It will be interesting to determine whether ALD1 is involved in production of metabolites other than P2C and whether SARD4 can use other metabolites as substrates in Arabidopsis.
Despite that Pip accumulates to very high level in the local leaves of sard4 following P.s.m. ES4326 infection, very little Pip is present in systemic leaves, suggesting that there is no significant amount of Pip transported from local leaves to the distal leaves in the mutant. Lack of Pip accumulation in systemic leaves of sard4 indicates that Pip biosynthesis in systemic tissue is SARD4-dependent and proceeds primarily via P2C. It also suggests that SARD4-mediated Pip biosynthesis in systemic tissue plays a critical role in establishing SAR.
In plants, pathogen-induced SA synthesis occurs in plastids (Garcion et al., 2008), but where Pip is made in the plant cell is unclear. ALD1 was predicted to be a plastid-localized protein and had been shown to localize to the chloroplast (Cecchini et al., 2015). Similarly, SARD4 was also shown to be a chloroplast-localized protein (Sharma et al., 2013). The localization of ALD1 and SARD4 suggests that Pip is also synthesized in the plastids. Whether Pip exerts its function in the plastids or is translocated to other parts of the cell to promote plant immunity remains to be determined.
FMO1 encodes a monooxygenase that is required for both local resistance and SAR (Bartsch et al., 2006; Koch et al., 2006; Mishina and Zeier, 2006). The mechanism by which FMO1 regulates plant immunity is unknown. Our study provided clear genetic evidence that Pip is required for activation of defense responses by FMO1. Not only constitutive defense responses in plants overexpressing FMO1 require both ALD1 and SARD4, treatment of Pip also restores PR gene expression in the sard4-4 FMO1-3D double mutant. Previously it was shown that fmo1 mutant plants accumulate higher levels of Pip than the wild type (Návarová et al., 2012). It is likely that FMO1 is involved in the synthesis of a defense signal molecule derived from Pip. Identification of the metabolite produced by FMO1 will further advance our understanding of how SAR is established.
METHODS
Plant Material and Growth Conditions
sard4-1 and sard4-2 were identified from a previously described forward genetic screen for SAR-deficient mutants (Jing et al., 2011). The FMO1-overexpressing mutant FMO1-3D in Arabidopsis thaliana Col-0 background (Koch et al., 2006) and rpp5 mutant in Landsberg erecta (Ler) background were described previously (Parker et al., 1997). sard4-3 FMO1-3D and sard4-4 FMO1-3D were identified from an EMS-mutagenized population of FMO1-3D by looking for plants that are susceptible to H.a. Noco2. sard4-5 (GABI_428E01) was obtained from the ABRC. ald1-T2 (SALK_007673) was described previously (Song et al., 2004a). PCR primers used for genotyping sard4-5 and ald1-T2 mutants are listed in Supplemental Table 1. Plants were grown under 16 h white light (Sylvania OctronR 4100K, FO32/741/ECO bulbs) at 23°C/8 h dark at 19°C in a plant growth room unless specified.
Mutant Characterization
Analysis of resistance to H.a. Noco2 in FMO1-3D was performed by spraying 2-week-old seedlings with H.a. Noco2 spores at a concentration of 5 × 10⁴ spores/mL. Growth of H.a. Noco2 was quantified 7 d later as previously described (Bi et al., 2010). Bacterial infection assays for testing local resistance were performed by infiltrating two full-grown leaves of 4-week-old plants grown under short-day conditions (12 h light at 23°C/12 h dark at 19°C). Bacterial growth was assessed 3 d after inoculation.
Induction of SAR against H.a. Noco2 was performed as previously described (Zhang et al., 2010) by infiltrating two primary leaves of 3-week-old plants with P.s.m. ES4326 (OD600 = 0.001). The plants were sprayed with H.a. Noco2 spores at a concentration of 5 × 10⁴ spores/mL 2 d later. Induction of SAR against P.s.m. ES4326 was performed by infiltrating two primary leaves of 4-week-old plants with P.s.m. ES4326 (OD600 = 0.005). Two distal leaves were infiltrated with the same bacteria (OD600 = 0.0001) 2 d later to assess SAR.
Absolute quantification of Pip was done using the EZ:faast free amino acid analysis kit for GC-MS (Phenomenex), which is based on GC separation and mass spectrometric identification and quantification of propyl chloroformate-derivatized amino acids. Each GC sample was prepared by extracting 50 mg leaf tissue and analyzed following a procedure described previously (Návarová et al., 2012).Three biological replicates were analyzed in each experiment. SA was extracted from four biological replicates with each consisting of ∼100 mg of tissue in each experiment and quantified by HPLC as previously described (Sun et al., 2015).
For gene expression analysis, RNA was isolated from three biological replicates and used for subsequent RT-qPCR analysis. Briefly, RNA was extracted using the EZ-10 Spin Column Plant RNA Mini-Preps Kit from Biobasic (Canada) and treated with RQ1 RNase-Free DNase (Promega) to remove the genomic DNA contamination. Reverse transcription was performed using the EasyScript Reverse Transcriptase (ABM). qPCR was performed using the Takara SYBR Premix Ex (Clontech). Primers for qPCR analysis of SARD4 are listed in Supplemental Table 1. Primers for qPCR analysis of PR1, PR2, and ACTIN1 were described previously (Zhang et al., 2003).
Genetic Mapping of sard4 Mutants
To map the sard4-3 and sard4-4 mutations, sard4-3 FMO1-3D and sard4-4 FMO1-3D in Col-0 ecotype background was crossed with an rpp5 mutant in the Ler background to generate segregating mapping populations. The rpp5 mutant was used because RPP5 confers resistance against H.a. Noco2 in Ler. In the F2 population, plants containing the FMO1-3D mutation were selected by their resistance to Basta and assayed for resistance against H.a. Noco2. Plants susceptible to H.a. Noco2 were used for subsequent mapping analysis, which was performed as previously described (Zhang et al., 2007). The primer sequences of the Indel markers are listed in Supplemental Table 1.
Metabolite Fingerprinting
For the nontargeted metabolite analysis, 100 mg leaf material (three biological replicates per condition) was extracted using two-phase extraction with methy-tert-butylether (Bruckhoff et al., 2016). The polar phase was evaporated, mixed with 100 μL methanol, shaken for 5 min, and then centrifuged for 5 min at 16,000g at room temperature. Samples were dried carefully under a nitrogen stream and resuspended in 15 μL methanol and shaken for 10 min. Fifteen microliters of acetonitrile was added followed by 10 min of shaking. Lastly, 100 μL of deionized water was added and shaken for 10 min. The samples were centrifuged for 10 min at 16,000g at room temperature and transferred into glass vials. All samples were stored at 4°C.
Metabolic fingerprinting was performed by UPLC coupled to a time-of-flight mass spectrometer (TOF-MS) and a photodiode array as previously described with minor modifications (König et al., 2012). The samples of the polar extraction phase were separated with an Acquity UPLC HSS T3 column (1.0 × 100 mm, 1.8-μm particle size; Waters) at 40°C and a flow rate of 0.2 mL/min. The binary gradient consisted of solvent A (ultrapure water) and solvent B (acetonitrile), each with 0.1% (v/v) formic acid. The gradient setup for the polar phase samples was as follows: 0 to 0.5 min 99% A, 0.5 to 3 min 80% A, 3 to 8 min from 20% to 100% B, 10 to 10.1 min 100% B, 10.1 to 14 min 99% A.
All samples were measured twice by TOF-MS in both positive and negative electrospray ionization (ESI) mode with dynamic range enhancement. In the positive ESI mode, mass range from m/z 85.00 to m/z 1200 was detected, whereas in the negative ESI mode, mass range from m/z 50.00 to m/z 1200 was used. MS setup was described earlier (König et al., 2012). For the analysis of the raw mass data, the samples were processed (peak picking and peak alignment) using the MarkerLynx Application Manager 4.1 for MassLynx software, which resulted in two data matrixes. For further data processing, ranking, filtering, adduct correction, clustering, and database analysis, MarVis software (MarkerVisualization) (Kaever et al., 2015) was used. For ranking and filtering of the data sets in MarVis Filter, an ANOVA test combined with adjustment for multiple testing by Benjamini-Hochberg algorithm (FDR) was applied. The threshold was set at FDR < 0.01. The subsets of high-quality features were adduct-corrected according to the following rules: [M+H]+, [M+Na]+, [M+NH4]+ (for data of the positive ESI mode); [M-H]−, [M+CH2O2-H]−, [M+CH2O2+Na-2H]− (for data of the negative ESI mode) and subsequently combined. The resulting 1250 features were clustered according to similarities in the intensity profiles by means of one-dimensional self-organizing maps and visualized as heat map representation (MarVis Cluster). The accurate mass information of features of interest was used to search databases MetaCyc (http://www.arabidopsis.org/biocyc/) and KEGG (http://www.genome.jp/kegg/) for putative identities (MarVis Pathway). A mass window of 0.007 D was applied.
High-Resolution MS/MS Analysis (UHPLC-Q-TOF-MS)
To confirm the chemical structure of marker metabolites, exact mass fragment information of these markers were obtained by UHPLC-Q-TOF-MS analyses. For the separation, an Agilent 1290 Infinity UHPLC system was used with an Acquity UPLC HSS T3 column (2.1 × 100 mm, 1.8-μm particle size; Waters) at 40°C and a flow rate of 0.5 mL/min. The solvent system and gradients were used as described for metabolite fingerprinting. Mass detection was performed with Agilent 6540 UH Accurate-Mass-Q-TOF-MS. The MS was operated in positive and negative mode with Agilent Dual Jet Stream Technology (Agilent Technologies) as ESI source. Following ionization parameters were set: gas temperature, 300°C; gas flow, 8 L/min; nebulizer pressure, 35 p.s.i.; sheath gas temperature, 350°C; sheath gas flow, 11 L/min; Vcap, 3.5 kV; nozzle voltage, 100 V. For isolation of precursor ions in the quadrupole, a mass window of 1.3 D was used. For data acquisition, Mass Hunter Workstation Acquisition software B.05.01 was used. Mass Hunter Qualitative Analysis software B.05.01 was used as analysis tool. Fragmentation of Pip (m/z 130.086), P2C (m/z 128.07), and 15N,13C-labeled P2C (m/z 130.070) and Pip (m/z 132.086) were analyzed in positive ionization mode with a collision energy of 10 eV. Pip and l-lysine-6-13C,15N hydrochloride were ordered from Sigma-Aldrich.
Cloning and Expression of Arabidopsis ALD1 and SARD4
For cloning of ALD1 and SARD4, the coding sequences for both genes were amplified from Arabidopsis total cDNA using the primers ALD1-F1 and ALD1-R1 (for full-length ALD1) and SARD4-F and SARD4-R (for SARD4). ALD1 was inserted into the pCDFDuet-1 vector (Novagen), whereas SARD4 was inserted into the pET24a vector (Novagen) utilizing EcoRI/XhoI restriction sites in both cases.
Proteins were expressed individually or jointly in Escherichia coli BL21* (DE3) cells. The bacterial cultures were incubated at 37°C until an OD600 of 0.6 to 0.8 AU was reached. IPTG (0.1 mM) was added for protein expression and the cultures continued to grow for additional 18 h at 16°C. The expression of the heterologous proteins was verified by SDS-PAGE and immunoblot analysis. Samples (V = 0.5 mL/OD600) were harvested by centrifugation (4 min, 8,000g). The pellets were dissolved in 50 μL water and mixed with 50 μL 2× Laemmli buffer. Ten microliters of this solution were loaded on the SDS-PAGE. The proteins were either visualized by Coomassie Brilliant Blue staining or blotted onto a nitrocellulose membrane. Tetra-His antibody (Qiagen; 0.1 µg/mL) was used to detect the His-tagged proteins. A secondary anti-mouse antibody (Sigma-Aldrich) was used to visualize the proteins.
In-Cell Activity Assay
For the analysis of substrates and/or products of ALD1 (full length) and/or SARD4 catalyzed reactions, 900 μL of the particular E. coli culture was mixed with 150 μL methanol and 500 μL methyl tert-butyl ether. After 45 min of shaking in the darkness at 4°C, 120 μL water was added. The mixtures were centrifuged for 10 min at 16,000g at 4°C for phase separation. Both phases were combined in one tube, whereby the interphase was discarded. The solvents were evaporated under a stream of nitrogen and the pellet subsequently resuspended in 30 μL methanol/acetonitrile (1:1, v/v). After vigorous shaking, 100 μL water was added. Insoluble residues were removed by 10 min centrifugation at 16,000g. The supernatant was transferred into glass vials for UPLC-Q-TOF-MS analyses.
Purification and Activity Assay of Arabidopsis ALD1
For the protein purification, we followed the protocol of Sobolev et al. (2013). A truncated version of ALD1 (Δ20-ALD1, amino acids 21 to 456) was cloned into pET28 vector (Novagen) from the earlier mentioned pCDF-ALD1 plasmid using the primers ALD1-F2 and ALD1-R2. Expression was performed as described before. The cells were disrupted with pulsed ultrasonic waves (Branson Sonifier Cell Disruptor B15; Branson Ultrasonics) in a solution containing 50 mM Tris, pH 7.2, 500 mM NaCl, 1 mM PMSF, and 1 mM DTT. Cell debris was removed by centrifugation (50,000g, 4°C, 30 min). The supernatant was subsequently applied onto a HisTrap column (GE Healthcare) equilibrated with 50 mM Tris, pH 7.5, 200 mM NaCl, 5 mM imidazole, and 1 mM DTT. For the elution, 30% elution buffer (50 mM Tris, pH 7.5, 200 mM NaCl, 500 mM imidazole, and 1 mM DTT) was used.
For the activity assay, 20 µg Δ20-ALD1 was added to 250 μL of reaction buffer which contained 50 mM Tris, pH 7.2, 100 mM NaCl, 50 mM lysine, 50 µM lysine-6-13C,-15N, 50 mM pyruvate, and 2 µM pyridoxal phosphate. The reaction was performed for 3 h at 30°C, shaking at 150 rpm. To remove the protein from the solution, we used filter centrifugation (4°C, 4000g) with a SpinX UF concentrator (10,000 MWCO; Corning). The product was then analyzed with either high-resolution MS/MS or used for the colorimetric analysis. Treatment with o-aminobenzaldehyde (o-AB; Sigma-Aldrich) was used to distinguish between P6C and P2C (Soda et al., 1968). One hundred microliters of the sample was incubated with 890 μL sodium acetate buffer (0.2 M, pH 5) and 10 μL o-AB (0.4 M) for 1 h at 37°C. The absorbance was measured with a Carry 100 UV-Vis spectrophotometer (Agilent) in a range of 350 to 600 nm. Reaction buffer alone was used as the control.
Purification and Activity Assay of Arabidopsis SARD4
SARD4 was expressed as described above. For the protein purification, the same protocol as for the Δ20-ALD1 purification was used. For the activity assay of SARD4, the substrate P2C was generated by the Δ20-ALD1 reaction using either lysine or lysine-6-13C,-15N as substrate. Δ20-ALD1 was removed from the reaction solution by filter centrifugation as described above. The presence of P2C in the solution was confirmed by UPLC-Q-TOF-MS analyses. Purified SARD4 was added to 250 μL of the reaction buffer containing 50 mM Tris, pH 7.2, 100 mM NaCl, and 2 µM NADPH. The reaction was started by adding 100 μL of the protein-free P2C solution from the activity assay of Δ20-ALD1. The reaction was performed for 3 h at 30°C, shaking at 150 rpm. Subsequently, the reaction solution was centrifuged for 10 min (16,000g, 4°C) and the product solution was examined by UPLC-Q-TOF-MS analyses. The identity of Pip as the product of the SARD4-catalyzed reaction was confirmed by MS/MS fragmentation analyses and comparison of its retention time with the commercial Pip. Pip standard solution (1 µM) was used in the analysis.
Accession Numbers
Sequence data from this article can be found in the Arabidopsis Genome Initiative or GenBank/EMBL databases under the following accession numbers: AT1G19250 (FMO1), AT5G52810 (SARD4), AT2G13810 (ALD1), AAF08790 (RPP5), AT1G64280 (NPR1), At2g14610 (PR1), At3g57260 (PR2), and At2g37620 (ACTIN1).
Supplemental Data
Supplemental Figure 1. SARD4 is not required for local SA accumulation induced by P.s.m. ES4326.
Supplemental Figure 2. SARD4 is not required for local PR gene expression induced by P.s.m. ES4326.
Supplemental Figure 3. SARD4 is not required for local resistance against P.s.m. ES4326.
Supplemental Figure 4. Heterologous expression of pCDF-ALD1 and pET-SARD4 in a single E. coli liquid culture for the in-cell activity assay.
Supplemental Figure 5. MS/MS fragmentation patterns of Pip and P2C from in-cell assay.
Supplemental Figure 6. SDS-PAGE analysis of heterologous expressed 6×His-tagged Δ20ALD1 protein (∼50 kD) purified by affinity chromatography.
Supplemental Figure 7. SDS-PAGE analysis of heterologous expressed 6×His-tagged SARD4 protein (∼36.4 kD) purified by affinity chromatography.
Supplemental Table 1. Primers used in this study.
Supplemental Table 2. ANOVA tables for statistical analysis.
Supplementary Material
Acknowledgments
I.F. was supported by the Deutsche Forschungsgemeinschaft (ZUK 45/2010 and partially by IRTG 2172 “PRoTECT”). S.H. and D.R. were supported by the “PRoTECT” program of the Göttingen Graduate School of Neuroscience and Molecular Biology. Y.Z. was supported by Natural Sciences and Engineering Research Council of Canada, Canada Foundation for Innovation, and British Columbia Knowledge Development Fund.
AUTHOR CONTRIBUTIONS
P.D., D.R., Y.D., K.F., X.L., R.J., I.F., and Y.Z. conceived and designed the experiments. P.D., D.R., Y.D., K.F., L.B., S.H., and S.X. performed the experiments. P.D., D.R., Y.D., K.F., I.F., and Y.Z. analyzed the data, P.D., D.R., Y.D., K.F., L.B., I.F., and Y.Z. wrote the article.
Glossary
- SAR
systemic acquired resistance
- SA
salicylic acid
- FDR
false discovery rate
- MS
mass spectrometry
- P2C
Δ1-piperideine-2-carboxylic acid
- P6C
Δ1-piperideine-6-carboxylic acid
- ESI
electrospray ionization
References
- Bartsch M., Gobbato E., Bednarek P., Debey S., Schultze J.L., Bautor J., Parker J.E. (2006). Salicylic acid-independent ENHANCED DISEASE SUSCEPTIBILITY1 signaling in Arabidopsis immunity and cell death is regulated by the monooxygenase FMO1 and the Nudix hydrolase NUDT7. Plant Cell 18: 1038–1051. [DOI] [PMC free article] [PubMed] [Google Scholar]
- Bernsdorff F., Döring A.-C., Gruner K., Schuck S., Bräutigam A., Zeier J., (2016). Pipecolic acid orchestrates plant systemic acquired resistance and defense priming via salicylic acid-dependent and independent pathways. Plant Cell 28: 102–129. [DOI] [PMC free article] [PubMed] [Google Scholar]
- Bi D., Cheng Y.T., Li X., Zhang Y. (2010). Activation of plant immune responses by a gain-of-function mutation in an atypical receptor-like kinase. Plant Physiol. 153: 1771–1779. [DOI] [PMC free article] [PubMed] [Google Scholar]
- Bruckhoff V., Haroth S., Feussner K., König S., Brodhun F., Feussner I. (2016). Functional characterization of CYP94 genes and identification of a novel jasmonate catabolite in flowers. PLoS One 11: e0159875. [DOI] [PMC free article] [PubMed] [Google Scholar]
- Cecchini N.M., Jung H.W., Engle N.L., Tschaplinski T.J., Greenberg J.T. (2015). ALD1 regulates basal immune components and early inducible defense responses in Arabidopsis. Mol. Plant Microbe Interact. 28: 455–466. [DOI] [PubMed] [Google Scholar]
- Champigny M.J., Isaacs M., Carella P., Faubert J., Fobert P.R., Cameron R.K. (2013). Long distance movement of DIR1 and investigation of the role of DIR1-like during systemic acquired resistance in Arabidopsis. Front. Plant Sci. 4: 230. [DOI] [PMC free article] [PubMed] [Google Scholar]
- Chanda B., Xia Y., Mandal M.K., Yu K., Sekine K.T., Gao Q.M., Selote D., Hu Y., Stromberg A., Navarre D., Kachroo A., Kachroo P. (2011). Glycerol-3-phosphate is a critical mobile inducer of systemic immunity in plants. Nat. Genet. 43: 421–427. [DOI] [PubMed] [Google Scholar]
- Chaturvedi R., Venables B., Petros R.A., Nalam V., Li M., Wang X., Takemoto L.J., Shah J. (2012). An abietane diterpenoid is a potent activator of systemic acquired resistance. Plant J. 71: 161–172. [DOI] [PubMed] [Google Scholar]
- Fu Z.Q., Dong X. (2013). Systemic acquired resistance: turning local infection into global defense. Annu. Rev. Plant Biol. 64: 839–863. [DOI] [PubMed] [Google Scholar]
- Garcion C., Lohmann A., Lamodière E., Catinot J., Buchala A., Doermann P., Métraux J.P. (2008). Characterization and biological function of the ISOCHORISMATE SYNTHASE2 gene of Arabidopsis. Plant Physiol. 147: 1279–1287. [DOI] [PMC free article] [PubMed] [Google Scholar]
- Jing B., Xu S., Xu M., Li Y., Li S., Ding J., Zhang Y. (2011). Brush and spray: a high-throughput systemic acquired resistance assay suitable for large-scale genetic screening. Plant Physiol. 157: 973–980. [DOI] [PMC free article] [PubMed] [Google Scholar]
- Jung H.W., Tschaplinski T.J., Wang L., Glazebrook J., Greenberg J.T. (2009). Priming in systemic plant immunity. Science 324: 89–91. [DOI] [PubMed] [Google Scholar]
- Kaever A., Landesfeind M., Feussner K., Mosblech A., Heilmann I., Morgenstern B., Feussner I., Meinicke P. (2015). MarVis-Pathway: integrative and exploratory pathway analysis of non-targeted metabolomics data. Metabolomics 11: 764–777. [DOI] [PMC free article] [PubMed] [Google Scholar]
- Koch M., Vorwerk S., Masur C., Sharifi-Sirchi G., Olivieri N., Schlaich N.L. (2006). A role for a flavin-containing mono-oxygenase in resistance against microbial pathogens in Arabidopsis. Plant J. 47: 629–639. [DOI] [PubMed] [Google Scholar]
- König S., Feussner K., Schwarz M., Kaever A., Iven T., Landesfeind M., Ternes P., Karlovsky P., Lipka V., Feussner I. (2012). Arabidopsis mutants of sphingolipid fatty acid α-hydroxylases accumulate ceramides and salicylates. New Phytol. 196: 1086–1097. [DOI] [PubMed] [Google Scholar]
- Maldonado A.M., Doerner P., Dixon R.A., Lamb C.J., Cameron R.K. (2002). A putative lipid transfer protein involved in systemic resistance signalling in Arabidopsis. Nature 419: 399–403. [DOI] [PubMed] [Google Scholar]
- Mishina T.E., Zeier J. (2006). The Arabidopsis flavin-dependent monooxygenase FMO1 is an essential component of biologically induced systemic acquired resistance. Plant Physiol. 141: 1666–1675. [DOI] [PMC free article] [PubMed] [Google Scholar]
- Návarová H., Bernsdorff F., Döring A.C., Zeier J. (2012). Pipecolic acid, an endogenous mediator of defense amplification and priming, is a critical regulator of inducible plant immunity. Plant Cell 24: 5123–5141. [DOI] [PMC free article] [PubMed] [Google Scholar]
- Park S.-W., Kaimoyo E., Kumar D., Mosher S., Klessig D.F. (2007). Methyl salicylate is a critical mobile signal for plant systemic acquired resistance. Science 318: 113–116. [DOI] [PubMed] [Google Scholar]
- Parker J.E., Coleman M.J., Szabò V., Frost L.N., Schmidt R., van der Biezen E.A., Moores T., Dean C., Daniels M.J., Jones J.D. (1997). The Arabidopsis downy mildew resistance gene RPP5 shares similarity to the toll and interleukin-1 receptors with N and L6. Plant Cell 9: 879–894. [DOI] [PMC free article] [PubMed] [Google Scholar]
- Sharma S., Shinde S., Verslues P.E. (2013). Functional characterization of an ornithine cyclodeaminase-like protein of Arabidopsis thaliana. BMC Plant Biol. 13: 182. [DOI] [PMC free article] [PubMed] [Google Scholar]
- Sobolev V., Edelman M., Dym O., Unger T., Albeck S., Kirma M., Galili G. (2013). Structure of ALD1, a plant-specific homologue of the universal diaminopimelate aminotransferase enzyme of lysine biosynthesis. Acta Crystallogr. Sect. F Struct. Biol. Cryst. Commun. 69: 84–89. [DOI] [PMC free article] [PubMed] [Google Scholar]
- Soda K., Misono H., Yamamoto T. (1968). L-Lysine:alpha-ketoglutarate aminotransferase. I. Identification of a product, delta-1-piperideine-6-carboxylic acid. Biochemistry 7: 4102–4109. [DOI] [PubMed] [Google Scholar]
- Song J.T., Lu H., Greenberg J.T. (2004a). Divergent roles in Arabidopsis thaliana development and defense of two homologous genes, aberrant growth and death2 and AGD2-LIKE DEFENSE RESPONSE PROTEIN1, encoding novel aminotransferases. Plant Cell 16: 353–366. [DOI] [PMC free article] [PubMed] [Google Scholar]
- Song J.T., Lu H., McDowell J.M., Greenberg J.T. (2004b). A key role for ALD1 in activation of local and systemic defenses in Arabidopsis. Plant J. 40: 200–212. [DOI] [PubMed] [Google Scholar]
- Sun T., Zhang Y., Li Y., Zhang Q., Ding Y., Zhang Y. (2015). ChIP-seq reveals broad roles of SARD1 and CBP60g in regulating plant immunity. Nat. Commun. 6: 10159. [DOI] [PMC free article] [PubMed] [Google Scholar]
- Vlot A.C., Dempsey D.A., Klessig D.F. (2009). Salicylic acid, a multifaceted hormone to combat disease. Annu. Rev. Phytopathol. 47: 177–206. [DOI] [PubMed] [Google Scholar]
- Yu K., Soares J.M., Mandal M.K., Wang C., Chanda B., Gifford A.N., Fowler J.S., Navarre D., Kachroo A., Kachroo P. (2013). A feedback regulatory loop between G3P and lipid transfer proteins DIR1 and AZI1 mediates azelaic-acid-induced systemic immunity. Cell Reports 3: 1266–1278. [DOI] [PubMed] [Google Scholar]
- Zeier J. (2013). New insights into the regulation of plant immunity by amino acid metabolic pathways. Plant Cell Environ. 36: 2085–2103. [DOI] [PubMed] [Google Scholar]
- Zhang Y., Glazebrook J., Li X. (2007). Identification of components in disease-resistance signaling in Arabidopsis by map-based cloning. Methods Mol. Biol. 354: 69–78. [DOI] [PubMed] [Google Scholar]
- Zhang Y., Tessaro M.J., Lassner M., Li X. (2003). Knockout analysis of Arabidopsis transcription factors TGA2, TGA5, and TGA6 reveals their redundant and essential roles in systemic acquired resistance. Plant Cell 15: 2647–2653. [DOI] [PMC free article] [PubMed] [Google Scholar]
- Zhang Y., Xu S., Ding P., Wang D., Cheng Y.T., He J., Gao M., Xu F., Li Y., Zhu Z., Li X., Zhang Y. (2010). Control of salicylic acid synthesis and systemic acquired resistance by two members of a plant-specific family of transcription factors. Proc. Natl. Acad. Sci. USA 107: 18220–18225. [DOI] [PMC free article] [PubMed] [Google Scholar]
Associated Data
This section collects any data citations, data availability statements, or supplementary materials included in this article.


