

Summary
The realization that nuclear distribution of DNA, RNA and proteins differs between cell types and developmental stages suggests that nuclear organization serves regulatory functions. Understanding the logic of nuclear architecture and how it contributes to differentiation and cell fate commitment remains challenging. Here, we use Soft X-ray Tomography (SXT) to image chromatin organization, distribution and biophysical properties during neurogenesis in vivo. Our analyses reveal that chromatin with similar biophysical properties forms an elaborate connected network throughout the entire nucleus. Although this interconnectivity is present in every developmental stage, differentiation proceeds with concomitant increase in chromatin compaction and redistribution of condensed chromatin towards the nuclear core. HP1β, but not nucleosome spacing or phasing, regulates chromatin rearrangements since it governs both the compaction of chromatin and its interactions with the nuclear envelope. Our experiments introduce SXT as a powerful imaging technology for nuclear architecture.
Keywords: Chromatin, nucleus, soft x-ray tomography, olfactory sensory neurons, nuclear organization, differentiation, neurogenesis
eTOC
Le Gros et al. characterized nuclear organization in mouse olfactory epithelial cells at distinct stages of differentiation. Quantitative 3D x-ray reconstructions reveal two chromatin compartments with different degrees of crowding. Each compartment forms an interconnected network that spans the nucleus and remains intact during chromatin compaction and nuclear reorganization.
Introduction
Cellular differentiation is a stepwise process characterized by loss of transcriptional pluripotency and commitment to irreversible expression programs. It is postulated that the loss of nuclear plasticity that accompanies differentiation is mediated by epigenetic repression and chromatin-mediated silencing of genes that preserve multipotency (Waddington, 1957). Indeed, epigenetic changes during embryonic stem cell differentiation are consistent with cellular commitment relying on the stable repression of genes that promote pluri- and multi-potency, as well as genes compatible with alternate differentiation programs, through progressive chromatin restriction (Hawkins et al., 2010; Li et al., 2012b; Zhang et al., 2012; Zhu et al., 2013). Genes governing cellular differentiation, on the other hand, are not stably silenced in progenitor cells; rather, they are retained in a repressed but “poised” or bivalent epigenetic state until external cues allow their expression (Bernstein et al., 2006). Consequently, fully differentiated or lineage committed cells have a more restrictive epigenetic landscape than embryonic stem cells.
In addition to differentiation-dependent epigenetic restrictions, recent findings reveal that cellular differentiation also involves general and gene-specific rearrangements in nuclear organization (Bickmore and van Steensel, 2013; Cavalli and Misteli, 2013; Dekker and Mirny, 2016; Van Bortle and Corces, 2013). The nuclear lamina appears to play an organizing role for these rearrangements, since cell type dependent variations in its protein composition determines the recruitment of specific genomic domains towards the nuclear envelope with various transcriptional consequences and effects on differentiation (Clowney et al., 2012; Gonzalez-Sandoval et al., 2015; Kohwi et al., 2013; Solovei et al., 2013). These spatial translocations can be extremely specific, highly coordinated and critical for proper development. For example the recruitment of specific genes to the nuclear lamina of differentiating neuroblasts in Drosophila is essential for the silencing of specific transcription factors and the developmental transition to subsequent differentiation stages (Kohwi et al., 2013).
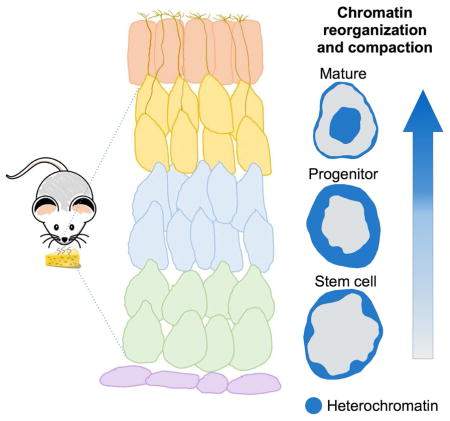
These observations suggest that cellular differentiation and fate commitment proceed via substantial overhaul of the biochemical properties and 3D distribution of chromatin in vivo, to generate nuclei specialized for the transcriptional needs of each cell type (Alexander and Lomvardas, 2014). However, the lack of available technologies that can resolve both the biophysical state and the conformation of the genome with high spatial precision has prevented a comprehensive and quantitative experimental demonstration of this concept. These technical limitations can be circumvented by Soft X-Ray Tomography (SXT), which allows imaging of intact eukaryotic cells in a near-native state at a resolution of about 50 nm (Le Gros, 2012; McDermott et al., 2012a; McDermott et al., 2009; McDermott et al., 2012b). Since SXT was used successfully to image olfactory sensory neurons (Clowney et al., 2012), we sought to use the continuously regenerating main olfactory epithelium (MOE) as an in vivo model for the study of chromatin alterations during neurogenesis and differentiation. SXT on multipotent stem cells, neuronal progenitors and terminally differentiated post-mitotic neurons from the MOE revealed gradual chromatin compaction and increase of heterochromatinization during differentiation. Surprisingly, the increase of chromatin condensation is not dependent upon significant changes in nucleosome phasing or spacing, but relies on the function of heterochromatin binding protein HP1β, since loss of function experiments revealed substantial loss of chromatin condensation in HP1β knockout post-mitotic neurons.
Our SXT data reveal distinct compartmentalization of chromatin into two regions that have different degrees of ‘crowding’ or ‘compaction.’ Global 3D views of the nucleus reveal that chromatin regions with similar compaction profiles are connected and form a continuous network throughout the entire nucleus. Finally, our analysis demonstrates that HP1β contributes not only to the increased condensation of heterochromatin but also to the tethering of condensed chromatin to the nuclear envelope corroborating the hypothesis that nuclear architecture is organized by the interplay of histone modifications, their readers, and nuclear envelope proteins that interact with them (Clowney et al., 2012; Kind et al., 2013; Pinheiro et al., 2012; Solovei et al., 2013; Towbin et al., 2012; Worman et al., 1988; Ye et al., 1997; Ye and Worman, 1996).
Results
Imaging intact cells in 3D
We used SXT to image three cell types of the olfactory epithelium, horizontal basal cells (HBCs), globose basal cells (GBCs), and mature olfactory sensory neurons (mOSNs) that correspond to multipotent stem cells, neuronal progenitors and terminally differentiated neurons, respectively. SXT images are collected using photons within the ‘water window’ (284–543 eV), where biomolecules absorb x-rays an order of magnitude more than the surrounding water. Since absorption adheres to the Beer-Lambert Law, it is linear with biochemical composition and concentration, generating a unique x-ray Linear Absorption Coefficient (LAC) measurement for each voxel (3D pixel analog), as shown in Figure 1 (Larabell and Le Gros, 2004; McDermott et al., 2009; McDermott et al., 2012b). Heterochromatin, due to an increased biomolecular concentration, appears darker than euchromatin in computer-generated SXT orthoslices (virtual sections) through the nucleus (Figure 1B) and is shown to map to the high-LAC voxels of the nucleus using the software program, Amira (Figure 1A, blue peak). To demonstrate the reproducible, quantitative capabilities of SXT LAC measurements, we measured the LAC of increasing concentrations of BSA and hemoglobin in vitro (Hanssen et al., 2012) and in vivo; the LAC of alcohol oxidase crystals in yeast is 0.626 μm−1 (Figure 1C), which is almost identical to the predicted LAC values based on theoretical calculations (0.625 μm−1) (Henke et al., 1993). We used the distinct SXT LAC values to automatically segment and color-code select cellular structures for 3D visualization of spatial information during differentiation, revealing changes in nuclear organization and chromatin topology (Figure 1E, and Videos S1–3).
Figure 1. Nuclear organization and chromatin topology in olfactory epithelial cells.

(A) Histogram plotting the volume (number of voxels) in an olfactory sensory neuron at each Linear Absorption Coefficient (LAC) value. There is a bimodal distribution of nuclear voxels, with regions containing fewer biomolecules per voxel (lower LAC values) color-coded shades of green and the more crowded regions color-coded shades of blue (higher LAC values); the cytoplasmic voxels are plotted in shades of grey.
(B) One orthoslice, or virtual section, from the x-ray tomographic reconstruction showing the nucleus (outlined with red) and surrounding cytoplasm. Visualization software (Amira) reveals the high-contrast (dark) heterochromatin maps to the higher LAC voxels of the nucleus histogram (blue) and lower contrast (light) euchromatin maps to the low-LAC regions (green).
(C) Orthoslice from SXT of the yeast, Pichia stipites, showing an alcohol oxidase crystal (arrow). The measured LAC value of the crystal is 0.626 μm−1 and the calculated LAC value (based on the atomic composition of the crystal) is 0.625 μm−1, confirming LAC measurements in vivo are quantitative.
(D) Sperm chromatin has a LAC value = 0.71 μm−1, indicating it is about 50 times more densely packed than the most dense portions of heterochromatin.
(E) Reorganization of cells obtained from mouse olfactory epithelium – multipotent stem cell, neuronal progenitor cell, and mature olfactory sensory neuron – during differentiation, segmented and color-coded to show heterochromatin (blue), euchromatin (green), and mitochondria (copper). Three orthogonal views through the nucleus (3D cutaway) reveal the shift of pericentromeric heterochromatin to the nucleus center. Scale bar, 1 μm.
Measuring chromatin compaction during differentiation
The fact that chromatin has a rather stable macromolecular composition of only nucleic acids and proteins, but has various degrees of compaction (i.e. various concentrations of these macromolecules per voxel), makes SXT an ideal method to quantify changes in chromatin compaction during olfactory epithelium differentiation. In all cells imaged, the mean heterochromatin LAC is 0.32 ± 0.02 μm−1 and the mean euchromatin LAC is 0.22 ± 0.02 μm−1, indicating that heterochromatin is ~ 30% more compacted than euchromatin. Heterochromatin LAC remains fairly constant during differentiation, while euchromatin LAC increases from 0.18 ± 0.01 μm−1 in stem cells to 0.21 ± 0.02 μm−1 in neuronal progenitors and 0.23 ± 0.01 μm−1 in mature neurons (Table S1). At the same time, the relative ratio of heterochromatin to euchromatin increases, suggesting an increasingly restrictive epigenetic landscape. Heterochromatin proportions increase from 0.33 ± 0.01 in stem cells to 0.36 ± 0.02 in progenitors and 0.41 ± 0.01 in mature neurons (Figure 2A–D, Table S1). This gradual increase is consistent with biochemical experiments in FAC-sorted cells from the olfactory epithelium, showing that 40MB of the olfactory receptor subgenome is not heterochromatic in stem cell populations of the olfactory epithelium, but instead heterochromatinization of receptor clusters initiates at the progenitor cell stage and is fully established in mature olfactory neurons (Magklara et al., 2011). The LAC values at all stages of differentiation are significantly lower than the LAC values of more tightly packed sperm chromatin (0.71 μm−1; Figure 1D) or the previously described olfactory receptor aggregates in mature neurons (0.55 μm−1, (Clowney et al., 2012). Interestingly, only the aggregates approach the theoretical LAC values of the 30nm fiber (0.44 μm−1), in agreement with recent cryo-electron spectroscopic imaging describing 10 but not 30 nm fibers in nuclear sections (Fussner et al., 2012; Nishino et al., 2012).
Figure 2. Chromatin compaction during neurogenesis.

(A–D) Histograms plotting the number of voxels in the nucleus with a measured linear absorption coefficient (LAC) value show the increase in percent volume of heterochromatin from 33% in a stem cell (A) to 36% in a neuronal progenitor (B) and 41% in a mature olfactory sensory neuron (C), plus the concomitant decreases in euchromatin and total nuclear volume during differentiation.
(E–H) Phasograms showing normalized counts of the number of nucleosome pairs at the distance apart in each set of genes. Expressed genes in each cell type had FPKM>1 and log2 fold change in that cell type. Silent genes have FPKM=0. Cell types shown are stem cells, neuronal progenitors, and mature neurons, respectively. Figure H: Normalized phasograms for all three cell types, genome-wide.
Previous reports suggest that transition from euchromatin to heterochromatin in vivo coincides with increased nucleosome phasing (Danzer and Wallrath, 2004). To obtain structural insight on the potential mechanisms resulting in differences of LAC values between euchromatin and heterochromatin we performed genome-wide nucleosome mapping in the three cell types. FAC-sorted stem cells, neuronal progenitors and mature olfactory sensory neurons were treated with micrococcal nuclease (MNase), and DNA isolated from mono-nucleosomes was subjected to Illumina sequencing (see Supplemental Iaterial). To correlate LAC values with chromatin structure we examined the phasing of nucleosomes over highly transcribed (top 25% of genes with Fragments Per Kilobase of transcript per Million (FPKM)>0) and completely silent (FPKM=0) genes, which we used to represent euchromatic and heterochromatic regions. In stem and progenitor cells, silent and active genes have almost indistinguishable nucleosome phasing, and only in mature neurons do we detect phasing or spacing differences between heterochromatin and euchromatin (Figures 2E-H, S1A). Notably, these differences do not stem only from an increase in heterochromatin phasing but also from a decrease in euchromatin phasing, likely related to the significant increase of gene body hydroxymethylation in highly transcribed genes of mature olfactory neurons (Colquitt et al., 2013). Moreover, despite an overall increase of x-ray absorption (LAC) values in mature cells, genome wide analysis of nucleosome phasing or spacing does not reveal any differences from undifferentiated cells, suggesting that primary nucleosome architecture has minimal influence on the tertiary chromatin folding and compaction in interphase. Indeed, although DNase protection and compaction of olfactory receptor loci increases during the transition from stem cell to the neuronal lineage (Magklara et al., 2011), nucleosome phasing on the receptors remains the same in the three cell populations (Figure S1B).
HP1β regulates heterochromatin compaction in mature olfactory neurons
Since changes in nucleosome phasing and spacing do not correlate with differences in chromatin compaction, we sought other factors that might influence the 3-dimensional packing of chromatin fibers. Recent studies revealed that HP1 proteins have homo-polymerization properties essential for heterochromatin spreading (Canzio et al., 2011; Canzio et al., 2013), which may also assist the proper association and folding of heterochromatin in trans. Since HP1β expression pattern in the olfactory epithelium follows the differentiation-dependent increase in chromatin compaction that we describe here, i.e. its expression starts in progenitors and peaks in mature neurons (Clowney et al., 2012), we sought to analyze the role of HP1β in chromatin compaction. We analyzed mature neurons from HP1β KO (Skarnes et al., 2011) and wild type littermates. The analysis was performed at E17.5 because the HP1β KO die perinatally, however mature neurons at this age have the same LAC properties and nuclear organization as those from adult mice. Loss of HP1β has profound effects on chromatin compaction in olfactory sensory neurons, resulting in a substantial increase of euchromatin and proportional decrease of heterochromatin to 0.23 ± 0.02 based on relative distribution of absorption (LAC) values (Figure 3A–C, Table S1). These changes are due to chromatin reorganization rather than a decrease in HP1β protein content since the total absorption values for HP1β KO olfactory neurons is not significantly different from that of the wildtype neurons. In addition, the volume of HP1β KO olfactory neurons is double the volume of wild type neurons, mimicking the effects of Lamin B receptor (LBR) overexpression in mature neurons, in which chromatin compaction is also markedly reduced (Clowney et al., 2012). These observations suggest that the proportion of euchromatin is a determining factor of the overall nuclear volume, a hypothesis supported by the linear relationship between the fraction of euchromatin and nuclear volumes (Figure 3D, Table S1).
Figure 3. HP1β regulates heterochromatin compaction in mature sensory neurons.

(A) Histogram plotting the number of voxels with a measured linear absorption coefficient (LAC) value in a control mature olfactory sensory neuron. (B) Histogram of LAC values in an HP1beta KO mature neuron shows the percent volume of heterochromatin decreased to 23%. (C) 3D cutaway through the x-ray tomograpm showing three orthogonal orthoslices (virtual sections) through the nucleus reveals loss of the central mass of pericentromeric heterochromatin. (D) Plotting the volume of heterochromatin and euchromatin with respect to total nuclear volume of stem, progenitor and mature cells shows that euchromatin is proportional to nuclear volume.
Imaging chromatin distribution in 3D
To determine if the developmentally regulated increase of chromatin compaction also reflects changes in the 3D chromatin architecture, we mapped the relative distribution of hetero- and eu-chromatin during differentiation. This analysis shows that in all nuclei examined, a 200 nm thick region just beneath the nuclear envelope contains predominantly heterochromatin, as has been described for many other cell types (Figure 4, Videos S4–7). However, the relative distribution of heterochromatin is dramatically different between the three cell types. Between 80–97% of the chromatin in the nuclear periphery of stem cells is heterochromatin, whereas in the inner regions of the nucleus it is mostly euchromatin (Figure 4A, Video S4). In contrast, mature neurons have an inverted chromatin ratio, with 70–80% heterochromatin in the nuclear center due to the large mass of pericentromeric heterochromatin that moves inward during differentiation (Figure 4C, Video S6), which is consistent with LBR downregulation during olfactory neurogenesis (Clowney et al., 2012). Neuronal progenitors have an intermediate chromatin distribution between the other two cell types (Figure 4B, Video S5). Importantly, in the HP1β KO olfactory neurons, the remaining heterochomatin is completely detached from the nuclear envelope (Figure 4D, Video S7), supporting the hypothesis that HP1 proteins mediate attachment of heterochromatin to the nuclear lamina (Worman et al., 1988; Ye and Worman, 1996).
Figure 4. Spatial distribution of chromatin.

Distribution of chromatin in a multipotent stem cell (A), neuronal progenitor (B), mature olfactory sensory neuron (C), and Hp1β KO mature neuron (D) seen in orthoslices (virtual sections) from the tomographic reconstructions and segmented views of the nuclei, both surface rendered and 3D cutaway volume rendered views, color-coded to represent heterochromatin (blue) and euchromatin (green). Plots showing the percent volume of heterochromatin (blue) and euchromatin (green) at increasing distances from the nuclear envelope quantify the reorganization of chromatin during differentiation (AC) and loss of heterochromatin in the Hp1β KO (D). Bar, 2 μm.
SXT reveals an interconnected network of heterochromatin
Visually tracking heterochromatin and euchromatin through an animation of consecutive orthoslices reveals a striking, highly interconnected network of chromatin with similar absorption values. Statistical analyses of voxel connectivity indicate that 98.4 ± 1.7% of the heterochromatin and 99.9 ± 0.1% of the euchromatin in all nuclei examined is connected. The interconnectivity is more easily seen after using ‘skeletonization’ software that ‘shrinks’ hetero- and eu-chromatin regions to backbone structures, revealing the underlying topological organization of chromatin (Figure 5, Videos S8–11). Remarkably, these connections are not dependent upon a specific spatial distribution of heterochromatin, and even the large central mass of pericentromeric heterochromatin of mature neurons remains connected to the peripheral heterochromatin (Figure 5). These data suggest that chromosomes are organized in a way that brings some portion of the heterochromatin of adjacent chromosomes in very close proximity; similarly, euchromatin regions of adjacent chromosomes also must be contiguous – a structural organization that would facilitate inter-chromosomal interactions. Indeed, recent analyses in olfactory neurons revealed that euchromatic sequences embedded in heterochromatic olfactory receptor gene clusters form frequent interchromosomal interactions (Markenscoff-Papadimitriou et al., 2014) that are completely dependent upon the aggregation of the receptor clusters. Thus, these data suggest that the organization of heterochromatin in a continuous lattice-like structure serves as an architectural platform that organizes parts of euchromatin, as we previously postulated for the organizational role of pericentromeric heterochromatin in interphase nuclei (Tjong et al., 2016). Although this continuity is observed in all cells analyzed for this study, it is unlikely to reflect stereotypic association between the same loci in every cell, since Hi-C experiments in multi-cell populations have not revealed extensive interchromosomal associations (Dixon et al., 2012; Sanyal et al., 2012; Sexton et al., 2012), and single cell analyses are consistent with extensive variability in 3D chromatin organization between cells (Kind et al., 2015; Nagano et al., 2013). Importantly, the continuity of heterochromatin fibers is not disrupted by deletion of HP1β, despite the fact that the proportion of heterochromatin is vastly reduced and the remaining heterochromatin has lost contacts with the nuclear envelope.
Figure 5. Heterochromatin continuity in nucleus.

Chromatin masses of the nuclei shown in Figure 4 were computationally reduced to skeletonized structures in the stem cell, neuronal progenitor, mature neuron and HP1β KO mature neuron to reveal the interconnected networks. The surface colormap of the skeletonized heterochromatin ranges from red through yellow to white; red reflects a thinner portion of heterochromatin, yellow thicker, and white the thickest region of heterochromatin (the pericentromeric heterochromatin is the white mass in the center of the mature neuron). The colormap of the skeletonized euchromatin ranges from blue (thinnest) to red (thickest); see colormaps. The starburst-like pattern seen in the HP1β KO euchromatin reveals the abnormally large mass of euchromatin in this nucleus. Bar, 2μm.
Developmental changes in nucleolar architecture
A well-characterized example of stereotypic and robust interchromosomal associations is the nucleolus, which constitutes an organizational hub of a large number of active and repressed ribosomal genes from multiple chromosomes. SXT allows the detection of nucleoli, which have tremendous variability in size, shape, and organization among the three differentiation stages (Figure 6). For example, the tripartite organization previously described (Thiry et al., 2011) is only apparent in mature neurons (Figure 6A, Video S12), which typically have two nucleoli juxtaposed to the pericentromeric heterochromatin located approximately 180 degrees apart. In these nucleoli the outermost and innermost zones, called the granular component and fibrillar centers respectively (Boisvert et al., 2007), have the highest absorption of 0.27 ± 0.01 μm−1 (Table S1). The central zone of the tripartite nucleolus forms a cup-shaped structure, the ‘dense fibrous core’, which based on SXT segmentation has two sub-zones of differing absorption values. The inner sub-zone in mature neurons has the lowest LAC in the nucleolus at 0.19 ± 0.01 μm−1 (Table S1), suggesting that this is the region where DNA is least compacted and transcription is likely to occur. The greatest variability in nucleolus organization is seen in neuronal progenitors and stem cells (Figure 6D and E), with volumes ranging from 0.3 μm3 to 2.2 μm3 and many oval rather than round nucleoli. This likely reflects that these are populations of cells at different stages of the cell cycle and differentiation, which is supported by the observation that the organization of different nucleoli in the same nucleus is remarkably similar (Figure 6E). Nucleoli in progenitor and stem cells also have varying numbers of highly absorbing discrete aggregates with absorption values between 0.29 – 0.33 μm−1 that probably are recently transcribed RNAs moving toward the nucleoplasm. Since nucleolar genes reside in multiple chromosomes, it is possible that the variability in the number of nucleoli and their architecture in less differentiated cells reflects the transitional state of heterochromatin and euchromatin in these cells, which only settles in its final configuration in post-mitotic mature neurons. Moreover, since nucleoli on their own play organizational roles for the surrounding chromatin, and contribute to the formation of Nucleolar-Associated Domains, it is possible that these architectural fluctuations are causal and not consequential for the overall chromatin organization (Matheson and Kaufman, 2016; Nemeth and Langst, 2011).
Figure 6. Nucleolus organization in olfactory epithelial cells.

(A, B) Immuno-FISH was used to image rDNA (red) and nucleolin (green) in the nucleolus of a mature neuron and SXT to image the native-state structure of nucleoli. Orthoslices and surface views were obtained by semi-automatic segmentation using linear absorption coefficient (LAC) values. A thin shell of the heterochromatin in contact with the nucleolus is shown in pale blue. (C) Second nucleolus from same neuron. Nucleoli from a neuronal progenitor (D) and stem cell (E); these nucleoli have numerous aggregates (dark blue) with absorption (LAC) values about 0.32 μm−1. Scale bars, 500 nm. Histograms of LAC values in nucleoli shown in A and B (F), D (G), and in E (H).
Because SXT images whole cells rather than thin sections it affords accurate 3D segmentation of various nucleolar structures and reveals continuity between the granular component and fibrillar center of mature neurons (Figure 6A and Video S12). In addition, SXT reveals that nucleoli are not fully immersed in heterochromatin as previously thought, with between 12% to 72% contact between nucleolar surface and euchromatin (Video S12). Retaining some connectivity with the less dense euchromatin likely provides a route for rRNA diffusion and efficient nuclear export.
A three dimensional heatmap of the mOSN nucleus
The demonstration that regions with intense transcriptional activity correspond to voxels with the lowest absorption values prompted us to search for additional low absorbing regions in the mature neuron nucleus. For this reason we generated heatmaps where the absorption plots are transformed to 3D representations of LAC values (Figure 7A), with an emphasis on the least absorbing nuclear regions. This analysis reveals a large number of nuclear “speckles” (30–41) with LAC ≤ 0.19 μm−1 in the euchromatic, but not heterochromatic, region (Figure 7B) that might correspond to nuclear factories of robust transcription (Eskiw et al., 2010). To test that, we performed DNA FISH with a probe constructed from a cDNA library prepared from mature neurons (Figures 7C and D). The signal from such a complex probe will be dominated by the most abundant cDNAs, therefore it represents a good method to detect the location of intense transcription in these nuclei. As seen in Figures 7C, D the number (22–39) and distribution of these transcription factories are comparable to the ones revealed by SXT.
Figure 7. Low LAC nuclear ‘speckle’ regions of the nucleus.

(A) Heat map of linear x-ray absorption coefficient (LAC) values of a mature cell nucleus color-coded from green (euchromatin) to blue (heterochromatin); lowest LAC values were color-coded red. (B) SXT 3D cutaway view of the volume rendered mature neuron nucleus color-coded to reflect the chromatin distribution shown in the heat map in A; nucleolus (color-coded orange) is circled in yellow. (C) cDNA labeled transcription sites in olfactory epithelial cells. (D) High magnification view of cDNA sites in a single nucleus. Scale bars, 1 μm (B, D), 5 μm (C).
Discussion
SXT: a powerful method for nuclear imaging
SXT provides a powerful method to study chromatin and nuclear architecture in vivo. Because X-rays can penetrate the whole cell, there is no need for sectioning or fixation. Thus it allows imaging of intact cells under native conditions, preventing a plethora of artifacts introduced either by fixatives or by visualization of only thin sections. Moreover, since tomographic imaging of each cell is completed in minutes, data from multiple like cells can be averaged, providing statistically significant measures that may not be practical or even feasible with other high-resolution imaging methods. Finally, since x-ray absorption depends upon the concentration of organic material in each voxel, SXT is “polychromatic” and not only detects multiple cellular structures but also provides quantitative assessments about their composition or structure. As a result, chromatin with a predominantly nucleoprotein composition, but various degrees of compaction and an elaborate 3D architecture, provides an ideal biological specimen for this technology.
As a proof-of-principle experiment we imaged cells from distinct differentiation stages of mouse olfactory epithelium. Our analysis shows that cellular differentiation and specialization occur with a concomitant increase of chromatin compaction in vivo, as we also observed occurring during hematopoiesis (Ugarte et al., 2015). Without a doubt, although this is a nucleus-wide phenomenon, some genomic loci may escape this trend and follow the inverse chromatin compaction direction; recent findings in C. elegans demonstrated that neuron-specific expression is achieved by lineage specific and differentiation-dependent chromatin decompaction (Cochella and Hobert, 2012).
Surprisingly, changes in X-ray absorption properties did not correlate with changes in the primary chromatin architecture, since nucleosomal phasing and spacing appear essentially identical between the three cell types examined; this is consistent with recent findings describing similar nucleosomal structure between interphase and meiotic chromosomes in yeast (Zhang et al., 2011). In contrast, our data support a role of HP1β in the generation of highly absorbing chromatin structures. This result is in agreement with recent data suggesting that HP1 family members have homo-polymerization properties that may assist inter-strand associations of heterochromatic fibers resulting in the formation of higher-order heterochromatic structures (Canzio et al., 2011; Canzio et al., 2013).
Differentiation dependent associations with the nuclear lamina
In addition to changes in the biophysical properties of chromatin our analyses also describe the gradual relocation of heterochromatin from the nuclear periphery, where it is predominantly located in stem cells, to the nuclear core in mature neurons. This relocation, which was previously thought to be a specific retinal adaptation for nocturnal animals (Solovei et al., 2009), appears to be a general theme observed in many differentiating tissues including the mouse olfactory epithelium (Clowney et al., 2012; Solovei et al., 2013). What other approaches fail to detect is that a small portion of heterochromatin remains in contact with the nuclear lamina, and this contact relies on the function of HP1β. Thus, the exact network of interactions between the nuclear lamina and the genome depends on the protein components of the nuclear envelope, the epigenetic state of the genome and the availability of specific proteins that interpret these epigenetic signals and mediate interactions with the nuclear lamina.
Global chromatin connectivity
The 3D segmentation of high-resolution images provided by SXT reveals an unappreciated interconnectivity between distinct forms of chromatin. The continuous nature of like-chromatin, which is evident even in the nucleolus, supports the existence of non-stereotypic but extensive interactions between different chromosomes, which might have significant regulatory roles in transcription and other nuclear processes. Although sequence-specific association of co-regulated genomic loci is appealing, random interactions between loci with shared chromatin properties might be an equally effective way of modulating transcription levels. In that regard, separating compacted from non-compacted chromatin fibers (Bantignies et al., 2011; Clowney et al., 2012; Markenscoff-Papadimitriou et al., 2014) could be a more urgent task for the maintenance of a cell-type specific expression program than the convergence of co-regulated loci. In this regard, interchromosomal association of co-regulated loci (Clowney et al., 2012; Markenscoff-Papadimitriou et al., 2014) due to its stochastic nature may be suitable only for biological systems that tolerate, or even seek, stochasticity like the olfactory and the immune systems (Dekker and Mirny, 2016; Monahan and Lomvardas, 2015; Proudhon et al., 2015; Raviram et al., 2016). Nevertheless, non-stereotypic convergence of multiple gene loci (Osborne et al., 2007) and regulatory sequences in transcription factories (Li et al., 2012a) may also contribute to their co-regulation and their transcription at similar rates at a cellular population level.
Our analyses demonstrate that SXT is a powerful technology for the study of chromatin and nuclear architecture during cellular differentiation in vivo. Moreover, as shown here, combining SXT with genetic manipulations, or with fluorescence imaging as we showed previously (Smith et al., 2014), generates valuable insight towards the understanding of the organizing principles and molecular composition of nuclear chromatin compartments.
Experimental Procedures
Mice
Mice were housed under standard conditions in accordance with IACUC regulations; HP1β KO mice were obtained from Eucomm (details in Supplemental Experimental Procedures).
Nucleosome mapping and analysis
Mapping reads
Paired end reads were trimmed so that all datasets had reads of the same length: for reads longer than 51 basepairs the first 51 basepairs of the read were retained. Paired end reads were mapped to the mm9 genome using the Burrows-Wheeler Alignment (Li and Durbin, 2009) algorithm in backtrack paired-end mode. Potential PCR duplicates were removed using samtools (Li et al., 2009), which removed reads with identical external coordinates. Reads that had a quality score of less than 30 were filtered out. Additionally, we required that reads be properly paired, with correct orientation and of reasonable insert size, based on an estimated inset size distribution1.
Phasograms
Phasograms were calculated using a similar method to Valouev et al (Valouev, 2011). Midpoints of the remaining high-quality read pairs were used to approximate the nucleosome positions. For each genomic position we tallied the number of nucleosome midpoints that were found for each cell type (stem cell, neuronal progenitor and mature neuron), filtering on any conditions as appropriate. Specifically, for silent genes we looked only at midpoints within genes with FPKM>1 and 2-fold expression in the specified cell type compared to the other cell types. We set the “pile” argument equal to 3, as previously suggested (Valouev et al., 2011), filtering out any midpoint positions that had less than 3 reads with midpoints at that position. Finally, by calculating the distance between every pair of remaining midpoint locations, we obtained raw phasograms.
To compare phasograms across cell types or conditions, we normalized each phasogram. For the phasograms showing nucleosome midpoints in known OR genes, we calculated the best linear regression fit to the data for between 101 and 750 basepairs, and then divided the raw counts by the corresponding point in the linear model. This was done to compensate for the relatively low presence of MNase-Seq reads in OR genes, causing a strong decreasing linear correlation between the number of nucleosome midpoints and their distance apart. The range of 101 and 750 basepairs was chosen because deltas of 0–100 basepairs resulted in very noisy counts, whereas deltas of more than 750 basepairs resulted in counts that quickly dropped to 0. For all other phasograms there was a high coverage of nucleosome midpoints in the given regions, so the linear correction was not needed. Therefore, the raw counts were divided by its base midpoint count, which was the mean number of midpoint pairs at a distance between 1000 and 2000 basepairs apart. All comparison phasograms (across condition or cell type) show normalized phasograms.
Periodicities
Nucleosome periodicities were calculated by quantifying the periodicity of the phasograms, as done previously (Valouev, 2011). We calculated a linear regression of the peaks in the phasograms using an estimated prior periodicity of 200 bps. We assume a peak at a distance of 0, and then identify the locations of the remaining peaks as the maximum in each 200 basepair window, starting at a position of 100 bps. This is repeated until a distance of 1300, and then a linear model is fitted to all of the identified peaks. The slope of the best-fit line is the estimated periodicity, while the R2 value (coefficient of determination) is used to estimate the fit of the model.
Soft X-ray Tomography
Neurons were rapidly frozen in liquid nitrogen cooled propane and imaged at 517 eV using a soft X-ray microscope as described previously (Le Gros et al., 2005; McDermott et al., 2009). LAC values were determined as described previously (Weiss et al., 2001). See also Supplemental Experimental Procedures.
Soft X-ray Tomography Data analyses
Nuclear Segmentation, Figures 1,3,5
Nuclear volumes were manually segmented from full tomographic reconstructions for each cell and filtered (3D median filter using MATLAB medfilt, window size 4). LAC histograms were calculated generating a bimodal LAC histogram for each nucleus. To accurately locate the peaks of the bimodal LAC distribution, a cubic interpolation routine (MATLAB code) was used to add more points close to the histogram maxima. The local maxima of euchromatin and heterochromatin were obtained from the interpolated histogram. The LAC threshold value corresponding to the transition between euchromatin and heterochromatin was found by taking the average of the euchromatin and heterochromatin local maxima. This definition of the euchromatin-heterochromatin transition LAC was the threshold value used to automatically segment the nuclear volume of each nucleus into the euchromatic and heterochromatic regions. Voxels with a LAC above the threshold value were assigned to heterochromatin; those below the threshold were assigned to euchromatin. These assignments agree with those obtained by manual segmentation and are consistent with traditional classifications from TEM micrographs of stained plastic sections.
Connectivity
Connectivity was estimated by calculating the fraction of the largest connected region from the total volume for either heterochromatin or euchromatin. For the heterochromatin fraction, the largest connected region from the total volume was 0.984±0.017 and for euchromatin it was 0.9989±0.0011.
Skeletonization
Using the program Amira (VSG, Visualization Sciences Group, an FEI Company), a binarized volume was created from the segmented data set by assigning unity to each voxel of heterochromatin and zero to all other voxels in the reconstruction. A distance transform (Blum, 1973) was applied to the binarized volume; this transform assigns a gray level value to each non-zero voxel that is proportional to the closest distance of that voxel to the boundary of heterochromatin. A medial axis transform (MAT) (Du and Hong, 2004) is then applied to the distance map; this transform selects voxels that are the locus of local maxima of the distance transform. The MAT of the distance map is similar to a skeletonization of the heterochromatic binarized volume, where the volume has been uniformly eroded to leave a skeleton-like structure with a minimum width of one voxel. However, the MAT of the distance map replaces the voxel values of the heterochromatin skeleton with the distance of a skeleton voxel to the edge of the original binarized heterochromatic volume. The MAT is then visualized by assigning a tubular surface to each branch of the MAT skeleton where the diameter and color of the tube represents the minimum distance of the MAT skeleton to the boundary of the heterochromatic and euchromatic regions. This visualization conveys both the connectivity and thickness of all heterochromatin in the nucleus. Euchromatin was skeletonized using the same approach.
Sub-nuclear and cytoplasmic structure analysis and visualization
The outer boundary of each nucleolus was obtained by manual segmentation. Segmentation of nucleolar substructure was performed using semi-automatic segmentation based on the LAC range determined for each component within each cell type (see Table S1). The transcription regions in the euchromatic region of the nucleus were automatically segmented using a LAC value derived from the transcriptionally active region of the nucleolus, specifically LAC range < 0.19 μm−1. After segmentation the assigned regions were visualized using standard solid or transparent surface rendering (Rosenblum, 1994) and 3D volume rendering (Peng et al., 2010) using the software package Amira.
Immuno-DNA FISH
DNA FISH experiments and confocal images were generated as described previously (Clowney et al., 2012) with modifications described in the Supplemental Experimental Procedures.
Supplementary Material
Highlights.
Soft X-ray tomography reveals chromatin networks in olfactory neurons
Chromatin compaction increases during olfactory neurogenesis
Condensed chromatin moves to nuclear core during differentiation
HP1β regulates reorganization of chromatin in mature neurons
Acknowledgments
Research reported in this publication was supported by grants from NIH (R01DA030320 and U01DA040582 to SL and CAL). The National Center for X-ray Tomography is supported by NIH (P41GM103445) and DOE’s Office of Biological and Environmental Research (DE-AC02-5CH11231).
Footnotes
Author Contributions
Conceptualization, S.L. and C.A.L.; cell preparation, DNA FISH, IF, E.J.C. and E.M-P.; ChiPS, Mnase-seq, A.M.; nucleosome mapping, A.Y., B.C. and M.K.; SXT data collection and analysis, M.A.L., M.M., and C.A.L.; writing and editing, S.L., M.A.L., and C.A.L.; funding acquisition, S.L. and C.A.L.
Publisher's Disclaimer: This is a PDF file of an unedited manuscript that has been accepted for publication. As a service to our customers we are providing this early version of the manuscript. The manuscript will undergo copyediting, typesetting, and review of the resulting proof before it is published in its final citable form. Please note that during the production process errors may be discovered which could affect the content, and all legal disclaimers that apply to the journal pertain.
Contributor Information
Mark A. Le Gros, Email: Mark.LeGros@ucsf.edu.
E. Josephine Clowney, Email: extrajos@gmail.com.
Angeliki Magklara, Email: magklara@cc.uoi.gr.
Angela Yen, Email: angela@mit.edu.
Eirene Markenscoff-Papadimitriou, Email: Eirene.Markenscoff-Papadimitrious@ucsf.edu.
Bradley Colquitt, Email: Bradley.Colquitt@ucsf.edu.
Markko Myllys, Email: markko.myllys@gmail.com.
Manolis Kellis, Email: manoli@mit.edu.
Stavros Lomvardas, Email: sl682@cumc.columbia.edu.
Carolyn A. Larabell, Email: Carolyn.Larabell@ucsf.edu.
References
- Alexander JM, Lomvardas S. Nuclear architecture as an epigenetic regulator of neural development and function. Neuroscience. 2014;264:39–50. doi: 10.1016/j.neuroscience.2014.01.044. [DOI] [PMC free article] [PubMed] [Google Scholar]
- Bantignies F, Roure V, Comet I, Leblanc B, Schuettengruber B, Bonnet J, Tixier V, Mas A, Cavalli G. Polycomb-dependent regulatory contacts between distant Hox loci in Drosophila. Cell. 2011;144:214–226. doi: 10.1016/j.cell.2010.12.026. [DOI] [PubMed] [Google Scholar]
- Bernstein BE, Mikkelsen TS, Xie X, Kamal M, Huebert DJ, Cuff J, Fry B, Meissner A, Wernig M, Plath K, et al. A bivalent chromatin structure marks key developmental genes in embryonic stem cells. Cell. 2006;125:315–326. doi: 10.1016/j.cell.2006.02.041. [DOI] [PubMed] [Google Scholar]
- Bickmore WA, van Steensel B. Genome architecture: domain organization of interphase chromosomes. Cell. 2013;152:1270–1284. doi: 10.1016/j.cell.2013.02.001. [DOI] [PubMed] [Google Scholar]
- Blum H. Biological shape and visual science. I. J Theor Biol. 1973;38:205–287. doi: 10.1016/0022-5193(73)90175-6. [DOI] [PubMed] [Google Scholar]
- Boisvert FM, van Koningsbruggen S, Navascues J, Lamond AI. The multifunctional nucleolus. Nat Rev Mol Cell Biol. 2007;8:574–585. doi: 10.1038/nrm2184. [DOI] [PubMed] [Google Scholar]
- Canzio D, Chang EY, Shankar S, Kuchenbecker KM, Simon MD, Madhani HD, Narlikar GJ, Al-Sady B. Chromodomain-mediated oligomerization of HP1 suggests a nucleosome-bridging mechanism for heterochromatin assembly. Mol Cell. 2011;41:67–81. doi: 10.1016/j.molcel.2010.12.016. [DOI] [PMC free article] [PubMed] [Google Scholar]
- Canzio D, Liao M, Naber N, Pate E, Larson A, Wu S, Marina DB, Garcia JF, Madhani HD, Cooke R, et al. A conformational switch in HP1 releases auto-inhibition to drive heterochromatin assembly. Nature. 2013 doi: 10.1038/nature12032. [DOI] [PMC free article] [PubMed] [Google Scholar]
- Cavalli G, Misteli T. Functional implications of genome topology. Nat Struct Mol Biol. 2013;20:290–299. doi: 10.1038/nsmb.2474. [DOI] [PMC free article] [PubMed] [Google Scholar]
- Clowney EJ, Legros MA, Mosley CP, Clowney FG, Markenskoff-Papadimitriou EC, Myllys M, Barnea G, Larabell CA, Lomvardas S. Nuclear aggregation of olfactory receptor genes governs their monogenic expression. Cell. 2012;151:724–737. doi: 10.1016/j.cell.2012.09.043. [DOI] [PMC free article] [PubMed] [Google Scholar]
- Cochella L, Hobert O. Embryonic Priming of a miRNA Locus Predetermines Postmitotic Neuronal Left/Right Asymmetry in C. elegans. Cell. 2012;151:1229–1242. doi: 10.1016/j.cell.2012.10.049. [DOI] [PMC free article] [PubMed] [Google Scholar]
- Colquitt BM, Allen WE, Barnea G, Lomvardas S. Alteration of genic 5-hydroxymethylcytosine patterning in olfactory neurons correlates with changes in gene expression and cell identity. Proc Natl Acad Sci U S A. 2013;110:14682–14687. doi: 10.1073/pnas.1302759110. [DOI] [PMC free article] [PubMed] [Google Scholar]
- Danzer JR, Wallrath LL. Mechanisms of HP1-mediated gene silencing in Drosophila. Development. 2004;131:3571–3580. doi: 10.1242/dev.01223. [DOI] [PubMed] [Google Scholar]
- Dekker J, Mirny L. The 3D Genome as Moderator of Chromosomal Communication. Cell. 2016;164:1110–1121. doi: 10.1016/j.cell.2016.02.007. [DOI] [PMC free article] [PubMed] [Google Scholar]
- Dixon JR, Selvaraj S, Yue F, Kim A, Li Y, Shen Y, Hu M, Liu JS, Ren B. Topological domains in mammalian genomes identified by analysis of chromatin interactions. Nature. 2012;485:376–380. doi: 10.1038/nature11082. [DOI] [PMC free article] [PubMed] [Google Scholar]
- Du H, Hong Q. Medial axis extraction and shape manipulation of solid objects using parabolic PDEs. The Eurographics Association; 2004. p. 27. [Google Scholar]
- Eskiw CH, Cope NF, Clay I, Schoenfelder S, Nagano T, Fraser P. Transcription factories and nuclear organization of the genome. Cold Spring Harb Symp Quant Biol. 2010;75:501–506. doi: 10.1101/sqb.2010.75.046. [DOI] [PubMed] [Google Scholar]
- Fussner E, Strauss M, Djuric U, Li R, Ahmed K, Hart M, Ellis J, Bazett-Jones DP. Open and closed domains in the mouse genome are configured as 10-nm chromatin fibres. EMBO Rep. 2012 doi: 10.1038/embor.2012.139. [DOI] [PMC free article] [PubMed] [Google Scholar]
- Gonzalez-Sandoval A, Towbin BD, Kalck V, Cabianca DS, Gaidatzis D, Hauer MH, Geng L, Wang L, Yang T, Wang X, et al. Perinuclear Anchoring of H3K9-Methylated Chromatin Stabilizes Induced Cell Fate in C. elegans Embryos. Cell. 2015;163:1333–1347. doi: 10.1016/j.cell.2015.10.066. [DOI] [PubMed] [Google Scholar]
- Hanssen E, Knoechel C, Dearnley M, Dixon MW, Le Gros M, Larabell C, Tilley L. Soft X-ray microscopy analysis of cell volume and hemoglobin content in erythrocytes infected with asexual and sexual stages of Plasmodium falciparum. J Struct Biol. 2012;177:224–232. doi: 10.1016/j.jsb.2011.09.003. [DOI] [PMC free article] [PubMed] [Google Scholar]
- Hawkins RD, Hon GC, Lee LK, Ngo Q, Lister R, Pelizzola M, Edsall LE, Kuan S, Luu Y, Klugman S, et al. Distinct epigenomic landscapes of pluripotent and lineagecommitted human cells. Cell Stem Cell. 2010;6:479–491. doi: 10.1016/j.stem.2010.03.018. [DOI] [PMC free article] [PubMed] [Google Scholar]
- Henke BL, Gullikson EM, Davis JC. X-ray interactions: Photoabsorption, scattering, transmission, and reflection at E = 50–30,000 eV, Z = 1–92. At Data Nucl Data Tables. 1993;54(2):181–342. [Google Scholar]
- Kind J, Pagie L, de Vries SS, Nahidiazar L, Dey SS, Bienko M, Zhan Y, Lajoie B, de Graaf CA, Amendola M, et al. Genome-wide maps of nuclear lamina interactions in single human cells. Cell. 2015;163:134–147. doi: 10.1016/j.cell.2015.08.040. [DOI] [PMC free article] [PubMed] [Google Scholar]
- Kind J, Pagie L, Ortabozkoyun H, Boyle S, de Vries SS, Janssen H, Amendola M, Nolen LD, Bickmore WA, van Steensel B. Single-cell dynamics of genome-nuclear lamina interactions. Cell. 2013;153:178–192. doi: 10.1016/j.cell.2013.02.028. [DOI] [PubMed] [Google Scholar]
- Kohwi M, Lupton JR, Lai SL, Miller MR, Doe CQ. Developmentally regulated subnuclear genome reorganization restricts neural progenitor competence in Drosophila. Cell. 2013;152:97–108. doi: 10.1016/j.cell.2012.11.049. [DOI] [PMC free article] [PubMed] [Google Scholar]
- Larabell CA, Le Gros MA. X-ray tomography generates 3-D reconstructions of the yeast, saccharomyces cerevisiae, at 60-nm resolution. Mol Biol Cell. 2004;15:957–962. doi: 10.1091/mbc.E03-07-0522. [DOI] [PMC free article] [PubMed] [Google Scholar]
- Le Gros M, Knoechel CG, Parkinson DY, McDermott G, Larabell CA. Visualizing sub-cellular organization using soft x-ray tomography. In: Egelman EH, editor. Comprehensive Biophysics. Oxford: Elsevier; 2012. pp. 90–110. [Google Scholar]
- Le Gros MA, McDermott G, Larabell CA. X-ray tomography of whole cells. Curr Opin Struct Biol. 2005;15:593–600. doi: 10.1016/j.sbi.2005.08.008. [DOI] [PubMed] [Google Scholar]
- Li G, Ruan X, Auerbach RK, Sandhu KS, Zheng M, Wang P, Poh HM, Goh Y, Lim J, Zhang J, et al. Extensive promoter-centered chromatin interactions provide a topological basis for transcription regulation. Cell. 2012a;148:84–98. doi: 10.1016/j.cell.2011.12.014. [DOI] [PMC free article] [PubMed] [Google Scholar]
- Li H, Durbin R. Fast and accurate short read alignment with Burrows-Wheeler transform. Bioinformatics. 2009;25:1754–1760. doi: 10.1093/bioinformatics/btp324. [DOI] [PMC free article] [PubMed] [Google Scholar]
- Li H, Handsaker B, Wysoker A, Fennell T, Ruan J, Homer N, Marth G, Abecasis G, Durbin R Genome Project Data P. The Sequence Alignment/Map format and SAMtools. Bioinformatics. 2009;25:2078–2079. doi: 10.1093/bioinformatics/btp352. [DOI] [PMC free article] [PubMed] [Google Scholar]
- Li JY, Patterson M, Mikkola HK, Lowry WE, Kurdistani SK. Dynamic distribution of linker histone H1.5 in cellular differentiation. PLoS genetics. 2012b;8:e1002879. doi: 10.1371/journal.pgen.1002879. [DOI] [PMC free article] [PubMed] [Google Scholar]
- Magklara A, Yen A, Colquitt BM, Clowney EJ, Allen W, Markenscoff-Papadimitriou E, Evans ZA, Kheradpour P, Mountoufaris G, Carey C, et al. An epigenetic signature for monoallelic olfactory receptor expression. Cell. 2011;145:555–570. doi: 10.1016/j.cell.2011.03.040. [DOI] [PMC free article] [PubMed] [Google Scholar]
- Markenscoff-Papadimitriou E, Allen WE, Colquitt BM, Goh T, Murphy KK, Monahan K, Mosley CP, Ahituv N, Lomvardas S. Enhancer interaction networks as a means for singular olfactory receptor expression. Cell. 2014;159:543–557. doi: 10.1016/j.cell.2014.09.033. [DOI] [PMC free article] [PubMed] [Google Scholar]
- Matheson TD, Kaufman PD. Grabbing the genome by the NADs. Chromosoma. 2016;125:361–371. doi: 10.1007/s00412-015-0527-8. [DOI] [PMC free article] [PubMed] [Google Scholar]
- McDermott G, Fox DM, Epperly L, Wetzler M, Barron AE, Le Gros MA, Larabell CA. Visualizing and quantifying cell phenotype using soft X-ray tomography. BioEssays. 2012a;34:320–327. doi: 10.1002/bies.201100125. [DOI] [PMC free article] [PubMed] [Google Scholar]
- McDermott G, Le Gros MA, Knoechel CG, Uchida M, Larabell CA. Soft X-ray tomography and cryogenic light microscopy: the cool combination in cellular imaging. Trends Cell Biol. 2009;19:587–595. doi: 10.1016/j.tcb.2009.08.005. [DOI] [PMC free article] [PubMed] [Google Scholar]
- McDermott G, Le Gros MA, Larabell CA. Visualizing cell architecture and molecular location using soft x-ray tomography and correlated cryo-light microscopy. Annu Rev Phys Chem. 2012b;63:225–239. doi: 10.1146/annurev-physchem-032511-143818. [DOI] [PMC free article] [PubMed] [Google Scholar]
- Monahan K, Lomvardas S. Monoallelic expression of olfactory receptors. Annu Rev Cell Dev Biol. 2015;31:721–740. doi: 10.1146/annurev-cellbio-100814-125308. [DOI] [PMC free article] [PubMed] [Google Scholar]
- Nagano T, Lubling Y, Stevens TJ, Schoenfelder S, Yaffe E, Dean W, Laue ED, Tanay A, Fraser P. Single-cell Hi-C reveals cell-to-cell variability in chromosome structure. Nature. 2013;502:59–64. doi: 10.1038/nature12593. [DOI] [PMC free article] [PubMed] [Google Scholar]
- Nemeth A, Langst G. Genome organization in and around the nucleolus. Trends Genet. 2011;27:149–156. doi: 10.1016/j.tig.2011.01.002. [DOI] [PubMed] [Google Scholar]
- Nishino Y, Eltsov M, Joti Y, Ito K, Takata H, Takahashi Y, Hihara S, Frangakis AS, Imamoto N, Ishikawa T, et al. Human mitotic chromosomes consist predominantly of irregularly folded nucleosome fibres without a 30-nm chromatin structure. EMBO J. 2012;31:1644–1653. doi: 10.1038/emboj.2012.35. [DOI] [PMC free article] [PubMed] [Google Scholar]
- Osborne CS, Chakalova L, Mitchell JA, Horton A, Wood AL, Bolland DJ, Corcoran AE, Fraser P. Myc dynamically and preferentially relocates to a transcription factory occupied by Igh. PLoS Biol. 2007;5:e192. doi: 10.1371/journal.pbio.0050192. [DOI] [PMC free article] [PubMed] [Google Scholar]
- Peng H, Ruan Z, Long F, Simpson JH, Myers EW. V3D enables real-time 3D visualization and quantitative analysis of large-scale biological image data sets. Nat Biotechnol. 2010;28:348–353. doi: 10.1038/nbt.1612. [DOI] [PMC free article] [PubMed] [Google Scholar]
- Pinheiro I, Margueron R, Shukeir N, Eisold M, Fritzsch C, Richter FM, Mittler G, Genoud C, Goyama S, Kurokawa M, et al. Prdm3 and Prdm16 are H3K9me1 methyltransferases required for mammalian heterochromatin integrity. Cell. 2012;150:948–960. doi: 10.1016/j.cell.2012.06.048. [DOI] [PubMed] [Google Scholar]
- Proudhon C, Hao B, Raviram R, Chaumeil J, Skok JA. Long-Range Regulation of V(D)J Recombination. Adv Immunol. 2015;128:123–182. doi: 10.1016/bs.ai.2015.07.003. [DOI] [PMC free article] [PubMed] [Google Scholar]
- Raviram R, Rocha PP, Muller CL, Miraldi ER, Badri S, Fu Y, Swanzey E, Proudhon C, Snetkova V, Bonneau R, et al. 4C-ker: A Method to Reproducibly Identify Genome-Wide Interactions Captured by 4C-Seq Experiments. PLoS Comput Biol. 2016;12:e1004780. doi: 10.1371/journal.pcbi.1004780. [DOI] [PMC free article] [PubMed] [Google Scholar]
- Rosenblum LJaA, Pand Detlef T. Scientific Visualization: Advances and challenges. London: Elsevier Science and Technology Books; 1994. [Google Scholar]
- Sanyal A, Lajoie BR, Jain G, Dekker J. The long-range interaction landscape of gene promoters. Nature. 2012;489:109–113. doi: 10.1038/nature11279. [DOI] [PMC free article] [PubMed] [Google Scholar]
- Sexton T, Yaffe E, Kenigsberg E, Bantignies F, Leblanc B, Hoichman M, Parrinello H, Tanay A, Cavalli G. Three-dimensional folding and functional organization principles of the Drosophila genome. Cell. 2012;148:458–472. doi: 10.1016/j.cell.2012.01.010. [DOI] [PubMed] [Google Scholar]
- Skarnes WC, Rosen B, West AP, Koutsourakis M, Bushell W, Iyer V, Mujica AO, Thomas M, Harrow J, Cox T, et al. A conditional knockout resource for the genome-wide study of mouse gene function. Nature. 2011;474:337–U361. doi: 10.1038/nature10163. [DOI] [PMC free article] [PubMed] [Google Scholar]
- Smith EA, McDermott G, Do M, Leung K, Panning B, Le Gros MA, Larabell CA. Quantitatively imaging chromosomes by correlated cryo-fluorescence and soft xray tomographies. Biophys J. 2014;107:1988–1996. doi: 10.1016/j.bpj.2014.09.011. [DOI] [PMC free article] [PubMed] [Google Scholar]
- Solovei I, Kreysing M, Lanctot C, Kosem S, Peichl L, Cremer T, Guck J, Joffe B. Nuclear Architecture of Rod Photoreceptor Cells Adapts to Vision in Mammalian Evolution. Cell. 2009;137:356–368. doi: 10.1016/j.cell.2009.01.052. [DOI] [PubMed] [Google Scholar]
- Solovei I, Wang AS, Thanisch K, Schmidt CS, Krebs S, Zwerger M, Cohen TV, Devys D, Foisner R, Peichl L, et al. LBR and Lamin A/C Sequentially Tether Peripheral Heterochromatin and Inversely Regulate Differentiation. Cell. 2013;152:584–598. doi: 10.1016/j.cell.2013.01.009. [DOI] [PubMed] [Google Scholar]
- Thiry M, Lamaye F, Lafontaine DL. The nucleolus: when 2 became 3. Nucleus. 2011;2:289–293. doi: 10.4161/nucl.2.4.16806. [DOI] [PubMed] [Google Scholar]
- Tjong H, Li W, Kalhor R, Dai C, Hao S, Gong K, Zhou Y, Li H, Zhou XJ, Le Gros MA, et al. Population-based 3D genome structure analysis reveals driving forces in spatial genome organization. Proc Natl Acad Sci U S A. 2016;113:E1663–1672. doi: 10.1073/pnas.1512577113. [DOI] [PMC free article] [PubMed] [Google Scholar]
- Towbin BD, Gonzalez-Aguilera C, Sack R, Gaidatzis D, Kalck V, Meister P, Askjaer P, Gasser SM. Step-Wise Methylation of Histone H3K9 Positions Heterochromatin at the Nuclear Periphery. Cell. 2012;150:934–947. doi: 10.1016/j.cell.2012.06.051. [DOI] [PubMed] [Google Scholar]
- Ugarte F, Sousae R, Cinquin B, Martin EW, Krietsch J, Sanchez G, Inman M, Tsang H, Warr M, Passegue E, et al. Progressive Chromatin Condensation and H3K9 Methylation Regulate the Differentiation of Embryonic and Hematopoietic Stem Cells. Stem Cell Reports. 2015;5:728–740. doi: 10.1016/j.stemcr.2015.09.009. [DOI] [PMC free article] [PubMed] [Google Scholar]
- Valouev A, Johnson SM, Boyd SD, Smith CL, Fire AZ, Sidow A. Determinants of nucleosome organization in primary human cells. Nature. 2011;474:516–U148. doi: 10.1038/nature10002. [DOI] [PMC free article] [PubMed] [Google Scholar]
- Valouev A, Johnson S, Boyd S, Smith C, Fire A, Sidow A. Determinants of nucleosome organization in primary human cells. Nature. 2011;474:516–520. doi: 10.1038/nature10002. [DOI] [PMC free article] [PubMed] [Google Scholar]
- Van Bortle K, Corces VG. Spinning the web of cell fate. Cell. 2013;152:1213–1217. doi: 10.1016/j.cell.2013.02.052. [DOI] [PMC free article] [PubMed] [Google Scholar]
- Weiss D, Schneider G, Vogt S, Guttmann P, Niemann B, Rudolph D, Schmahl G. Tomographic imaging of biological specimens with the cryo transmission X-ray microscope. Nuclear Instruments & Methods in Physics Research Section A-Accelerators Spectrometers Detectors & Associated Equipment. 2001;467:1308–1311. [Google Scholar]
- Worman HJ, Yuan J, Blobel G, Georgatos SD. A lamin B receptor in the nuclear envelope. Proc Natl Acad Sci U S A. 1988;85:8531–8534. doi: 10.1073/pnas.85.22.8531. [DOI] [PMC free article] [PubMed] [Google Scholar]
- Ye Q, Callebaut I, Pezhman A, Courvalin JC, Worman HJ. Domain-specific interactions of human HP1-type chromodomain proteins and inner nuclear membrane protein LBR. J Biol Chem. 1997;272:14983–14989. doi: 10.1074/jbc.272.23.14983. [DOI] [PubMed] [Google Scholar]
- Ye Q, Worman HJ. Interaction between an integral protein of the nuclear envelope inner membrane and human chromodomain proteins homologous to Drosophila HP1. J Biol Chem. 1996;271:14653–14656. doi: 10.1074/jbc.271.25.14653. [DOI] [PubMed] [Google Scholar]
- Zhang LY, Ma H, Pugh BF. Stable and dynamic nucleosome states during a meiotic developmental process. Genome Res. 2011;21:875–884. doi: 10.1101/gr.117465.110. [DOI] [PMC free article] [PubMed] [Google Scholar]
- Zhang Y, Cooke M, Panjwani S, Cao K, Krauth B, Ho PY, Medrzycki M, Berhe DT, Pan C, McDevitt TC, et al. Histone h1 depletion impairs embryonic stem cell differentiation. PLoS Genet. 2012;8:e1002691. doi: 10.1371/journal.pgen.1002691. [DOI] [PMC free article] [PubMed] [Google Scholar]
- Zhu J, Adli M, Zou JY, Verstappen G, Coyne M, Zhang X, Durham T, Miri M, Deshpande V, De Jager PL, et al. Genome-wide chromatin state transitions associated with developmental and environmental cues. Cell. 2013;152:642–654. doi: 10.1016/j.cell.2012.12.033. [DOI] [PMC free article] [PubMed] [Google Scholar]
Associated Data
This section collects any data citations, data availability statements, or supplementary materials included in this article.