Abstract
High humidity has a profound influence on the development of numerous phyllosphere diseases in crop fields and natural ecosystems, but the molecular basis of this humidity effect is not understood. Previous studies emphasize immune suppression as a key step in bacterial pathogenesis. Here we show that humidity-dependent, pathogen-driven establishment of an aqueous intercellular space (apoplast) is another crucial step in bacterial infection of the phyllosphere. Bacterial effectors, such as Pseudomonas syringae HopM1, induce establishment of the aqueous apoplast and are sufficient to transform non-pathogenic P. syringae strains into virulent pathogens in immune-deficient Arabidopsis under high humidity. Arabidopsis quadruple mutants simultaneously defective in a host target (MIN7) of HopM1 and in pattern-triggered immunity could not only recapitulate the basic features of bacterial infection, but also exhibit humidity-dependent dyshomeostasis of the endophytic commensal bacterial community in the phyllosphere. These results highlight a new conceptual framework for understanding diverse phyllosphere-bacterial interactions.
Introduction
The terrestrial phyllosphere (the above-ground parts of plants) represents one of the most important habitats on Earth for microbial colonization. Although the vast majority of phyllosphere microbes exhibit benign commensal associations and maintain only modest populations, adapted phyllosphere pathogens can multiply aggressively under favorable environmental conditions and cause devastating diseases. In crop fields, phyllosphere bacterial disease outbreaks typically occur after rainfalls and a period of high humidity1-3, consistent with the famous “disease triangle” (host-pathogen-environment) dogma formulated more than 50 years ago4. The molecular basis of the profound effect of high humidity on bacterial infection of the phyllosphere is not understood.
Many plant and animal pathogenic bacteria, including the model phyllosphere bacterial pathogen Pseudomonas syringae, carry a type III secretion system (T3SS), which is used to deliver disease-promoting “effector” proteins into the host cell as a primary mechanism of pathogenesis5,6. Studies of how individual type III effectors promote bacterial disease in plants and animals show that effector-mediated suppression of host immunity is a common theme in both plant-bacterial 7-9 and animal-bacterial interactions 10,11. However, due to the apparent molecular complexities in bacterial diseases, the fundamental question as to what minimal set of host processes that must be subverted to allow basic bacterial pathogenesis to occur has not been answered in any plant or animal pathosystem.
Immune-suppression and pathogenesis
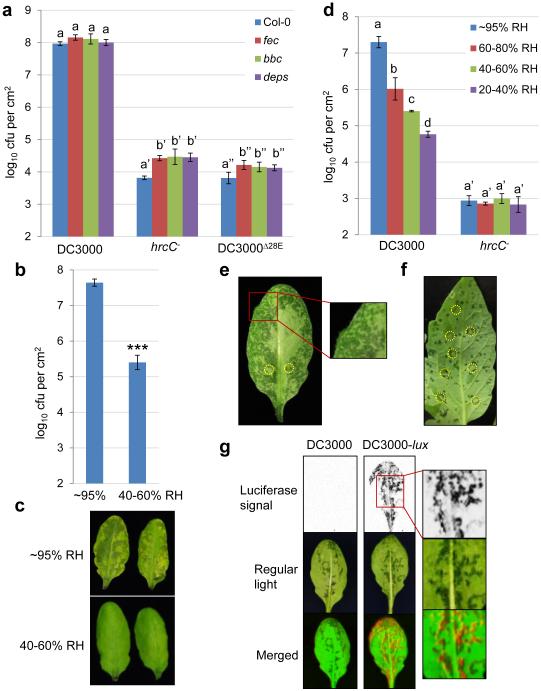
To test the hypothesis that host immunity may be the only process that needs to be subverted for bacterial pathogenesis in the phyllosphere, we performed infection assays in Arabidopsis polymutants severely defective in multiple immune pathways: (i) fls2/efr/cerk1 (fec), which is mutated in three major pattern recognition receptor (PRR) genes relevant to P. syringae pv. tomato (Pst) DC3000 infection12, (ii) bak1-5/bkk1-1/cerk1 (bbc; see Methods), which is compromised in immune signaling downstream of multiple PRRs13,14, and (iii) dde2/ein2/pad4/sid2 (deps), which is defective in all three major defense hormone pathways (salicylic acid, jasmonate and ethylene)15. Two nonpathogenic mutant derivatives of Pst DC3000 were used: the hrcC− mutant (defective in type III secretion)16 and the DC3000D28E mutant, in which the T3SS remains intact, but 28 of 36 type III effectors are deleted17. As shown in Fig. 1a, hrcC− and DC3000D28E mutants grew very poorly not only in wild-type Col-0, but also in immune-compromised mutants when infiltrated into the apoplast, suggesting that host immunity is unlikely to be the only process subverted by Pst DC3000 during infection.
Figure 1.
Full-scale Pst DC3000 infection requires high humidity and is tightly associated with apoplast “water soaking”. See Methods for syringe-infiltration or dip-inoculation of plants described in all figures. a, Bacterial populations in Col-0, fls2/efr/cerk1 (fec), bak1-5/bkk1-1/cerk1 (bbc) and dde2/ein2/pad4/sid2 (deps) leaves 2 days post infiltration with bacteria at 1×10⁶ cfu/ml. Humidity: ~95%. Two-way ANOVA with Tukey’s test (p value set at 0.05) was performed. No significant differences were found for DC3000 populations in different plant genotypes (indicated by the same letter a), whereas differences were found for hrcC− or DC3000D28E populations in different plant genotypes, as indicated by different letters of the same type (a’ vs. b’ for hrcC− and a” vs. b” for DC3000D28E). n=4 technical replicates; error bars, mean±s.d. Experiments were repeated three times with similar results. b-c, Bacterial populations (b) and disease symptoms (c) 3 days post infiltration with Pst DC3000 at 1×10⁵ cfu/ml. * indicates a significant difference determined by Student’s t-test (two-tailed); ***, p=1.08×10⁻⁶. n=4 technical replicates; error bars, mean±s.d. Experiments were repeated four times with similar results. d, Bacterial populations in Col-0 leaves 3 days post infiltration with bacteria at 1×10⁵ cfu/ml. Statistical analysis was the same as in a. Significant differences were found for DC3000 populations under different humidities, as indicated by different letters (a, b, c and d). No significant differences were found in hrcC− populations (indicated by the same letter a’). n=3 technical replicates; error bars, mean±s.d. Experiments were repeated three times with similar results. e, Pictures of the abaxial sides of Col-0 leaves 24 h post infiltration with Pst DC3000 at 1×10⁶ cfu/ml. Humidity: ~95%. Dark spots on the leaf indicate water soaking spots. Red boxes indicate “zoomed-in” regions. f, Picture of a tomato leaf (cv. Castle Mart) 3 days after infiltration with Pst DC3000 at 1×10⁴ cfu/ml. Humidity: ~95%. Yellow circles in e and f indicate infiltration sites. Images were representative of water-soaked leaves from more than four plants. g, Col-0 plants were dip-inoculated with bacteria at 2×10⁸ cfu/ml. Humidity: ~95%. Bacterial colonies in inoculated leaves were visualized 2 days later by a charge-coupled device (upper panel) and pictures of leaves were taken to show water soaking spots (middle panel). Bottom panel shows merged images, with the artificial red color labeling Pst DC3000-lux bacteria. Experiments were repeated three times. Images were representative of leaves from more than four plants.
High humidity required for pathogenesis
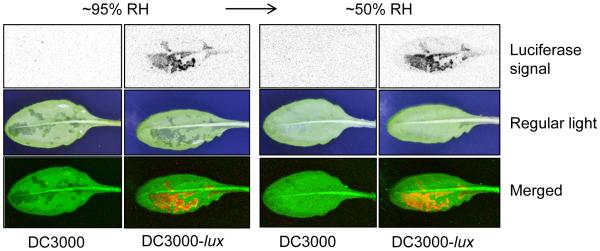
During the active pathogenesis phase, phyllosphere bacterial pathogens such as Pst DC3000 live mainly in the air-filled apoplast, which is connected directly to open air through epidermal pores called stomata. The water status inside the apoplast could therefore be influenced by air humidity during pathogen infection. In crop fields, phyllosphere bacterial disease outbreaks typically occur after rainfalls and a period of high humidity1-3,18, following the “disease triangle” dogma in plant pathology. In addition, one of the earliest and common symptoms of phyllosphere bacterial diseases is the appearance of “water soaking” in infected tissues, although whether water-soaking plays an active role in bacterial pathogenesis remains unclear. These key phenomena could be demonstrated in the laboratory. Whereas Pst DC3000 multiplied to a very high level under high humidity (~95%; mimicking high humidity after rains in crop fields), it multiplied to a much lower level under low humidity (< 60%) (Fig. 1b), as reflected also in a lower disease severity (Fig. 1c). The ability of Pst DC3000 to multiply increased as humidity rose; in contrast, the hrcC− mutant multiplied poorly under all tested humidity conditions (Fig. 1d). The most aggressive infection by Pst DC3000 was associated with the appearance, usually within one day after infection, of water soaking in the infected Arabidopsis leaves under high humidity (Fig. 1e). Water-soaked spots could also be observed in Pst DC3000-infected leaves of another host species, tomato (Fig. 1f). Real-time imaging (Supplementary Video 1) showed that the initial water-soaked spots mark the areas of later disease symptoms (necrosis and chlorosis), and revealed, interestingly, that water soaking was a transient process and it disappeared before the onset of late disease symptoms. Using a Pst DC3000 strain tagged with a luciferase reporter (DC3000-lux19), we found that water soaking areas and luciferase signals are detected nonuniformly across the leaf, but they overlap extensively (Fig. 1g, Extended Data Fig. 1), revealing that water-soaked areas are where bacteria multiply aggressively in the phyllosphere before the onset of late disease symptoms.
P. syirngae water-soaking effectors
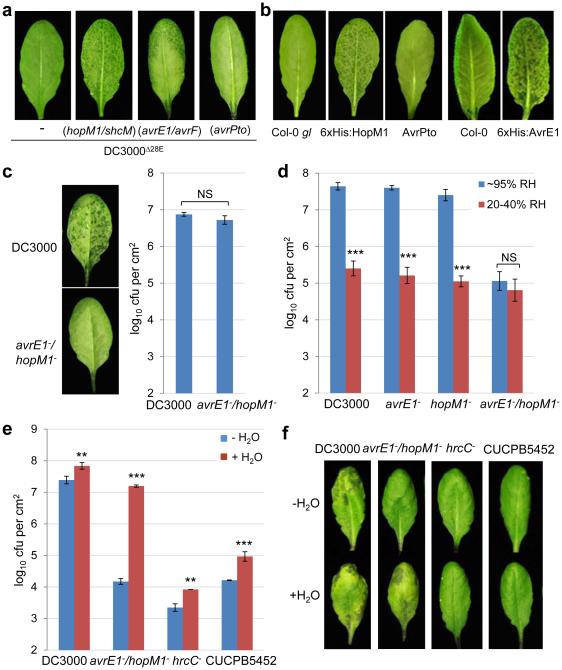
The DC3000D28E mutant never caused water soaking under any condition (e.g., high humidity/inoculum). We therefore transformed each of the 28 Pst DC3000 effector genes, individually, back to the DC3000D28E mutant to identify the effector(s) that cause water soaking. Most effectors did not (see Fig. 2a for avrPto, as an example); but hopM1 and avrE (together with their respective type III secretion chaperone genes shcM and avrF) did (Fig. 2a). We found this result interesting because, although HopM1 and AvrE show no sequence similarity, they were previously shown to be functionally redundant in virulence and they are highly conserved in diverse P. syringae strains and/or other phytopathogenic bacteria20,21. Moreover, transgenic overexpression of 6xHis:HopM122 or 6xHis:AvrE23 under control of dexamesathone (DEX)-inducible promoter (10 μM DEX used) also caused water soaking under high humidity (Fig. 2b). In contrast, transgenic expression of AvrPto, like D28E (avrPto), did not. These results show that HopM1 and AvrE, either delivered by bacteria or when overexpressed transgenically inside the plant cells, are each sufficient to cause water soaking.
Figure 2.
Type III effectors AvrE and HopM1 are necessary and sufficient to cause water soaking. a, Pictures of Col-0 leaves 24 h post infiltration with bacteria (1-2×10⁸ cfu/ml). Humidity: ~95%. b, Pictures of leaves of transgenic 6xHis:HopM122, 6xHis:AvrE23 or AvrPto32 plants after spray with 10μM dexamethasone (DEX; to induce effector gene expression). Humidity: ~95%. Col-0 or Col-0 gl plants were non-transgenic parental controls. Images were representative of leaves from more than four plants. c, Pictures of Col-0 leaves (left) and bacterial populations (right) 24 h post infiltration with Pst DC3000 (1×10⁶ cfu/ml) or the avrE−/hopM1− strain (1×10⁷ cfu/ml). Humidity: ~95%. Student’s t-test (two-tailed) was performed; ns, not significant (p=0.104). n=3 biological replicates; error bars, mean±s.d. Experiments were repeated three times. d, Bacterial populations in Col-0 plants 3 days post infiltration with bacteria at 2×10⁵ cfu/ml. *** indicates a significant difference (p=1.07×10⁻⁶, 8.07×10⁻⁷ and 5.95×10⁻⁷ for DC3000, the avrE− mutant and the hopM1− mutant, respectively) of bacterial population between different humidities, as determined by Student’s t-test (two-tailed); ns, not significant (p=0.13). n=4 technical replicates; error bars, mean±s.d. Experiments were repeated three times. e-f, Bacterial populations (e) and leaf pictures (f) in Col-0 leaves 3 days post infiltration with bacteria at 1×10⁵ cfu/ml. In the “− H2O” treatment, plants were air-dried normally (for ~2 h) and then kept under high humidity (~95%). In the “+H2O” treatment, plants were kept under high (80-95%) humidity after syringe-infiltration to allow slow evaporation of water (for ~16 h, until no visible apoplast water can be seen). ** (p=8.29×10⁻³ and 1.14×10⁻³ for DC3000 and hrcC−, respectively) and *** (p=7.61×10⁻⁷ and 9.82×10⁻⁴ for avrE−/hopM1− and CUCPB5452, respectively) indicate significant differences between “− H2O” and “+H2O” treatments as determined by Student’s t-test (two-tailed). n=3 technical replicates; error bars, mean±s.d. Experiments were repeated three times.
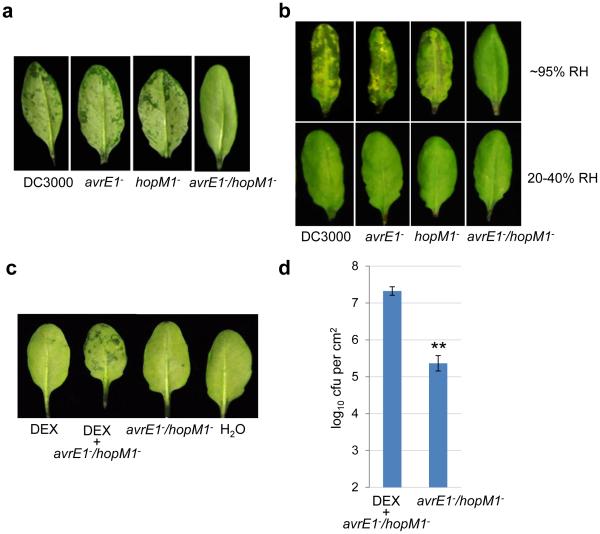
Bacterial mutant analysis showed that HopM1 and AvrE are necessary for Pst DC3000 to cause water soaking during infection, as the avrE−/hopM1− double mutant20 could not cause water soaking, even when the inoculum of the avrE−/hopM1− mutant was adjusted to reach a similar population with Pst DC3000 when water soaking was assessed (Fig. 2c). In contrast, Pst DC3000 and the avrE− and hopM1− single mutants20 caused strong initial water soaking (Extended Data Fig. 2a) and later disease symptoms (Extended Data Fig. 2b) and multiplied aggressively in a high humidity-dependent manner, while the avrE−/hopM1− double mutant multiplied poorly regardless of the humidity setting (Fig. 2d). Transgenic expression of 6xHis:HopM1 in Arabidopsis (in these experiments 0.1 nM was used to induce low-level expression of HopM1 so that HopM1 alone does not cause extensive water soaking) restored the ability of the avrE−/hopM1− double mutant to cause water soaking and multiply highly under high humidity (Extended Data Fig. 2c, d). These results revealed that, unlike the other 34 effectors present in the avrE−/hopM1− double mutant, the virulence functions of HopM1 and AvrE are uniquely dependent on external high humidity.
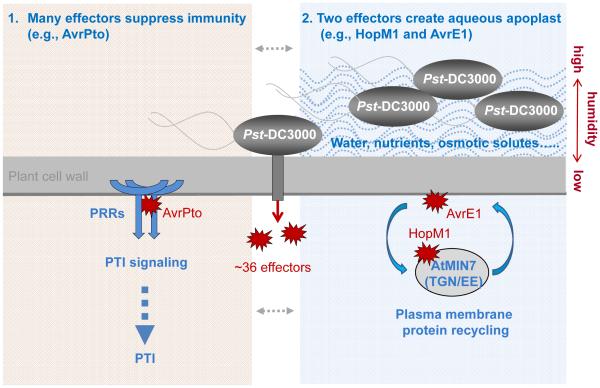
Why would the virulence functions of HopM1 and AvrE be dependent on the external humidity? We hypothesized that perhaps the primary function of HopM1 and AvrE is to create an aqueous apoplast per se (i.e., bacteria “prefer” to living in an aqueous environment in the apoplast), the maintenance of which requires high humidity as the leaf apoplast is directly connected to open air through stomata. If so, it may be possible to substitute the function of HopM1 and AvrE by simply providing water to the apoplast. To directly test this hypothesis, we performed transient water supplementation experiments in which Col-0 plants infiltrated with the avrE−/hopM1− mutant were kept water-soaked, transiently, for the first 12 h to 16 h to mimic the kinetics of transient water soaking normally occurring during Pst DC3000 infection (Supplementary Video 1). Remarkably, transient apoplast water supplementation was sufficient to restore the multiplication (100- to 1000-fold) of the avrE−/hopM1− mutant almost to the level of Pst DC3000 (Fig. 2e), as well as appearance of severe disease symptoms (Fig. 2f). As controls, Pst DC3000, the hrcC− mutant and CUCPB5452 (which contains avrE and hopM1 genes but has much reduced virulence due to deletion of other type III effectors24) grew only slightly better (<10 fold) with transient water-supplementation (Fig. 2e). These results demonstrate that the primary virulence function of HopM1 and AvrE can be effectively substituted by supplying water, transiently, to the apoplast.
HopM1’s host target in water soaking
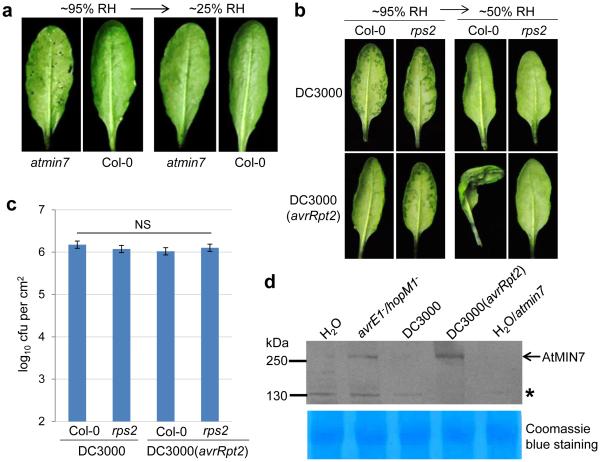
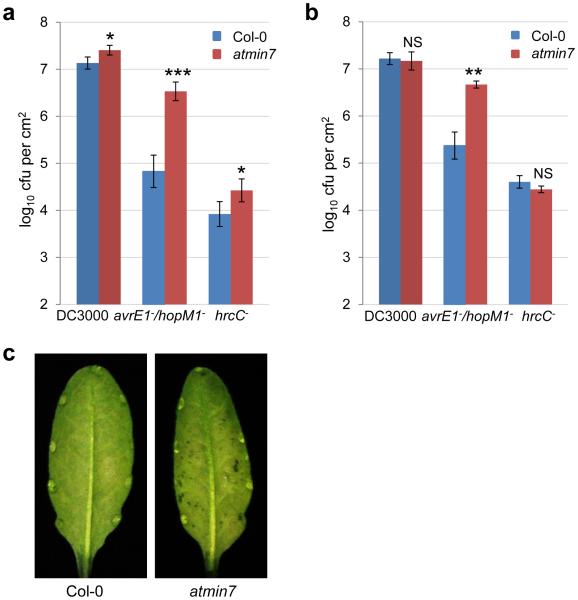
To investigate the mechanism by which HopM1 creates aqueous apoplast, we focused on the host targets of HopM1 in Arabidopsis. We have previously shown that HopM1 is targeted to the trans-Golgi-network/early endosome (TGN/EE) in the host cell and mediates proteasome-dependent degradation of several host proteins, including MIN7 (also known as BEN1), which is a TGN/EE-localized ADP ribosylation factor-guanine nucleotide exchange factor involved in vesicle trafficking22,25,26. Although the min7 mutant plant partially allows increased bacterial multiplication22,25, the exact role of MIN7 during pathogen infection remains enigmatic. A previous study showed that HopM1’s virulence function is fundamentally different from that of canonical immune-suppressing effectors, such as AvrPto17. In light of our discovery of HopM1’s primary role in creating water-soaking in this study, we tested the intriguing possibility that MIN7 may be a key player in modulating apoplast water soaking in response to bacterial infection. Excitingly, we found that the min7 mutant plant allowed apoplast water soaking to occur in the absence of HopM1/AvrE (i.e., during infection by the avrE−/hopM1− mutant; Fig. 3a, Extended Data Fig. 3c), and allowed the avrE−/hopM1− mutant to multiply (Extended Data Fig. 3a, b). Thus, genetic removal of MIN7 is sufficient to mimic the virulence function of HopM1, albeit partially, in causing apoplast water soaking. The min7 mutant plant is defective in endocytic recycling of plasma membrane (PM) proteins and has an abnormal PM26, suggesting that HopM1 degrades MIN7 possibly to compromise host PM integrity as a mechanism to create an infection-promoting aqueous apoplast (Extended Data Fig. 4).
Figure 3.
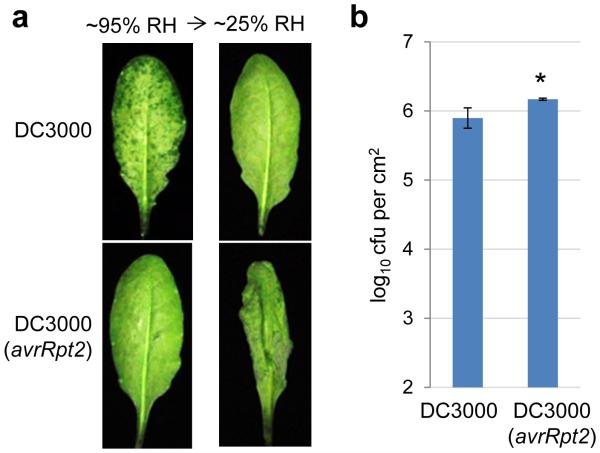
Effects of MIN7 and effector-triggered immunity on water soaking. a, The min7 leaves, but not Col-0 leaves, showed partial water soaking 48 h after dip-inoculation with the avrE−/hopM1− mutant at 1×10⁸ cfu/ml. Humidity: ~95%. Water soaking disappeared after transition to low humidity (~25%) to allow evaporation of apoplast water. Images were representative of leaves from more than four plants. b-c, ETI blocks apoplast water soaking. Col-0 and rps2 leaves were infiltrated with Pst DC3000 (1×10⁶ cfu/ml) or Pst DC3000 (avrRpt2) (1×10⁷ cfu/ml for Col-0 and 1×10⁶ cfu/ml for rps2 plants). Plants were kept under high humidity (~95%) for 24 h to observe water soaking and then shifted to low humidity (~50%) for 4 h to observe ETI-associated tissue collapse. Pictures were taken before and after low humidity exposure (b) and bacterial populations were determined 24 h post infiltration to show similar population levels (c). Statistical analysis of data in c was performed by one-way ANOVA with Tukey’s test (p value set at 0.05), and no significant difference was detected. n=3 technical replicates; error bars, mean±s.d. Experiments were repeated three times. d, MIN7 protein is stabilized during ETI revealed by immunoblot. Col-0 or min7 leaves were infiltrated with bacteria (1×10⁷ cfu/ml25) or H2O and kept under high humidity (~95%) for 24 h before protein extraction. Asterisk indicates a non-specific band. Coomassie blue staining shows equal loading. See Supplementary Figure 1 for cropping.
If apoplast water soaking is an essential step of pathogenesis, we hypothesized that plants may have evolved defense mechanisms to counter it. Indeed, we found that Pst DC3000 (avrRpt2)-triggered effector-triggered immunity (ETI)27 completely blocked water-soaking, even when the inoculum of Pst DC3000 (avrRpt2) was raised to reach a population similar to Pst DC3000 when water soaking was assessed (Fig. 3b, c, Extended Data Fig. 5a-b). When transferred from high (~95%) to low (~50%) humidity, Pst DC3000 (avrRpt2)-infected leaves quickly wilted, indicating extensive ETI-associated programmed cell death. In contrast, Pst DC3000-infected, water-soaked leaves returned to pre-infection healthy appearance (Fig. 3b), indicating little host cell death during apoplast water soaking. Furthermore, Pst DC3000 (avrRpt2)-triggered ETI stabilized the MIN7 protein (Fig. 3d). These results therefore uncovered a previously unrecognized battle between bacterial virulence (creating apoplast water soaking) and host defense (preventing apoplast water soaking), in part linked to MIN7 stability, to take control of apoplast water availability.
Reconstitution of P. syringae infection
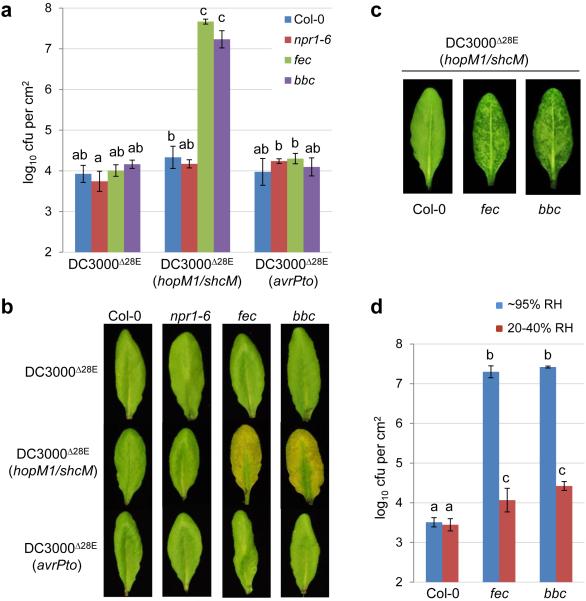
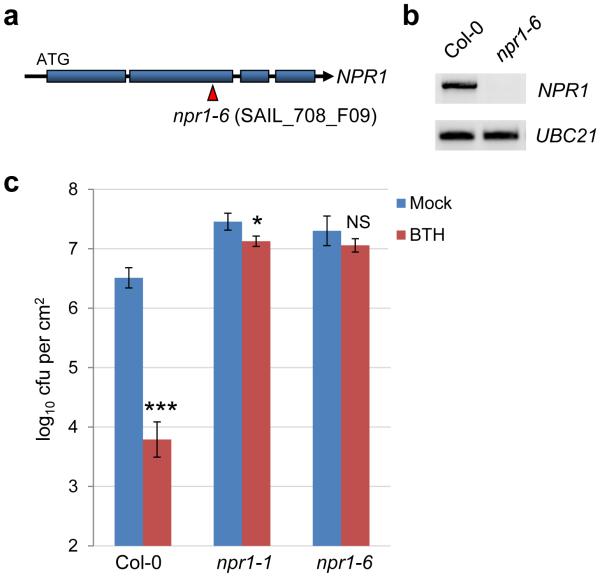
The discovery of apoplast water soaking as a key process of bacterial pathogenesis prompted us to investigate a new model in which PTI suppression and creation of apoplast water soaking are two principal pathogenic processes sufficient for bacterial infection of the phyllosphere. To test this hypothesis, we infected Col-0 and two PTI-compromised mutant plants (i.e., fec and bbc) with DC3000D28E, DC3000D28E (avrPto) or DC3000D28E (hopM1/shcM) and found that only DC3000D28E (hopM1/shcM), but not DC3000D28E or DC3000D28E (avrPto), caused strong water soaking, multiplied aggressively (almost to the Pst DC3000 level) and produced prominent disease symptoms in the fec and bbc mutant plants (Fig. 4a-c) in a high humidity-dependent manner (Fig. 4d). Furthermore, unlike PTI mutants, the npr1-6 mutant plant, which is defective in salicylic acid-dependent defense (Extended Data Fig. 6a-c), could not rescue the ability of DC3000D28E (hopM1/shcM) to multiply (Fig. 4a). Thus, a combination of defective PTI and presence of an aqueous-apoplast-inducing effector (HopM1) could almost fully convert a non-pathogenic mutant into a virulent pathogen in the Arabidopsis phyllosphere.
Figure 4.
hopM1/shcM transform the non-pathogenic DC3000D28E mutant into a highly virulent pathogen in PTI-deficient mutant plants in a humidity-dependent manner. a-c, Bacterial populations (a) and disease symptoms (b) 3 days post infiltration with bacteria indicated at 1×10⁶ cfu/ml. Humidity: ~95%. Statistical analysis was performed by one-way ANOVA with Tukey’s test (p value set at 0.05). Bacterial populations indicated by different letters (i.e., a, b and c) are significantly different (ab is not significantly different from a or b). n=4 technical replicates; error bars, mean±s.d. Experiments were repeated three times. Water-soaking symptom was recorded 24 h post inoculation (c). d, Bacterial populations 3 days post infiltration with DC3000D28E (hopM1/shcM) at 1×10⁶ cfu/ml under indicated humidities. Statistical analysis was the same as in (a). Bacterial populations indicated by different letters (i.e., a, b and c) are significantly different. n=4 technical replicates; error bars, mean±s.d. Experiments were repeated three times. Images were representative of leaves from at least four plants.
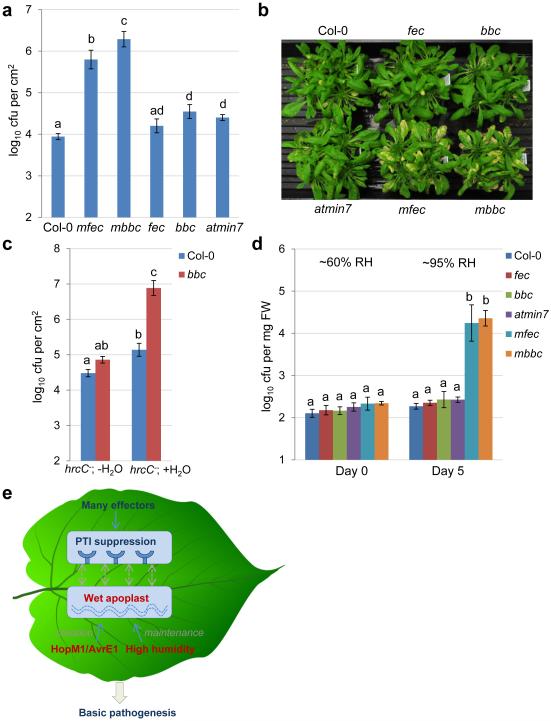
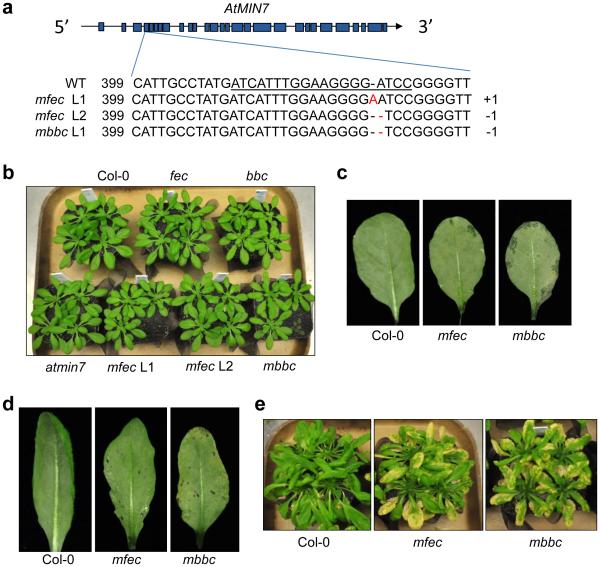
If immune suppression and creation of apoplast water soaking are two principal pathogenic processes sufficient for bacterial infection of the phyllosphere, we reasoned that we might be able to construct a multi-host-target mutant that simulates the two processes. Such mutant plant might allow an otherwise nonpathogenic mutant bacterium (e.g., the hrcC− mutant) to colonize the phyllosphere, thereby reconstituting basic features of a phyllosphere bacterial infection. For this purpose, we mutated the MIN7 gene in PTI mutants (fec and bbc) and generated min7/fls2/efr/cerk1 (mfec) and min7/bak1-5/bkk1-1/cerk1 (mbbc) quadruple mutants using CRISPR technology (see Methods; Extended Data Fig. 7a). The quadruple mutant plants display a similar morphology as wild type Col-0 plants (Extended Data Fig. 7b) and have a tendency of showing some water-soaking spots, especially in mature leaves, under high humidity (Extended Data Fig. 7c, d). Excitingly, these mutants allow the nonpathogenic hrcC− mutant to multiply aggressively under high (~95%) humidity, to a final population that was ~100 fold higher than in Col-0 plants 5 days after inoculation, with the mbbc plants showing a greater susceptibility than the mfec plants (Fig. 5a). In addition, in these quadruple mutant plants, the hrcC− mutant induced prominent disease chlorosis and necrosis (Fig. 5b, Extended Data Fig. 7e), which were not observed for the hrcC− strain in Col-0, min7 or PTI mutants. Thus, a dual disruption of MIN7 and PTI signaling is sufficient to reconstitute the basic features of a model phyllosphere bacterial disease. Consistent with this conclusion, transient water supplementation to the leaf apoplast was sufficient to enhance the growth of the hrcC− mutant in the bbc triple mutant, but not in Col-0 plants (Fig. 5c). To our knowledge, this is the first infectious model disease, in plant or animal, for which basic pathogenesis has been reconstituted using biologically relevant host target mutants.
Figure 5.
Disease reconstitution experiments. a-b, The hrcC− bacterial populations 5 days (a) and disease symptoms 10 days post dip-inoculation (b) in Col-0, fec, bbc, min7, min7/fls2/efr/cerk1 (mfec) and min7/bak1-5/bkk1-1/cerk1 (mbbc) plants. Humidity: ~95%. Statistical analysis was performed by one-way ANOVA with Tukey’s test (p value set at 0.05). Bacterial populations indicated by different letters (i.e., a, b, c and d) are significantly different (ad is not significantly different from a or d). n=4 technical replicates; error bars, mean±s.d. Experiments were repeated four times. c, The hrcC− bacterial populations in Col-0 and bbc leaves 3 days post infiltration with bacteria at 1×10⁶ cfu/ml. The “− H2O” and “+ H2O” conditions are the same as in Fig. 2e. Statistical analysis was performed by one-way ANOVA with Tukey’s test (p value set at 0.05). Bacterial populations indicated by different letters (i.e., a, b and c) are significantly different (ab is not significantly different from a or b). n=3 technical replicates; error bars, mean±s.d. Experiments were repeated three times. d, The Col-0, fec, bbc, min7, mfec and mbbc plants were mock-sprayed with H2O and kept under high humidity (~95%). On day 0 (before water spray) and day 5, total populations of the endophytic bacterial community were quantified by counting colony-forming units on R2A plates, after surface sterilization of leaves with 75% ethanol, leaf homogenization and serial dilutions. Statistical analysis is the same as in (a). Bacterial populations indicated by different letters (i.e., a and b) are significantly different. n=4 technical replicates; error bars, mean±s.d. Experiments were repeated three times. e, A new model for Pst DC3000 pathogenesis in Arabidopsis. Dashed arrows indicate a possible interplay, at spatial and temporal scales, between “immune suppression” and “wet apoplast” during pathogenesis.
Dyshomeostasis of commensal bacteria
The inability of the nonpathogenic hrcC− mutant to multiply aggressively in wild-type phyllosphere resembles that of the commensal bacterial community that resides in the apoplast of healthy leaves. Consistent with this, only low levels of the endophytic phyllosphere bacterial community were detectable in wild type Col-0 plants (Fig. 5d). However, after plants were shifted from regular growth conditions (~60% relative humidity, day 0; Fig. 5d) to high humidity conditions (~95% relative humidity), the mfec and mbbc quadruple mutant plants, but not Col-0 plants, allowed excessive proliferation of the endogenous endophytic bacterial community (Fig. 5d, Extended Data Table 1), in a high humidity dependent manner (Extended Data Fig. 8a). Furthermore, the excessive proliferation of the endophytic bacterial community was associated with mild tissue chlorosis and necrosis in some leaves (Extended Data Fig. 8b). We found this result intriguing as a recent study showed that overgrowth of a beneficial root-colonizing fungus in immune-compromised (against fungal pathogens) plants also led to harmful effects in Arabidopsis28, illustrating a potentially common theme that the levels of commensal and beneficial microbiota must be strictly controlled by the host for optimal plant health. Future comprehensive in planta 16S rRNA amplicon-based analysis will be needed to determine whether there are also humidity-dependent changes in the composition of commensal bacterial communities in the Col-0, mfec and mbbc plants.
Discussion
Results from this study suggest a new conceptual framework for understanding phyllosphere-bacterial interactions (Fig. 5e). Specifically, we have identified PTI signaling and MIN7, presumably via vesicle trafficking, as two key components of the elusive host barrier that functions to limit excessive and potentially harmful proliferation of nonpathogenic microbes (e.g., hrcC− mutant) in the phyllosphere. Pathogenic bacteria, like Pst DC3000, have evolved T3SS effectors not only to disarm PTI signaling, but also to establish an aqueous living space in a humidity-dependent manner in order to aggressively colonize the phyllosphere. This new conceptual framework integrates host, pathogen and environmental factors, providing a critical insight into the enigmatic basis of the profound effect of humidity on the development of numerous bacterial diseases, consistent with the “disease triangle” dogma in plant pathology.
Prior to this study, humidity was commonly thought to promote bacterial movements on the plant surface and invasion into plant tissues. Our study, however, revealed a striking and previously unrecognized effect of high humidity on the function of bacterial effectors inside the plant apoplast. An aqueous apoplast could potentially facilitate the flow of nutrients to bacteria, promote the spread/egression of bacteria, and/or affect apoplastic host defense responses, the latter of which may explain some of the previously observed effects of HopM1, AvrE and MIN7 on plant immunity21,23,25 and suggest a potential “cross-talk” between plant immune responses and water availability.
Most of our current knowledge on plant-pathogens and plant-microbiome interactions are derived from studies under limited laboratory conditions. This study illustrates a need for future research to consider the dynamic climate conditions in which plants and microbes live in nature in order to uncover new biological phenomena involved in host-microbe interactions. Research that unravels the molecular bases of environmental influences of disease development should help us understand the severity, emergence and/or disappearance of infectious diseases in crop fields and natural ecosystems, especially in light of the dramatically changing drought/humidity patterns associated with global climate change.
Methods
Plant materials and bacterial strains
Arabidopsis thaliana plants were grown in the “Arabidopsis Mix” soil (equal parts of SUREMIX [Michigan Grower Products Inc., Galesburg, MI], medium vermiculate and perlite; autoclaved once) or Redi-Earth soil (Sun Gro® Horticulture) in environmentally-controlled growth chambers, with relative humidity at 60%, temperature at 22 °C and 12h light/12h dark cycle. Five-week-old plants were used for bacterial inoculation and disease assays.
The bak1-5/bkk1-1/cerk1mutant plant was generated by crossing the bak1-5/bkk1-1 mutant14 with the cerk1 mutant29. PCR-based genotyping was performed in F2 progeny to obtain a homozygous triple mutant. The npr1-6 (Fig. 4a) mutant was the SAIL_708_F09 line ordered from the Arabidopsis Biological Resource Center, and confirmed to be a knock-out mutant and defective in SA signaling (Extended Data Fig. 6).
Bacterial disease assays
Syringe-infiltration and dip-inoculation were performed. Briefly, Pst DC3000 and mutant strains were cultured in Luria-Marine (LM30) medium containing 100mg/L rifampicin (and/or other antibiotics if necessary) at 28°C to OD600 of 0.8 - 1.0. Bacteria were collected by centrifugation and re-suspended in sterile water. Cell density was adjusted to OD600 = 0.2 (~1×10⁸ cfu/ml). For syringe-infiltration, bacterial suspension was further diluted to cell densities of 1×10⁵ to 1×10⁶ cfu/ml. Unless stated otherwise, infiltrated plants were first kept under ambient humidity for 1-2 h for water to evaporate, and, after the plant leaves returned to pre-infiltration appearance, plants were kept under high humidity (~95%; by covering plants with domes) or other specified humidity settings for disease to develop. For dip-inoculation, plants were dipped in the bacterial suspension of OD600 = 0.2, with 0.025% Silwet L-77 added, and then kept under high humidity (~95%) immediately for disease to develop.
Different humidity settings were achieved by placing a plastic dome over a flat (in which plants are grown) with different degrees of opening. A humidity/temperature Data Logger (Lascar) was placed inside the flat to record the humidity and/or temperature over the period of disease assay.
For quantification of Pst DC3000 bacterial populations, Arabidopsis leaves were surface-sterilized in 75% ethanol and rinsed in sterile water twice. Leaf disks were taken using a cork borer (9.5mm in diameter) and ground in sterile water. Colony-forming units were determined by serial dilutions and plating on LM plates containing 100mg/L rifampicin. Two leaf disks from two leaves were pooled together as one technical replicate, and 4 technical replicates are included in each biological experiment. Experiments were repeated at least three times.
CRISPR-Cas9-mediated mutation of the MIN7 gene
The one-plasmid CRISPR-Cas9 cloning system31 was used to mutate MIN7 in the fls2/efr/cerk1 and bak1-5/bkk1-1/cerk1 plants. MIN7-sgRNA primers containing target mutation regions were as follows, with MIN7 sequence underlined.
MIN7-sgRNA-F: GATTGATCATTTGGAAGGGGATCC
MIN7-sgRNA-R: AAACGGATCCCCTTCCAAATGATC
The constructs containing MIN7-sgRNA and Cas9 were cloned in pCAMBIA1300, which were then mobilized into Agrobacterium tumefaciens for plant transformation. For genotyping of MIN7-mutated lines, total DNA was extracted from individual lines and the regions containing the CRISPR target sites were amplified by PCR using the following primers:
MIN7-sgRNA-F2: GATGCTGCTTTGGATTGTCTTC
MIN7-sgRNA-R2: AATGGCTCCCCATGCACTGCGATA
For genotyping, the PCR products were digested by the BamHI restriction enzyme and plant lines showing an (partially or completely) uncut band were chosen. The PCR products of putative homozygous T2 lines, identified based on a lack of cutting by BamHI, were sequenced. The lines showing a frame-shift mutation and an absence of Cas9 gene based on PCR using the following primers were identified as homozygous lines. The T3 and T4 progeny of homozygous lines were used for disease assays.
Primers for PCR-amplifying Cas9 gene:
Cas9-F: CCAGCAAGAAATTCAAGGTGC
Cas9-R: GCACCAGCTGGATGAACAGCTT
Imaging of bacterial colonization with luciferase assay
Four-week-old Arabidopsis Col-0 plants were dip-inoculated with Pst DC3000 or Pst DC3000-lux strain. The infected plants were fully covered with plastic dome to maintain high humidity. Leaves were excised from the infected plants 2 days post inoculation and the light signals were captured by a charge-coupled device (CCD) using ChemiDoc™ MP system (Bio-Rad).
MIN7 protein blot
Arabidopsis leaves were syringe-infiltrated with bacteria or H2O and kept under high humidity (~95%) for 24h. Leaf disks were homogenized in 2xSDS buffer, boiled for 5 min and centrifuged at 10,000 × g for 1 min. Supernatants containing the total protein extracts were subjected to separation by SDS-polyacrylamide gel electrophoresis (PAGE). A MIN7 antibody22 was used in the western blot to detect the MIN7 protein. Uncropped blot/gel images are included in Supplementary Figure 1.
Bacterial community quantification
Five-week old plants were sprayed with H2O and covered with a plastic dome to keep high humidity (~95%) for 5 days. To quantify the endophytic bacterial community, leaves were detached, sterilized in 75% ethanol for 1 min (Extended Data Fig. 9) and rinsed in sterile water twice. Leaves were weighed and ground in sterile water using a TissueLyser (Qiagen; at the frequency of 30 times per second for 1 min) in the presence of 3 mm Zirconium oxide grinding beads (Glen Mills; 5 beads in each tube). After serial dilutions, bacterial suspensions were plated on R2A plates, which were kept at 22°C for 4 days before colonies were counted. Colony-forming units were normalized to tissue fresh weight.
16S rRNA amplicon sequence analysis of endophytic bacterial community
The Col-0, mfec and mbbc plants were sprayed with water and kept under high humidity (~95%) for 5 days. Leaves were surface-sterilized in 75% ethanol for 1 min and rinsed in sterile water twice. Leaves from four plants were randomly selected (2 leaves from each plants; 8 leaves in total) and were divided in 4 tubes (2 leaves in each tube) and ground in sterile water. Bacterial suspensions were diluted (Col-0 samples were diluted to 10−3 and mfec and mbbc samples were diluted to 10−5) and, for each genotype, 15 μl suspension from each tube of the right dilution (10−3 dilution for Col-0 and 10−5 for mfec and mbbc) were pooled together and plated on R2A plates, which were kept at 22°C for 4 days. Fifty colonies from each genotype were randomly picked and genomic DNA was extracted and PCR was performed with AccuPrime high-fidelity Taq DNA polymerase (Invitrogen) and primers 799F/1392R33 to amplify bacterial 16S rRNA gene. The PCR product was sequenced and taxonomy of each bacterium (family level) was determined by Ribosomal Database Project at Michigan State University (https://rdp.cme.msu.edu/)34.
Data analysis, statistics and experimental repeats
The specific statistical method used, the sample size and the results of statistical analyses are described in the relevant figure legends. Sample size was determined based on experimental trials and in consideration of previous publications on similar experiments to allow for confident statistical analyses. The Student’s two-tailed t-test was performed for comparison of means between two data points. One-way or two-way ANOVA with Tukey’s test was used for multiple comparisons within a dataset, with p value set at 0.05. ANOVA analysis was performed with the GraphPad Prism software.
Data Availability
The bacterial 16S rRNA sequences in Extended Data Table 1 have been deposited in the National Center for Biotechnology Information (NCBI) GenBank database under accession numbers KX959313-KX959462. Other data that support the findings of this study are available from the corresponding author upon request.
Extended Data
Extended Data Figure 1.
Water soaking does not affect luminescence signal. Col-0 plants were dip-inoculated with bacteria at 2×10⁸ cfu/ml, and kept under high humidity (~95%) for 2 days. Imaging was performed in the same way as in Fig. 1g. Water-soaked leaves were air-dried for about 2 h and imaged again (right panel). Images were representative of leaves from more than four plants.
Extended Data Figure 2.
a-b, The virulence of the avrE−/hopM1− mutant is insensitive to humidity settings. a, Col-0 plants were syringe-infiltrated with indicated bacteria at 2×10⁵ cfu/ml. Inoculated plants were kept under high (~95%) humidity, and pictures were taken 24 h post infiltration. b, Col-0 plants were syringe-infiltrated with Pst DC3000, the avrE− mutant, the hopM1− mutant or the avrE−/hopM1− mutant at 2×10⁵ cfu/ml. Inoculated plants were kept under high (~95%) or low (20-40%) humidity. Pictures were taken 3 days post inoculation. Images were representative of leaves from more than four plants. c-d, The 6xHis:HopM1 transgenic plants were infiltrated with 0.1 nM DEX, the avrE−/hopM1− mutant (at 1×10⁵ cfu/ml) or both. H2O was infiltrated as control. Infiltrated plants were kept at high humidity (~95%). Leaf pictures were taken 24 h post infiltration (c) and bacterial populations were determined 3 days post infiltration (d). * indicates a significant difference, as determined by Student’s t-test; (two-tailed); ***, p=1.03×10⁻⁵. n=6 technical replicates from there independent experiments (n=2 in each experiment); error bars, mean±s.d.
Extended Data Figure 3.
Bacterial multiplication and water soaking in Col-0 and the min7 mutant. a, The Col-0 and min7 plants were dip-inoculated with Pst DC3000, the avrE−/hopM1− mutant or the hrcC− mutant at 1×10⁸ cfu/ml. Bacterial populations were determined 4 days post inoculation. * indicates a significant difference between Col-0 and min7 plants, as determined by Student’s t-test (two-tailed); *, p=1.61×10⁻² and 3.12×10⁻² for DC3000 and hrcC−, respectively; ***, p=1.41×10⁻⁴ for avrE−/hopM1−. n=4 technical replicates; error bars, mean±s.d. Experiments were repeated three times. b-c, The Col-0 and min7 plants were syringe-infiltrated with Pst DC3000, the avrE− /hopM1− mutant or the hrcC− mutant at 1×10⁶ cfu/ml. Bacterial populations were determined 3 days post inoculation (b) and leaf pictures were taken 38 h after infiltration to show water soaking in min7 leaves (c). * indicates a significant difference between Col-0 and min7 plants, as determined by Student’s t-test (two-tailed); **, p=1.63×10⁻³ for avrE−/hopM1−; ns, not significant (p=0.72 and 0.14 for DC3000 and hrcC−, respectively). n=3 technical replicates; error bars, mean±s.d. Experiments were repeated three times. Images were representative of leaves from more than four plants.
Extended Data Figure 4.
Pst DC3000 delivers a total of 36 effectors into the plant cell. Many effectors, including AvrPto, appear to suppress pattern-triggered immunity (PTI). AvrPto inhibits pattern recognition receptor (PRR) function8. Two conserved effectors, HopM1 and AvrE, create an aqueous apoplast in a humidity-dependent manner. AvrE is localized to the host plasma membrane (PM)23; its host target is currently unknown. HopM1 targets MIN7 (an ARF-GEF protein) in the trans-Golgi-network/early endosome (TGN/EE), which is involved in recycling of PM proteins26.
Extended Data Figure 5.
a, Col-0 leaves were syringe-infiltrated with Pst DC3000 (1×10⁶ cfu/ml) or Pst DC3000 (avrRpt2) (1×10⁷ cfu/ml). Plants were kept under high humidity (~95%) for 24 h to observe water soaking and then shifted to low humidity (~25%) for 2 h to observe ETI-associated tissue collapse. Pictures were taken before and after low humidity exposure (a) and bacterial populations were determined 24 h post infiltration to show similar population levels (b). * indicates a significant difference of bacterial population, as determined by Student’s t-test (two-tailed); *, p=0.033. n=3 technical replicates; error bars, mean±s.d. Experiments were repeated three times. This is an experimental replicate of Fig. 3b and 3c (without rps2).
Extended Data Figure 6.
Characterization of the npr1-6 mutant. a, A diagram showing the T-DNA insertion site in the npr1-6 mutant. Blue boxes indicate exons in the NPR1 gene. b, RT-PCR results showing that the npr1-6 line cannot produce the full-length NPR1 transcript. Primers used (NPR1 sequence is underlined): NPR1-F: agaattcATGGACACCACCATTGATGGA; NPR1-R: agtcgacCCGACGACGATGAGAGARTTTAC; UBC21-F: TCAAATGGACCGCTCTTATC; UBC21-R: TCAAATGGACCGCTCTTATC. Uncropped gel images are included in Supplementary Figure 1. c, The npr1-6 line, similar to npr1-1, is greatly compromised in benzothiadiazole (BTH)-mediated resistance to Pst DC3000 infection. The Col-0, npr1-1 and npr1-6 plants were sprayed with 100μM BTH and, 24 h later, dip-inoculated with Pst DC3000 at 1×10⁸ cfu/ml. Bacterial populations were determined 3 days post inoculation. * indicates a significant difference between mock and BTH treatment, as determined by Student’s t-test (two-tailed); *, p=0.027; ***, p=1.6×10⁻⁴; ns, not significant (p=0.19). n=3 technical replicates; error bars, mean±s.d. Experiments were repeated three times.
Extended Data Figure 7.
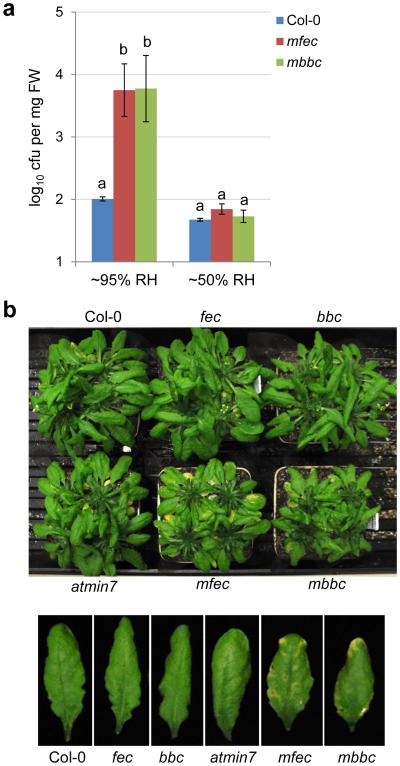
Construction and characterization of the mfec and mbbc quadruple mutants. a, CRISPR-Cas9-mediated mutations in the 4th exon of the MIN7 gene (exons indicated by blue boxes) in the quadruple mutant lines used in this study. The underlined sequence in the wild type (WT) indicates the region targeted by sgRNA. The number “399” indicates the nucleotide position in the MIN7 coding sequence. “+1” and −1” indicate frame shifts in the mutant lines. b, Col-0 and various mutants used in this study have similar growth, development and morphology. Four-week-old plants are shown. c, The mfec and mbbc plants show a tendency of developing sporadic water soaking under high humidity. Five-week-old regularly-grown (~60% relative humidity) Col-0, mfec and mbbc plants were shifted to high humidity (~95%) for overnight and pictures of mature leaves were taken after high humidity incubation. d, Even leaves of mfec and mbbc plants that do not have sporadic water-soaking have a tendency to develop some water soaking after hrcC− inoculation. Five-week old Col-0, mfec and mbbc plants were dip-inoculated with hrcC− at 1×10⁸ cfu/ml, and kept under high humidity (~95%). Leaf pictures were taken 2 days post inoculation. Images were representative of leaves from at least four plants. e, The non-pathogenic hrcC− mutant causes significant necrosis and chlorosis in the quadruple mutant plants. Col-0, mfec and mbbc plants were dip-inoculated with the hrcC− strain at 1×10⁸ cfu/ml. Pictures were taken 9 days post inoculation. This is one of the four independent experimental repeats of the results presented in Fig. 5b.
Extended Data Fig. 8.
a, Increased endophytic bacterial community in the mfec and mbbc plants depend on high humidity. Col-0, mfec and mbbc plants were either sprayed with H2O and kept under high humidity (~95%) or kept under low humidity (~50%). On day 5, total populations of the endophytic bacterial community were quantified. Statistical analysis was performed by one-way ANOVA with Tukey’s test (p value set at 0.05). Bacterial populations indicated by different letters (i.e., a and b) are significantly different. n=4 technical replicates; error bars, mean±s.d. Experiments were repeated three times. b, Mild chlorosis and necrosis in leaves is associated with increased endophytic bacterial community level in the mfec and mbbc quadruple mutant plants. Plants were sprayed with H2O and kept under high (~95%) humidity. Pictures were taken 10 days after spray. Individual leaves are enlarged and shown in the lower panel, showing mild chlorosis and necrosis in some of the mfec and mbbc leaves.
Extended Data Fig. 9.
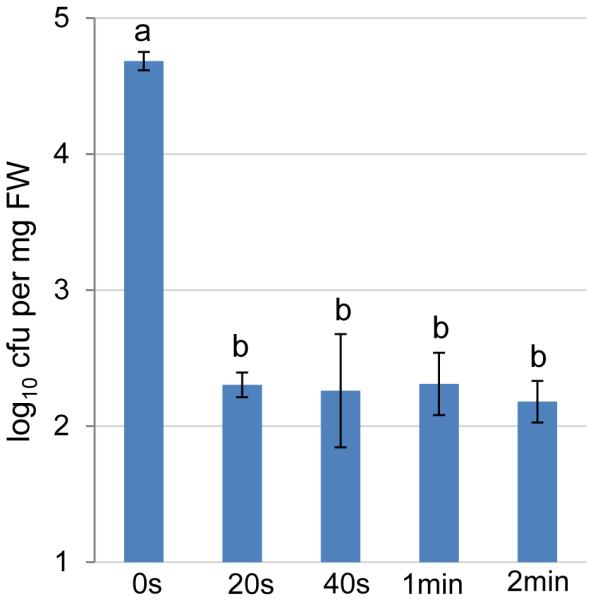
Validation of 1 min as an effective surface sterilization time. Five-week old Col-0 plants were sprayed with H2O and kept under high humidity (~95%) for 5 days. Leaves were detached, surface sterilized in 75% ethanol for 20s, 40s, 1min or 2min and then rinsed in sterile water twice. No sterilization (0s) was used as control. Leaves were ground in sterile water and bacterial numbers were determined by serial dilutions and counting of colony-forming units on R2A plates. Statistical analysis was performed by one-way ANOVA with Tukey’s test (p value set at 0.05). Bacterial populations indicated by different letters (i.e., a and b) are significantly different. n=4 technical replicates; error bars, mean±s.d. Experiments were repeated twice with similar results.
Extended Data Table 1.
| Order/Family | Col-0 | mfec | mbbc |
|---|---|---|---|
| Bacillales | |||
| Paenibacillaceae | 15 (30%) | ND | ND |
|
| |||
| Burkholderiales | |||
| Comamonadaceae | 8 (16%) | 12 (24%) | 9 (18%) |
| Burkholderiaceae | 4 (8%) | 1 (2%) | 22 (44%) |
| Alcaligenaceae | 3 (6%) | 19 (38%) | 12 (24%) |
|
| |||
| Flavobacteriales | |||
| Flavobacteriaceae | 6 (12%) | 1 (2%) | 1 (2%) |
|
| |||
| Xanthomonadales | |||
| Xanthomonadaceae | 4 (8%) | 9 (18%) | ND |
|
| |||
| Sphingomonadales | |||
| Sphingomonadaceae | 3 (6%) | ND | 1 (2%) |
|
| |||
| Sphingobacteriales | |||
| Sphingobacteriaceae | 3 (6%) | ND | ND |
| Chitinophagaceae | 1 (2%) | ND | ND |
|
| |||
| Rhizobiales | |||
| Rhizobiaceae | 2 (4%) | 5 (10%) | ND |
|
| |||
| Cytophagales | |||
| Cytophagaceae | 1 (2%) | ND | ND |
|
| |||
| Pseudomonadales | |||
| Pseudomonadaceae | ND | 1 (2%) | 5 (10%) |
|
| |||
| Actinomycetales | |||
| Microbacteriaceae | ND | 2 (4%) | ND |
Supplementary Material
Supplementary Video 1: A movie showing the process of Pst DC3000 infection of Arabidopsis plants. Five-week-old Col-0 plants were dip-inoculated with Pst DC3000 at 1×10⁸ cfu/ml. Plants were kept under high humidity (~95%) and the disease symptoms were recorded over 4 days. The process was sped up by 8,640-fold (24 h to 10 seconds). The recording started 7 h after inoculation and the red arrow indicates one leaf, as an example, that showed the transient appearance of water soaking.
Supplementary Figure 1: Uncropped gel/blot images. Red boxes indicate cropped sections that are used in the main or Extended Data figures. Diagram in a indicates how the two gel blots in b and c were generated.
Acknowledgements
We thank He lab members for insightful discussions and constructive suggestions. We thank James Kremer for help with setting up real-time disease imaging experiments and advice on 16S rRNA amplicon sequencing, Koichi Sugimoto for providing tomato plants (cv. Castle Mart), and Caitlin Thireault for technical help. This project was supported by funding from Gordon and Betty Moore Foundation (GBMF3037), National Institutes of Health (GM109928) and the Department of Energy (the Chemical Sciences, Geosciences, and Biosciences Division, Office of Basic Energy Sciences, Office of Science; DE–FG02–91ER20021 for infrastructural support). C.Z acknowledges support from The Gatsby Charitable Foundation.
Footnotes
Supplementary Information is linked to the online version of the paper at www.nature.com/nature.
Author Contributions
X-F.X, K.N, and S.Y.H designed the experiments. K.A performed the Pst DC3000-lux imaging experiment. A.C.V performed biological repeats of bacterial infection experiments shown in Fig. 1a. J.Y characterized an unpublished plant mutant line. X-F.X and K.N performed all other experiments, including bacterial infections, protein blotting and generation of Arabidopsis mfec and mbbc mutant lines. F.B and C.Z contributed unpublished plant mutant materials. J.H.C contributed unpublished Pst DC3000 effector constructs. X-F.X and S.Y.H wrote the manuscript with input from all co-authors.
Reprints and permissions information is available at www.nature.com/reprints.
The authors declare no competing financial interests. Readers are welcome to comment on the online version of the paper.
References
- 1.Miller S, Rowe R, Riedel R. Bacterial spot, speck, and canker of Tomatoes. Ohio State University Extension; 1996. Fact Sheet HYG-3120-96. [Google Scholar]
- 2.Pernezny K, Zhang S. Bacterial speck of tomato. University of Florida IFAS; 2005. Extension PP-10. [Google Scholar]
- 3.Schwartz HF. Bacterial diseases of beans. Colorado State University Extension; 2011. Fact Sheet No: 2.913. [Google Scholar]
- 4.Stevens RB. Plant Pathology, an Advanced Treatise. Vol. 3. Academic Press; New York: 1960. [Google Scholar]
- 5.Buttner D, He SY. Type III protein secretion in plant pathogenic bacteria. Plant Physiol. 2009;150:1656–1664. doi: 10.1104/pp.109.139089. [DOI] [PMC free article] [PubMed] [Google Scholar]
- 6.Galán J, Collmer A. Type III secretion machines: bacterial devices for protein delivery into host cells. Science. 1999;284:1322–1328. doi: 10.1126/science.284.5418.1322. [DOI] [PubMed] [Google Scholar]
- 7.Asai S, Shirasu K. Plant cells under siege: plant immune system versus pathogen effectors. Curr. Opin. Plant Biol. 2015;28:1–8. doi: 10.1016/j.pbi.2015.08.008. [DOI] [PubMed] [Google Scholar]
- 8.Dou D, Zhou JM. Phytopathogen effectors subverting host immunity: different foes, similar battleground. Cell Host Microbe. 2012;12:484–495. doi: 10.1016/j.chom.2012.09.003. [DOI] [PubMed] [Google Scholar]
- 9.Macho AP, Zipfel C. Targeting of plant pattern recognition receptor-triggered immunity by bacterial type-III secretion system effectors. Curr. Opin. Microbiol. 2015;23:14–22. doi: 10.1016/j.mib.2014.10.009. [DOI] [PubMed] [Google Scholar]
- 10.Asrat S, Davis KM, Isberg RR. Modulation of the host innate immune and inflammatory response by translocated bacterial proteins. Cell Microbiol. 2015;17:785–795. doi: 10.1111/cmi.12445. [DOI] [PMC free article] [PubMed] [Google Scholar]
- 11.Sperandio B, Fischer N, Sansonetti PJ. Mucosal physical and chemical innate barriers: Lessons from microbial evasion strategies. Sem. Immunol. 2015;27:111–118. doi: 10.1016/j.smim.2015.03.011. [DOI] [PubMed] [Google Scholar]
- 12.Gimenez-Ibanez S, Ntoukakis V, Rathjen JP. The LysM receptor kinase CERK1 mediates bacterial perception in Arabidopsis. Plant Signal. Behav. 2009;4:539–541. doi: 10.4161/psb.4.6.8697. [DOI] [PMC free article] [PubMed] [Google Scholar]
- 13.Macho AP, Zipfel C. Plant PRRs and the activation of innate immune signaling. Mol. Cell. 2014;54:263–272. doi: 10.1016/j.molcel.2014.03.028. [DOI] [PubMed] [Google Scholar]
- 14.Schwessinger B, et al. Phosphorylation-dependent differential regulation of plant growth, cell death, and innate immunity by the regulatory receptor-like kinase BAK1. PLoS Genet. 2011;7:e1002046. doi: 10.1371/journal.pgen.1002046. [DOI] [PMC free article] [PubMed] [Google Scholar]
- 15.Tsuda K, Sato M, Stoddard T, Glazebrook J, Katagiri F. Network properties of robust immunity in plants. PLoS Genet. 2009;5:e1000772. doi: 10.1371/journal.pgen.1000772. [DOI] [PMC free article] [PubMed] [Google Scholar]
- 16.Yuan J, He SY. The Pseudomonas syringae Hrp regulation and secretion system controls the production and secretion of multiple extracellular proteins. J. Bacteriol. 1996;178:6399–6402. doi: 10.1128/jb.178.21.6399-6402.1996. [DOI] [PMC free article] [PubMed] [Google Scholar]
- 17.Cunnac S, et al. Genetic disassembly and combinatorial reassembly identify a minimal functional repertoire of type III effectors in Pseudomonas syringae. Proc. Natl. Acad. Sci. USA. 2011;108:2975–2980. doi: 10.1073/pnas.1013031108. [DOI] [PMC free article] [PubMed] [Google Scholar]
- 18.Hirano SS, Upper CD. Population biology and epidemiology of Pseudomonas syringae. Annu. Rev. Phytopathol. 1990;28:155–177. [Google Scholar]
- 19.Fan J, Crooks C, Lamb C. High-throughput quantitative luminescence assay of the growth in planta of Pseudomonas syringae chromosomally tagged with Photorhabdus luminescens luxCDABE. Plant J. 2008;53:393–399. doi: 10.1111/j.1365-313X.2007.03303.x. [DOI] [PubMed] [Google Scholar]
- 20.Badel JL, Shimizu R, Oh HS, Collmer A. A Pseudomonas syringae pv. tomato avrE1/hopM1 mutant is severely reduced in growth and lesion formation in tomato. Mol. Plant Microbe Interact. 2006;19:99–111. doi: 10.1094/MPMI-19-0099. [DOI] [PubMed] [Google Scholar]
- 21.DebRoy S, Thilmony R, Kwack YB, Nomura K, He SY. A family of conserved bacterial effectors inhibits salicylic acid-mediated basal immunity and promotes disease necrosis in plants. Proc. Natl. Acad. Sci. USA. 2004;101:9927–9932. doi: 10.1073/pnas.0401601101. [DOI] [PMC free article] [PubMed] [Google Scholar]
- 22.Nomura K, et al. A bacterial virulence protein suppresses host innate immunity to cause plant disease. Science. 2006;313:220–223. doi: 10.1126/science.1129523. [DOI] [PubMed] [Google Scholar]
- 23.Xin XF, et al. Pseudomonas syringae effector Avirulence protein E localizes to the host plasma membrane and down-regulates the expression of the NONRACE-SPECIFIC DISEASE RESISTANCE1/HARPIN-INDUCED1-LIKE13 gene required for antibacterial immunity in Arabidopsis. Plant Physiol. 2015;169:793–802. doi: 10.1104/pp.15.00547. [DOI] [PMC free article] [PubMed] [Google Scholar]
- 24.Wei CF, et al. A Pseudomonas syringae pv. tomato DC3000 mutant lacking the type III effector HopQ1-1 is able to cause disease in the model plant Nicotiana benthamiana. Plant J. 2007;51:32–46. doi: 10.1111/j.1365-313X.2007.03126.x. [DOI] [PubMed] [Google Scholar]
- 25.Nomura K, et al. Effector-triggered immunity blocks pathogen degradation of an immunity-associated vesicle traffic regulator in Arabidopsis. Proc. Natl. Acad. Sci. USA. 2011;108:10774–10779. doi: 10.1073/pnas.1103338108. [DOI] [PMC free article] [PubMed] [Google Scholar]
- 26.Tanaka H, Kitakura S, De Rycke R, De Groodt R, Friml J. Fluorescence imaging-based screen identifies ARF GEF component of early endosomal trafficking. Curr. Biol. 2009;19:391–397. doi: 10.1016/j.cub.2009.01.057. [DOI] [PubMed] [Google Scholar]
- 27.Kim MG, et al. Two Pseudomonas syringae type III effectors inhibit RIN4-regulated basal defense in Arabidopsis. Cell. 2005;121:749–759. doi: 10.1016/j.cell.2005.03.025. [DOI] [PubMed] [Google Scholar]
- 28.Hiruma K, et al. Root Endophyte Colletotrichum tofieldiae Confers Plant Fitness Benefits that Are Phosphate Status Dependent. Cell. 2016;165:464–474. doi: 10.1016/j.cell.2016.02.028. [DOI] [PMC free article] [PubMed] [Google Scholar]
- 29.Miya A, et al. CERK1, a LysM receptor kinase, is essential for chitin elicitor signaling in Arabidopsis. Proc. Natl. Acad. Sci. USA. 2007;104:19613–19618. doi: 10.1073/pnas.0705147104. [DOI] [PMC free article] [PubMed] [Google Scholar]
- 30.Preston G, Deng WL, Huang HC, Collmer A. Negative regulation of hrp genes in Pseudomonas syringae by HrpV. J. Bacteriol. 1998;180:4532–4537. doi: 10.1128/jb.180.17.4532-4537.1998. [DOI] [PMC free article] [PubMed] [Google Scholar]
- 31.Feng Z, et al. Multigeneration analysis reveals the inheritance, specificity, and patterns of CRISPR/Cas-induced gene modifications in Arabidopsis. Proc. Natl. Acad. Sci. USA. 2014;111:4632–4637. doi: 10.1073/pnas.1400822111. [DOI] [PMC free article] [PubMed] [Google Scholar]
- 32.Hauck P, Thilmony R, He SY. A Pseudomonas syringae type III effector suppresses cell wall-based extracellular defense in susceptible Arabidopsis plants. Proc. Natl. Acad. Sci. USA. 2003;100:8577–8582. doi: 10.1073/pnas.1431173100. [DOI] [PMC free article] [PubMed] [Google Scholar]
- 33.Bai Y, et al. Functional overlap of the Arabidopsis leaf and root microbiota. Nature. 2015;528:364–369. doi: 10.1038/nature16192. [DOI] [PubMed] [Google Scholar]
- 34.Wang Q, Garrity GM, Tiedje JM, Cole JR. Naïve Bayesian Classifier for Rapid Assignment of rRNA Sequences into the New Bacterial Taxonomy. Appl Environ Microbiol. 2007;73:5261–5267. doi: 10.1128/AEM.00062-07. [DOI] [PMC free article] [PubMed] [Google Scholar]
Associated Data
This section collects any data citations, data availability statements, or supplementary materials included in this article.
Supplementary Materials
Supplementary Video 1: A movie showing the process of Pst DC3000 infection of Arabidopsis plants. Five-week-old Col-0 plants were dip-inoculated with Pst DC3000 at 1×10⁸ cfu/ml. Plants were kept under high humidity (~95%) and the disease symptoms were recorded over 4 days. The process was sped up by 8,640-fold (24 h to 10 seconds). The recording started 7 h after inoculation and the red arrow indicates one leaf, as an example, that showed the transient appearance of water soaking.
Supplementary Figure 1: Uncropped gel/blot images. Red boxes indicate cropped sections that are used in the main or Extended Data figures. Diagram in a indicates how the two gel blots in b and c were generated.
Data Availability Statement
The bacterial 16S rRNA sequences in Extended Data Table 1 have been deposited in the National Center for Biotechnology Information (NCBI) GenBank database under accession numbers KX959313-KX959462. Other data that support the findings of this study are available from the corresponding author upon request.


