Significance
Multiple sclerosis is a devastating neurological condition that can affect the entire central nervous system. Innate immune cells mediate the underlying tissue damage, but visualizing these cellular culprits is currently not possible. Diagnosis and treatment monitoring are performed by MRI, but so far imaging markers are unspecific and based on secondary parameters (edema/gliosis; blood–brain barrier disruption). We used a nanoparticle-based approach to image brain-resident and infiltrating innate immune cells in inflammatory lesions. Nanoparticle uptake is specific for innate immune cells and correlates with clinical severity. Thus, targeting innate immunity by molecular imaging may serve as a direct marker of disease activity with the potential of clinical translation to a wide variety of inflammatory conditions for improved diagnosis and treatment monitoring.
Keywords: MRI, nanoparticle imaging, USPIO, multiple sclerosis, EAE
Abstract
Innate immune cells play a key role in the pathogenesis of multiple sclerosis and experimental autoimmune encephalomyelitis (EAE). Current clinical imaging is restricted to visualizing secondary effects of inflammation, such as gliosis and blood–brain barrier disruption. Advanced molecular imaging, such as iron oxide nanoparticle imaging, can allow direct imaging of cellular and molecular activity, but the exact cell types that phagocytose nanoparticles in vivo and how phagocytic activity relates to disease severity is not well understood. In this study we used MRI to map inflammatory infiltrates using high-field MRI and fluorescently labeled cross-linked iron oxide nanoparticles for cell tracking. We confirmed nanoparticle uptake and MR detectability ex vivo. Using in vivo MRI, we identified extensive nanoparticle signal in the cerebellar white matter and circumscribed cortical gray matter lesions that developed during the disease course (4.6-fold increase of nanoparticle accumulation in EAE compared with healthy controls, P < 0.001). Nanoparticles showed good cellular specificity for innate immune cells in vivo, labeling activated microglia, infiltrating macrophages, and neutrophils, whereas there was only sparse uptake by adaptive immune cells. Importantly, nanoparticle signal correlated better with clinical disease than conventional gadolinium (Gd) imaging (r, 0.83 for nanoparticles vs. 0.71 for Gd-imaging, P < 0.001). We validated our approach using the Food and Drug Administration-approved iron oxide nanoparticle ferumoxytol. Our results show that noninvasive molecular imaging of innate immune responses can serve as an imaging biomarker of disease activity in autoimmune-mediated neuroinflammation with potential clinical applications in a wide range of inflammatory diseases.
Multiple sclerosis (MS) is a devastating neurological condition that exhibits predominant white matter (WM) but also gray matter (GM) injury (1). Its animal model, experimental autoimmune encephalomyelitis (EAE), mimics important aspects of the disease. EAE is characterized by severe demyelination and axonal degeneration caused by infiltrating T cells, B cells, and innate immune cells (2). It is well established that innate immune cells, including tissue-resident microglia and recruited macrophages, are potent mediators of tissue damage (3). Blocking their activity or skewing macrophages toward an anti-inflammatory subtype ameliorates EAE and MS. Clinical diagnosis and treatment monitoring are performed mainly by MRI (4). So far, MRI markers of the disease are based on indirect parameters such as edema, gliosis, and the disruption of the blood–brain barrier (BBB) [as assessed by gadolinium (Gd) contrast agents]. Recently, additional contrast agents have become available that are based on magnetic nanoparticles with phagocyte tropism to target inflammatory effector cells directly (5). These nanoparticles (ultra small paramagnetic iron oxide nanoparticles, USPIOs) are phagocytosed by activated tissue-resident phagocytes and circulating myeloid effector cells that migrate to inflammatory sites. Thus, magnetic nanoparticle-enhanced MRI allows cell tracking and an estimation of the inflammatory burden. Direct imaging of effector cells that mediate inflammation and tissue damage would be desirable but has not been introduced into clinical practice despite several preclinical and clinical feasibility studies (6–12). For the detection of active MS lesions, Gd-enhanced imaging remains the gold standard but has limited sensitivity and specificity. Here, USPIOs might add diagnostic value (6). Gd visualizes only BBB disruption (BBB-D), a nonspecific effect of inflammation or other pathological states. One unresolved controversy relates to the cell types targeted by magnetic nanoparticles (e.g., monocytes, macrophages, or neutrophils); but assessing targeting specificity is difficult in human studies. In this preclinical study we used cross-linked iron oxide nanoparticles (CLIOs), a well-studied nanoparticle in cancer (13–15). We hypothesized that after the activation and homing of macrophages to inflammatory sites, nanoparticle-labeled immune cells could be visualized and quantified within EAE lesions. Labeling of CLIO with fluorescent dyes was used to validate MRI signals using innovative ultramicroscopy (UM) of cleared brains, confocal microscopy, and flow cytometry. Flow cytometric analyses were performed to phenotype inflammatory infiltrates. Finally, we used the Food and Drug Administration (FDA)-approved iron oxide nanoparticle ferumoxytol (16–20) to corroborate the clinical potential of our approach.
Materials and Methods
EAE Induction.
Female SJL mice (6–12 wk old) were obtained from Jackson Laboratories. EAE was induced by s.c. injecting 200 µg proteolipid protein (PLP) peptide (PLP139–151; GenScript), emulsified in 50 µL PBS and 50 µL of complete Freund’s adjuvant (BD Difco, Fisher Scientific) containing 4 mg/mL heat-inactivated Mycobacterium tuberculosis H37 Ra (BD Difco, Fisher Scientific). Two hundred nanograms of pertussis toxin (PTx) (List Biological Laboratories) dissolved in 200 µL PBS was administered i.p. on days 0 and 2. The animal protocol was approved by the animal welfare authority (G-212-13, Regierungspräsidium Karlsruhe) and the Institutional Animal Care and Use Committee (Massachusetts General Hospital). Additional details are given in SI Materials and Methods.
MRI.
MRI was performed on a 9.4-Tesla (T) horizontal-bore small animal MRI scanner (BioSpec 94/20 USR; Bruker BioSpin GmbH) with a four-channel phased-array surface receiver coil. The brain MRI protocol included a T2-weighted (T2-w) rapid acquisition with relaxation enhancement (RARE) sequence to assess edema and a T1-weighted (T1-w) fast low-angle shot (FLASH) sequence to assess BBB-D after Gd administration. A T2*-w FLASH sequence (21) was used to assess USPIO uptake. For magnetic nanoparticle imaging, we i.v. injected mice with CLIO-FITC, CLIO-TAMRA (kindly provided by R. Weissleder, Massachusetts General Hospital, Harvard Medical School, Boston), or ferumoxytol (Feraheme; AMAG Pharmaceuticals Inc.) at a concentration of 15 mg/kg diluted in 150 µL PBS. Additional details are given in SI Materials and Methods.
Clearing of Mouse Brains and Acquisition of UM Data.
For UM analysis whole brains were optically cleared using the FluorClearBABB protocol (22, 23). Additional details are given in SI Materials and Methods.
Histology and Immunohistochemistry.
For histological correlation analysis, mice were killed in deep anesthesia by intracardial perfusion with PBS, followed by 4% paraformaldehyde (PFA, Roti-Histofix; Carl Roth). Brains were dissected and either snap-frozen in Tissue-Tek optimum cutting temperature (O.C.T.) compound (VWR) or processed for standard paraffin histology. Five to ten-micrometer cryostat or microtome sections were cut. Stainings were performed with ionized calcium-binding adaptor molecule 1 (Iba-1) antibody (WAKO) for macrophages/microglia, with CD3 antibody (Dako) for T cells, with CD45R antibody (eBioscience) for B cells, and with myeloperoxidase (MPO) antibody (Abcam) using standard immunohistochemistry protocols. Tile scans (20× of the entire cerebellum, midbrain, and cortex) and higher-magnification images (60×) were acquired by confocal microscopy (Olympus FV1000 or Zeiss LSM700). Additional details are given in SI Materials and Methods.
Isolation of Immune Cells and Flow Cytometry.
SJL mice were killed by an overdose of 100 mg/kg ketamine and 20 mg/kg xylazine (kx), and blood was drawn from the heart before intracardial perfusion with PBS. Brain, spinal cord, bone marrow, liver, spleen, and lymph nodes were excised. The cerebrum and cerebellum were homogenized separately. Brain leukocytes were isolated and used for flow cytometry as previously described (24). Additional details are given in SI Materials and Methods.
Statistical Analysis.
Data are shown as mean ± SEM. Statistical analyses were performed in PRISM (GraphPad). Additional details in SI Materials and Methods.
SI Materials and Methods
EAE Induction.
Animals were monitored daily with the following scoring system: 0 = no neurological symptoms; 0.5 = partial tail limpness; 1 = complete tail limpness; 1.5 = limp tail and mild hind leg paresis or mild ataxia; 2 = hind limb paresis or severe ataxia; 2.5 = complete paresis of hind limbs or paralysis of one hind leg; 3 = complete hind limb paralysis; 3.5 = complete hind limb paralysis plus paresis of front limbs; 4 = complete hind limb paralysis plus partial front limb paralysis; 4.5 = signs of 4 plus decreased responsiveness; 5 = moribund. The study was performed with a total of 110 mice.
MRI.
The T2-w sequence parameters were as follows: 3D sequence: echo time (TE) 33 ms; repetition time: (TR) 1,800 ms; flip angle: 90°; acquisition matrix: 200 × 200; number of averages: 1; in plane resolution: 100 µm; duration: 10 min 48 s. The T1-w parameters were as follows: 3D sequence: TE: 1.9 ms; TR: 5 ms; flip angle: 60°; acquisition matrix: 128 × 128; number of averages: 4; in-plane resolution: 156 µm; duration: 5 min 28 s. The T2*-w parameters were as follows: 3D sequence: 80 µm isotropic resolution; TE: 18 ms; TR: 50 ms; flip angle: 12°; number of averages: 1; acquisition matrix: 400 × 188 × 100; duration: 15 min 40 s. The abdominal MR protocol consisted of a coronal and transversal T2-w sequence. (The parameters for the coronal sequence were as follows: 2D sequence: TE: 23.5 ms; TR: 500 ms; flip angle: 90°; acquisition matrix: 384 × 384; number of averages: 1; in-plane resolution: 208 × 156 µm; slice thickness: 0.625 mm; duration: 9 min 36 s. Parameters for the transversal sequence were as follows: 2D sequence: TE: 23 ms; TR: 1,508 ms; flip angle: 90°; acquisition matrix: 320 × 320; number of averages: 9; in-plane resolution: 125 µm; slice thickness: 1 mm; duration: 9 min 2 s. CLIO specifications were as follows: particle size: 32 nm; zeta potential: 6.62; R1: 27.34 mM/s; R2: 72.17 mM/s; 15.5 fluorescent molecules per particle. After nanoparticle imaging 0.2 mmol/kg gadodiamide (Omniscan; Nycomed) was administered to assess BBB integrity with T1-w. MRI was started at day 6–12 when the animal became symptomatic and was repeated 24 h (ferumoxytol) or 48 h (CLIO) after contrast administration (acute time point). For the investigation of the remission phase of the disease, imaging was performed 10–14 d after disease onset (48 h after the second CLIO injection). For MRI, animals were anesthetized with 3% isoflurane. Anesthesia was maintained with 0.5–1.5% isoflurane. Animals were kept on a heating pad to maintain constant body temperature, and respiration was monitored externally during imaging with a breathing surface pad controlled by a LabVIEW program developed in house (National Instruments Corporation). For ex vivo imaging, mice were killed with ketamine and xylazine (kx) and subsequent intracardial perfusion with PBS (n = 3 mice). Brains were explanted and imaged in a 15-mL Falcon tube (Corning) using a four-channel phase-array mouse body coil and the T2* sequence described above. For imaging of monocyte cultures (see below), cell suspensions were imaged using the T2*-w sequence described above. MR images were exported as DICOM files and were visualized in OsiriX Imaging software (version 4.12; Pixmeo). For the quantification of MRI data, T2* hypointense and Gd-enhanced areas were segmented semiautomatically using AMIRA (FEI).
Clearing of Mouse Brains and Acquisition of UM Data.
SJL mice were killed by an overdose of kx and perfused intracardially with PBS, followed by 4% PFA. Brains were excised and post-fixed in 4% PFA overnight in the dark at 4 °C. For UM-analysis whole brains were optically cleared using the FluorClearBABB protocol that is based on benzyl alcohol/benzyl benzoate clearing in combination with a basic pH (23). For the dehydration of brains, analytical grade alcohol (t-butanol; Sigma-Aldrich) was diluted with double-distilled water. Brains were dehydrated using t-butanols ranging from 30–100%. Samples were incubated for 24 h per t-butanol solution. The clearing solution BABB was prepared by mixing analytical grade benzyl alcohol (Merck) and purissimum p.A. grade benzyl benzoate (Sigma-Aldrich) in a 1:2 (vol:vol) ratio. Incubation time for the last step using BABB was 48 h. The pH levels of dehydration and clearing solutions were adjusted using an InLab Science electrode suited for organic solvents (Mettler-Toledo). pH levels were adjusted with triethylamine (Sigma-Aldrich). Samples were kept in black 50-mL Falcon tubes and were mounted onto a turning wheel (program C3, 15 rpm, intelli-mixer; Neo Laboratories) during the clearing procedure. Afterwards samples were stored in the dark at 4 °C. Repetitive measurements were possible with this method. Cleared brains were scanned with a light sheet microscope (LaVision BioTec GmbH) and a white light laser (SuperK EXTREME 80 MHz VIS; NKT Photonics) with a wavelength spectrum of 400–2,400 nm. For the detection of CLIO-FITC, the following filters were used: excitation at 470/40 nm; emission at 525/50 nm. Three hundred to four hundred transversal imaging planes of the entire brain were acquired (z-step, 5 µm). Measurements with exposure times of 300 ms per slice resulted in an acquisition time of ∼10 min per brain. Images were exported as tagged image files (tif) and were postprocessed further in the ImageJ package FIJI, version 1.49 (fiji.sc/).
Histology and Immunohistochemistry.
For the quantification of Iba-1–stained sections an automated macro was created in FIJI. Three representative high-power fields in the cerebellar GM and WM were selected per tile scan. Iba-1 images were thresholded and binarized. Iba-1+ cells were counted using the FIJI plugin Analyze particles. For the quantification of CLIO uptake by Iba-1+ cells, the mean fluorescence intensity of the CLIO channel that located to Iba-1+ cells was quantified after background subtraction. Staining for NFP was performed to assess axonal integrity. Paraffin sections were stained using an anti-NFP antibody (clone 2F11; Dako). HRP-coupled streptavidin (VECTASTAIN Elite ABC kit; Vector Laboratories) was used to detect the biotinylated secondary antibody. Then sections were exposed to the ultraView Universal DAB Detection Kit (Dako) according to the manufacturer’s protocol and were counterstained with hematoxylin. For the assessment of myelination, we used Luxol Fast Blue (LFB) staining for myelin. Paraffin sections were deparaffinized, and 0.1% LFB staining solution was applied overnight. Sections were differentiated in 0.05% lithium carbonate and 70% ethyl alcohol. Hematoxylin was used as a nuclear counterstain. Iron staining was performed by a Prussian blue iron staining kit (HT20; Sigma-Aldrich) with DAB enhancement (Sigma-Aldrich) and Nuclear Fast Red counterstain (Sigma-Aldrich) following the manufacturer’s instructions. Stainings were analyzed by wide-field microscopy (Zeiss Cell Observer).
Isolation of Immune Cells and Flow Cytometry.
CNS tissue was digested in HBSS (Sigma-Aldrich) supplemented with 0.05% Collagenase D (Roche), 0.1 µg/mL Tosyl-l-lysyl-chloromethane hydrochloride (TLCK) trypsin inhibitor (Sigma-Aldrich), 10 µg/mL DNase I (Sigma-Aldrich), and 10 mM Hepes (pH 7.4) (Sigma-Aldrich) for 1 h at 37 °C with occasional shaking. Myeloid effector cells were separated with a four-layer Percoll density gradient (1 mg/mL, 1.072 mg/mL, 1.088 mg/mL, 1.124 mg/mL) (Easycoll; Biochrom). Single-cell suspensions from CNS were transferred into a 96-well plate and stained with the following antibodies: Pacific Orange (PO)-labeled CD45 AB (catalog no. MCD4530; Thermo Fisher), phycoerythrin (PE)-Cy7–labeled CD11b AB (catalog no. BLD-101216; BioLegend), and eFluor450-labeled fixable viability dye (catalog no. 65-0863-14; eBioscience). Further antibodies included PE anti-Ly6G (1A8); PE anti-B220; RA3-6B2; PerCP/Cy5.5 anti-Ly6C, HK1.4; PE/Cy5 anti-CD8a, 53-6.7; PE/Cy7 anti-CD3e, 145-2C11; Pacific Blue anti-CD45, 30-F11; APC anti-F4/80, BM8; APC anti-CD4, GK1.5; and APC/Cy7 anti-CD11b, M1/70 (BioLegend). Internal organs (spleen, liver, and lymph nodes) were dissociated into single cells by mashing the tissue through a 70-µm cell strainer. Single-cell suspensions, bone marrow, and blood buffy coat were stained with CD45, CD11b, CD3, and CD19 antibodies and were used for flow cytometry. Data were acquired on a BD FACSCanto II (BD Biosciences) and an LSR II flow cytometer (BD Biosciences) and were analyzed with the FlowJo software V8.7 (TreeStar). Cell doublets were excluded by analysis of forward scatter (FSC)-W vs. FSC-A. Dead cells were excluded via analysis of eFluor450 staining. Macrophage and microglia populations were identified based on their CD45/CD11b expression.
Preparation of Bone Marrow-Derived Macrophages.
To assess the capacity of myeloid effector cells to phagocytose nanoparticles in a controlled in vitro system, we isolated bone marrow-derived macrophages (BMDMs) and performed nanoparticle uptake experiments. Healthy SJL mice (n = 6) were killed by cervical dislocation, and bone marrow cells were isolated from the femur and tibia by flushing with Iscove's Modified Dulbecco's Medium (IMDM) (Invitrogen). Cells were filtered through a 70-µm nylon mesh and pelleted. After osmotic erythrocyte lysis cells were pelleted and resuspended in BMDM differentiation medium [IMDMsupplemented with 10% FBS (Sigma-Aldrich), 100 U/mL penicillin (Sigma-Aldrich), 0.1 mg/mL streptomycin (Sigma-Aldrich), and 5 ng/mL M-CSF (Sigma-Aldrich)]. For in vitro MRI experiments, triplicates of 105 BMDMs were grown in a 12-well plate containing 800 µL of BMDM differentiation medium. For immunohistochemistry, 1.5 × 10⁵ bone marrow cells were cultivated in 400 µL of BMDM differentiation medium in a 24-well plate with and without a coverslip. Differentiation and culture were performed for 7 d at 37 °C in 5% CO2. The medium was exchanged every 3 d. For activation experiments, BMDM were seeded in IMDM supplemented with 10% FBS (Sigma-Aldrich), 100 U/mL penicillin (Sigma-Aldrich), and 0.1 mg/mL streptomycin (Sigma-Aldrich) containing varying chemokine concentrations for 48 h [M0: none; M1: 100 ng/mL LPS (Sigma) + 10 ng/mL IFNγ (PeproTech); M2: 10 ng/mL IL4 (PeproTech) + 10 ng/mL IL13 (PeproTech)]. Two hours before analysis, macrophages were incubated with varying concentrations of CLIO-FITC (100 µg/mL, 500 µg/mL, or none) and were used for FACS analysis, MRI, and immunocytochemistry. For flow analysis adherent macrophages were detached from culture plates by incubation with 0.05% Trypsin-EDTA for 20 min at 37 °C. Cells were pelleted and stained with the following antibodies: PO-labeled CD45 AB (catalog no. MCD4530; Thermo Fisher), PE-Cy7–labeled CD11b AB (catalog no. BLD-101216; BioLegend), APC.eFluor780-labeled F4/80 AB (catalog no. 47-4801-50; eBioscience), and PB/eFluor450-labeled fixable viability dye (catalog no. 65-0863-14; eBioscience). For immunocytochemistry of BMDM, coverslips with adherent macrophages were removed from the plate well. Cells were fixed with Cytofixx cell spray (CellPath) for 30 min at room temperature and with 4% PFA for another 30 min. To block unspecific antibody binding, cells were incubated with 5% FCS in PBS for 1 h at room temperature. F4/80 antibody (rat anti-mouse; catalog no.14-4801-81; eBioscience) was used to label macrophages. To detect the primary antibody, an anti-rat secondary antibody labeled with Alexa Fluor 546 (catalog no. A11081; Thermo Fisher) was used. Coverslips were washed and mounted using mounting medium with DAPI (Vectashield). Image acquisition was performed with a confocal laser-scanning microscope (Olympus FV1000 or Zeiss LSM700). For the quantification, a semiautomated macro was created in FIJI. F4/80+ cells were traced manually. The mean fluorescence intensity of the CLIO channel that located to F4/80+ cells was quantified.
Isolation of Microglia and Nanoparticle Uptake.
Microglia were isolated from postnatal P0–P2 C57bl/6 pups as previously described (49). Briefly, brains were removed and rinsed in HBSS. After removal of the meninges, brains were mechanically dissociated and digested in 0.25% trypsin for 20 min. Cells were seeded in DMEM with 10% FCS and were cultured at 37 °C in humidified 5% CO2/95% air. The medium was exchanged every 4–5 d. Once cells were confluent (after 6–8 d), mixed glial cultures were split 1:3 and expanded for an additional week until they were confluent. Microglia were isolated from mixed glial cultures by the removal of astrocytes by incubation with 0.25% Trypsin-EDTA diluted 1:3 in serum-free DMEM for 45 min at 37 °C. After the floating astrocyte layer was removed, the adherent microglia were incubated with mixed glial culture-conditioned medium for 24 h. The following day, 0.25% trypsin-EDTA was added to adherent microglia for 10 min, and microglia were detached from the dish using a Cell Lifter (Corning Inc.) and were replated in 24-well plates containing glass coverslips at a density of 100,000 cells per well. Microglia were incubated with 100 µg/mL CLIO-FITC for 2 h. For microglia stainings, cells were fixed with 4% PFA and permeabilized with 0.25% Triton X-100. Cells were incubated with 1% BSA in PBS plus Tween-20 to block unspecific antibody labeling. Iba-1 antibody (catalog no. 019-19741; Wako) was used to stain microglia, followed by an anti-rabbit secondary antibody labeled with Alexa Fluor 594 (ab150080; Abcam). Image acquisition was performed on a Zeiss Cell Observer microscope.
Statistical Analysis.
Unpaired, two-tailed Student's t tests were used to compare two groups. One-way ANOVA with Bonferroni's post hoc testing or one-way ANOVA with Tukey's correction was used for multiple comparisons. Spearman's analysis was used for correlation analysis. P values ≤0.05 were considered statistically significant: *P ≤ 0.05; **P ≤ 0.01; ***P ≤ 0.001.
Results
Cultured Macrophages Take up CLIO-FITC and Can Be Imaged by MRI.
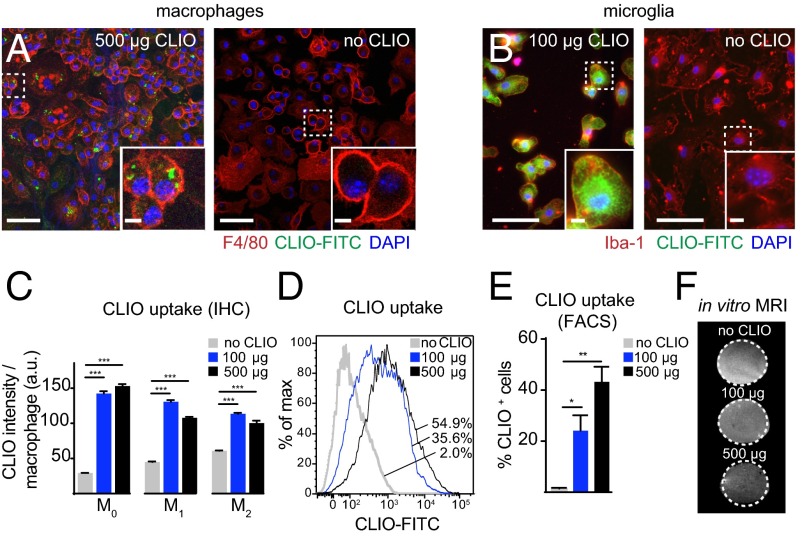
First, we examined the capacity of macrophages and microglia to phagocytose CLIO nanoparticles (Fig. 1 A and B). Monocytes from the bone marrow of healthy mice were isolated, cultivated in vitro, and polarized into M1- or M2-like macrophages using chemokine mixtures (25). We found that the two macrophage subtypes phagocytosed particles to a similar degree (Fig. 1C). The proportion of CLIO-labeled macrophages increased in a dose-dependent manner (Fig. 1 D and E). Importantly, in vitro-loaded macrophages exhibited a clear, dose-dependent signal drop when imaged by T2*-w MRI at 9.4 T (105 cells loaded with either 100 or 500 µg/mL of CLIO) (Fig. 1F). This result indicated that CLIO particle imaging should be feasible for in vivo studies.
Fig. 1.
Cultured macrophages and microglia phagocytose CLIO-FITC. (A and B) Confocal images of bone marrow-derived macrophages (BMDMs) (A) and microglia (B) incubated with or without CLIO-FITC (500 µg/mL and 100 µg/mL, respectively). (C) Quantification of immunohistochemistry of CLIO uptake per macrophage subtype. (D) Representative flow cytometry histogram of CLIO uptake by macrophages. Numbers indicate the respective frequency of CLIO+ cells. (E) Quantification of flow cytometry data. (F) T2*-w MRI of macrophages incubated with CLIO-FITC. BMDMs (105) were incubated for 2 h with or without CLIO. n = 3 independent biological replicates for C–F. (Scale bars: 50 µm for overview images in A and B; 5 µm for magnified Insets.)
PLP-Induced EAE Results in Rapidly Progressing Inflammatory Lesions.
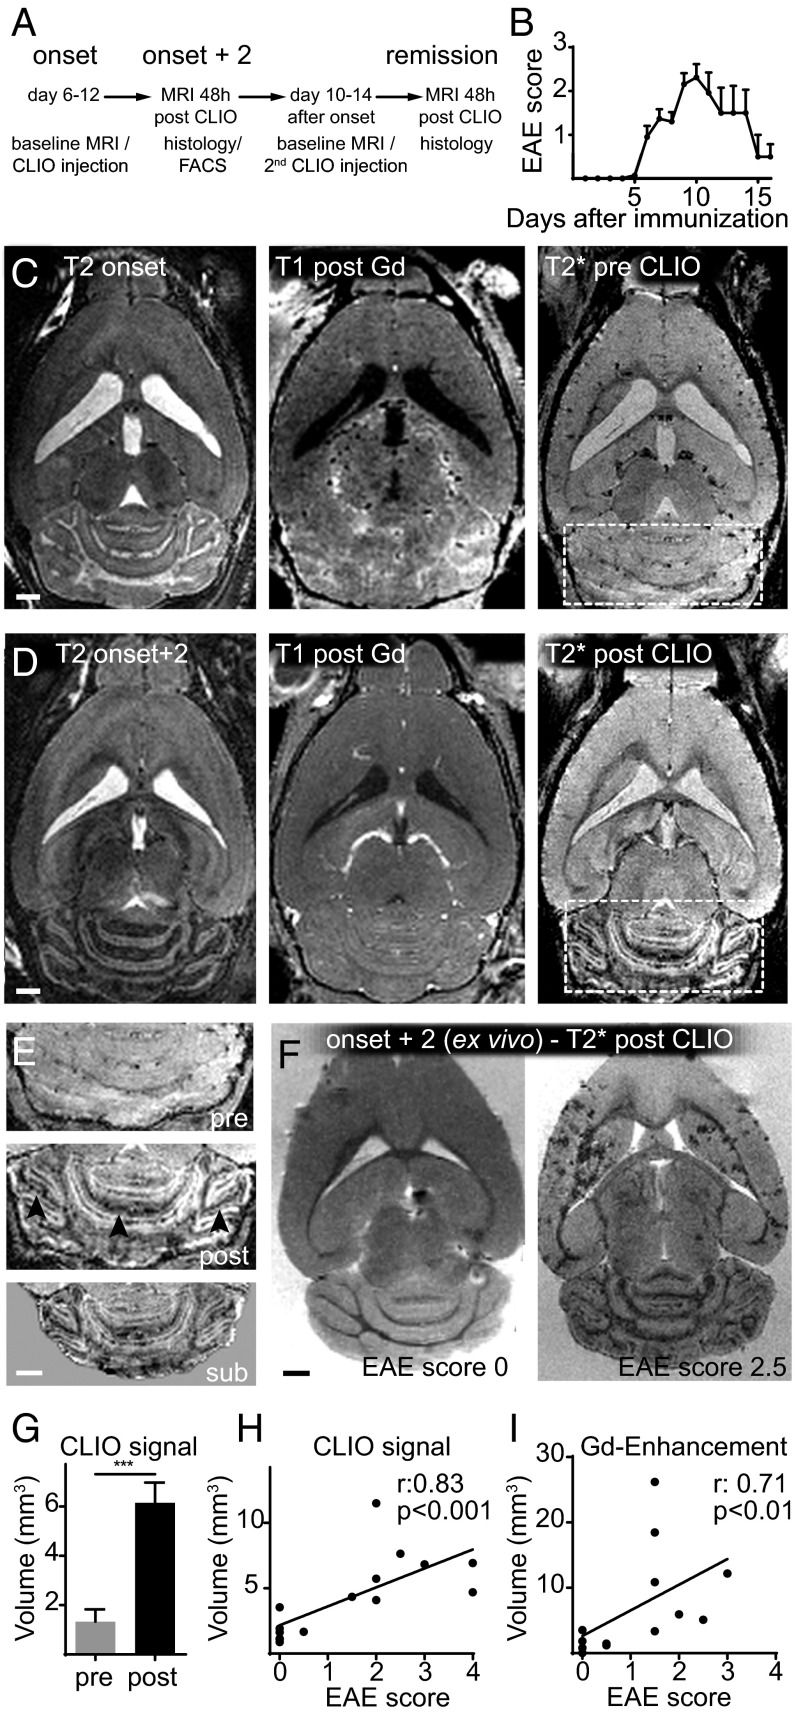
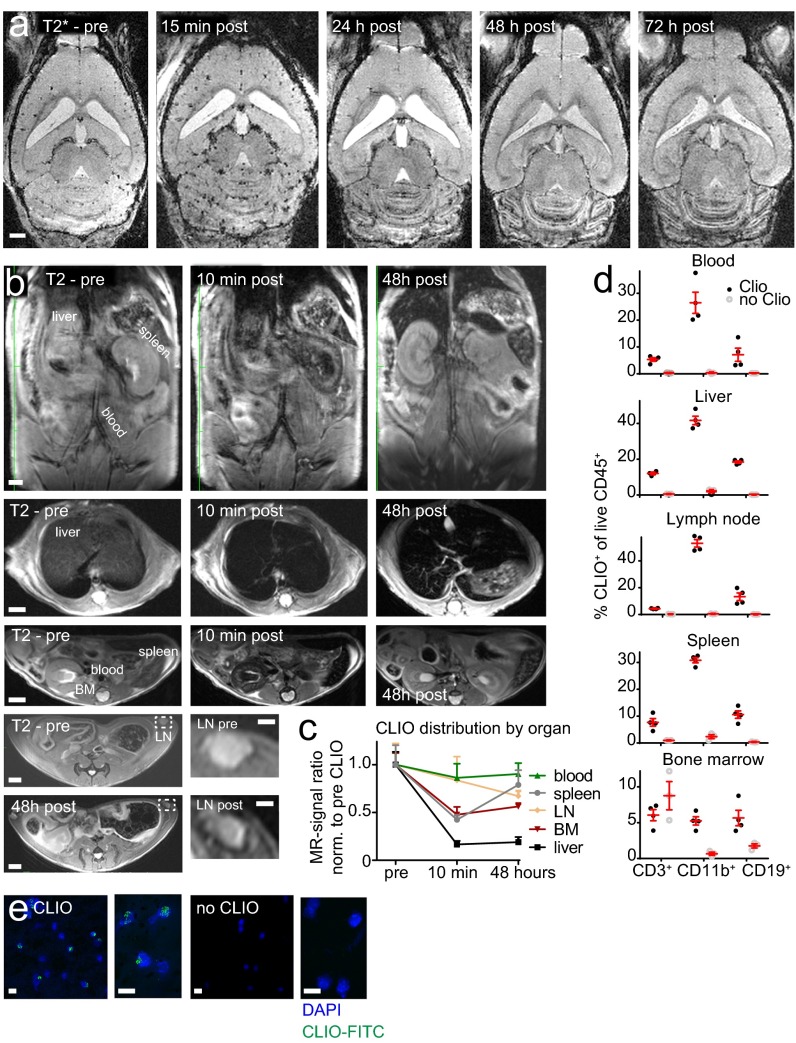
After EAE induction the first clinical symptoms developed rapidly, 6–12 d after immunization (Fig. 2 A and B). At disease onset (baseline MRI) animals were imaged by high-field 9.4-T MRI using T2-w, T2*-w, and T1-w post-Gd contrast sequences (Fig. 2C). Strong, confluent Gd enhancement and concomitant edema were present in the cerebellar WM and around the meninges. Gd enhancement, however, represents only BBB-D rather than actual inflammation. Hence, more direct means to assess inflammation by MRI would be desirable (26). To determine whether more specific imaging of inflammation and cell tracking was possible in our model, we i.v. injected CLIO-FITC. CLIO injection led to an immediate loss of vascular signal and the delineation of the vasculature (Fig. S1A). Forty-eight hours after CLIO administration, free particles were largely cleared from the circulation and had accumulated in immune cells of spleen, liver, lymph nodes, blood, and bone marrow, as assessed by MRI and flow cytometry (Fig. S1). This time point (onset + 2) was used for follow-up MRI to assess cellular influx. T2*-w imaging before contrast administration (pre CLIO) outlines venules because of the blood oxygenation level-dependent (BOLD) contrast of deoxygenized blood (Fig. 2C). Forty-eight hours after CLIO administration (post CLIO) additional linear and punctate susceptibility signals were found (Fig. 2D). CLIO deposition in the cerebellum localized mainly to the WM, and image subtraction (post CLIO minus pre CLIO) facilitated its identification (Fig. 2E). Because T2* imaging is prone to image artifacts caused by magnetic field inhomogeneity and motion of the animal (e.g., breathing), T2* imaging of CLIO-injected animals was performed in a subset of animals ex vivo after brain explantation to confirm iron particle deposition. Strong susceptibility signals were found in the cerebellum, basal ganglia, and cortex. Such signals were found only in diseased animals; healthy animals did not show nanoparticle uptake (Fig. 2F).
Fig. 2.
In vivo nanoparticle uptake can be quantified by MRI. (A) Experimental outline. (B) EAE scores. (C and D) T2-w, T1-w after Gd, and T2*-w MRI before CLIO at onset of disease (C) and 2 d after disease onset (48 h after CLIO injection) (D). (E) Magnification of the cerebellum before (pre) (Top) and 48 h after CLIO administration (post) (Middle). (Bottom) The subtraction image (post CLIO minus pre CLIO). (F) Ex vivo T2* images 48 h after CLIO administration of a healthy (clinical score 0) and severely affected EAE animal (score 2.5. (G) Cerebellar volume with signal decrease on T2*-w images. (H) Correlation analysis of the volume of T2* signal decrease and the clinical score. (I) Correlation analysis of the volume of Gd enhancement and the clinical score. (Scale bars: 1 mm.)
Fig. S1.
Biodistribution and kinetics of the CLIO time course of T2*-w imaging following CLIO-FITC administration in a representative EAE animal. (A) Images were acquired before contrast administration (pre) and 15 min, 24 h, 48 h, and 72 h after (post) CLIO-FITC injection. (B) Spatial distribution of CLIO in a representative healthy mouse. MRI was performed before and 10 min and 48 h after CLIO administration. Coronal (Upper Row) and transverse (Lower Rows) T2-w images of the abdomen are shown. (C) Quantification of the CLIO signal intensity ratio (respective organ/muscle) in liver, spleen, blood (aorta), lymph node (inguinal lymph nodes, LN), and bone marrow (BM, thoracic vertebral body) before, 10 min after, and 48 h after CLIO. (D) Flow cytometry analysis of CLIO uptake in the respective organs in macrophages (CD11b+), T cells (CD3+), and B cells (CD19+) determined 48 h after CLIO administration compared with noninjected healthy control animals. (E) Confocal images of buffy coat white blood cells (after erythrocyte lysis) from animals with or without CLIO injection 48 h before imaging. n = 4 CLIO- injected mice, and n = 3 noninjected healthy controls. (Scale bars: 1 mm in A; 2 mm in B; 1 mm in lymph node Insets in B.)
Nanoparticle Uptake Correlates with Clinical Disease Severity.
Quantification of T2* images revealed a 4.6-fold increase in cerebellar susceptibility signals 48 h after CLIO injection in diseased animals (cerebellar volume of T2* signal drop before injection: 1.33 ± 0.50 mm3, vs. 6.14 ± 0.82 mm3 after CLIO injection, P < 0.001) (Fig. 2G). Importantly, the volume of the decrease in T2* signal in the cerebellum correlated better with disease severity (Spearman’s r: 0.83, P < 0.001) than did conventional Gd enhancement (Spearman’s r: 0.71, P < 0.01) (Fig. 2 H and I).
Nanoparticles Localize to Infiltrating Macrophages and Resident Microglia in Vivo.
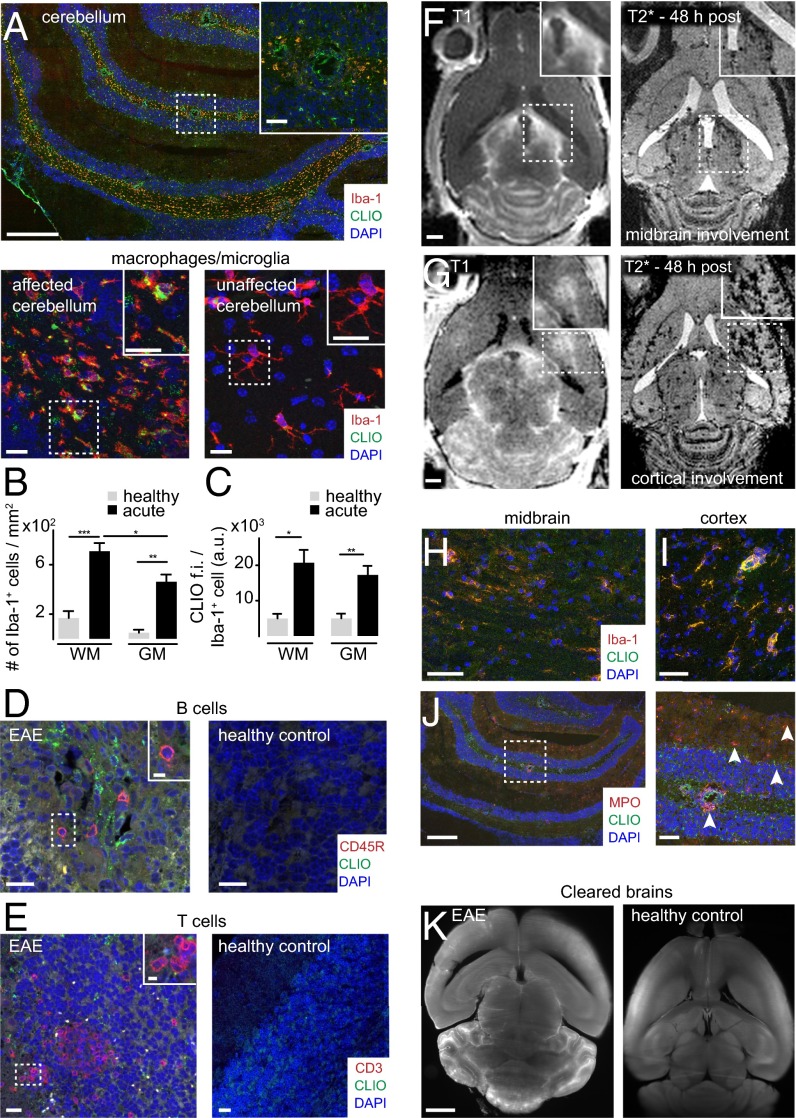
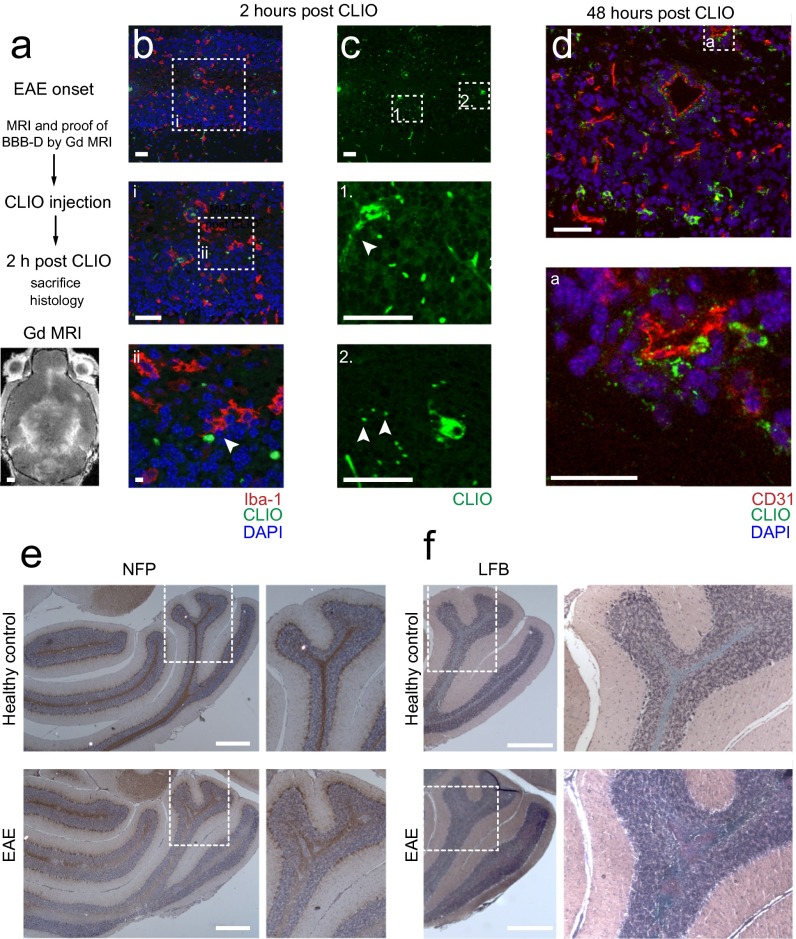
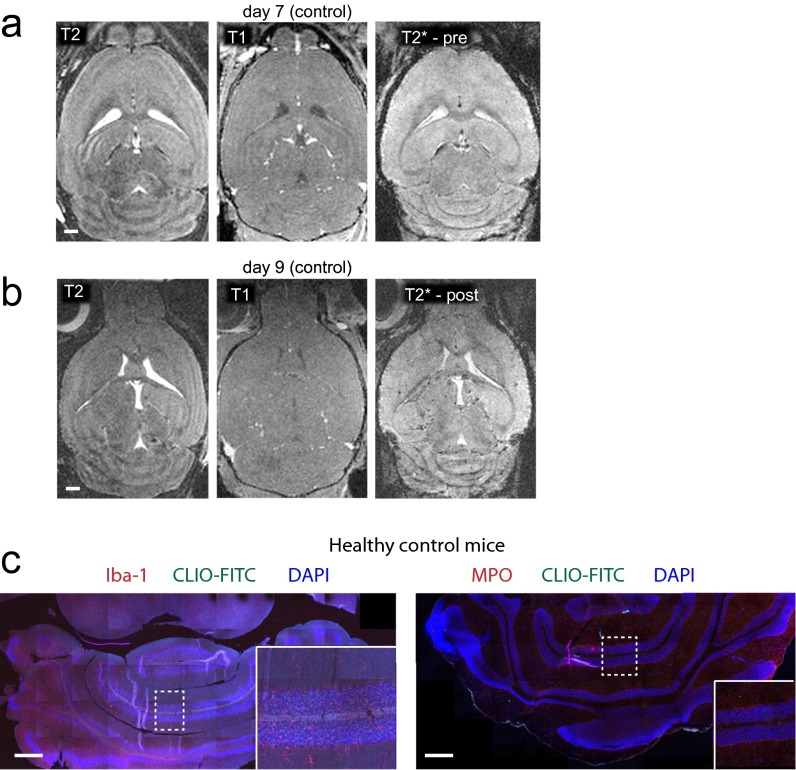
To validate that iron oxide nanoparticles indeed accumulate in inflammatory phagocytic cells, we performed immunohistochemical stainings for Iba-1, a marker for macrophages and microglia (27). Dense infiltrates of Iba-1+ macrophages and microglia were present throughout the cerebellar WM and had largely phagocytosed nanoparticles (Fig. 3A). Immunohistochemical quantifications showed that most macrophages/microglia infiltrates localize to the WM (7.0 × 10² Iba-1+ cells/mm2 in the WM compared with 4.6 × 10²/mm2 in the GM and 1.6 × 10²/mm2 in the cerebellar WM of healthy controls, P < 0.05) (Fig. 3B). Most macrophages/microglia had accumulated CLIO-FITC (P < 0.05) (Fig. 3C). B cells and T cells did not show CLIO-FITC uptake (Fig. 3 D and E). In some animals Gd-enhanced MRI also showed prominent lesions in the midbrain (24%, n = 8 mice from 33 animals total, four independent experiments) and cortex (30%, n = 10 mice), with concomitant iron oxide deposition (Fig. 3 F and G). Immunohistochemistry showed infiltrates of macrophages/microglia with particle uptake (Fig. 3 H and I). The levels of uptake in the cortex were considerably smaller than in the cerebellum (3.7 ± 0.6 × 10² Iba-1+/CLIO+ cells/mm2 in the cerebellum vs. 1.1 ± 0.2 × 10² cells/mm2 in the cortex; P < 0.05). To better understand how CLIO labels microglia, we killed EAE animals 2 h after CLIO administration after having proven BBB-D by Gd-enhanced MRI (Fig. S2A). CLIO was present both around blood vessels and in the parenchyma within inflammatory lesions close to Iba-1+ cells (Fig. S2 B and C). However, macrophages/microglia were CLIO− at this early time point (Fig. S2B), indicating that they phagocytose free particles over time. CD31+ vessels did not show CLIO uptake when assessed 48 h after CLIO injection (Fig. S2D). Next, we assessed axonal pathology and demyelination, both hallmarks of EAE and MS. We found large demyelinated areas in the cerebellar WM in Luxol Fast Blue stainings. Corresponding regions showed severe axonal damage with disrupted tissue morphology on neurofilament protein (NFP) stainings (Fig. S2 E and F). Inflammatory changes as assessed by immunohistochemistry for the inflammatory enzyme MPO were present in the WM and GM matter of the cerebellum (Fig. 3J). To assess the 3D distribution of the nanoparticles further, we performed tissue clearing with FluorClearBABB (23). Clearing of EAE brains and UM confirmed widespread lesions in the cerebellar WM, cortex, and midbrain (Fig. 3K and Movie S1). In contrast, there were no MRI signal changes, CLIO particle uptake, or MPO expression in healthy control animals (Fig. 3K and Fig. S3).
Fig. 3.
Immunohistochemistry of immune cell infiltrates. (A) Confocal image (tile scan) of Iba-1+ macrophages/microglia in the cerebellum. CLIO-FITC was administered 48 h before. (B and C) Quantification of Iba-1+ cells (B) and CLIO-FITC uptake (C) in the cerebellar GM and WM (n = 7 mice for the acute EAE group and n = 3 mice for the healthy control group). a.u., arbitrary units; f.i., fluorescence intensity. (D and E) Confocal images of B cells (CD45R) (D) and T cells (CD3) (E) in EAE and healthy controls. (F–I) MRI (F and G) and immunohistochemistry (H and I) of cortical and midbrain lesions. (J) Staining for the inflammatory enzyme MPO. Arrowheads indicate MPO+ cells. (K) Representative section of a FluorClearBABB-cleared EAE brain and a healthy control brain 48 h after CLIO injection, acquired by UM. Brain clearing was performed in three EAE mice and three CLIO-injected healthy controls. (Magnification: K, 1×.) Confocal images were recorded as tile scans (composite image). (Scale bars: 500 µm for the overview image in A, Upper; 100 µm for the Inset in the overview in A; 20 µm for the magnified images in A, Lower; 20 µm for overview images in D and E; 5 µm for Insets In D and E; 1 mm in F, G, and K; 50 µm in H and I; 500 µm for the overview image in J; 100 µm for the magnified image in J.)
Fig. S2.
Assessment of axonal pathology and demyelination. (A) Experimental outline and Gd-enhanced MRI to assess BBB-D. (B) Confocal micrograph of an Iba-1–stained EAE animal 2 h after CLIO injection. Iba-1+ cells are negative for CLIO at this early time point but extend their processes close to CLIO particles (arrowhead in B, ii). (C) CLIO outlines vessels (arrowhead in C, 1) and is partly found free in the parenchyma (arrowheads in C, 2). (D) CD31+ endothelial cells do not take up CLIO when assessed 48 h after CLIO administration. (E) Assessment of axonal integrity by NFP staining in a healthy control and in an EAE animal. (F) Myelin staining by Luxol Fast Blue (LFB) in a representative EAE animal and in a healthy control. (Scale bars: 1 mm in A; 50 µm in B–D; 5 µm in B, ii; 500 µm in E and F.) n = 3 mice for each experiment.
Fig. S3.
MRI and immunohistochemistry of healthy control animals. (A and B) PTx-injected control animals do not show pathological changes on brain MRI. (C) Immunohistochemistry for Iba-1 and MPO, 48 h after CLIO injection. Control animals did not receive PLP but were injected with Ptx to rule out unspecific Ptx effects (n = 2 mice). Confocal images were recorded as tile scans (composite image). (Scale bars: 1 mm in A and B; 500 μm in C.)
Nanoparticle Uptake Occurs Predominantly in the Acute Phase of the Disease.
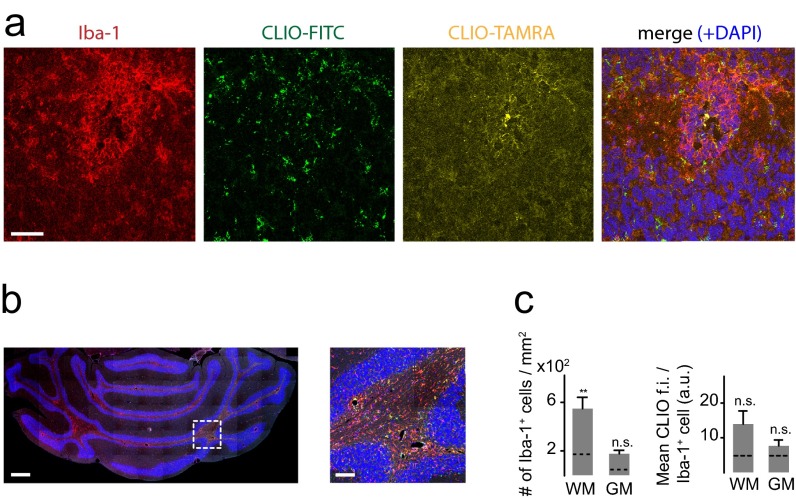
To determine the degree of macrophage influx during the remission phase of EAE, we performed a time-course experiment. After the administration of CLIO-FITC at the onset of disease, we reinjected the same animal with CLIO-TAMRA in the remission phase (10–14 d after symptom onset), followed by MRI and histological assessment (Fig. 2A). On immunohistochemical analysis we found predominantly CLIO-FITC that was widespread within the cerebellum but only traces of CLIO-TAMRA. Macrophages/microglia were present only around major vessels, and most focal cerebellar lesions had resolved (Fig. S4A). Also, when we quantified Iba-1+cells, we only found a minor increase in macrophages/microglia compared with healthy control animals (a 3.3-fold increase of Iba-1+ cells in the cerebellar WM, P < 0.01, n = 3 mice). Iba-1+ cell numbers and CLIO uptake in the cerebellar GM were not statistically different in remission-phase animals and healthy control animals, indicating that inflammation had mostly resolved (P > 0.05) (Fig. S4 B and C).
Fig. S4.
Immunohistochemistry of EAE animals in the remission phase. (A) Representative immunohistochemical Iba-1 staining of an EAE animal in the remission phase 12 d after disease onset. CLIO-FITC was injected 2 d after disease onset, and CLIO-TAMRA was injected at day 10 after disease onset to investigate the kinetics of inflammatory cell influx. (B) Immunohistochemical Iba-1 staining of an EAE animal in the remission phase. CLIO-FITC was injected in the acute phase of the disease. (C) Quantification of Iba-1+ cells and CLIO-FITC uptake in the cerebellar GM and WM of EAE animals in the remission phase (n = 3 mice). The dashed line indicates the mean of healthy control mice. Confocal image in b was recorded as tile scan (composite image). (Scale bars: 50 μm in A; 500 μm in B; 100 μm in Inset.)
The Majority of Myeloid Effector Cells Phagocytose Nanoparticles.
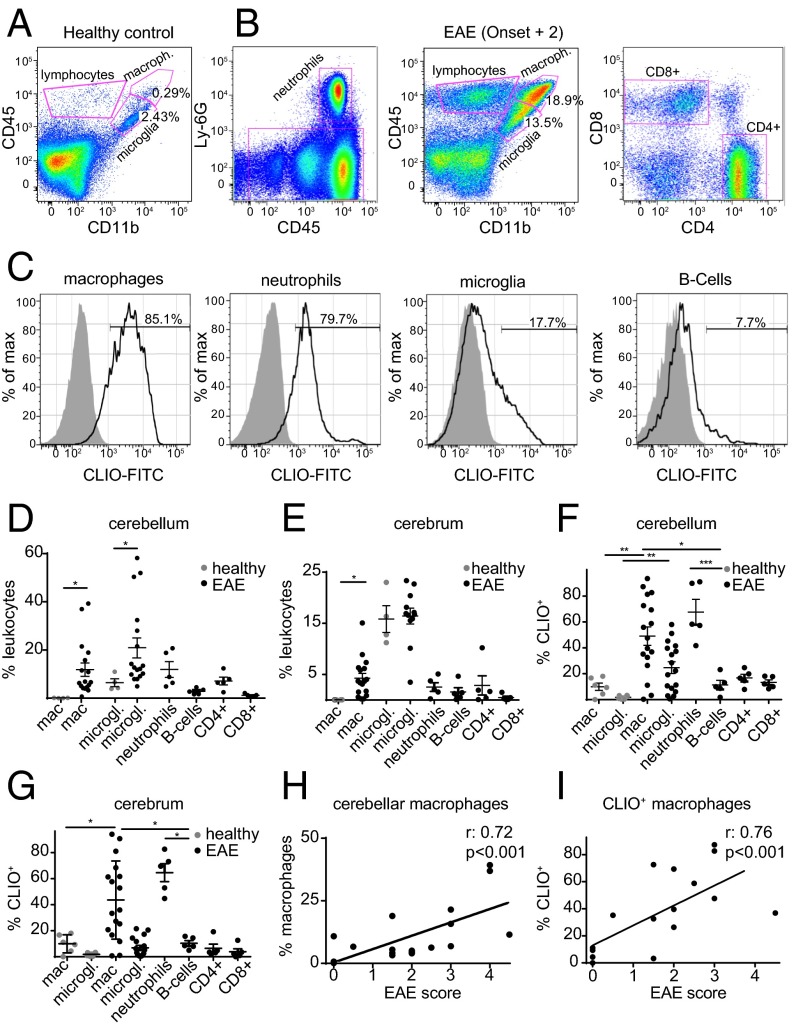
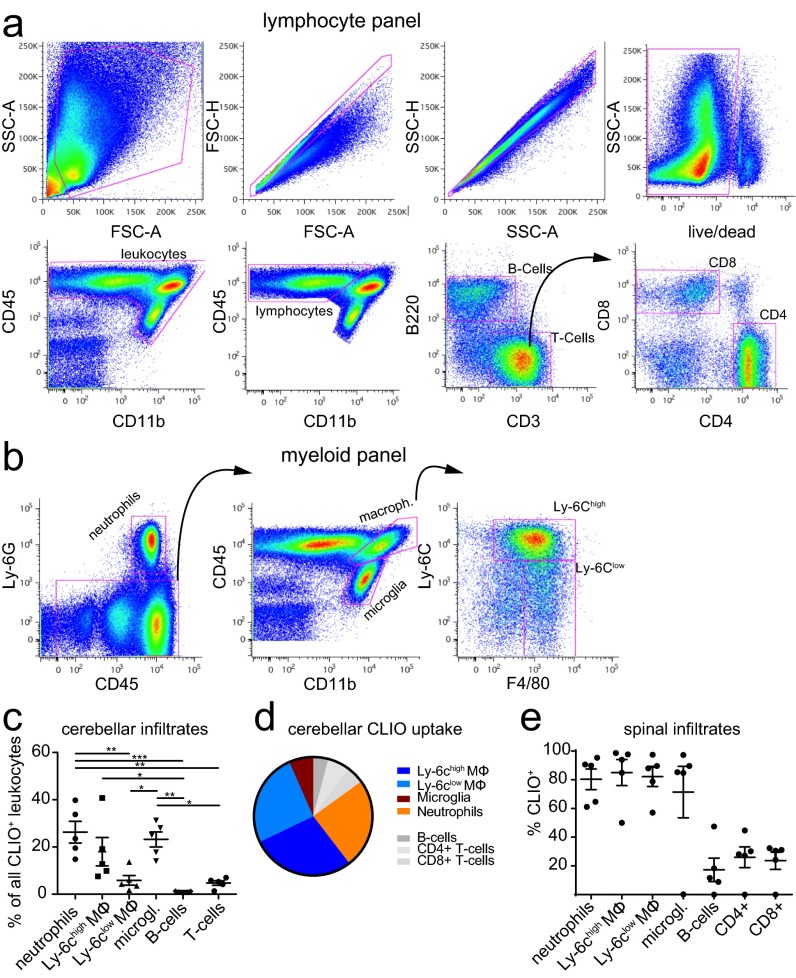
To better understand the cellular contribution to the MRI signal at the single cell level, we performed flow cytometry analysis. Cerebellum and cerebrum were assessed separately because the cerebellum is more severely affected by the disease than the cerebrum. EAE brains were isolated into single cells and stained for CD45, CD11b, and Ly6G to differentiate infiltrating macrophages (CD11b+, CD45high, Ly-6G−), resident microglia (CD11b+, CD45intermediate/low), and neutrophils (Ly-6G+, CD45+). We further stained T cells (CD45high, CD11b−, CD3+, CD4+, or CD8+) and B cells (CD45high, CD11b−, B220+) (Fig. 4 A and B and Fig. S5 A and B). As expected there was a marked increase of macrophages, microglia, and neutrophils in EAE (11.9 ± 2.7% of macrophages compared with <1% in the healthy brain, P < 0.05; 21.0 ± 4.2% of microglia vs. 6.4 ± 1.6%, P = 0.05) (Fig. 4 C–G). A large proportion of these inflammatory myeloid effector cells took up CLIO (49.0 ± 7.1% of cerebellar macrophages in EAE vs. 9.9 ± 2.8% in the healthy control, P < 0.01) (Fig. 4 C, F, and G). To pinpoint further the extent to which different macrophage subtypes contribute to nanoparticle uptake, we stained for Ly-6C, a marker of macrophage activation (28). In line with our ex vivo polarization experiments, Ly-6Chigh and Ly-6Clow monocytes/macrophages did not differ significantly in their degree of nanoparticle uptake, although there was a trend toward more uptake by the Ly-6Chigh subpopulation (P > 0.05) (Fig. S5C). The strong nanoparticle uptake of myeloid effector cells was in contrast to T cells and B cells, which took up significantly less CLIO (11.4 ± 3.5%, P = 0.01 compared with macrophages), and the innate immune cell compartment encompassed >85% of all CLIO+ leukocytes (Fig. S5D). Similar results were obtained in the cerebrum, with largely innate immune cell labeling and only sparse labeling of adaptive immune cells (Fig. 4 E and G) and spinal cord (Fig. S5E). Interestingly, both the macrophage number and the degree of CLIO uptake correlated with the clinical score of the individual animal (Spearman’s r: 0.72, P < 0.001, and 0.76, P < 0.001, respectively) (Fig. 4 H and I).
Fig. 4.
CLIO uptake of innate immune cells correlates with clinical severity. (A and B) Representative FACS plots for healthy control (A) and EAE (B) animals at onset + 2. Gating strategies are shown for the identification of the respective leukocyte subsets. (C) Histogram of CLIO+ cells for each cell population. (D and E) Flow cytometry quantification in the cerebellum (D) and cerebrum (E). (F and G) Percentage of CLIO+ cells. (H) Spearman correlation analysis of cerebellar macrophage frequency and EAE score. (I) Correlation analysis of CLIO+ cerebellar macrophage frequency and EAE score. Dots in D–I indicate single animals. n = 4 mice for healthy controls and n = 5–19 mice for EAE groups. Flow cytometry data are pooled from three independent experiments.
Fig. S5.
Gating strategy for the isolation of lymphocytes and myeloid cells. (A and B) Representative flow cytometry plots of flow analysis, illustrating the gating strategy for the lymphocyte (A) and myeloid (B) subsets. (C–E) CLIO uptake for the respective cell type in the cerebellum and spinal cord. Mϕ, macrophage. The statistical analysis in C was performed with one-way ANOVA and Tukey’s correction for multiple comparisons. n = 5 mice.
MR Imaging with the FDA-Approved Compound Ferumoxytol Confirms Clinical Applicability.
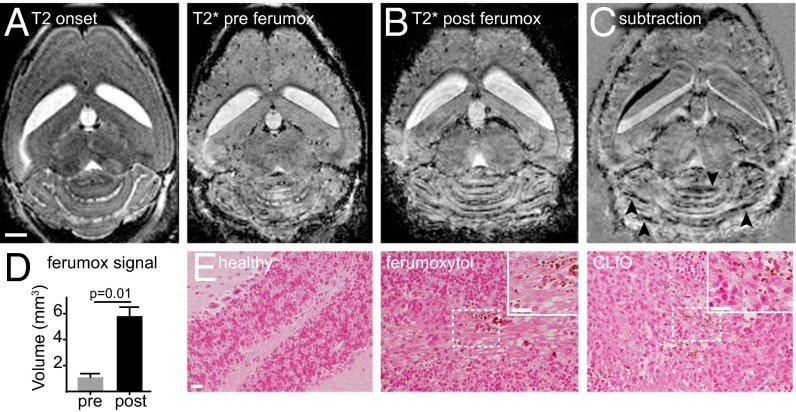
To validate the clinical potential of our approach, we used the FDA-approved iron oxide nanoparticle ferumoxytol to image inflammatory lesions in acute EAE. Using the same approach as with the experimental CLIO particle, we found a precise delineation of hypointense ferumoxytol signal, mainly in the cerebellar WM (Fig. 5 A–C). Quantification of the ferumoxytol signal showed a 5.8-fold increase in hypointense signal 24 h after ferumoxytol administration (volume of signal decrease for ferumoxytol: 5.8 ± 0.7 mm3 vs. 1.0 ± 0.3 mm3 before ferumoxytol, P = 0.01) (Fig. 5D). Iron staining confirmed iron-positive cells (most likely macrophages/microglia) in the cerebellar WM in ferumoxytol-injected animals which were not detectable in healthy control animals (Fig. 5E).
Fig. 5.
Ferumoxytol imaging delineates EAE lesions. (A and B) T2-w and T2*-w images at disease onset before ferumoxytol injection (A) and 1 d after EAE onset (24 h post ferumoxytol injection) (B). (C) Subtraction image (post ferumoxytol minus pre ferumoxytol) demonstrates signal loss in areas of ferumoxytol deposition (arrowheads). (D) Cerebellar volume with signal decrease on T2*-w images pre and post ferumoxytol administration. (E) Micrographs of DAB-enhanced Prussian blue staining for iron. CLIO section is shown as a positive control. n = 4 mice. (Scale bars: 1 mm in A–C; 20 µm in E.)
Discussion
Diagnosis and monitoring of disease activity in MS is mainly based on Gd-enhanced MRI (29, 30), which assesses the integrity of the BBB. However, Gd imaging has limited sensitivity and specificity and does not reflect the activity of cellular disease mediators (30). Moreover, its correlation to important clinical parameters (like the Expanded Disability Status Scale) and to pathological hallmarks such as demyelination and neurodegeneration is limited (30). Direct imaging of molecular targets or cellular effector cells of tissue damage would be highly desirable (8, 26, 31, 32). We have established a protocol to image myeloid effector cells and BBB-D sequentially using innovative magnetic nanoparticles followed by Gd-imaging. Our results illustrate that the T2* signal attenuation specifically shows different innate immune cells (macrophages, activated microglia, and neutrophils). Furthermore, MRI signal quantification of phagocytic activity correlates with disease severity. This correlation was confirmed on the cellular level where CLIO uptake by macrophages correlated significantly with the clinical score. Iron oxide nanoparticle imaging has been performed in a wide variety of diseases (16, 17, 33–35), but apart from liver imaging (36), iron oxide imaging has not yet been translated into clinical practice, partially because of economic, safety, and technical reasons (37–40). However, imaging of inflammation is of major clinical interest. Areas of unmet need that would require imaging of inflammation and immune cell responses include immunotherapy of cancer and autoimmune conditions such as MS. For these applications, iron oxide nanoparticles could allow patient stratification and treatment monitoring (19, 33, 41).
The current study extends previous work on USPIOs that were used mainly in cardiovascular disease, in tumor models, and in small clinical trials (13, 16, 17). In the present study we first confirmed the efficient labeling of macrophages and microglia in vitro. We further validated that macrophages, microglia, and neutrophils take up USPIOs in vivo and quantified the uptake for each cell type. Despite evidence that neutrophils may promote autoimmune neuroinflammation (42), the high frequency of Ly-6G+ cells may signify that this population also contains eosinophils, differentiating premonocytes, or plasmacytoid dendritic cells, all of which have been reported to express Ly6-G under certain conditions, and might be present in EAE lesions. Nanoparticle uptake by adaptive immune cells was only marginal, indicating that nanoparticle imaging is predominantly a marker of innate immunity. We found that in healthy animals innate CD11b+ cells take up CLIO by a much higher frequency than T cells and B cells and also phagocytose more particles per cell. We calculated that 86–94% of the signal originates from myeloid cells, depending on the respective organ (e.g., spleen vs. blood). In EAE we identified CLIO labeling of T cells and B cells by flow cytometry (up to 20% of T cells). Again, myeloid cells take up more CLIO per cell based on median fluorescence intensity in flow cytometry. In immunohistochemistry we did not detect CLIO uptake by B cells or T cells. Taking these findings together, we estimate that more than 90% of the nanoparticle signal in EAE originates from innate immune cells (Fig. S5D). The degree of adaptive immune cell labeling, which would partially diminish the specificity of the imaging approach, is most likely the result of the uptake mechanism. It has been proposed that macropinocytosis is the entry mechanism of iron oxide nanoparticles, a mechanism that most cell types are capable of using, although to a very different degree (5). Thus, we concluded that our imaging approach in EAE shows innate immune responses, but signal origin in other disease models will depend on the cellular micromilieu of the respective pathology.
We also illustrate different lesion types (cerebellar WM and GM, midbrain, and cortical lesions) that evolve in this MS model. Severe inflammation was also present in the spinal cord. In contrast to myelin oligodendrocyte glycoprotein (MOG) EAE in C57BL/6 mice, which exhibits mainly spinal pathology, PLP immunization in SJL mice leads to widespread cerebral pathology (31, 32). We found prominent immune cell infiltrates mostly in the cerebellum but also in the midbrain and cortex. This localization seems especially relevant because GM and cortical pathology is of major clinical relevance (1, 43, 44), and so far insights into the underlying mechanisms of neurodegeneration are limited (45, 46). One limitation of many studies that use experimental contrast agents relates to the clinical translatability of the work. We used experimental CLIO particles that are not available for clinical use but are well characterized in experimental models, are fluorescently labeled, and showed good uptake and biodistribution kinetics. To show the clinical potential, we also performed experiments with the FDA-approved agent ferumoxytol that has been used “off label” for human imaging studies (18, 19). Using this agent, we validated our approach and demonstrated that ferumoxytol imaging could be a valid strategy for nanoparticle imaging in the clinical arena, although safety issues with the agent might apply (37). In our study we used a high-field preclinical MRI system (9.4 T) that has better sensitivity than 3T scanners for the detection of susceptibility signals caused by iron oxide nanoparticles. Nevertheless, several studies have demonstrated that USPIO imaging is feasible in the clinical setting (17–19). Another limitation is the imaging target itself. Although macrophages and microglia are important effector cells in EAE and MS (3), our imaging approach does not reflect the entire cellular complexity of the disease. B cells and T cells are additional imaging targets that are more difficult to label by iron oxide nanoparticles (13, 47). Another aspect is a possible interaction of the particle with immune cell functions. Previous studies have investigated the capacity of different human immune cell populations to phagocytose USPIOs and the possible effects of particle labeling on immune cell function (48). We did not observe differences in disease severity or onset in USPIO-injected vs. noninjected animals, indicating that USPIO labeling did not greatly interfere with immune cell function; however, we did not investigate this issue in depth.
In summary, we demonstrate high sensitivity and cellular specificity for innate immune cells using USPIO imaging in an MS model and noninvasively track infiltrating neutrophils, macrophages, and activated microglia by longitudinal MRI. USPIO imaging provides a tool for innate immune cell tracking that, in contrast to conventional Gd imaging, reflects cellular disease mechanisms. Thus, it can serve as an imaging biomarker for inflammatory disease severity and directly show the underlying cellular culprits of disease. This study could spur research to translate iron oxide nanoparticle imaging into clinical practice for patients suffering from MS and other innate immunity-driven diseases.
Supplementary Material
Acknowledgments
We thank Simon Becker for excellent technical assistance; Ralph Weissleder of the Massachusetts General Hospital, Harvard Medical School for providing CLIO nanoparticles and for helpful discussion of the manuscript; E. Neuwelt of the Oregon Health and Science University for the kind gift of ferumoxytol; and D. Krunic of the DKFZ Light Microscopy Facility for experimental support. This work was funded by grants from the Heidelberg University Innovation Fund FRONTIER (to M.P.) and by Deutsche Forschungsgemeinschaft Grant FOR2289: PL315/3-1 (to M.P). M.O.B. and A.H. were supported by a Physician-Scientist Fellowship of the Medical Faculty, University of Heidelberg. M.O.B. received funding from the Hoffmann–Klose Foundation (University of Heidelberg), the Novartis Foundation, and Neurowind e.V. J.K.S. was supported by the Helmholtz International Graduate School for Cancer Research at DKFZ, and K.D. was supported by the German Federal Ministry of Education and Research.
Footnotes
The authors declare no conflict of interest.
This article is a PNAS Direct Submission.
This article contains supporting information online at www.pnas.org/lookup/suppl/doi:10.1073/pnas.1609397113/-/DCSupplemental.
References
- 1.Trapp BD, Nave K-A. Multiple sclerosis: An immune or neurodegenerative disorder? Annu Rev Neurosci. 2008;31(1):247–269. doi: 10.1146/annurev.neuro.30.051606.094313. [DOI] [PubMed] [Google Scholar]
- 2.Wekerle H, Flügel A, Fugger L, Schett G, Serreze D. Autoimmunity’s next top models. Nat Med. 2012;18(1):66–70. doi: 10.1038/nm.2635. [DOI] [PubMed] [Google Scholar]
- 3.Hemmer B, Kerschensteiner M, Korn T. Role of the innate and adaptive immune responses in the course of multiple sclerosis. Lancet Neurol. 2015;14(4):406–419. doi: 10.1016/S1474-4422(14)70305-9. [DOI] [PubMed] [Google Scholar]
- 4.Wattjes MP, et al. MAGNIMS study group Evidence-based guidelines: MAGNIMS consensus guidelines on the use of MRI in multiple sclerosis--establishing Disease prognosis and monitoring patients. Nat Rev Neurol. 2015;11(10):597–606. doi: 10.1038/nrneurol.2015.157. [DOI] [PubMed] [Google Scholar]
- 5.Weissleder R, Nahrendorf M, Pittet MJ. Imaging macrophages with nanoparticles. Nat Mater. 2014;13(2):125–138. doi: 10.1038/nmat3780. [DOI] [PubMed] [Google Scholar]
- 6.Tourdias T, et al. Assessment of disease activity in multiple sclerosis phenotypes with combined gadolinium- and superparamagnetic iron oxide-enhanced MR imaging. Radiology. 2012;264(1):225–233. doi: 10.1148/radiol.12111416. [DOI] [PubMed] [Google Scholar]
- 7.Millward JM, et al. Iron oxide magnetic nanoparticles highlight early involvement of the choroid plexus in central nervous system inflammation. ASN Neuro. 2013;5(1):e00110. doi: 10.1042/AN20120081. [DOI] [PMC free article] [PubMed] [Google Scholar]
- 8.Dousset V, et al. MR imaging of relapsing multiple sclerosis patients using ultra-small-particle iron oxide and compared with gadolinium. AJNR Am J Neuroradiol. 2006;27(5):1000–1005. [PMC free article] [PubMed] [Google Scholar]
- 9.Linker RA, et al. Iron particle-enhanced visualization of inflammatory central nervous system lesions by high resolution: Preliminary data in an animal model. AJNR Am J Neuroradiol. 2006;27(6):1225–1229. [PMC free article] [PubMed] [Google Scholar]
- 10.Ladewig G, et al. Spatial diversity of blood-brain barrier alteration and macrophage invasion in experimental autoimmune encephalomyelitis: A comparative MRI study. Exp Neurol. 2009;220(1):207–211. doi: 10.1016/j.expneurol.2009.08.027. [DOI] [PubMed] [Google Scholar]
- 11.Dousset V, et al. Comparison of ultrasmall particles of iron oxide (USPIO)-enhanced T2-weighted, conventional T2-weighted, and gadolinium-enhanced T1-weighted MR images in rats with experimental autoimmune encephalomyelitis. AJNR Am J Neuroradiol. 1999;20(2):223–227. [PMC free article] [PubMed] [Google Scholar]
- 12.Kleinschnitz C, et al. In vivo monitoring of macrophage infiltration in experimental ischemic brain lesions by magnetic resonance imaging. J Cereb Blood Flow Metab. 2003;23(11):1356–1361. doi: 10.1097/01.WCB.0000090505.76664.DB. [DOI] [PubMed] [Google Scholar]
- 13.Kircher MF, et al. In vivo high resolution three-dimensional imaging of antigen-specific cytotoxic T-lymphocyte trafficking to tumors. Cancer Res. 2003;63(20):6838–6846. [PubMed] [Google Scholar]
- 14.Leimgruber A, et al. Behavior of endogenous tumor-associated macrophages assessed in vivo using a functionalized nanoparticle. Neoplasia. 2009;11(5):459–468. doi: 10.1593/neo.09356. [DOI] [PMC free article] [PubMed] [Google Scholar]
- 15.Kircher MF, Mahmood U, King RS, Weissleder R, Josephson L. A multimodal nanoparticle for preoperative magnetic resonance imaging and intraoperative optical brain tumor delineation. Cancer Res. 2003;63(23):8122–8125. [PubMed] [Google Scholar]
- 16.Daldrup-Link HE, et al. MRI of tumor-associated macrophages with clinically applicable iron oxide nanoparticles. Clin Cancer Res. 2011;17(17):5695–5704. doi: 10.1158/1078-0432.CCR-10-3420. [DOI] [PMC free article] [PubMed] [Google Scholar]
- 17.Dósa E, et al. Magnetic resonance imaging of intracranial tumors: Intra-patient comparison of gadoteridol and ferumoxytol. Neuro-oncol. 2011;13(2):251–260. doi: 10.1093/neuonc/noq172. [DOI] [PMC free article] [PubMed] [Google Scholar]
- 18.Rashidian M, et al. Noninvasive imaging of immune responses. Proc Natl Acad Sci USA. 2015;112(19):6146–6151. doi: 10.1073/pnas.1502609112. [DOI] [PMC free article] [PubMed] [Google Scholar]
- 19.Gaglia JL, et al. Noninvasive mapping of pancreatic inflammation in recent-onset type-1 diabetes patients. Proc Natl Acad Sci USA. 2015;112(7):2139–2144. doi: 10.1073/pnas.1424993112. [DOI] [PMC free article] [PubMed] [Google Scholar]
- 20.McConnell HL, et al. Ferumoxytol nanoparticle uptake in brain during acute neuroinflammation is cell-specific. Nanomedicine (Lond) 2016;12(6):1535–1542. doi: 10.1016/j.nano.2016.03.009. [DOI] [PMC free article] [PubMed] [Google Scholar]
- 21.Park S-H, Masamoto K, Hendrich K, Kanno I, Kim S-G. Imaging brain vasculature with BOLD microscopy: MR detection limits determined by in vivo two-photon microscopy. Magn Reson Med. 2008;59(4):855–865. doi: 10.1002/mrm.21573. [DOI] [PMC free article] [PubMed] [Google Scholar]
- 22.Breckwoldt MO, et al. Correlated magnetic resonance imaging and ultramicroscopy (MR-UM) is a tool kit to assess the dynamics of glioma angiogenesis. eLife. 2016;5:e11712. doi: 10.7554/eLife.11712. [DOI] [PMC free article] [PubMed] [Google Scholar]
- 23.Schwarz MK, et al. Fluorescent-protein stabilization and high-resolution imaging of cleared, intact mouse brains. PLoS One. 2015;10(5):e0124650. doi: 10.1371/journal.pone.0124650. [DOI] [PMC free article] [PubMed] [Google Scholar]
- 24.Pulli B, et al. Multiple sclerosis: Myeloperoxidase immunoradiology improves detection of acute and chronic disease in experimental model. Radiology. 2015;275(2):480–489. doi: 10.1148/radiol.14141495. [DOI] [PMC free article] [PubMed] [Google Scholar]
- 25.Ying W, Cheruku PS, Bazer FW, Safe SH, Zhou B. 2013. Investigation of macrophage polarization using bone marrow derived macrophages. J Vis Exp June 2013(76):50323. [DOI] [PMC free article] [PubMed]
- 26.Vellinga MM, et al. Pluriformity of inflammation in multiple sclerosis shown by ultra-small iron oxide particle enhancement. Brain. 2008;131(Pt 3):800–807. doi: 10.1093/brain/awn009. [DOI] [PubMed] [Google Scholar]
- 27.Mildner A, et al. Microglia in the adult brain arise from Ly-6ChiCCR2+ monocytes only under defined host conditions. Nat Neurosci. 2007;10(12):1544–1553. doi: 10.1038/nn2015. [DOI] [PubMed] [Google Scholar]
- 28.Swirski FK, et al. Ly-6Chi monocytes dominate hypercholesterolemia-associated monocytosis and give rise to macrophages in atheromata. J Clin Invest. 2007;117(1):195–205. doi: 10.1172/JCI29950. [DOI] [PMC free article] [PubMed] [Google Scholar]
- 29.Montalban X, et al. MRI criteria for MS in patients with clinically isolated syndromes. Neurology. 2010;74(5):427–434. doi: 10.1212/WNL.0b013e3181cec45c. [DOI] [PubMed] [Google Scholar]
- 30.Daumer M, Neuhaus A, Morrissey S, Hintzen R, Ebers GC. MRI as an outcome in multiple sclerosis clinical trials. Neurology. 2009;72(8):705–711. doi: 10.1212/01.wnl.0000336916.38629.43. [DOI] [PubMed] [Google Scholar]
- 31.Chen JW, Breckwoldt MO, Aikawa E, Chiang G, Weissleder R. Myeloperoxidase-targeted imaging of active inflammatory lesions in murine experimental autoimmune encephalomyelitis. Brain. 2008;131(Pt 4):1123–1133. doi: 10.1093/brain/awn004. [DOI] [PMC free article] [PubMed] [Google Scholar]
- 32.Forghani R, et al. Demyelinating diseases: Myeloperoxidase as an imaging biomarker and therapeutic target. Radiology. 2012;263(2):451–460. doi: 10.1148/radiol.12111593. [DOI] [PMC free article] [PubMed] [Google Scholar]
- 33.Harisinghani MG, et al. Noninvasive detection of clinically occult lymph-node metastases in prostate cancer. N Engl J Med. 2003;348(25):2491–2499. doi: 10.1056/NEJMoa022749. [DOI] [PubMed] [Google Scholar]
- 34.Lewin M, et al. Tat peptide-derivatized magnetic nanoparticles allow in vivo tracking and recovery of progenitor cells. Nat Biotechnol. 2000;18(4):410–414. doi: 10.1038/74464. [DOI] [PubMed] [Google Scholar]
- 35.Kleinschnitz C, et al. In vivo monitoring of macrophage infiltration in experimental ischemic brain lesions by magnetic resonance imaging. J Cereb Blood Flow Metab. 2003;23(11):1356–1361. doi: 10.1097/01.WCB.0000090505.76664.DB. [DOI] [PubMed] [Google Scholar]
- 36.Tanimoto A, Kuribayashi S. Application of superparamagnetic iron oxide to imaging of hepatocellular carcinoma. Eur J Radiol. 2006;58(2):200–216. doi: 10.1016/j.ejrad.2005.11.040. [DOI] [PubMed] [Google Scholar]
- 37.Muehe AM, et al. Safety Report of Ferumoxytol for Magnetic Resonance Imaging in Children and Young Adults. Invest Radiol. 2016;51(4):221–227. doi: 10.1097/RLI.0000000000000230. [DOI] [PMC free article] [PubMed] [Google Scholar]
- 38.Kiessling F, Mertens ME, Grimm J, Lammers T. Nanoparticles for imaging: Top or flop? Radiology. 2014;273(1):10–28. doi: 10.1148/radiol.14131520. [DOI] [PMC free article] [PubMed] [Google Scholar]
- 39.Corot C, Warlin D. Superparamagnetic iron oxide nanoparticles for MRI: Contrast media pharmaceutical company R&D perspective. Wiley Interdiscip Rev Nanomed Nanobiotechnol. 2013;5(5):411–422. doi: 10.1002/wnan.1225. [DOI] [PubMed] [Google Scholar]
- 40.Harms C, et al. Certain types of iron oxide nanoparticles are not suited to passively target inflammatory cells that infiltrate the brain in response to stroke. J Cereb Blood Flow Metab. 2013;33(5):e1–e9. doi: 10.1038/jcbfm.2013.22. [DOI] [PMC free article] [PubMed] [Google Scholar]
- 41.Okada H, et al. Immunotherapy response assessment in neuro-oncology: A report of the RANO working group. Lancet Oncol. 2015;16(15):e534–e542. doi: 10.1016/S1470-2045(15)00088-1. [DOI] [PMC free article] [PubMed] [Google Scholar]
- 42.Lévesque SA, et al. Myeloid cell transmigration across the CNS vasculature triggers IL-1β-driven neuroinflammation during autoimmune encephalomyelitis in mice. J Exp Med. 2016;213(6):929–949. doi: 10.1084/jem.20151437. [DOI] [PMC free article] [PubMed] [Google Scholar]
- 43.Daams M, Geurts JJG, Barkhof F. Cortical imaging in multiple sclerosis: Recent findings and ‘grand challenges’. Curr Opin Neurol. 2013;26(4):345–352. doi: 10.1097/WCO.0b013e328362a864. [DOI] [PubMed] [Google Scholar]
- 44.Fischer MT, et al. Disease-specific molecular events in cortical multiple sclerosis lesions. Brain. 2013;136(Pt 6):1799–1815. doi: 10.1093/brain/awt110. [DOI] [PMC free article] [PubMed] [Google Scholar]
- 45.Nikić I, et al. A reversible form of axon damage in experimental autoimmune encephalomyelitis and multiple sclerosis. Nat Med. 2011;17(4):495–499. doi: 10.1038/nm.2324. [DOI] [PubMed] [Google Scholar]
- 46.Jürgens T, et al. Reconstruction of single cortical projection neurons reveals primary spine loss in multiple sclerosis. Brain. 2016;139(Pt 1):39–46. doi: 10.1093/brain/awv353. [DOI] [PubMed] [Google Scholar]
- 47.Pittet MJ, Swirski FK, Reynolds F, Josephson L, Weissleder R. Labeling of immune cells for in vivo imaging using magnetofluorescent nanoparticles. Nat Protoc. 2006;1(1):73–79. doi: 10.1038/nprot.2006.11. [DOI] [PubMed] [Google Scholar]
- 48.Settles M, et al. Different capacity of monocyte subsets to phagocytose iron-oxide nanoparticles. PLoS One. 2011;6(10):e25197. doi: 10.1371/journal.pone.0025197. [DOI] [PMC free article] [PubMed] [Google Scholar]
- 49.Saura J, Tusell JM, Serratosa J. High-yield isolation of murine microglia by mild trypsinization. Glia. 2003;44(3):183–189. doi: 10.1002/glia.10274. [DOI] [PubMed] [Google Scholar]
Associated Data
This section collects any data citations, data availability statements, or supplementary materials included in this article.


