Significance
High carbon yield in the bioengineering of heterotrophic bacteria is hindered by carbon loss to CO2 production. We provide evidence showing Clostridium thermocellum, a cellulose-degrading bacterium and a model consolidated bioprocessing organism, can fix CO2 while growing predominantly on cellobiose, a cellulose-derived disaccharide. By adding 13C-bicarbonate to the bacterial culture and tracking 13C-labeled metabolites, we discovered active reductive one-carbon (C1) metabolism in this bacterium. We further identified critical enzymes responsible for fixing CO2 and channeling the fixed carbon to the C1 metabolic pathway. Our findings pave the way to future engineering of this bacterium to use cellulose and CO2 simultaneously as a means to improve microbial carbon efficiency that is constrained by theoretical limitation and to reduce CO2 in the environment.
Keywords: Clostridium thermocellum, pyruvate:ferredoxin oxidoreducase, formate, 13C-isotopic tracing, one-carbon metabolism
Abstract
Clostridium thermocellum can ferment cellulosic biomass to formate and other end products, including CO2. This organism lacks formate dehydrogenase (Fdh), which catalyzes the reduction of CO2 to formate. However, feeding the bacterium 13C-bicarbonate and cellobiose followed by NMR analysis showed the production of 13C-formate in C. thermocellum culture, indicating the presence of an uncharacterized pathway capable of converting CO2 to formate. Combining genomic and experimental data, we demonstrated that the conversion of CO2 to formate serves as a CO2 entry point into the reductive one-carbon (C1) metabolism, and internalizes CO2 via two biochemical reactions: the reversed pyruvate:ferredoxin oxidoreductase (rPFOR), which incorporates CO2 using acetyl-CoA as a substrate and generates pyruvate, and pyruvate-formate lyase (PFL) converting pyruvate to formate and acetyl-CoA. We analyzed the labeling patterns of proteinogenic amino acids in individual deletions of all five putative PFOR mutants and in a PFL deletion mutant. We identified two enzymes acting as rPFOR, confirmed the dual activities of rPFOR and PFL crucial for CO2 uptake, and provided physical evidence of a distinct in vivo “rPFOR-PFL shunt” to reduce CO2 to formate while circumventing the lack of Fdh. Such a pathway precedes CO2 fixation via the reductive C1 metabolic pathway in C. thermocellum. These findings demonstrated the metabolic versatility of C. thermocellum, which is thought of as primarily a cellulosic heterotroph but is shown here to be endowed with the ability to fix CO2 as well.
The gram-positive Clostridium thermocellum is a thermophilic and strict anaerobic bacterium. It has gained a great amount of interest due to its cellulolytic abilities. By taking advantage of an extracellular cellulase system called the cellulosome (1), C. thermocellum can depolymerize cellulose into soluble oligosaccharides. The latter are further transported into the cells and fermented through its glycolytic pathway to pyruvate, the precursor to an array of fermentation products (e.g., H2, formate, lactate, acetate, ethanol, secreted amino acids) (2, 3). This capability makes C. thermocellum an attractive candidate for consolidated bioprocessing of lignocellulosic biomass, a process configuration that directly converts plant biomass into biofuels and chemicals without separate additions of enzymes (4). To date, there have been numerous works describing the molecular and genetic details of the cellulolytic system and fermentation pathways in C. thermocellum (5–9), whereas other metabolic characteristics of this species have not been adequately understood.
Currently, few details regarding inorganic carbon utilization are known for C. thermocellum. However, several investigators routinely add bicarbonate, a dissolved form of CO2, into the medium to promote C. thermocellum growth (6, 10–12), implying its ability to use CO2. This observation raises the questions of how CO2 plays a role in promoting C. thermocellum growth (13), and whether CO2 is incorporated into the metabolism. There is limited information on pathways relating to CO2 uptake thus far. One proposed pathway involving CO2 utilization in C. thermocellum is the malate shunt and its variant pathway (7, 14), in which CO2 is first incorporated by phosphoenolpyruvate carboxykinase (PEPCK) to form oxaloacetate and then is released either by malic enzyme or via oxaloacetate decarboxylase complex, yielding pyruvate. However, other pathways capable of carbon fixation may also exist but remain uncharacterized.
In recent years, isotopic tracer experiments followed by mass spectrometry (MS) (15, 16) or NMR measurements (17) have emerged as powerful tools for metabolic analysis. This methodology traces the transit of isotopic atoms throughout the biochemical network and sheds light on active reactions as well as molecular fluxes in vivo. Coupled with classic genetic manipulations, this technology has been successfully applied to provide insights into novel metabolic pathways in bacteria (18), yet it has not been used to study C. thermocellum.
In several species of Clostridium, the one-carbon (C1) metabolism is initiated from CO2 reduction to become formate via formate dehydrogenase (Fdh) (19). This pathway provides C1 units for many crucial reactions, including amino acids and purine biosynthesis. Formate serves as a precursor to the folate biosynthesis pathway that forms the “methyl” branch of the Wood–Ljungdahl pathway, yielding acetyl-CoA from CO2 (19). However, C. thermocellum lacks the first key enzyme, Fdh, based on genome information. In the present study, we investigate CO2-fixing pathway(s) in C. thermocellum involving C1 metabolism by using 13C-tracer experiments. We measure the isotopomers of fermentation products and proteinogenic amino acids using NMR and GC/MS, and uncover a route C. thermocellum employs to fix CO2 when grown in a primarily heterotrophic mode supplemented with sodium bicarbonate.
Results
Effects of Bicarbonate on C. thermocellum Growth and Metabolism.
To examine C. thermocellum’s ability to use inorganic carbon, we compared cell growth and metabolic product formation during cellobiose fermentation with and without bicarbonate supplementation (20 mM). To eliminate any potential buffering effect exerted by bicarbonate, fermentation was performed in batch mode with pH controlled at 7.0 throughout. Upon consumption of all cellobiose, cultures with added bicarbonate yielded ∼40% more cell biomass than in its absence (Table 1). Without accounting for the excreted amino acids that have been observed in overflow metabolism (3), this result increased the possibility that extra total carbon output (i.e., cell biomass, lactate) could emerge from incorporation of the inorganic carbon (bicarbonate) as suggested by the calculated apparent carbon efficiency (65.7% without bicarbonate and 75.5% with bicarbonate; Table 1). We also observed higher apparent carbon efficiency in bicarbonate-fed cultures in non–pH-controlled fermentation (Table S1) buffered with 50 mM 3-(N-morpholino)propanesulfonic acid (MOPS).
Table 1.
Carbon input and output in pH-controlled bioreactors (pH 7.0) with and without bicarbonate
| , 20 mM | Cellobiose consumed, mM | Lactate, mM | Formate, mM | Acetate, mM | Ethanol, mM | Final OD600 | Cbiomass,* mM | Apparent carbon efficiency† |
| With bicarbonate | 17.2 ± 0.6 | 10.3 ± 1.1 | 3.1 ± 0.6 | 9.1 ± 0.4 | 19.9 ± 0.5 | 1.4 ± 0.2 | 63.8 ± 8.8 | 75.5 ± 3.0% |
| Without bicarbonate | 17.3 ± 0.3 | 8.3 ± 0.1 | 3.8 ± 1.2 | 11.1 ± 0.6 | 21.3 ± 0.4 | 1.0 ± 0.3 | 42.9 ± 12.1 | 65.7 ± 5.5% |
Carbon molarity in cell biomass (Cbiomass) is calculated based on the C. thermocellum formula C5H8O2N and the measured OD600 values (OD600 = 1.04 g/L cell dry weight).
Apparent carbon efficiency is defined as the ratio of produced organic carbons to consumed organic carbons following the calculation: (Clactate + Cformate + Cacetate + Cethanol + Cbiomass)/Ccellobiose. Data are representative biological replica (mean ± SD, n = 2).
Table S1.
Carbon input and output in C. thermocellum fermentation (non–pH-controlled, buffered with 50 mM MOPS) with and without bicarbonate supplementation
| Substrate | Consumption, mM | Production, mM | Apparent carbon efficiency,† % | |||||||
| Cellobiose, 14.6 mM | Bicarbonate, 20 mM | Cellobiose | Lactate | Formate | Acetate | Ethanol | Final OD600 | Cbiomass* | H2 | |
| Positive | Negative | 11.8 ± 0.2 | 5.9 ± 0.2 | 4.9 ± 0.8 | 8.6 ± 0.7 | 14.7 ± 0.6 | 0.9 ± 0.0 | 41.6 ± 0.5 | 12.4 | 78.4 |
| Positive | Positive | 14.5 ± 0.0 | 10.3 ± 1.6 | 7.8 ± 0.3 | 11.2 ± 0.1 | 20.6 ± 0.2 | 1.0 ± 0.0 | 45.6 ± 0.6 | 13.3 | 84.8 |
| ΔCcellobiose,‡ mM | 32.7 | |||||||||
| ΔCproduct,§ mM | 36.9 | |||||||||
Values are reported as average ± SD (n = 3).
Carbon molarity in cell biomass (Cbiomass) is calculated based on the C. thermocellum formula C5H8O2N and measured OD600 value, which is equal to 1.04 g/L OD600 cell dry weight, approximately.
Apparent carbon efficiency is defined in this case as the ratio of produced organic carbons to consumed organic carbons following the calculation: (Clactate + Cformate + Cacetate + Cethanol + Cbiomass)/Ccellobiose.
ΔCcellobiose refers to the amount of carbons in cellobiose that were consumed more in the bicarbonate-fed culture than in the culture fed with only cellobiose.
ΔCproduct refers to the total amounts of carbon in lactate, formate, acetate, ethanol, and biomass that were produced more in the bicarbonate-fed culture than in the culture fed with only cellobiose.
Reduction of Bicarbonate to Formate as Revealed by NMR Analysis Using 13C-Tracer.
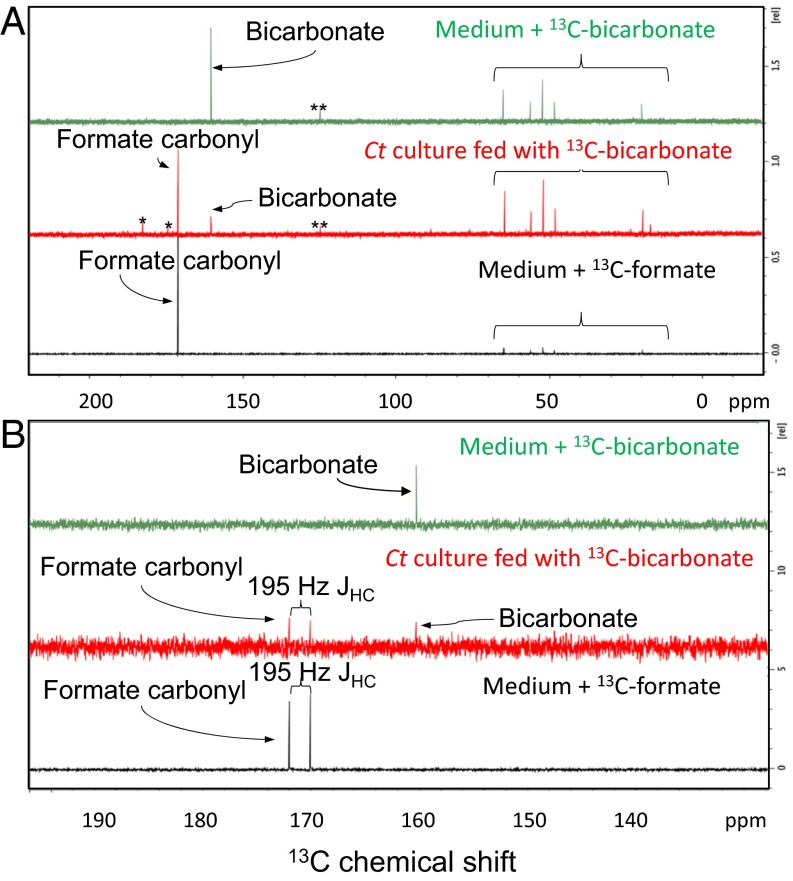
To track how bicarbonate could be metabolized by the bacterium, we fed C. thermocellum 13C-bicarbonate (20 mM) and unlabeled cellobiose (14.6 mM) and analyzed the labeled fermentation products that were excreted into the medium with 13C-NMR. Data from Fig. 1A show 1D 13C spectra of the culture-spent medium after cells were grown to late log phase. In the medium, we detected small peaks at 160.3 and 128.0 ppm (Fig. 1A, double asterisks), which correspond to residual bicarbonate and CO2, respectively (Fig. 1A, Top and Middle), and a signature formate carbonyl peak with a chemical shift at 171.1 ppm (Fig. 1A, Middle and Bottom). To confirm the formation of 13C-formate further, common fermentation products were also assessed for the assignment of the new peak at 171.1 ppm. Organic acids, including succinate, malate, butyrate, citrate, and isocitrate, have carbonyl carbons with chemical shifts that do not match the observed peak. One class of doubtable compounds is alpha-keto acids (i.e., pyruvate, 2-oxoglutarate), which have a carboxylic carbon linked to a keto group, appearing at around 170 ppm. To validate further, the 1H decoupling was inactivated during signal acquisition. A one-bond carbon–hydrogen scalar coupling, JHC, of 195-Hz splits the peak at 171.1 ppm (Fig. 1B) due to a hydrogen directly bound to the carbonyl carbon. Pyruvate and 2-oxoglutarate, however, do not have directly bound 1H on their respective carbonyl carbons, leading to the conclusion that the new peak at 171.1 ppm is indeed derived from formate. In addition to 13C-formate, two small peaks at 182.5 and 174.4 ppm (Fig. 1A, marked with asterisks) correspond to other fermentation products that may also be derived from 13C-bicarbonate labeling but in very small amounts. Other peaks from 5 to 65 ppm likely arose from natural abundance components in the defined media and did not change in relative intensity from sample to sample.
Fig. 1.
13C-NMR analysis of supernatant from C. thermocellum (Ct) culture fed with 20 mM 13C-bicarbonate and 14.6 mM unlabeled cellobiose. (A) 13C-NMR signal at 171 ppm is consistent with a formate carbonyl carbon that is observed in the spent medium of C. thermocellum (red spectrum). Defined medium supplemented with 20 mM 13C-bicarbonate (green spectrum) and 20 mM 13C-formate (black spectrum) was analyzed as the references. The single asterisk indicates other products of bicarbonate metabolism. The double asterisks indicate a contaminant in the 13C-bicarbonate. The signals within the braces indicate natural abundance of aliphatic and methyl carbons from the medium or metabolites. (B) JHC dipolar coupling of 195 Hz further confirms the identification of the peak at 171 ppm as formate.
Putative Reductive C1 Metabolism Based on Genome Annotation.
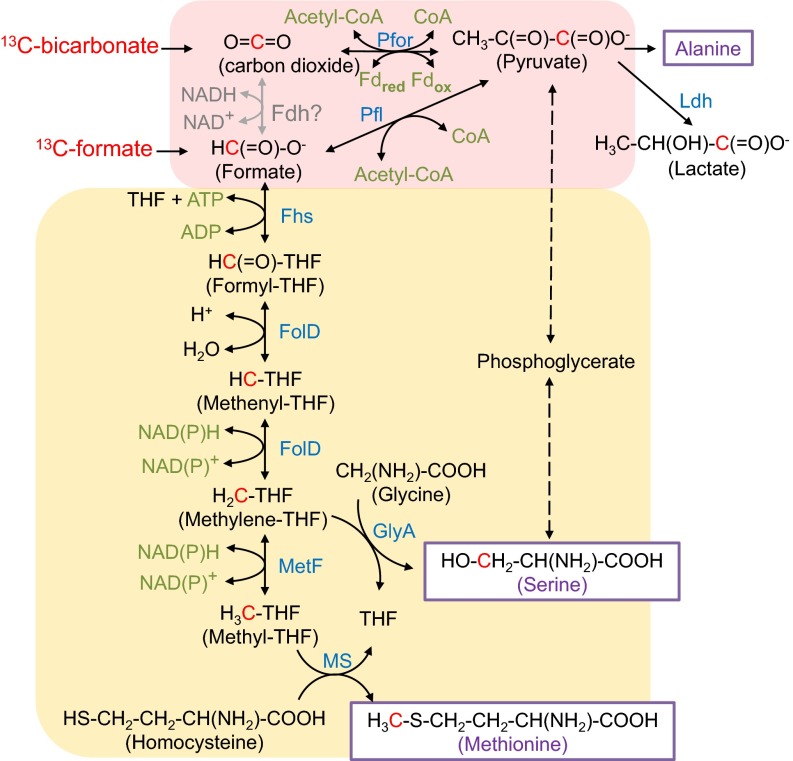
The above labeling experiments provided evidence of a significant CO2-to-formate reduction pathway that remains to be characterized. To identify genes that are putatively responsible for this conversion, we reconstructed the C1 metabolic pathway de novo, based on the genomic information of C. thermocellum DSM1313 strain (20). Its genome sequence suggests that C. thermocellum is capable of converting formate to methionine, serine, and pyruvate via the methyl branch of the Wood–Ljungdahl pathway (Fig. 2). However, it lacks Fdh, the enzyme microbes typically use to convert CO2 to formate (Fig. 2).
Fig. 2.
Schematic of reductive C1 metabolism initiated from rPFOR and reversed PFL. The question mark indicates a missing reaction in C. thermocellum DSM1313 genome annotations. Pink-shaded pathways illustrate the reduction of CO2 to formate and CO2 to pyruvate. Yellow-shaded pathways include steps of serine and methionine biosynthesis. Fdh is not annotated in C. thermocellum genome. Fhs, formyl-tetrahydrofolate synthase (clo1313_0030); FolD, methylene-tetrahydrofolate dehydrogenase/cyclohydrolase (clo1313_1120); GlyA, glycine hydroxymethyltransferase (clo1313_1155); MetF, methylene-tetrahydrofolate reductase (clo1313_2132); MS, methionine synthase (clo1313_1587-1588, clo1313_1581-1582, clo1313_0372). Dotted lines indicate multistep catalysis. Carbons in red indicate 13C-isotopes propagated from 13C-bicarbonate or 13C-formate in the tracer experiments.
Lacking the fdh gene, the only other gene encoding formate production found in C. thermocellum genome is pyruvate-formate lyase (PFL), catalyzing the conversion of pyruvate and CoA to acetyl-CoA and formate (21). We thereby hypothesize that a bypass consisting of two reactions catalyzed by pyruvate:ferredoxin oxidoreductase (PFOR) in the reversed direction and PFL may realize the CO2-to-formate conversion. Presumably, the reversed PFOR activity fixes CO2 by catalyzing the formation of pyruvate using CO2 and acetyl-CoA as cosubstrates. The fixed carbon atom from CO2 forms the carboxylic group of pyruvate, which was then split to make formate by PFL (Fig. 2), with the remaining two carbons in pyruvate making up the acetyl group in acetyl-CoA. Both pfl and pfor genes are annotated in the C. thermocellum genome. Genes for pyruvate formate lyase (pflB, clo1313_1717) and its activating enzyme (pflA, clo1313_1716) are adjacent to each other on the genome. Several putative genes encoding for PFOR (clo1313_0673, clo1313_0020-0023, clo1313_0382-0385, and clo1313_1353-1356) were also annotated, hence making our hypothesis genetically feasible.
13C-Tracer Data Demonstrated the Reversed PFOR Activity.
To investigate this hypothesized pathway, we first test if a reversed PFOR (rPFOR) activity exists in vivo. We set up a steady-state tracer experiment by feeding 13C-bicarbonate (20 mM) along with unlabeled cellobiose (14.6 mM) to the cells and detecting the labeling pattern of proteinogenic amino acids by GC/MS. The isotopomer fingerprint of pyruvate can be traced by the isotopomer fingerprint of alanine, which is a direct transaminated product of pyruvate. As shown in Fig. 3A, M_ala_085 is a GC/MS fragment of alanine and reveals the labeling pattern of a pyruvate fragment with carbon atoms at positions 2 and 3 (Pyr2–3). For Pyr2–3, a dominant peak at m0 accounted for 95% (n = 3, SE ≤ 1%) of total isotopes, suggesting that the carbon atoms at positions 2 and 3 remained almost entirely unlabeled. M_ala_057 is another MS fragment of alanine, representing the isotopomer pattern of pyruvate with all carbon atoms (Pyr1–3). The detected m0 and m1 signals accounted for 55% and 43% of total isotopes, respectively, indicating that a significant portion of this MS fragment either remained fully unlabeled or had only one 13C-carbon (∼43%). These results led us to conclude that the labeled carbon is predominantly at position 1 (carboxylic group) of pyruvate, which is consistent with the hypothesized rPFOR reaction to fix CO2 (Fig. 3B) and strongly supports the existence of rPFOR activity in vivo under the tested physiological condition. We also detected 13C-lactate with a labeling pattern consistent with the labeling pattern of pyruvate (Figs. 2 and 3), presumably propagated from pyruvate.
Fig. 3.
Isotopomer analysis of proteinogenic amino acids and lactate in cultures grown on 20 mM 13C-sodium bicarbonate and 14.6 mM unlabeled cellobiose. (A) Relative abundance of mass isotopomers for pyruvate, serine, and lactate (n = 3, SD < 1%) in wild type (∆hpt). (B) Schematics of carbon atom transits via the reversed PFOR (pink box) and the malate shunt (gray box). OAADC, oxaloacetate decarboxylase complex; MDH, malate dehydrogenase; ME, malic enzyme. The labeled (13C) and unlabeled (12C) carbon atoms are represented by closed and open circles, respectively. (C) Isotopomer analysis of proteinogenic alanine and leucine in ∆hpt in cultures fed with [2-13C]acetate and unlabeled bicarbonate (20 mM) when the bacteria were grown primarily in 14.6 mM (5 g/L) cellobiose. Carbons at positions 1 and 2 of N-tert-butyldimethylsilyl-N-methyltrifluoroacetamide–derivatized leucine can be fragmented by GC/MS and are directly derived from acetyl-CoA.
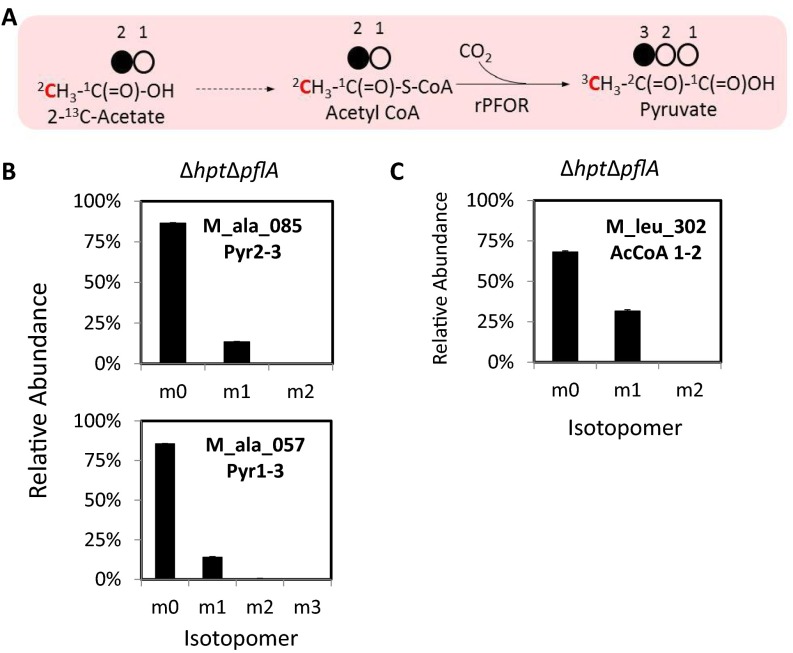
To confirm rPFOR activity as the main mechanism contributing to the labeled pyruvate (position 1), and not to the label exchange reaction, we fed C. thermocellum [2-13C]acetate (40 mM) supplemented with unlabeled bicarbonate (20 mM) when cells were grown primarily in cellobiose (5 g/L). Results showed labeled carbons at the expected position in pyruvate (position 3) and acetyl-CoA (position 2) in both wild type (∆hpt; Fig. 3C) and PFL-inactivated mutant (∆hpt∆pflA; Fig. S1). For confirmation and characterization of the ∆hpt∆pflA mutant, see Fig. 5 and Figs. S2 and S5A. These results also ruled out the possibility of labeled pyruvate transiting from acetyl-CoA via reversed PFL activity. Results are described in greater detail in SI Results. The observed labeled carbon at position 3 of pyruvate is independent of the label exchange carbon specific to the carboxyl group, unlike previously reported in Clostridium acetobutylicum (22).
Fig. S1.
Isotopomer analysis of proteinogenic alanine and leucine in wild type (∆hpt) when cultures were fed with 40 mM [2-13C]acetate and 20 mM unlabeled sodium bicarbonate, and were grown primarily in 5 g/L cellobiose. (A) Schematics depicting the labeled carbon atom in red transiting from acetate to pyruvate via acetyl-CoA and rPFOR activity. (B) Relative abundance of mass isotopomer for pyruvate. (C) Relative abundance of leucine as the proxy to measure the labeling pattern in acetyl-CoA. Carbon atoms at positions 1 and 2 (C1–2) of TBDMS-derivatized leucine can be fragmented by GC/MS and are directly derived from acetyl-CoA.
Fig. 5.
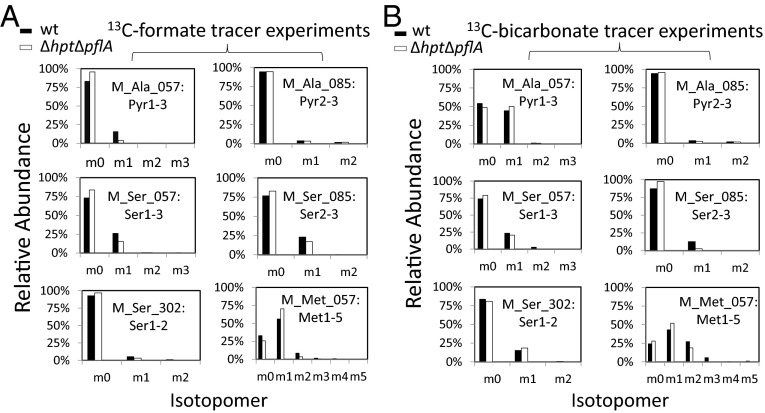
Isotopomer analysis of GC/MS fragments for proteinogenic amino acids in ∆hpt∆pflA mutant (white columns) and wild type (∆hpt, black columns) grown on 14.6 mM unlabeled cellobiose with 20 mM 13C-formate (A) or 20 mM 13C-sodium bicarbonate (B). Panels for each GC/MS fragment represent the labeling pattern of the amino acid or its precursor with indicated C atoms. The technical variance is less than 1% in tracer experiments.
Fig. S2.
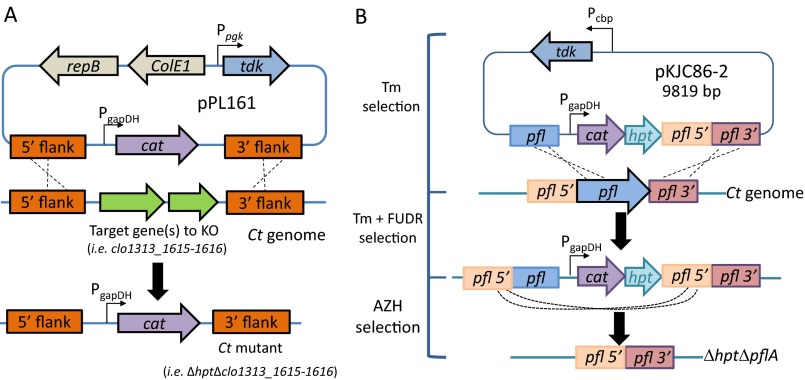
Schematics of constructs to knock out the gene(s) of interest. (A) Plasmid design to knock out putative PFOR individually in the C. thermocellum (Ct) genome via homologous recombination. The design replaced the target gene(s) with the expression of the thiamphenicol resistance gene (cat) on the genome for selection. Individual putative PFOR deletion mutants created are ∆hpt∆clo1313_1615-1616, ∆hpt∆clo1313_0673, ∆hpt∆clo1313_0382-0385, ∆hpt∆clo1313_0020-0023, and ∆hpt∆clo1313_1353-1356. (B) Schematics of markerless deletion of pflA gene from the C. thermocellum (Tm) genome. All mutants were generated in the ∆hpt background. All PCR products were validated by commercial Sanger sequencing. AZH, azahypoxanthin; ColE1, Escherichia coli replication origin; FUDR, 5-fluoro-2′deoxyuridine; Pcbp, cellobiose phosphorylase promoter; Ppgk, phosphoglycerate kinase promoter; repB, gram-positive replication origin; tdk, thymidine kinase.
Fig. S5.
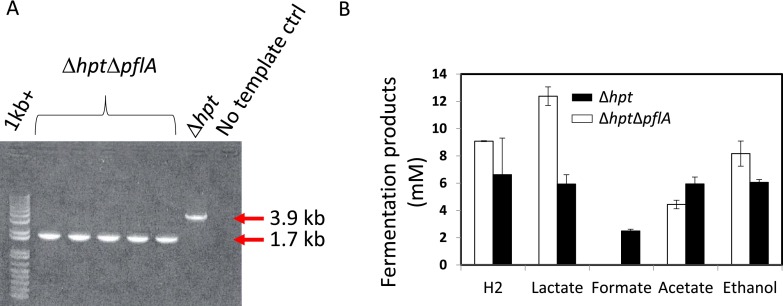
Deletion of pyruvate-formate lyase activating subunit (pflA, encoded by clo1313_1716) from C. thermocellum genome. (A) DNA electrophoresis gel validating the correct size of the PCR products for the deletion of pflA in ∆hpt background. ctrl, control. (B) Fermentation products secreted from ∆hpt and ∆hpt∆pflA. Formate is no longer produced from the PFL deletion mutant, confirming the complete inactivation of PFL as well as the fact that PFL serves as the only enzyme responsible for the formate production from pyruvate. Primer sequences used for PCR reactions are listed in Table S2.
To determine which pathway(s) may also lead to 13C-labeled pyruvate at the carboxylic carbon, we examined the fate of carbon atoms among all possible candidate pathways, including the malate shunt (7, 14) which is known to assimilate and release CO2 in C. thermocellum. As shown in Fig. 3B, CO2 fixation is catalyzed by PEPCK, resulting in 13C-labeling at position 4 of oxaloacetate. This labeled carbon is propagated to position 4 of malate via malate dehydrogenase and is subsequently lost as 13CO2 by malic enzyme. Therefore, malate shunt, per se, does not contribute to the 13C-labeling at the carboxylic group of pyruvate. Another possible carboxylase enzyme that could presumably result in the labeling at the carboxylic group of pyruvate is ribulose bisphosphate carboxylase/oxygenase (RuBisCO). However, genes encoding for the highly conserved RuBisCO enzyme are not present in the C. thermocellum genome or in other sequenced Clostridium species. Thus, RuBisCO was ruled out.
We also considered the possibility of a reversible conversion between malate and fumarate catalyzed by malate hydrolyase (Clo1313_0640). The symmetry of the fumarate molecule can interchange labeling on carbon atoms in positions 1 and 4; hence, it could contribute to the resulting 13C-carboyxlic group in pyruvate. Although the alanine labeling pattern (Fig. 3A) cannot rule out the malate hydrolyase reaction, data from genetic KOs (Fig. 4) presented below are consistent with rPFOR activity and not malate hydrolyase activity.
Fig. 4.
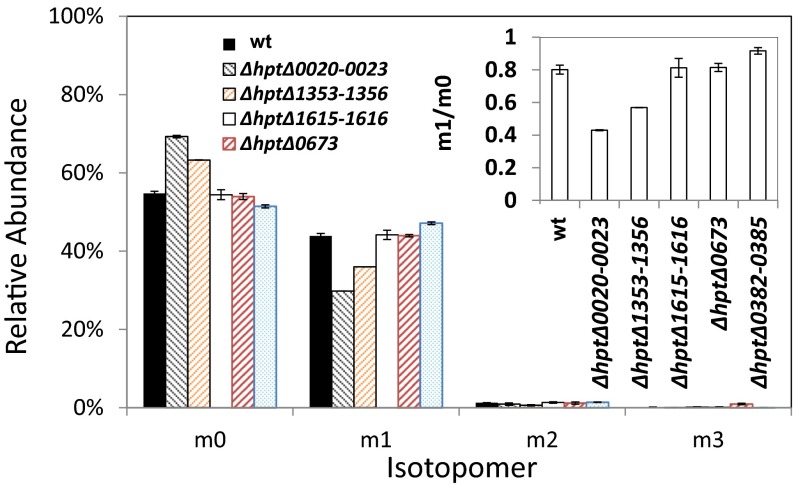
Isotopomer analysis of proteinogenic alanine in ∆hpt and in individual deletions of all five putative PFORs. All strains were grown on 20 mM 13C-sodium bicarbonate and 14.6 mM unlabeled cellobiose. (Inset) Ratio of m1/m0 in individual putative PFOR deletion mutants is plotted. wt, wild type.
We also investigated the isotopomer pattern for serine, which could be derived from phosphoglycerate, a triose phosphate interconverted with pyruvate in the glycolytic pathway (Fig. 2). Assuming that serine is exclusively derived from glycolysis and shares an identical synthetic route with alanine, the labeling pattern of serine and alanine should be very similar. However, in contrast to mostly unlabeled Pyr2–3, we observed a nonnegligible m1 peak of Ser2–3 with 12% enrichment (Fig. 3A). One carbon labeled at Ser2–3 implies a distinct serine pathway from pyruvate, consistent with the metabolic pathway in which a 13C-methylene-THF from reductive C1 metabolism is combined with glycine by glycine hydroxymethyltransferase (glyA, clo1313_1155) and forms the hydroxylmethylene group of serine at position 3 (Fig. 2). These results implied that 13C isotope propagated to pyruvate was able to flow into the C1 pathway via formate, contributing to the biosynthesis of serine in C. thermocellum.
Knocking Out PFOR Genes Impairs Pyruvate Synthase Activity for CO2 Fixation.
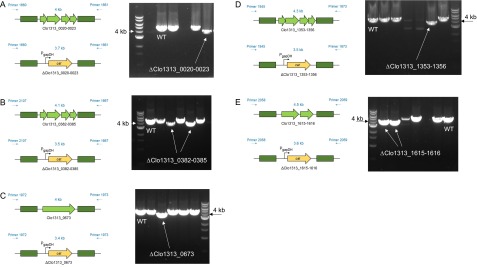
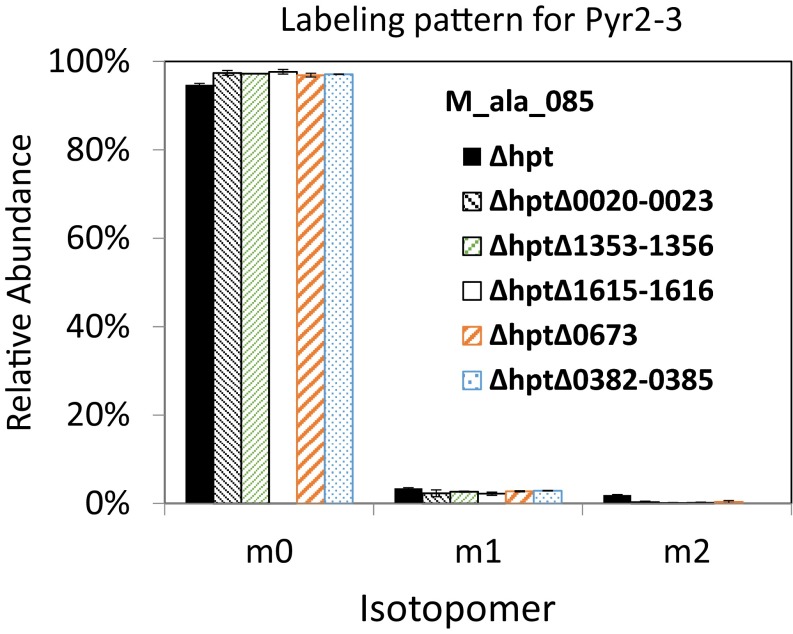
The CO2-fixing C1 pathway initiated by PFOR in the reductive direction was further examined through the deletion of putative PFOR genes and the analysis of altered labeling patterns in the KO mutants. Multiple genes or gene clusters are annotated as PFOR (clo1313_0020-0023, 1353-1356, 0673, and 0382-0385) or indole pyruvate ferredoxin oxidoreductase (clo1313_1615-1616) in the C. thermocellum genome. These genes were respectively deleted via homologous recombination following the schemes shown in Fig. S2A, and validation of the genotype via colony PCR is shown in Fig. S3 and Table S2. All PCR products were further confirmed by commercial sequencing. The resulting mutants, ∆hpt∆clo1313_0020-0023, ∆hpt∆clo1313_1353-1356, ∆hpt∆clo1313_1615-1616, ∆hpt∆clo1313_0673, and ∆hpt∆clo1313_0382-0385, were fed with 20 mM 13C-bicarbonate and 14.6 mM unlabeled cellobiose for isotope tracer experiments. The relative abundance of m0 and m1 shown for Pyr1–3 (M_ala_057; Fig. 4) and for Pyr2–3 (M_ala_085; Fig. S4) indicates that the carbon is labeled predominantly on the carboxylic group in pyruvate in both wild type (∆hpt) and mutants, but the relative abundance of m1 is significantly lower in mutants ∆hpt∆clo1313_0020-0023 and ∆hpt∆clo1313_1353-1356 (Fig. 4). By taking the ratio of pyruvate labeled at the carboxylic group (m1) to unlabeled ones (m0), data showed that m1/m0 ratios are not significantly different in individual PFOR deletion mutants ∆hpt∆clo1313_1615-1616 and ∆hpt∆clo1313_0673, or exhibited little difference in mutant ∆hpt∆clo1313_0382-0385. However, the m1/m0 ratios are significantly lower in ∆hpt∆clo1313_0020-0023 and ∆hpt∆clo1313_1353-1356, with reduced labeling at the carboxylic group. The results identified Clo1313_0020-0023 and Clo1313_1353-1356 functioning as a pyruvate synthase, catalyzing the incorporation of CO2 originating from 13C-bicarbonate to form pyruvate. Based on the relative ratios of m1 to m0, Clo1313_0020-0023 and Clo1313_1353-1356 account for ∼50% and 30% (Fig. 4) of pyruvate synthase activity, respectively, for carbon fixation. The differential m1/m0 ratios in these mutants also suggest that rPFOR contributes to the 13C-carboxylic carbon labeling in pyruvate, which cannot originate from the interconversion between malate and fumarate alone. However, potential interplay between the putative PFORs and the interconversion between malate and fumarate is beyond the scope of this study, and hence is not addressed here.
Fig. S3.
Validation of five individually marked deletions of the putative PFOR gene or gene clusters via colony PCR. The DNA electrophoresis gels showed PCR products with reduced sizes in each KO mutant. Correct PCR product sizes were verified for KO mutants ∆hpt∆clo1313_0020-0023 (A), ∆hpt∆clo1313_0382-0385 (B), ∆hpt∆clo1313_0673 (C), ∆hpt∆clo1313_1353-1356 (D), and ∆hpt∆clo1313_1615-1616 (E). All forward and reverse primers are designed to bind outside of the 5′ and 3′ flanking regions, and primer sequences are listed in Table S2.
Table S2.
Oligonucleotide sequences used in this study to validate KO mutants
| Primer name | Sequence 5′→3′ | Template |
| 1,660 | AAGCCTATCAGCTAAGGTACGA | ∆hpt∆clo1313_0020-0023 |
| 1,661 | CCTATATCCTACGAACCACATTCC | ∆hpt∆clo1313_0020-0023 |
| 2,107 | GCATTTACGACCACCTAGATTCA | ∆hpt∆clo1313_0382-0385 |
| 1,667 | CGATTGCTTCAGGAGCTTTATTG | ∆hpt∆clo1313_0382-0385 |
| 1,972 | ATCGGAGTGGAGAATGAAACAG | ∆hpt∆clo1313_0673 |
| 1,973 | GTCTTGTTTGGAGTGATAAGATGTC | ∆hpt∆clo1313_0673 |
| 1,945 | GGAAATTGAGAGCGAAGACTATGA | ∆hpt∆clo1313_1353-1356 |
| 1,673 | AGGCAATAAAGGCACTGATAGA | ∆hpt∆clo1313_1353-1356 |
| 2,058 | GCAGCCTTTAAGCCTTCTTTC | ∆hpt∆clo1313_1615-1616 |
| 2,059 | GAGGAGCAGTATCTCCAAACTC | ∆hpt∆clo1313_1615-1616 |
| 72 | TGGTTATCATGCAGGATTGT | Specific to the plasmid backbone |
| 73 | CTCTTTATCCTTCTTATAAGCTCTTCAC | Specific to the plasmid backbone |
| pfl bf5 f | TGCTGGCTTACACCGATATGGCG | ∆hpt∆pflA |
| seq pfl 3rv | TGCCTGACAGAATCCTCTTTGC | ∆hpt∆pflA |
Fig. S4.
Isotopomer analysis of proteinogenic alanine in Δhpt and in individual deletions of all five putative PFOR enzymes. All strains were grown on 20 mM 13C-sodium bicarbonate and 14.6 mM unlabeled cellobiose.
PFL KO Mutant Is Deficient in Reductive C1 Metabolism.
To assess the involvement of PFL in reductive C1 metabolism, we inactivated PFL by deleting the pflA gene as illustrated in Fig. S2B, adapting a scheme developed previously (23). Deletion of the pflA gene was confirmed by PCR analysis (Fig. S5A) and commercial sequencing of the PCR products. Mutant ∆hpt∆pflA grew slower than the wild type in defined medium, consistent with previous observations (12). We also measured the batch fermentation products when all substrates were consumed (Fig. S5B). As expected, although the wild type produces 2.3 mM formate, formate is no longer detected in the ∆hpt∆pflA culture-spent medium (Fig. S5B), confirming complete inactivation of PFL and the fact that PFL is the only enzyme responsible for formate production from pyruvate.
To investigate how PFL deficiency affects carbon flux toward C1 metabolism, we compared the labeling pattern of isotopomers in both ∆hpt∆pflA and wild type by feeding 13C-formate (20 mM) and 13C-bicarbonate (20 mM), respectively (Fig. 5). In either case, unlabeled cellobiose (14.6 mM) was added to the cell culture. We collected isotopomer data for proteinogenic amino acids that may be synthesized from this pathway, including alanine, serine, and methionine. With the addition of 13C-formate, an m1 peak with 16% enrichment in Pyr1–3 was observed for wild type, whereas the corresponding m1 ratio was merely 4% in ∆hpt∆pflA. In the isotopomer of Pyr2–3, we observed no significant difference in labeling pattern between the strains. Taken together, the results supported that the 13C-carbon atom in formate was internalized by the cells and became the carboxylic carbon of pyruvate, which was catalyzed by the reversed PFL activity. We next analyzed the Ser and Met isotopomers that could be synthesized from the C1 pathway downstream of 13C-formate. Based on the labeling patterns of Ser1–3, Ser2–3, and Ser1–2 (Fig. 5A), we deduced that the 13C-carbon propagated from 13C-formate is mainly at position 3 of Ser (hydroxylmethylene group), consistent with our constructed de novo C1 metabolic pathway toward serine biosynthesis (Fig. 2). As for the isotopomer of Met shown in Fig. 5A, both ∆hpt∆pflA and wild type indeed demonstrated a dominant peak at m1 upon 13C-formate addition, validating the incorporation of the methyl group propagated from 13C-formate into Met. Detailed descriptions of Ser and Met isotopomer labeling analyses are provided in SI Results.
We also analyzed the isotopomers of proteinogenic amino acids for 13C-bicarbonate labeling experiments in ∆hpt∆pflA. Based on our hypothesized “rPFOR-PFL shunt,” incorporation of the 13C-carbon from bicarbonate into the C1 metabolism is mediated by PFL, which could be validated by comparing 13C-influx into the C1 metabolism in the presence and absence of an active PFL. Similar pyruvate labeling patterns were observed for wild-type and ∆hpt∆pflA strains, both of which showed m0 and m1 dominant peaks for Pyr1–3 and m0 signal for Pyr2–3 fragment. Results suggest that pflA deletion does not affect CO2 incorporation catalyzed by the pyruvate synthase activity. As for serine labeling, both Ser1–3 and Ser2–3 fragments containing the hydroxyl methylene group had a lower labeling ratio in ∆hpt∆pflA mutant than in wild type. For Ser2–3, mutant ∆hpt∆pflA had a much lower m1 peak (2.6%) than the control (12.7%). Correspondingly, the unlabeled m0 peak of Ser2–3 for ∆hpt∆pflA strain is 10.1% higher than in the parental strain (97.4% vs. 87.3%). Collectively, reduced isotope enrichment in the mutant strongly supports that C1 metabolism originating from 13C-bicarbonate is disrupted by knocking out pflA. It is also evident that PFL activity is essential in internalizing the 13C-carbon in bicarbonate in C. thermocellum, and our hypothesis that PFL coupled with the rPFOR activity initiates the reductive C1 pathway in C. thermocellum was corroborated. We observed a lower extent of fractional labeling of methionine in the ∆hpt∆pflA mutant than in wild type, which is described in greater detail in SI Results.
SI Results
rPFOR Activity, and Not Label Exchange, Contributed to Pyruvate Labeling.
To confirm rPFOR activity as the main mechanism contributing to the labeled pyruvate, and not the label exchange reaction, we fed Clostridium thermocellum [2-13C]acetate (40 mM) supplemented with unlabeled bicarbonate (20 mM) when the bacteria were grown primarily in cellobiose (14.6 mM or 5 g/L). Our results showed labeled pyruvate at the expected position (carbon at position 3) from [2-13C]acetate feeding in both the control strain (∆hpt) and the PFL inactivated mutant (∆hpt∆pflA). These results also ruled out the possibility of labeled pyruvate transiting from acetyl-CoA via reversed PFL activity. The observed labeled carbon at position 3 of pyruvate is independent of the label exchange carbon specific to the carboxyl group.
We further analyzed the labeling pattern of acetyl-CoA using carbons at positions 1 and 2 (C1–2) of leucine as a proxy during [2-13C]acetate feeding in ∆hpt and ∆hpt∆pflA following the same experimental setup described. Briefly, C1–2 of N-tert-butyldimethylsilyl-N-methyltrifluoroacetamide (TBDMS)–derivatized leucine can be fragmented by GC/MS and is directly derived from acetyl-CoA. In summary, results in Fig. 3C showed that the label fraction in acetyl-CoA is 31.6% in ∆hpt∆pflA and the corresponding label fraction in pyruvate is 13.4% (in ∆hpt∆pflA). When dividing 13.4% by 31.6%, we get 0.42. The number 0.42 represents the labeled fraction transited to pyruvate from acetyl-CoA via the rPFOR activity by feeding 13C-acetate, which closely matches the fraction labeled in pyruvate by feeding 13C-bicarbonate reported in the main text, which is 43% in wild type (∆hpt; Fig. 3A). Our data consistently and clearly showed the rPFOR activity as the main mechanism contributing to pyruvate labeling from CO2 fixation, and not label exchange.
Effects of PFL KO on Serine Labeling.
To investigate how PFL deficiency affects carbon flux toward C1 metabolism, we compared the labeling pattern of isotopomers in both ∆hpt∆pflA and wild type by feeding 13C-formate (20 mM) and 13C-bicarbonate (20 mM), respectively (Fig. 5). In either case, unlabeled cellobiose (14.6 mM) was added to the cell culture. For 13C-formate feeding experiments, results showed that Ser1–3 and Ser2–3 fragments in both strains have a significant portion (15–26%) of the molecules labeled on C1 (Fig. 5A). To the contrary, Ser1–2 in ∆hpt∆pflA remained nearly unlabeled and only 6% of Ser1-2 molecules in wild type had one 13C-carbon, which was probably a result of the rPFL activity. We therefore deduced that the 13C-carbon propagated from 13C-formate is mainly at position 3 of Ser (hydroxylmethylene group), consistent with our constructed de novo C1 metabolic pathway toward serine biosynthesis (Fig. 2).
Effects of PFL KO on Methionine Labeling.
With the addition of 13C-formate, one carbon in Met is expected to be traced back to the methyl group in methyl-THF downstream of formate according to the biochemical reactions depicted in Fig. 2.
As to the 13C-bicarbonate labeling experiments in ∆hpt∆pflA, we observed a lower extent of fractional labeling of methionine in the ∆hpt∆pflA mutant than in the wild type (Fig. 5B), implying impaired reductive C1 metabolism. It should be noted that more than one carbon can be labeled in methionine molecules because methionine is not solely synthesized from the C1 metabolic pathway. For instance, in addition to the methyl group from the C1 pathway, other labeled carbons may be derived from the malate shunt, in which oxaloacetate is a carboxylated intermediate serving as the precursor for C1–4 in methionine.
Discussion
This study reveals that during cellobiose metabolism, C. thermocellum also assimilates CO2 via a reductive C1 metabolic pathway that is initiated by the dual actions of reversed PFOR and PFL. PFOR has been greatly considered in the forward direction in C. thermocellum, catalyzing the oxidative decarboxylation of pyruvate to acetyl-CoA and CO2 and generating reduced ferredoxin (Fdred). The PFOR activity in C. thermocellum has been associated with the oxidative decarboxylation of pyruvate to acetyl-CoA. Uyeda and Rabinowitz (24, 25) and Raeburn and Rabinowitz (26) demonstrated in vitro that low potential electron donors, such as Fdred, can drive PFOR to catalyze the reductive carboxylation of acetyl-CoA as a pyruvate synthase. The rPFOR serves as a key enzyme for autotrophic CO2 fixation via the Wood–Ljungdahl pathway in acetogens (27). In this work, the in vivo isotopomer data measured postfeeding C. thermocellum 13C-biocarbonate and [2-13C]acetate double-confirmed rPFOR activity and revealed that rPFOR activity accounted for over 40% of the labeled carbon in pyruvate. Measurements in individual PFOR mutants further identified rPFOR activity predominantly catalyzed by Clo1313_0020-0023 and Clo1313_1353-1356. Consistent with previous global expression studies, Clo1313_0020-0023 is the most highly expressed PFOR based on proteomics (28) and transcriptomics (29) analyses. Clo1313_1353-1356 is the third most highly expressed PFOR based on proteomics data, but it has a low transcript level based on microarray data, and the difference could be due to different growth conditions in these studies.
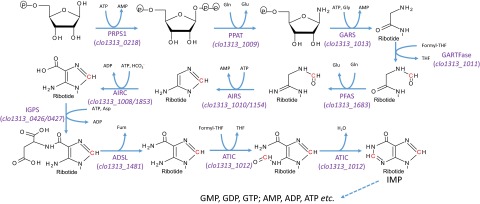
By feeding 13C-bicarbonate to the PFL-inactivated mutant and the wild type, we confirmed the incorporation of these tracers into formate (Fig. 1), lactate (Fig. 3A), and the downstream amino acids linked to C1 metabolism (Figs. 3 and 5). We provided multiple lines of evidence showing that the fixed CO2 was channeled to the C1 metabolism through PFL, which could operate reversibly (21, 30) and contribute to the biosynthesis of essential amino acids, including serine and methionine. In addition, the reductive C1 pathway mediated by PFL may play a critical role in nucleotide biosynthesis (reconstructed purine biosynthesis pathway in C. thermocellum shown in Fig. S6). The impaired growth observed in PFL-inactivated mutant is consistent with a previous finding (12) and underscores PFL’s importance. A transcriptome study reported that folate-dependent enzymes are in the most highly expressed category, which also suggests an active C1 metabolism in vivo (31).
Fig. S6.
Reconstruction of purine biosynthetic pathway in C. thermocellum DSM1313. Dotted lines indicate multistep catalysis. Putative genes involved in each step are present in gene abbreviations with locus numbers. Carbons from C1 metabolism are labeled in red. ADSL, adenylosuccinate lyase; AIRC, 5-aminoimidizole ribonucleotide carboxylase; AIRS, 5-aminoimidizole ribonucleotide synthetase; ATIC, phosphoribosylaminoimidazolecarboxamide formyltransferase/IMP cyclohydrolase; GARS, glycinamide ribonucleotide synthetase; GARTFase, phosphoribosylglycinamide formyltransferase; IGPS, imidazole glycerol phosphate synthase; IMP, inosinate mononucleotide phosphate; PFAS, phosphoribosylformylglycinamidine synthase; PPAT, phosphoribosyl pyrophosphate amidotransferase; PRPS1, phosphoribosyl pyrophosphate synthetase 1.
Carbon loss in the form of CO2 from the conversion of pyruvate to acetyl-CoA across a wide range of bacterial heterotrophs reduces the theoretical maximum yield of a carbon product of interest per carbon consumed (carbon efficiency) downstream of acetyl-CoA. A synthetic nonoxidative glycolysis has been shown to bypass the loss of CO2 in the conversion of pyruvate to acetyl-CoA (32). The rPFOR activity shown here allows some of the lost CO2 to be recaptured into pyruvate, a critical branch point and precursor to numerous natural and nonnatural products. Based on our data, CO2 utilization has increased the titers of organic carbon compounds (Table 1) by incorporating CO2 into the biomass formula, as detected in proteinogenic serine and methionine, and, as such, supplementing cell growth.
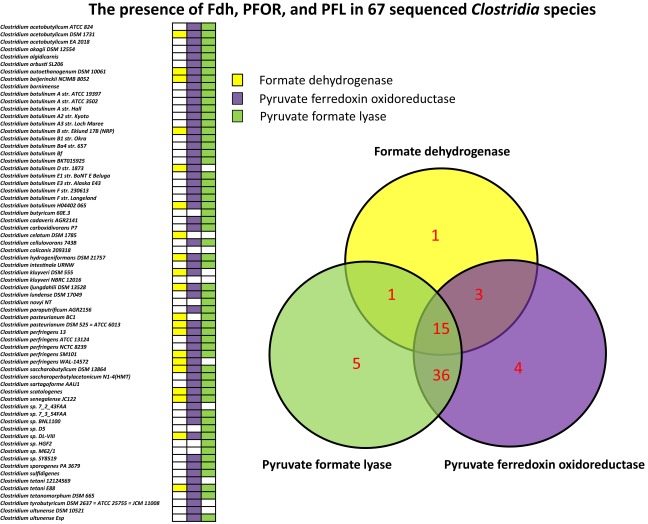
It is interesting that C. thermocellum uses the rPFOR-PFL shunt for CO2 uptake in the absence of Fdh. We speculate that although pyruvate is a key branching point in central carbon metabolism and a key node connecting glycolysis and the C1 metabolic pathway, the rPFOR-PFL route for CO2 uptake may provide added metabolic flexibility and versatility to cells in response to environmental changes affecting their carbon and energy (redox) needs. To gain insights into how widespread the rPFOR-PFL shunt could be for CO2 uptake, we surveyed the presence of PFOR, PFL, and Fdh in 67 sequenced Clostridium species. We discovered that only 20 species have Fdh, whereas 51 species have both PFOR and PFL (Fig. S7). Although the in vivo reversibility of PFOR can be organism- and/or growth condition-specific, and information as to whether these bacteria can use inorganic carbon during organic substrate feeding may not be readily available, the presence of these genes renders it genetically feasible.
Fig. S7.
Summary of the survey results identifying the presence of genes encoding for PFOR, PFL, and in 67 sequenced Clostridium species.
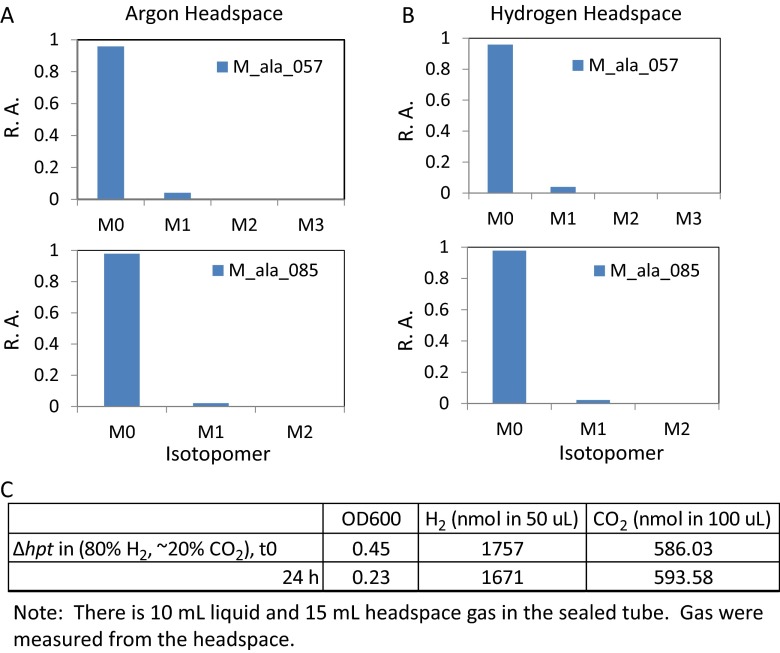
It should be noted that carbon fixation via the rPFOR-PFL shunt requires Fdred as an electron donor. On the other hand, PFOR functioning in the oxidative direction serves as a major pathway for generating Fdred to yield reduced biofuels and chemicals. Thus, the metabolic flux toward biosynthesis may be a trade-off of the flux toward electron generation. We speculate that CO2 enhances growth by regenerating oxidized Fd, which, in turn, provides a driving force for faster cellobiose consumption. Feeding CO2 may also enhance the “transient” CO2 fixation via the malate shunt, with GTP produced via PEPCK promoting C. thermocellum growth. The biosynthesis vs. energy requirement at the pyruvate node needs to be evaluated comprehensively with other major redox pathways (i.e., H2 production) to enhance the carbon economy without causing redox imbalance. To satisfy our curiosity, we tested C. thermocellum autotrophic growth by feeding either bicarbonate plus 100% H2 or an 80% H2/20% (vol/vol) CO2 gas mixture, but detected no growth (Fig. S8). Nevertheless, the rPFOR-PFL shunt uncovered in this study may have important ramifications in the metabolic plasticity of a cellulose degrader and in other heterotrophs, and hence warrants more in-depth investigations.
Fig. S8.
Isotopomer analysis of proteinogenic alanine in Δhpt grown on 50 mM 13C-sodium bicarbonate with 100% argon (Ar) gas in the headspace (A) and 100% H2 gas in the headspace (B). No growth was observed, and the OD600 of the culture grown in either Ar or H2 gas dropped from 0.46 to 0.28 (in Ar gas) and from 0.43 to 0.29 (in H2 gas) 24 h postinoculation. H2 gas in the headspace remained relatively unchanged. (C) Summary of OD600, H2, and CO2 in the headspace at t0 and 24 h after feeding wild-type (Δhpt) 80% H2 and 20% CO2 gas mixture in sealed tubes. This strain has been defined previously. R.A., relative abundance.
Materials and Methods
A more complete discussion is provided elsewhere (15, 16, 23, 33–35), as well as in SI Methods.
Unless otherwise noted, C. thermocellum DSM1313-derived strains, ∆hpt (hpt encoding for hypoxanthine phosphoribosyl transferase is used for counterselection), and other mutants were routinely grown anaerobically at 55 °C on 5 g/L cellobiose. The hpt gene deleted strain is used as the wild type for the studies herein. To test the inorganic carbon utilization, 20 mM sodium bicarbonate was added to cell cultures also fed with cellobiose. We used the DSM122-defined medium referred to as CTFUD medium (36). Full details on strain construction, fermentation conditions, and 13C-tracer experiments are provided in SI Methods.
SI Methods
Strains, Culture Conditions, and Medium.
Unless otherwise noted, C. thermocellum DSM1313-derived strains and mutants were routinely grown anaerobically at 55 °C on 5 g/L (14.6 mM) cellobiose. To test for inorganic carbon utilization, 20 mM sodium bicarbonate was added to cell cultures also fed with 5 g/L cellobiose. We used the DSM122-defined medium referred to as CTFUD medium (33). The growth medium was deoxygenated by gassing with argon for 20 min and autoclaved before use.
Plasmid and Strain Construction.
C. thermocellum DSM1313-derived mutant (∆hpt, also referred to as KJC315) was defined as the wild type and the parental strain to all KO mutants in this study. The gene hpt (clo1313_2927) encodes for hypoxanthine phosphoribosyl transferase, which is used as a counterselection method in the presence of 8-azahypoxanthin. The mutants ∆hpt and ∆hpt∆pflA (KJC318) were constructed using plasmids pKJC83 and pKJC86, respectively. The markerless deletion of the pflA gene (encoded by clo1313_1716) was deleted following the selection and counterselection schemes previously described (1).
To delete potential PFOR enzymes (∆hpt∆clo1313_1615-1616, ∆hpt∆clo1313_0673, ∆hpt∆clo1313_0382-0385, ∆hpt∆clo1313_0020-0023, and ∆hpt∆clo1313_1353-1356), plasmids with a configuration similar to pPL161 (Fig. S2A) were constructed. These plasmids designed for gene KO contain a 5′ flanking region and a 3′ flanking region (1 kb each) homologous to the regions upstream and downstream of the target gene(s) to be knocked out in the C. thermocellum genome. Inserted between the 5′ and 3′ flanking regions is a chloramphenicol/thiamphenicol-resistant gene (cat) driven by glyceraldehyde-3-phosphate dehydrogenase (GAPDH) promoter. In addition, thymidine kinase (tdk) from Thermoanaerobacterium saccharolyticum was cloned after the phosphoglycerate kinase promoter for counterselection with 5-fluoro-2′-deoxyuridine.
To transform the bacteria with a plasmid, wild type was grown in CTFUD medium at 50 °C anaerobically to OD600 = 0.8–1. The culture was chilled on ice for 10 min, and cells were collected by centrifugation in a 50-mL Falcon tube at 4 °C and 6,500 × g for 60 min. Supernatants were then removed aerobically. Cell pellets were resuspended with 10 mL of ice-cold 10% glycerol twice, and centrifuged at 4 °C and 6,500 × g for 45 min. Lastly, pellets were resuspended with 100 μL of ice-cold 10% glycerol aerobically. For each transformation, 20 μL of the competent cells was mixed with about 300–600 ng of DNA in 1-mm-gap prechilled electroporation cuvettes (Molecular BioProducts). The mixtures were electroporated (1.2 kV, 1.5 ms, square pulse) aerobically or anaerobically with a BioRad GenePulser XCell (BioRad Laboratories). Cells were immediately resuspended in 1 mL of prewarmed CTFUD medium and rescued at 50 °C anaerobically for 0–3 h. The cultures were then diluted with 25 mL of prewarmed CTFUD medium and incubated at 50 °C anaerobically until the OD600 was larger than 1. One hundred microliters of growing culture and four 100-fold serial dilutions were then mixed with 25 mL of melting CTFUD agar containing 20 μg/mL thiamphenicol and 10 μg/mL 5-fluoro-2′-deoxyuridine to isolate strains that have undergone double cross-over. The correct genotype was determined by colony PCR and DNA sequencing (Laragen).
The loss of the plasmid in all mutants was validated with PCR using primers specific to the plasmid backbone (Table S2), as well as the loss of resistance to thiamphenicol in the markerless deletion of pflA.
pH-Controlled Bioreactor Setup.
To assess the effect of bicarbonate on C. thermocellum growth, pH-controlled (pH 7.0) fermentation was conducted in batch mode with and without adding 20 mM sodium bicarbonate using bioreactors with a built-in pH controller (Electrolab Biotech and Applikon). Briefly, on the setup of each experiment, 1.8 L of defined CTFUD medium in bioreactors was adjusted to 7.0 and then sterilized by autoclave. Filter-sterilized cellobiose was added to all bioreactors to reach a final concentration of 5 g/L. The bioreactors were deoxygenated by sparging with N2 gas at 60 cubic centimeter. The N2 gas flow was turned off, and the bioreactors were sealed once they had become anaerobic. Anaerobic sodium bicarbonate solution was added to the designated bioreactors. The final working volume was adjusted to 2 L for all bioreactors. The same source of inoculum was used for fermentations with and without sodium bicarbonate in parallel in the same model of bioreactors. The pH was monitored and maintained at 7.0 throughout.
Quantitative Analysis of Fermentation Products.
Cell growth was measured as a function of optical density by spectrophotometry (DU800; Beckman Coulter) at OD600. An OD600 of 1 correlated to 1.04 g/L cell dry weight (R2 = 0.9918). The composition of C. thermocellum biomass was determined to be C5H8NO2 by elemental analysis. Briefly, C. thermocellum was grown to stationary phase on 5 g/L cellobiose; the biomass was pelleted and washed three times before drying overnight at 105 °C and subsequently sent to Huffman Labs for analysis of carbon, hydrogen, nitrogen, oxygen, and sulfur. Hydrogen gas was measured using a gas chromatograph (7890A GC; Agilent Technologies) equipped with a thermal conductivity detector and a stainless-steel Supelco 60/80 Mol Sieve column (6 ft × 1/8 in) with argon as the carrier gas. Peak areas were compared with a standard curve, taking into account both the temperature and pressure. Cellobiose, lactate, formate, acetate, and ethanol were measured by HPLC (1200 series; Agilent Technologies) with a mobile phase of 4 mM H2SO4 using an Aminex HPX-87H column with a Micro Guard Cation H Cartridge. The column temperature was set to 55 °C, and the flow rate was 0.6 mL/min.
13C-Tracer Experiment.
We adopted a steady-state labeling strategy (2). The 13C-labeling experiment was performed with 20 mM 13C-bicarbonate or 13C-formate, respectively, supplemented into the CTFUD defined medium in addition to 14.6 mM cellobiose. For cell growth, C. thermocellum strains were inoculated into these media with a starting OD600 of 0.05. When late log-phase was reached (OD600 ∼ 0.8), 3 mL of cultures was sampled.
NMR Analysis.
The test sample was collected by filtering growth medium from the wild-type (∆hpt) cells that proliferated with 20 mM 13C-bicarbonate and 14.6 mM unlabeled cellobiose. The reference samples were prepared by dissolving either 13C-formate or 13C-bicarbonate in defined CTFUD medium. All NMR spectra were collected in 5-mm tubes on a 400-MHz (9.4-T) Bruker Avance III HD Nanobay, running Topspin 3.5 with a double-resonance, broad-band observe, 5-mm room temperature probe. One-dimensional 13C spectra were collected at 298.15 K using a 30° flip angle pulse-acquire pulse sequence, a 1.36-s acquisition time, and a 2-s delay. Spectra were collected both with and without 1H decoupling during acquisition to measure JHC. All spectra were referenced to 3-(Trimethylsilyl)propanoic acid (TSP), processed with a shifted sine bell apodization function, zero-filled to 65,000 points using NMRPipe (3), and plotted using Nmrglue (4).
GC/MS and Isotopomer Analysis.
The sample treatment and GC/MS analysis were done as previously reported (5), with a few modifications. Briefly, 3 mL of sampled cultures was centrifuged at 10,000 × g for 1 min, and the cell pellets were digested with 500 μL of 6 M HCl at 105 °C for 12 h. The hydrolysate was dried under nitrogen gas flow at 65 °C, and dissolved in 50 μL of water-free dimethylformamide. For the GC/MS measurement, the proteinogenic amino acids were derivatized before analysis. The dried hydrolysate, dissolved in N,N-dimethylformamide, was derivatized by TBDMS with 1% tert-butyl-dimethylchlorosilane at 85 °C for 60 min. One microliter of the sample in the organic phase was loaded onto the GC/MS instrument [Agilent GC-6890 gas chromatograph equipped with an Agilent 19091J-413 column (30 m × 0.32 mm × 0.25 μm) directly connected to a MS-5975C mass spectrometer]. Helium was the carrier gas. The oven temperature was initially held at 50 °C for 2 min; it was then raised to 150 °C at 5 °C/min and held at that value for 2 min. Finally, it was raised to 320 °C at 7 °C/min and held at that final value for 2 min. Other settings included splitless and electron impact ionization at 70 eV. The amino acids, including alanine, aspartate, glutamate, glycine, histidine, isoleucine, leucine, methionine, phenylalanine, proline, serine, threonine, tyrosine and valine, were separated and analyzed.
To analyze the isotope labeling pattern of amino acids, a mass isotopomer distribution vector, MDVα, was assigned according to Nanchen et al. (16):
| [S1] |
where m0 is the fractional abundance of molecules with monoisotopic mass and mi > 0 is the abundance of fragments with heavier masses. The GC/MS data were corrected for the naturally occurring isotopes of oxygen (O), hydrogen (H), and carbon (C) atoms using a correction matrix (Eq. S2) as described by Nanchen et al. (16):
| [S2] |
where MDVα* is the corrected mass isotopomer distribution vector and Ccorr,COH−1 is the correction matrix. According to Eq. S3, the resulting MDVα* values were then used to assess the fractional labeling enrichment of amino acids, respectively:
| [S3] |
where n represents the number of carbon atoms in the amino acid and i is the mass isotopomer.
Feeding Cells CO2/H2 for Growth.
Three methods of feeding C. thermocellum CO2/H2 were used to test its ability to grow entirely on CO2 with and without H2. Briefly, the first method directly inoculated Δhpt (KJC315) cells in two sets of sealed tubes containing CTFUD-defined medium supplemented with 50 mM bicarbonate. One tube was flushed with 100% H2 gas in the headspace, and the other set of tubes did not have H2 gas. The initial OD600 was ∼0.08, and no growth was observed in either set of sealed tubes. In the second method, Δhpt (KJC315) cells were first grown in 5 g/L cellobiose in defined medium to OD ∼ 0.8. Cells were then anaerobically centrifuged at maximum speed for 3 min on a tabletop centrifuge and resuspended in fresh minimal medium with twofold dilution to get to OD600 ∼ 0.4. Cells were then split into two tubes, and both cultures were supplied with 50 mM 13C-bicarbonate, but one set of tubes was purged with 100% H2 gas in the headspace and the other without. The third method involved directly feeding the sealed tubes of cultures with a gas mixture of 80% H2 with balance CO2 in the headspace after cells were grown up, resuspended in fresh defined medium with twofold dilution to OD600 ∼ 0.4. OD600, CO2, and H2 in the headspace were measured at t0 and 24 h after t0. For both the second and third methods, a tube of cells was inoculated with 5 g/L cellobiose after spinning as a positive control to ensure that cells were viable after centrifugation and to monitor potential growth lag introduced by the intervention.
Acknowledgments
We thank Chris Urban, Maria Chun, Sawako Konishi, and Sharon C. Xu for their technical assistance. This work was supported by the National Renewable Energy Laboratory (NREL) Director’s Fellowship (Laboratory Directed Research and Development Subtask 06271403) (to W.X.), and the US Department of Energy (DOE) Energy Efficiency and Renewable Energy (EERE) Fuel Cell Technologies Office (K.J.C., L.M., and P.-C.M.) under Contract DE-AC36-08-GO28308. L.W. and research conducted at the University of California, Los Angeles (P.P.L. and J.C.L.) were supported by the BioEnergy Science Center (BESC), a US DOE Bioenergy Research Center supported by the Office of Biological and Environmental Research in the DOE Office of Science.
Footnotes
The authors declare no conflict of interest.
This article is a PNAS Direct Submission.
This article contains supporting information online at www.pnas.org/lookup/suppl/doi:10.1073/pnas.1605482113/-/DCSupplemental.
References
- 1.Gold ND, Martin VJ. Global view of the Clostridium thermocellum cellulosome revealed by quantitative proteomic analysis. J Bacteriol. 2007;189(19):6787–6795. doi: 10.1128/JB.00882-07. [DOI] [PMC free article] [PubMed] [Google Scholar]
- 2.Ellis LD, et al. Closing the carbon balance for fermentation by Clostridium thermocellum (ATCC 27405) Bioresour Technol. 2012;103(1):293–299. doi: 10.1016/j.biortech.2011.09.128. [DOI] [PubMed] [Google Scholar]
- 3.Holwerda EK, et al. The exometabolome of Clostridium thermocellum reveals overflow metabolism at high cellulose loading. Biotechnol Biofuels. 2014;7(1):155. doi: 10.1186/s13068-014-0155-1. [DOI] [PMC free article] [PubMed] [Google Scholar]
- 4.Olson DG, McBride JE, Shaw AJ, Lynd LR. Recent progress in consolidated bioprocessing. Curr Opin Biotechnol. 2012;23(3):396–405. doi: 10.1016/j.copbio.2011.11.026. [DOI] [PubMed] [Google Scholar]
- 5.Nataf Y, et al. Clostridium thermocellum cellulosomal genes are regulated by extracytoplasmic polysaccharides via alternative sigma factors. Proc Natl Acad Sci USA. 2010;107(43):18646–18651. doi: 10.1073/pnas.1012175107. [DOI] [PMC free article] [PubMed] [Google Scholar]
- 6.Zhou J, et al. Atypical glycolysis in Clostridium thermocellum. Appl Environ Microbiol. 2013;79(9):3000–3008. doi: 10.1128/AEM.04037-12. [DOI] [PMC free article] [PubMed] [Google Scholar]
- 7.Deng Y, et al. Redirecting carbon flux through exogenous pyruvate kinase to achieve high ethanol yields in Clostridium thermocellum. Metab Eng. 2013;15:151–158. doi: 10.1016/j.ymben.2012.11.006. [DOI] [PubMed] [Google Scholar]
- 8.Zhang YH, Lynd LR. Cellulose utilization by Clostridium thermocellum: Bioenergetics and hydrolysis product assimilation. Proc Natl Acad Sci USA. 2005;102(20):7321–7325. doi: 10.1073/pnas.0408734102. [DOI] [PMC free article] [PubMed] [Google Scholar]
- 9.Lu Y, Zhang YH, Lynd LR. Enzyme-microbe synergy during cellulose hydrolysis by Clostridium thermocellum. Proc Natl Acad Sci USA. 2006;103(44):16165–16169. doi: 10.1073/pnas.0605381103. [DOI] [PMC free article] [PubMed] [Google Scholar]
- 10.Lin PP, et al. Consolidated bioprocessing of cellulose to isobutanol using Clostridium thermocellum. Metab Eng. 2015;31:44–52. doi: 10.1016/j.ymben.2015.07.001. [DOI] [PubMed] [Google Scholar]
- 11.Lo J, Zheng T, Hon S, Olson DG, Lynd LR. The bifunctional alcohol and aldehyde dehydrogenase gene, adhE, is necessary for ethanol production in Clostridium thermocellum and Thermoanaerobacterium saccharolyticum. J Bacteriol. 2015;197(8):1386–1393. doi: 10.1128/JB.02450-14. [DOI] [PMC free article] [PubMed] [Google Scholar]
- 12.Rydzak T, Lynd LR, Guss AM. Elimination of formate production in Clostridium thermocellum. J Ind Microbiol Biotechnol. 2015;42(9):1263–1272. doi: 10.1007/s10295-015-1644-3. [DOI] [PMC free article] [PubMed] [Google Scholar]
- 13.Zertuche L, Zall RR. A study of producing ethanol from cellulose using Clostridium thermocellum. Biotechnol Bioeng. 1982;24(1):57–68. doi: 10.1002/bit.260240106. [DOI] [PubMed] [Google Scholar]
- 14.Taillefer M, Rydzak T, Levin DB, Oresnik IJ, Sparling R. Reassessment of the transhydrogenase/malate shunt pathway in Clostridium thermocellum ATCC 27405 through kinetic characterization of malic enzyme and malate dehydrogenase. Appl Environ Microbiol. 2015;81(7):2423–2432. doi: 10.1128/AEM.03360-14. [DOI] [PMC free article] [PubMed] [Google Scholar]
- 15.Xiong W, Liu L, Wu C, Yang C, Wu Q. 13C-tracer and gas chromatography-mass spectrometry analyses reveal metabolic flux distribution in the oleaginous microalga Chlorella protothecoides. Plant Physiol. 2010;154(2):1001–1011. doi: 10.1104/pp.110.158956. [DOI] [PMC free article] [PubMed] [Google Scholar]
- 16.Nanchen A, Fuhrer T, Sauer U. Determination of metabolic flux ratios from 13C-experiments and gas chromatography-mass spectrometry data: Protocol and principles. Methods Mol Biol. 2007;358:177–197. doi: 10.1007/978-1-59745-244-1_11. [DOI] [PubMed] [Google Scholar]
- 17.Szyperski T, et al. Bioreaction network topology and metabolic flux ratio analysis by biosynthetic fractional 13C labeling and two-dimensional NMR spectroscopy. Metab Eng. 1999;1(3):189–197. doi: 10.1006/mben.1999.0116. [DOI] [PubMed] [Google Scholar]
- 18.Xiong W, et al. Phosphoketolase pathway contributes to carbon metabolism of cyanobacteria. Nat Plants. 2015;2:15187. doi: 10.1038/nplants.2015.187. [DOI] [PubMed] [Google Scholar]
- 19.Schuchmann K, Müller V. Autotrophy at the thermodynamic limit of life: A model for energy conservation in acetogenic bacteria. Nat Rev Microbiol. 2014;12(12):809–821. doi: 10.1038/nrmicro3365. [DOI] [PubMed] [Google Scholar]
- 20.Feinberg L, et al. Complete genome sequence of the cellulolytic thermophile Clostridium thermocellum DSM1313. J Bacteriol. 2011;193(11):2906–2907. doi: 10.1128/JB.00322-11. [DOI] [PMC free article] [PubMed] [Google Scholar]
- 21.Thauer RK, Kirchniawy FH, Jungermann KA. Properties and function of the pyruvate-formate-lyase reaction in clostridiae. Eur J Biochem. 1972;27(2):282–290. doi: 10.1111/j.1432-1033.1972.tb01837.x. [DOI] [PubMed] [Google Scholar]
- 22.Amador-Noguez D, et al. Systems-level metabolic flux profiling elucidates a complete, bifurcated tricarboxylic acid cycle in Clostridium acetobutylicum. J Bacteriol. 2010;192(17):4452–4461. doi: 10.1128/JB.00490-10. [DOI] [PMC free article] [PubMed] [Google Scholar]
- 23.Argyros DA, et al. High ethanol titers from cellulose by using metabolically engineered thermophilic, anaerobic microbes. Appl Environ Microbiol. 2011;77(23):8288–8294. doi: 10.1128/AEM.00646-11. [DOI] [PMC free article] [PubMed] [Google Scholar]
- 24.Uyeda K, Rabinowitz JC. Pyruvate-ferredoxin oxidoreductase. IV. Studies on the reaction mechanism. J Biol Chem. 1971;246(10):3120–3125. [PubMed] [Google Scholar]
- 25.Uyeda K, Rabinowitz JC. Pyruvate-ferredoxin oxidoreductase. 3. Purification and properties of the enzyme. J Biol Chem. 1971;246(10):3111–3119. [PubMed] [Google Scholar]
- 26.Raeburn S, Rabinowitz JC. Pyruvate: Ferredoxin oxidoreductase. II. Characteristics of the forward and reverse reactions and properties of the enzyme. Arch Biochem Biophys. 1971;146(1):21–33. doi: 10.1016/s0003-9861(71)80037-1. [DOI] [PubMed] [Google Scholar]
- 27.Furdui C, Ragsdale SW. The role of pyruvate ferredoxin oxidoreductase in pyruvate synthesis during autotrophic growth by the Wood-Ljungdahl pathway. J Biol Chem. 2000;275(37):28494–28499. doi: 10.1074/jbc.M003291200. [DOI] [PubMed] [Google Scholar]
- 28.Rydzak T, et al. Proteomic analysis of Clostridium thermocellum core metabolism: Relative protein expression profiles and growth phase-dependent changes in protein expression. BMC Microbiol. 2012;12:214. doi: 10.1186/1471-2180-12-214. [DOI] [PMC free article] [PubMed] [Google Scholar]
- 29.Raman B, McKeown CK, Rodriguez M, Jr, Brown SD, Mielenz JR. Transcriptomic analysis of Clostridium thermocellum ATCC 27405 cellulose fermentation. BMC Microbiol. 2011;11:134. doi: 10.1186/1471-2180-11-134. [DOI] [PMC free article] [PubMed] [Google Scholar]
- 30.Zelcbuch L, et al. Pyruvate formate-lyase enables efficient growth of Escherichia coli on acetate and formate. Biochemistry. 2016;55(17):2423–2426. doi: 10.1021/acs.biochem.6b00184. [DOI] [PubMed] [Google Scholar]
- 31.Riederer A, et al. Global gene expression patterns in Clostridium thermocellum as determined by microarray analysis of chemostat cultures on cellulose or cellobiose. Appl Environ Microbiol. 2011;77(4):1243–1253. doi: 10.1128/AEM.02008-10. [DOI] [PMC free article] [PubMed] [Google Scholar]
- 32.Bogorad IW, Lin TS, Liao JC. Synthetic non-oxidative glycolysis enables complete carbon conservation. Nature. 2013;502(7473):693–697. doi: 10.1038/nature12575. [DOI] [PubMed] [Google Scholar]
- 33.Kruger NJ, Masakapalli SK, Ratcliffe RG. Optimization of steady-state ¹³C-labeling experiments for metabolic flux analysis. Methods Mol Biol. 2014;1090:53–72. doi: 10.1007/978-1-62703-688-7_4. [DOI] [PubMed] [Google Scholar]
- 34.Delaglio F, et al. NMRPipe: A multidimensional spectral processing system based on UNIX pipes. J Biomol NMR. 1995;6(3):277–293. doi: 10.1007/BF00197809. [DOI] [PubMed] [Google Scholar]
- 35.Helmus JJ, Jaroniec CP. Nmrglue: An open source Python package for the analysis of multidimensional NMR data. J Biomol NMR. 2013;55(4):355–367. doi: 10.1007/s10858-013-9718-x. [DOI] [PMC free article] [PubMed] [Google Scholar]
- 36.Olson DG, Lynd LR. Transformation of Clostridium thermocellum by electroporation. Methods Enzymol. 2012;510:317–330. doi: 10.1016/B978-0-12-415931-0.00017-3. [DOI] [PubMed] [Google Scholar]


