Significance
Using a full-field optical coherence tomography system, we measured changes in the time that light requires to pass through photoreceptor outer segments, when the retina is stimulated by a light pulse. This effect can be used to monitor the activity of single cones in the living human eye. Objective monitoring of photoreceptor activity using such intrinsic optical signals could have important diagnostic applications in ophthalmology and neurology and might provide insight to facilitate basic research.
Keywords: functional optical coherence tomography, intrinsic optical signals, imaging, adaptive optics, phototransduction
Abstract
Noninvasive functional imaging of molecular and cellular processes of vision may have immense impact on research and clinical diagnostics. Although suitable intrinsic optical signals (IOSs) have been observed ex vivo and in immobilized animals in vivo, detecting IOSs of photoreceptor activity in living humans was cumbersome and time consuming. Here, we observed clear spatially and temporally resolved changes in the optical path length of the photoreceptor outer segment as a response to an optical stimulus in the living human eye. To witness these changes, we evaluated phase data obtained with a parallelized and computationally aberration-corrected optical coherence tomography system. The noninvasive detection of optical path length changes shows neuronal photoreceptor activity of single cones in living human retina, and therefore, it may provide diagnostic options in ophthalmology and neurology and could provide insights into visual phototransduction in humans.
Noninvasive, spatially resolved optical detection of retinal function in living humans promises new diagnostic possibilities and new insights into in vivo phototransduction. Vision begins with absorption of photons by rhodopsin or other opsins in photoreceptors, which triggers an amplifying biochemical chain reaction, finally leading to hyperpolarization of the cells and signaling to the brain: a process known as visual phototransduction. In addition to initial bleaching of rhodopsin, several optical changes arise during this visual process (1, 2). Therefore, scientists in the last decades were led to investigate intrinsic optical physiological responses to retinal photostimulation ex vivo and in animals in vivo by various optical techniques, e.g., microscopy, fundus photography, and laser scanning ophthalmoscopy (3). In fact, different fast intrinsic optical signals after light stimuli were reported, detectable as changes in light scattering, absorption, or birefringence, with time constants ranging from milliseconds to seconds. The best in vivo results have been weak signals, obtained by merely looking at the backscattered intensity. In humans, however, these signals were disturbed by rapid eye motion (3–8), making their detection not efficient.
In principle, optical coherence tomography (OCT) (9) offers unique advantages for the observation of intrinsic optical signals. It provides 3D infrared imaging of backscattered light, thereby achieving precise signal localization and minimizing additional undesired photostimulation. Almost 10 years ago, weak changes in backscattering intensity after retinal stimulation were observed using OCT in vitro (10) and in animals (11). As with other imaging techniques, published studies in humans suffered from problems with motion, resulting in even weaker signals, and measurements were cumbersome and time consuming (6–8).
In addition to backscattered intensity, state-of-the-art Fourier-domain OCT (FD-OCT) also detects phases, which are sensitive to small changes of the optical path length that the backscattered light has traveled. The optical path length is determined by the refractive index n, and the physical, geometric distance d that the light has traversed and is given by
Particularly, the optical path length of the photoreceptor outer segment is proportional to the time light requires to pass the cells. It reflects morphology and refractive index, which in principle both could be affected during phototransduction. Previously, optical path length changes on photostimulation were indirectly measured using adaptive optics in combination with coherent flood illumination (4). Brightness fluctuations of photoreceptors due to self-interference were detected, which indicated a change in the optical path length of the outer segment. Furthermore, adaptive optics FD-OCT was able to detect phase changes over longer time periods by tracking single cones, resulting in a precision of about (12). To our knowledge, no study thus far concentrated on the direct observation of phase signals with FD-OCT to observe fast intrinsic optical signals: to achieve sufficient motion stability for a detection of small phase changes in vivo, the requirements in imaging speed are enormous. Fully parallelized OCT techniques, such as holoscopy (13) and full-field swept-source OCT (FF-SS-OCT) (14, 15), can acquire data significantly faster. Recently, FF-SS-OCT thereby detected heartbeat-induced pressure waves within retinal vessels (16) and imaged single photoreceptors by using computational aberration correction (17–19).
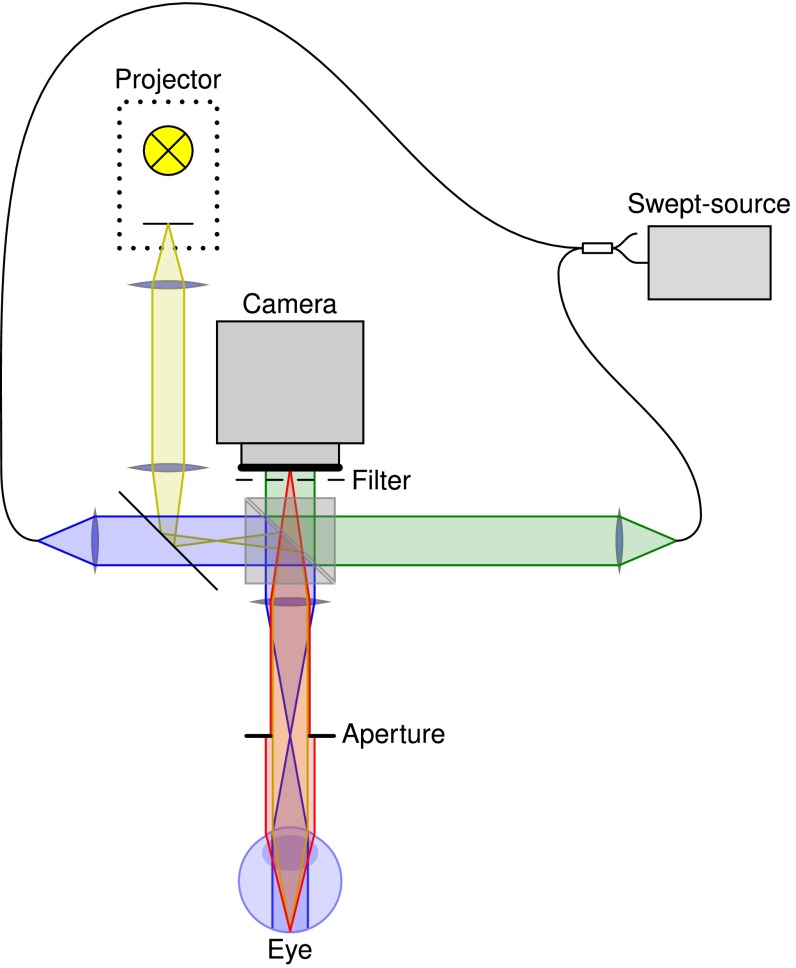
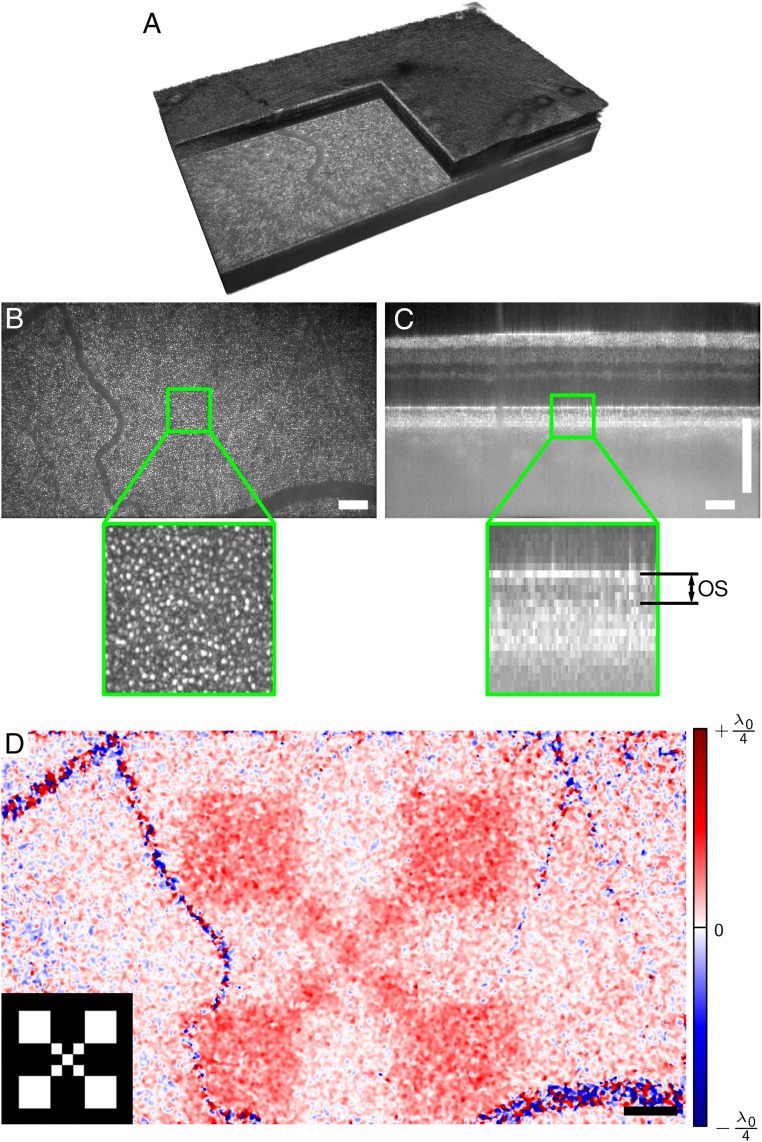
Here, we measured changes of the optical path length within the photoreceptor outer segment after projecting a white light pattern with a total radiant flux of 10 μW for 50 ms onto the retina of a healthy young adult. For this, we imaged the retina before, during, and after the stimulus using a FF-SS-OCT system (Fig. 1). We then reconstructed the acquired volumes, corrected them for motion, segmented the inner segment/outer segment (IS/OS) layer, and flattened it. Fig. 2A shows a resulting imaged volume from the periphery at about 11°. After correcting the data numerically for ocular aberrations, cone photoreceptors in the en face images (Fig. 2B) became clearly visible. When evaluating phase difference changes between the photoreceptor IS/OS junction and the outer segment tips [see sectional view (B-scan) in Fig. 2C], we observed an increase of about 50 nm in the optical path length within the outer segment: 297 ms after switching on the stimulus (Fig. 2D). The signal is clearly related to the stimulus as spatial correspondence to the projected pattern was obvious (Lower Left Inset of Fig. 2D).
Fig. 1.
Setup used to observe intrinsic optical signals. Light from a tunable laser source is split into two beams for reference irradiation (green) and illumination of the retina (blue). Backscattered light (red) is imaged onto a fast CMOS camera, where it is superimposed with the reference light. A projector with an LED source is used to stimulate the retina (yellow).
Fig. 2.
Retinal imaging and response to an optical stimulus. (A) Volume of retina acquired by full-field swept-source OCT. (B) En face plane showing the backscattered intensity from the outer segment. Cone photoreceptors are clearly visible. (C) Cross-sectional view (B-scan) from the center of the recorded volume. Changes of the optical path length within the outer segment (OS) were evaluated in this study. (D) Spatially resolved change of the optical path length , 247 ms after switching off the stimulus pattern, which is shown in Lower Left Inset. Response is high in the stimulated region and random in blood vessels. Noise was reduced by a lateral Gaussian filter. The center wavelength of the OCT setup was 841 nm. (Scale bars, 200 μm.)
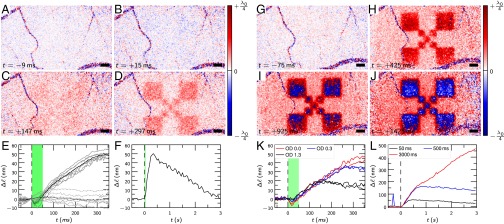
We derived the time course of the signals from a series of 70 consecutive volumes acquired at a rate of 167 Hz to provide a temporal resolution of 6 ms and another series acquired at 20 volumes/s for a measurement duration of more than 3 s. In both cases, the 50-ms stimulus started at the beginning of the 10th volume. After averaging over the stimulated area (Fig. 3 E and F), we observed the optical path length of the outer segments to decrease by 5 nm during the first 15 ms of the stimulus. However, the signal was weak and required averaging of seven measurements to be clearly visible. After these 15 ms, the optical path length started to increase for several hundred milliseconds, even significantly beyond the end of the stimulus (Fig. 3E). After about 300 ms, the signal reached its maximum of 40 nm, and then dropped for 2.5 s with almost constant rate back to the ground level (Fig. 3F). Fig. 3 A–D shows images from this time series. Amplitude and time course of the signal depended on stimulus intensity, as was shown via attenuation of the light pulse by a factor of 0.5 (OD 0.3) and 0.05 (OD 1.3) (Fig. 3K). However, the optical path length of the outer segment rose with a rate independent of the illumination strength. We also ensured that these signals are specific to the outer segment: the optical path length changes of two arbitrary depths within the nerve fiber bundles were evaluated and are also shown in Fig. 3E. Due to uncorrected motion artifacts, signals there vary stronger than at the OS but show no strong correspondence to the stimulus.
Fig. 3.
Time course of the optical path length changes for different stimuli. (A–D) Response to a 50-ms stimulus; a small negative response after about 17 ms (B) converts to a strong positive stimulation (C and D). (E and F) Time course, averaged over the stimulated area. The black line (E) is the average of seven individual measurements (gray lines). Dashed lines (E) are a control evaluation showing between two different layers in the nerve fiber bundle. (G–J) Response to a permanent stimulus. An increasing response is observed, finally leading to phase wrapping. (K) Response to different flash intensities attenuated by OD 0.3 and OD 1.3, respectively. (L) Response for 50-, 500-, and 3,000-ms stimuli with 10 μW. The strong signal at about in the blue curve is caused by rapid eye movement that could not be corrected for. Dashed black lines, start of the stimulus at (E, F, K, and L); green areas (E, F, and K), duration of the stimuli. The center wavelength of the OCT was 841 nm. (Scale bars, 200 μm.)
Finally, we enlarged the response by using longer stimuli (Fig. 3 G–J and L). With a permanent stimulus, the increase of the optical path length of the outer segment was more than 400 nm after 3 s. Here, the optical path length increased even by more than a quarter of the detection wavelength, , and phase differences exceeded π, resulting in phase wrapping from to . This phase wrapping yielded the visible abrupt change from to in Fig. 3 I and J. Additionally, in Fig. 3 H–J, an increased signal background is visible, which is likely caused by limited stimulus contrast.
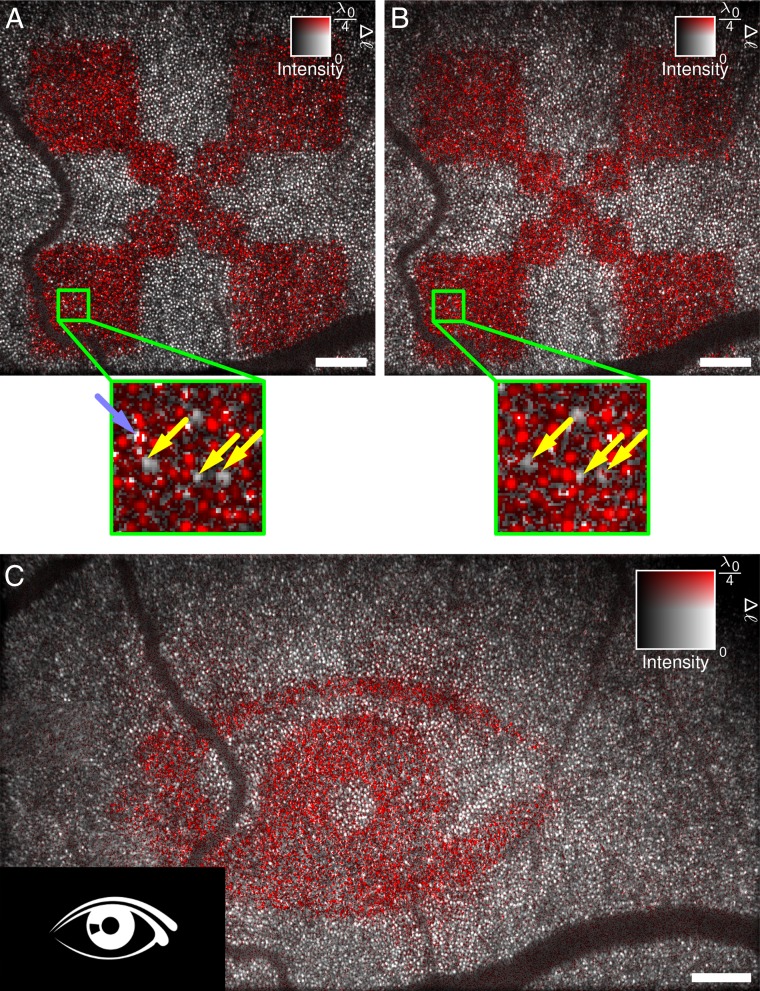
Using these strong responses, we were able to assign the signals at the end of the series to single cone photoreceptors; however, a temporal filter needed to be applied, and the phase data had to be unwrapped to improve signals first. Fig. 4 maps the response on the averaged en face intensity image. It is evident that, although most cones reacted to the stimulus, some exhibited only a small or no response. Imaging was sufficiently reproducible to study individual cones over time, and a dataset measured 10 min later showed the same cones not responding (yellow arrows in Fig. 4 A and B). This missing signal in these cones might be a failure to detect the phases with sufficient signal-to-noise ratio in either layer: the IS/OS junction or the outer segment tips. On the other hand, it might indicate that some cones actually do not react sufficiently for detection. One can also see that in some locations the phase changed abruptly within a single cone (light blue arrow in Fig. 4A), which might indicate insufficient resolution to resolve all contributing structures. In the presented field of view, we were only able to see the cones; although unresolvable, smaller rods might have contributed to the observed phases as well. However, the abrupt changes might also be explained by measurement shortcomings or fluctuations in the resolved and detected structures between the two respective layers or between different volumes. Finally, the technique outlined here can also be used to study which cones react to an arbitrary, more complex image seen by the test person (Fig. 4C).
Fig. 4.
After numerical aberration correction, optical path length changes can be assigned to single cones. (A and B) Independent responses to 3-s light stimulus were measured about 10 min apart. Due to the high lateral resolution, individual photoreceptors can be identified. Here, the same cones did not respond to the stimulus (yellow arrows). Some locations show abrupt phase changes within a single cone (light blue arrow). (C) More complicated stimulation patterns can be identified and show which photoreceptors contribute to an image seen by the test person. The pattern of activated photoreceptors is mirrored compared with the stimulus pattern. The center wavelength of the OCT setup was 841 nm. Intensity data in these images were averaged over IS/OS junction and OS tips. (Scale bars, 200 μm.)
The origin of the observed signal is still unclear. Because the optical path length is the product of the refractive index and the geometric length, we cannot differentiate between chemical and structural changes. However, the time course of the signals gives some hints about the signal source. Bleaching of rhodopsin and activation of metarhodopsin II happens in the order of a few milliseconds (1), and the initial decrease of might therefore be related to the direct photoactivation. In ex vivo experiments with bovine rod outer segments, rapid disk shrinkage after light exposure was in fact previously reported (20). The following increase of the optical path length within the outer segment lasts significantly longer than the stimulus, which indicates the signal follows activation of metarhodopsin II and therefore might be related to its deactivation, follows the activation of transducin, or is related to other secondary processes.
However, the increase rate of most photoproducts such as transducin or phosphodiesterase after a stimulus is proportional to the actual stimulation strength, as suggested by kinetic evaluations (21). The observed increase rate of , on the other hand, is constant and independent of stimulus strength even for very weak stimuli (Fig. 3K). Consequently, the observed increase of cannot be directly related to these photoproducts. It should also be pointed out that the overall process does not appear to be saturated, as the signal maximum increases with stimulus strength. In combination with the constant increase rate, this might indicate a rate-limited or saturated process somewhere in the signaling cascade. Alternatively, the cumulative effect of the initial decrease and following increase in could also result in the observed constant rates; however, we believe this is unlikely.
Nevertheless, the observed signals appear to be a physiologic response. Nonphysiologic effects, such as thermal expansion, would cause a direct decrease once the stimulus stops (22) and can therefore be ruled out. Also, we expect hemodynamic changes to last longer than a few 100 ms and not be as highly localized as observed here. Additionally, hemodyamic changes should be especially visible in the vicinity of larger blood vessels, which we did not notice here.
The key to our observations was certainly the analysis of the optical path length changes in the outer segments, which was facilitated by the enormous measurement speed and related phase stability of FF-SS-OCT. Although the overall setup is quite simple, components are rather expensive, and costs are currently dominated by the required high-speed camera, which is about $100,000.
Overall, the setup and data evaluation can certainly be improved further. In particular, we expect further enhancements in the registration and segmentation of the data to improve the overall signal quality. Additionally, the OCT system used in our experiments had a comparably low axial resolution, which was limited by the availability of suitable lasers; higher axial resolution would result in better separation of retinal layers, which might not only reveal a more precise physical origin of the signal but would likely also enhance signal quality.
All results presented here were highly reproducible; measurements within a few hours gave almost identical time courses. Only longer breaks resulted in slightly different overall amplitudes but showed qualitatively similar behavior. There appears to be no reason why fast scanning OCT systems cannot obtain comparable results, assuming that sufficient phase stability is established. Adaptive optics OCT has already been shown to track phase changes of single cones; however, the technique was thus far only used to observe structural changes over time (12).
The method described in this paper resolved small changes within the optical path length of the outer segment. When coherently imaging light backscattered from the retina, these path length changes might cause fluctuations in image intensity as the light interferes. In fact, Jonnal et al. observed an alternating reflection signal from individual cones and suggested that this might be caused by a change in the optical path length within the outer segment (4). Depending on resolution and imaging method, these intensity changes might appear random, and in fact, previous studies reported variations in sign and magnitude of observed backscattering intensity signals after stimulating the retina (3, 6, 8).
Currently, we do not know the source of the observed signal, and further research is required to identify the origin or show its pathology-related value in clinical trials. Nevertheless, detecting the activity of single cones could be an important tool in early diagnosis of many diseases that are known to be associated with loss of photoreceptor function, e.g., age-related macular degeneration (23) and retinitis pigmentosa (24).
Materials and Methods
Setup.
The setup consisted of a FF-SS-OCT system with an LCD-based projection system to stimulate the retina (Fig. 1). A cold mirror (Edmund Optics TECHSPEC Cold Mirror, 45° AOI, 50.0 mm Square) coupled the projection light (yellow in Fig. 1) into the sample illumination arm of the OCT system (blue in Fig. 1), and an infrared long-pass filter (Edmund Optics Optical Cast Plastic IR Longpass Filter, 4” × 5”) in front of the camera ensured that no stimulation light disturbed the OCT system.
The FF-SS-OCT system used a tunable light source (Superlum Broadsweeper BS-840-1), which was connected via a fiber coupler (AC Photonics WP85100202B2211) to the reference and to the sample arm of the interferometer. The reference arm illuminated the camera (Photron FASTCAM SA-Z) with a parallel beam (green in Fig. 1) through a beam splitter (Edmund Optics TECHSPEC Non-Polarizing Cube Beamsplitter, 50 mm NIR), whereas the sample arm illuminated an area of about on the retina through a suitable lens system (blue in Fig. 1). The total radiant flux on the retina from the sample illumination was about . The light backscattered by the retina was imaged onto the camera (red in Fig. 1) where it was superimposed with the reference light. An iris controlled the aperture of the retinal imaging to ensure correct sampling of all lateral frequencies by the camera.
A single volume was acquired by obtaining multiple images while tuning the wavelength of the laser. In general, the laser was tuned from 867 to 816 nm, which results in an axial resolution (full width at half maximum) of 8.5 μm in air, when considering its rectangular spectral shape. During the wavelength scan, the camera acquired 380 or 512 images, pixels each, with 75,000 or 60,000 frames/s, respectively. Depending on the imaging requirements, acquisition speed thereby corresponded to A-scan rates of 46.5 or 27.6 MHz, and the maximum volume rates were 167 or 111 Hz, respectively.
The parameters used for each measurement were partly imposed by the camera available to us. Particularly, data had to be stored with eight-bit precision on an internal storage of about 8 GB. After the measurement, the data were transferred to a PC, where processing took place. With the image size used and the number of frames required for each volume, this ultimately restricts the number of volumes in one imaging sequence to about 70.
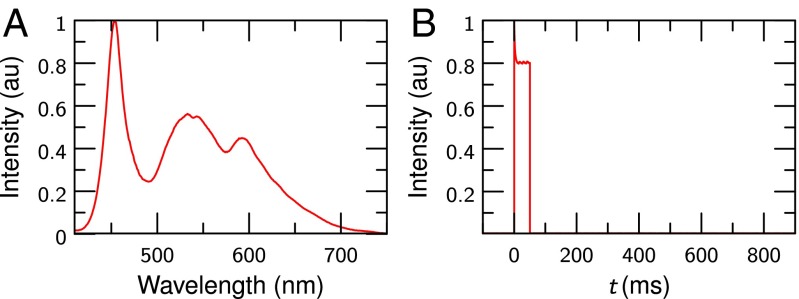
To project the stimulating image onto the retina, an LED LCD projector (Tera UNIC UC40) was modified with an external microprocessor board (Arduino UNO), which controlled the LED and synchronized the stimulus with the OCT system, i.e., it triggered the camera and the tunable laser source. The LCD was imaged via a set of lenses into the conjugate plane of the retina in the sample illumination arm. Spectrum and time course of the white light retina illumination were checked carefully and can be found in Fig. 5.
Fig. 5.
Characteristics of the flash used to stimulate the retina. (A) Spectrum of the flash. (B) Intensity of a 50-ms flash as a function of time, measured using a photodiode.
Additionally, a passive fixation target and a plastic mesh face mask were used for optimal imaging. Although the fixation target was illuminated with a green LED to make it visible for the volunteer, care was taken that no green light of the fixation target was visible in the area measured by OCT or illuminated by the projector. The mask was custom fit to the volunteer; it ensured a steady and repeatable position of his head and made imaged areas highly reproducible.
Measurement.
The area that can be read out is limited by the lateral resolution and by the required camera frame rate. To make matters worse, blood vessels shadow the outer segment. Therefore, we chose a part of the retina with few blood vessels, but where cones could still be resolved after aberration correction. Before the first measurement, the volunteer’s pupil was medically dilated, and the volunteer was kept in the dark for about 20 min, which ensured reproducible starting conditions for all measurements, although measurements with normal light adaption gave comparable results. Additionally, sufficient time of at least 5 min between successive measurements ensured that results were not influenced by previous stimulations.
All investigations were done with healthy volunteers; written informed consent was obtained from all subjects. Compliance with the maximum permissible exposure (MPE) of the retina and all relevant safety rules was confirmed by the responsible safety officer. The study was approved by the ethics board of the University of Lübeck (ethics approval Ethik-Kommission Lübeck 16-080).
Preprocessing.
After transferring the raw images from the camera and before evaluating the actual phases, the acquired data were preprocessed: first, the volumetric OCT data for each volume within a time series was reconstructed. To reduce fixed stationary artifacts within the image, the average of all datasets was computed and then subtracted from all volumes within the dataset, which effectively removed fixed pattern noise as only the retina changed due to eye motion between volumes. Afterward, a Fourier transform along the time axis for each pixel of the camera reconstructed the depth information, i.e., intensity and phase of the volume. Lateral frequency filtering removed noise from outside the aperture and slightly improved signal-to-noise ratio.
Second, the images were corrected for dispersion mismatch in reference and sample arm, as well as intra- and intervolume motion. For this, an optimization algorithm (19, 25) removed the influence of dispersion and axial motion to obtain sharp OCT volumes. All volumes within a series were then shifted in all three dimensions to maximize their correlation and remove inter volume displacements.
In the next step, the IS/OS junction of the reconstructed series was segmented independently for each volume. We shifted all A-scans within each volume axially by using the Fourier shift theorem such that the IS/OS was in a single depth. This shifting ensured reproducible starting conditions for the following step and the eventual phase evaluation.
Finally, the volume was corrected for ocular aberrations in the segmented layer. The aberration correction of the IS/OS layer was performed by an optimization procedure (17, 19). The algorithm varied Zernike polynomials, which parameterized the aberrations, until an image quality metric (Shannon’s entropy) (26) was optimal. After this, single cone photoreceptors were resolvable (18, 19). As aberrations varied laterally, the image field was separated into different areas, which were corrected independently and later stitched back together. Although this step improved resolution to resolve individual cones, it would not have been required to actually observe the changes in the optical path length within the outer segment.
Calculation of the Optical Path Length Changes from the Measured Phases.
The detected phases in FD-OCT do not carry information on absolute position and to obtain changes they need to be referenced to phases in other layers and at other times. To cancel this arbitrary phase offset in each pixel, the reconstructed volumes were first referenced to the last complete volume before the stimulus started
where x, y, and z denote the spatial indices of the volume, and t is the volume number, corresponding to the recording time. The signal was then averaged over the three layers next to the boundaries of the outer segment by computing the mean of the complex numbers, i.e., the mean was computed for the boundaries of the outer segment, located at and four pixels deeper (corresponding to about 28 μm in air and 20 μm in tissue) at (Fig. 2A). Finally, the phase difference between both boundaries of the outer segment was obtained by
The signal quality was improved by applying a lateral Gaussian filter to the complex data (; Figs. 2 and 3) or a temporal moving average filter over 15 volumes (Fig. 4).
For strong signals, where the phase signal exceeded π (Fig. 4), the phases were unwrapped temporally (Figs. 3L and 4). Phases were finally converted into optical path length changes using
where is the central wavelength of the OCT system, i.e., , and is the phase change.
Acknowledgments
We thank Reginald Birngruber and Alfred Vogel for valuable discussions of the results; Hans-Jürgen Rode, Jörn Wollenzin, and Christian Winter for help with the electronics setup; and Fred Reinholz for proofreading the manuscript. This work was sponsored by the German Federal Ministry of Education and Research (Innovative Imaging & Intervention in early AMD, Contracts 98729873C and 98729873E).
Footnotes
Conflict of interest statement: D.H. is an employee of Thorlabs GmbH, which produces and sells OCT systems. D.H. and G.H. are listed as inventors on a related patent application (application no. PCT/EP2012/001639). All other authors declare no competing financial interests.
This article is a PNAS Direct Submission. A.R. is a Guest Editor invited by the Editorial Board.
See Commentary on page 12902.
References
- 1.Liebman PA, Jagger WS, Kaplan MW, Bargoot FG. Membrane structure changes in rod outer segment associated with rhodopsin bleaching. Nature. 1974;251(5470):31–36. doi: 10.1038/251031a0. [DOI] [PubMed] [Google Scholar]
- 2.Harary H, Brown J, Pinto L. Rapid light-induced changes in near infrared transmission of rods in bufo marinus. Science. 1978;202(4372):1083–1085. doi: 10.1126/science.102035. [DOI] [PubMed] [Google Scholar]
- 3.Yao X, Wang B. Intrinsic optical signal imaging of retinal physiology: A review. J Biomed Opt. 2015;20(9):090901. doi: 10.1117/1.JBO.20.9.090901. [DOI] [PMC free article] [PubMed] [Google Scholar]
- 4.Jonnal RS, et al. In vivo functional imaging of human cone photoreceptors. Opt Express. 2007;15(24):16141–16160. [PMC free article] [PubMed] [Google Scholar]
- 5.Grieve K, Roorda A. Intrinsic signals from human cone photoreceptors. Invest Ophthalmol Vis Sci. 2008;49(2):713–719. doi: 10.1167/iovs.07-0837. [DOI] [PubMed] [Google Scholar]
- 6.Srinivasan VJ, Chen Y, Duker JS, Fujimoto JG. In vivo functional imaging of intrinsic scattering changes in the human retina with high-speed ultrahigh resolution OCT. Opt Express. 2009;17(5):3861–3877. doi: 10.1364/oe.17.003861. [DOI] [PMC free article] [PubMed] [Google Scholar]
- 7.Schmoll T, Kolbitsch C, Leitgeb RA. In vivo functional retinal optical coherence tomography. J Biomed Opt. 2010;15(4):041513-1–041513-8. doi: 10.1117/1.3463008. [DOI] [PubMed] [Google Scholar]
- 8.Teussink MM, et al. Impact of motion-associated noise on intrinsic optical signal imaging in humans with optical coherence tomography. Biomed Opt Express. 2015;6(5):1632–1647. doi: 10.1364/BOE.6.001632. [DOI] [PMC free article] [PubMed] [Google Scholar]
- 9.Huang D, et al. Optical coherence tomography. Science. 1991;254(5035):1178–1181. doi: 10.1126/science.1957169. [DOI] [PMC free article] [PubMed] [Google Scholar]
- 10.Bizheva K, et al. Optophysiology: Depth-resolved probing of retinal physiology with functional ultrahigh-resolution optical coherence tomography. Proc Natl Acad Sci USA. 2006;103(13):5066–5071. doi: 10.1073/pnas.0506997103. [DOI] [PMC free article] [PubMed] [Google Scholar]
- 11.Srinivasan VJ, Wojtkowski M, Fujimoto JG, Duker JS. In vivo measurement of retinal physiology with high-speed ultrahigh-resolution optical coherence tomography. Opt Lett. 2006;31(15):2308–2310. doi: 10.1364/ol.31.002308. [DOI] [PubMed] [Google Scholar]
- 12.Jonnal RS, Kocaoglu OP, Wang Q, Lee S, Miller DT. Phase-sensitive imaging of the outer retina using optical coherence tomography and adaptive optics. Biomed Opt Express. 2012;3(1):104–124. doi: 10.1364/BOE.3.000104. [DOI] [PMC free article] [PubMed] [Google Scholar]
- 13.Hillmann D, Lührs C, Bonin T, Koch P, Hüttmann G. Holoscopy – holographic optical coherence tomography. Opt Lett. 2011;36(13):2390–2392. doi: 10.1364/OL.36.002390. [DOI] [PubMed] [Google Scholar]
- 14.Považay B, et al. Full-field time-encoded frequency-domain optical coherence tomography. Opt Express. 2006;14(17):7661–7669. doi: 10.1364/oe.14.007661. [DOI] [PubMed] [Google Scholar]
- 15.Bonin T, Franke G, Hagen-Eggert M, Koch P, Hüttmann G. In vivo Fourier-domain full-field OCT of the human retina with 1.5 million A-lines/s. Opt Lett. 2010;35(20):3432–3434. doi: 10.1364/OL.35.003432. [DOI] [PubMed] [Google Scholar]
- 16.Spahr H, et al. Imaging pulse wave propagation in human retinal vessels using full-field swept-source optical coherence tomography. Opt Lett. 2015;40(20):4771–4774. doi: 10.1364/OL.40.004771. [DOI] [PubMed] [Google Scholar]
- 17.Adie SG, Graf BW, Ahmad A, Carney PS, Boppart SA. Computational adaptive optics for broadband optical interferometric tomography of biological tissue. Proc Natl Acad Sci USA. 2012;109(19):7175–7180. doi: 10.1073/pnas.1121193109. [DOI] [PMC free article] [PubMed] [Google Scholar]
- 18.Shemonski ND, et al. Computational high-resolution optical imaging of the living human retina. Nat Photonics. 2015;9(7):440–443. doi: 10.1038/NPHOTON.2015.102. [DOI] [PMC free article] [PubMed] [Google Scholar]
- 19.Hillmann D, et al. 2016. Aberration-free volumetric high-speed imaging of in vivo retina. arXiv:1605.03747.
- 20.Uhl R, Hofmann KP, Kreutz W. Measurement of fast light-induced disc shrinkage within bovine rod outer segments by means of a light-scattering transient. Biochim Biophys Acta. 1977;469(2):113–122. doi: 10.1016/0005-2736(77)90174-2. [DOI] [PubMed] [Google Scholar]
- 21.Lamb TD. Gain and kinetics of activation in the G-protein cascade of phototransduction. Proc Natl Acad Sci USA. 1996;93(2):566–570. doi: 10.1073/pnas.93.2.566. [DOI] [PMC free article] [PubMed] [Google Scholar]
- 22.Müller HH, et al. Imaging thermal expansion and retinal tissue changes during photocoagulation by high speed OCT. Biomed Opt Express. 2012;3(5):1025–1046. doi: 10.1364/BOE.3.001025. [DOI] [PMC free article] [PubMed] [Google Scholar]
- 23.Curcio CA, Medeiros NE, Millican CL. Photoreceptor loss in age-related macular degeneration. Invest Ophthalmol Vis Sci. 1996;37(7):1236–1249. [PubMed] [Google Scholar]
- 24.Nagy D, Schönfisch B, Zrenner E, Jägle H. Long-term follow-up of retinitis pigmentosa patients with multifocal electroretinography. Invest Ophthalmol Vis Sci. 2008;49(10):4664–4671. doi: 10.1167/iovs.07-1360. [DOI] [PubMed] [Google Scholar]
- 25.Wojtkowski M, et al. Ultrahigh-resolution, high-speed, Fourier domain optical coherence tomography and methods for dispersion compensation. Opt Express. 2004;12(11):2404–2422. doi: 10.1364/opex.12.002404. [DOI] [PubMed] [Google Scholar]
- 26.Fienup JR. Synthetic-aperture radar autofocus by maximizing sharpness. Opt Lett. 2000;25(4):221–223. doi: 10.1364/ol.25.000221. [DOI] [PubMed] [Google Scholar]


