Significance
Non-Hodgkin lymphomas are associated with HIV infection. Current hypotheses on lymphomagenesis, based on immunosuppression and/or activation and/or inflammation, are generic and do not provide mechanistic, testable models. Here we show that several HIV proteins are expressed in a HIV transgenic mouse model of lymphoma, but only Matrix/p17 is consistently expressed at high levels even in early disease stages. Microarray analyses of gene expression showed an enrichment of recombination-activating genes (Rag1/2) in mouse lymphoma tissue. When activated human B cells were treated with p17, induction of RAG1 expression was observed in three of seven donors. Taken together, and in the context of the literature, our results point to the involvement of p17 in supporting B-cell growth and genetic instability.
Keywords: HIV-1, transgenic mice, B-cell lymphoma, RAG, matrix protein p17
Abstract
HIV-1 infection is associated with increased risk for B-cell lymphomas. How HIV infection promotes the development of lymphoma is unclear, but it may involve chronic B-cell activation, inflammation, and/or impaired immunity, possibly leading to a loss of control of oncogenic viruses and reduced tumor immunosurveillance. We hypothesized that HIV structural proteins may contribute to lymphomagenesis directly, because they can persist long term in lymph nodes in the absence of viral replication. The HIV-1 transgenic mouse Tg26 carries a noninfectious HIV-1 provirus lacking part of the gag-pol region, thus constituting a model for studying the effects of viral products in pathogenesis. Approximately 15% of Tg26 mice spontaneously develop leukemia/lymphoma. We investigated which viral proteins are associated with the development of leukemia/lymphoma in the Tg26 mouse model, and performed microarray analysis on RNA from spleen and lymph nodes to identify potential mechanisms of lymphomagenesis. Of the viral proteins examined, only expression of HIV-1 matrix protein p17 was associated with leukemia/lymphoma development and was highly expressed in bone marrow before disease. The tumor cells resembled pro-B cells, and were CD19+IgM−IgD−CD93+CD43+CD21−CD23−VpreB+CXCR4+. Consistent with the pro-B-cell stage of B-cell development, microarray analysis revealed enrichment of transcripts, including Rag1, Rag2, CD93, Vpreb1, Vpreb3, and Igll1. We confirmed RAG1 expression in Tg26 tumors, and hypothesized that HIV-1 matrix protein p17 may directly induce RAG1 in B cells. Stimulation of human activated B cells with p17 enhanced RAG1 expression in three of seven donors, suggesting that intracellular signaling by p17 may lead to genomic instability and transformation.
HIV infection increases the risk for many types of cancer, including lymphoma. The introduction of combination antiretroviral therapy (cART) has drastically reduced the risk of non-Hodgkin lymphoma (NHL) and other AIDS-defining cancers; however, the risk of NHL in individuals with HIV remains ninefold higher than that in the general population (1). The mechanisms responsible for this increased risk have not been fully elucidated, but are thought to involve HIV-1–mediated impaired cellular immunity, loss of control over oncogenic viruses, and chronic B-cell activation. The major subtypes of HIV-associated lymphoma include diffuse large B-cell lymphoma (DLBCL) and Burkitt lymphoma (BL), characterized by c-myc activation (2, 3).
As the immune status of cART-treated HIV patients has improved over the last 20 y, the spectrum of HIV-associated lymphomas has changed (4). There has been a shift from lymphomas associated with severe immunodeficiency and human herpesvirus (HHV)-4/EBV and HHV-8/Kaposi's sarcoma-associated herpesvirus (e.g., primary central nervous system lymphoma, primary effusion lymphoma, immunoblastic DLBCL) (3, 5, 6) to those associated with mild immunodeficiency (e.g., centroblastic DLBCL, BL, Hodgkin lymphoma), in which the frequency of EBV infection is lower. Whereas 30–40% of HIV-associated lymphomas are positive for EBV, the majority of cases develop independent of EBV and thus are dependent on other factors (7–9). The proportion of BL cases has doubled since the initiation of cART (5, 10). In contrast to endemic BL, where EBV is found in almost all cases, <40% of cases of HIV BL are associated with EBV (11). Given that HIV-BL patients have higher CD4 counts at diagnosis compared with HIV-NHL patients without BL (10), the pathogenesis of HIV-related BL likely may involve mechanisms other than immunodeficiency and loss of control of oncogenic viruses.
From this perspective, an intriguing possibility is that HIV itself may contribute to lymphomagenesis more directly through biological effects of HIV proteins (12, 13). HIV-1 matrix p17, capsid p24, and envelope glycoprotein (gp) 120 accumulate and persist in lymphoid tissues for at least 1 y after cART, in the absence of viral replication (14). The viral proteins are located in the light zone of the germinal center and are associated with follicular dendritic cells, where they may promote chronic B-cell stimulation. Chronic stimulation of B cells via antigen or cytokines may contribute to the elevated risk of lymphoma after HIV infection (15). One mechanism for this may involve activation-induced cytidine deaminase (AID), a DNA-modifying enzyme required for class switch recombination and somatic hypermutation in the germinal center (16). Furthermore, HIV-infected macrophages within lymph nodes may provide a chronic inflammatory stimulus for B-cell activation (17).
It was recently reported that extracellular matrix protein p17 and particular genetic variants signal to B cells to enhance growth and induce chemotaxis (12, 18, 19). Moreover, proviral sequences for variant p17s that display B-cell growth-promoting activity can be found in HIV-NHL tissues, suggesting a role for variant p17s in lymphoma pathogenesis (12). In addition to its effects on B cells, p17 can induce angiogenesis/lymphangiogenesis in vitro and in vivo (20–22). In addition, cumulative viremia during cART is known to be a strong predictor of HIV-NHL, especially for BL (23). Thus, these findings support the hypothesis that HIV proteins may directly contribute to lymphomagenesis.
In this study, we investigated the pathogenesis of leukemia/lymphoma that develops spontaneously in the immunocompetent HIV-1 transgenic mouse, Tg26 (24, 25). Tg26 carries a pNL4-3 HIV-1 provirus lacking part of the gag-pol region, rendering the virus noninfectious. Under control of the LTR, viral RNA is expressed in various mouse tissues, including skin, kidney, spleen, and lymph nodes. A proportion of the heterozygous mice develop cataracts, cutaneous papillomas, and renal disease (24, 26, 27). We recently reported that Tg26 mice without cutaneous papillomas did not develop lymphomas, but that 15% of Tg26 mice with cutaneous papillomas spontaneously developed leukemia/lymphoma by 1 y of age, characterized by widespread lymphadenopathy, splenomegaly, and extranodal involvement of the liver, gastrointestinal tract, and central nervous system (25). The transformed cell population was CD19+preBCR+CD127+CD43+CD93+, consistent with a precursor B cell. Interestingly, we detected viral proteins p17, gp120, and Nef in spleens of mice with lymphoma.
In the present study, we characterized viral protein expression in lymph nodes and bone marrow (BM) of Tg26 mice with and without lymphoma and examined the phenotype of lymphoma cells. Microarray analysis comparing Tg26 lymphomas with asymptomatic Tg26 lymphoid cells revealed an abundance of oncogenic pathways modulated in the mouse tumors. The overexpression of Rag1 and Rag2 in Tg26 lymphomas and the expression of p17 in the BM before disease onset led us to test whether HIV-1 matrix protein p17 can directly induce RAG1 protein in primary human B cells. The induction of RAG1 by p17 may be one mechanism that introduces genomic instability in activated B cells and predisposes to lymphoma in HIV-infected patients.
Results
Expression of Matrix Protein p17 Is Associated with Leukemia/Lymphoma in HIV Tg26 Mice.
Tg26 mice were categorized into three disease phenotypes: asymptomatic, defined by a lack of cutaneous papillomas; early lymphoma, defined by splenomegaly with one enlarged lymph node; and lymphoma, characterized by general lymphadenopathy and circulating lymphoblasts. Previous work has characterized the splenic expression of three viral proteins known to interact with B cells—p17, gp120, and Nef—according to disease status (18, 25, 28–30). The expression of p17 and gp120, but not of Nef, in the spleen of Tg26 mice at both early and late stages of lymphoma suggests a role for these proteins in lymphomagenesis (25).
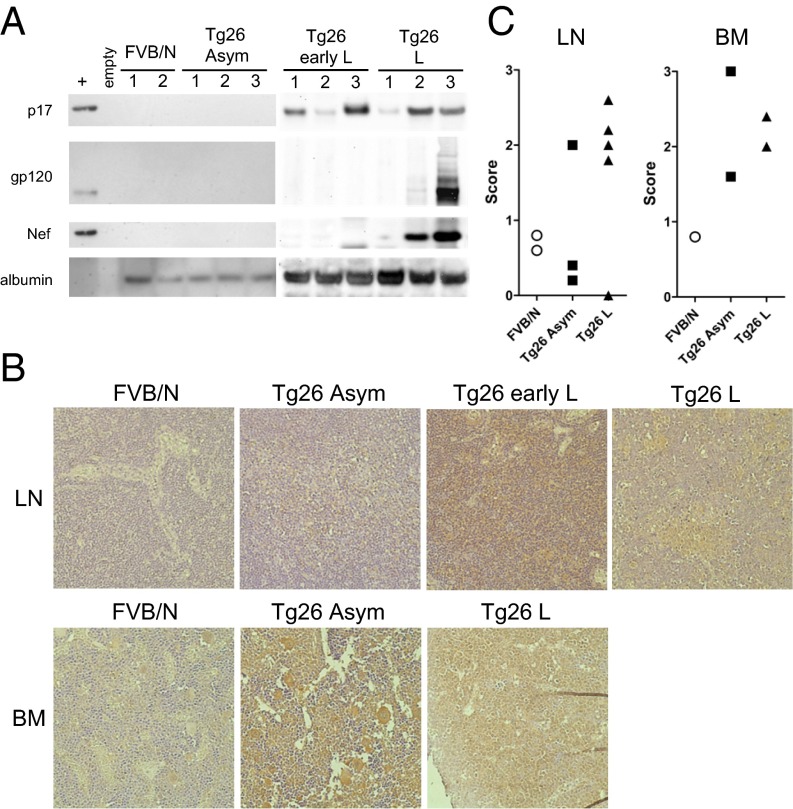
To characterize HIV protein expression in more detail, we extended the analysis to lymph nodes from Tg26 mice. Viral proteins p17, Nef, and gp120 were not detected in lymph node extracts from asymptomatic Tg26 mice (Fig. 1A). At both early and late disease stages, p17 was expressed in lymph nodes of all animals tested by Western blot analysis. In contrast, gp120 and Nef were present in only some mice with lymphoma, and in none of those with early lymphoma. Therefore, we focused further studies on p17. Immunohistochemistry (IHC) of lymph nodes also showed an association of p17 expression with lymphoma (Fig. 1B, Top). Staining of p17 was most intense in lymph nodes at the early lymphoma stage, and persisted in lymphoma tissue in three of four mice. The scoring of sections, based on the coverage area of the brown DAB stain for p17, is summarized in Fig. 1C. Expression of p17 was evident in four of five mice with lymphoma. In contrast, expression of p17 was found in one of three asymptomatic mice above background staining in FVB/N control mice. These data suggest that p17 in the periphery is not sufficient for lymphoma development, but is associated with disease. The diffuse pattern of p17 expression suggests that the protein is present in the extracellular environment. Lymphoma tissue was characterized by a loss of tissue architecture and a “starry sky” appearance, representing tingible body macrophages.
Fig. 1.
Expression of HIV proteins in lymph nodes and BM of Tg26 mice. (A) Lymph nodes from each mouse were pooled, and cell lysates were probed by Western blot analysis for HIV proteins p17, gp120, Nef, or albumin as a loading control. (B) IHC for p17 in lymph nodes (Top) and BM (Bottom) of Tg26 mice. Positive staining is indicated by deposition of DAB (brown); tissues were counterstained with hematoxylin. As a negative control, FVB/N tissues displayed little background staining (Left). (Original magnification 400×.) (C) Scoring of p17 staining as described in Materials and Methods. Each symbol represents the mean score of one section per mouse.
We next examined the BM for histological changes and p17 expression by IHC (Fig. 1B, Bottom). BM from asymptomatic Tg26 displayed dilated vascular sinuses compared with FVB/N control, which may indicate increased exit of hematopoietic cells to the periphery. In mice with lymphoma, tumor cells were present in the BM of both animals where tissue was available. The lymphoma had spread to the CNS as well; both of these mice exhibited partial paralysis, as is typical in late disease stages. In terms of p17 expression, strong staining was observed in Tg26 mice at both the asymptomatic and lymphoma stages, but not in FVB/N controls. Thus, p17 has the potential to influence hematopoiesis. Interestingly, an early study found that the presence of p17 protein in BM of HIV-infected patients was significantly linked to concurrent lymphoma or certain coinfections (31). Expression of p17 in the BM of Tg26 mice may be important, but not sufficient for lymphoma development.
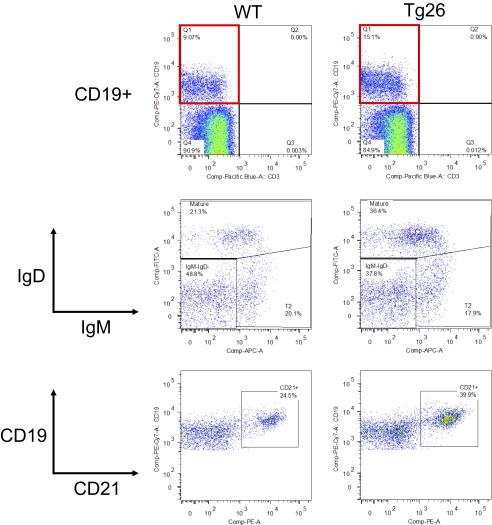
Concomitant with p17 expression in BM, we evaluated alterations in BM cell populations in asymptomatic Tg26 mice. Flow cytometry analysis of BM cells from asymptomatic Tg26 mice and WT mice revealed slight differences in the B-cell compartment (Fig. S1). Although the percentage of CD19+ cells in BM was similar in the two mouse strains, asymptomatic Tg26 BM displayed an increase in the proportion of mature B cells (IgM+IgD+), as well as in expression of CD21, another marker of mature B cells and a receptor for EBV in humans. Thus, it is possible that B-cell development is affected by the HIV transgene within the BM before detectable changes occur in the periphery (Fig. 2A).
Fig. S1.
Asymptomatic Tg26 mice exhibit alterations in the BM B-cell compartment. BM cells were collected from age- and sex-matched Tg26 mice and WT control mice and stained for surface markers. The frequency of CD19+ among total live cells was similar in the WT and Tg26 mice (Top). Among CD19+ cells, IgM+IgD+ (mature) and CD21+ cells were increased in Tg26 mice compared with WT mice. Data are representative of four pairs of mice examined. The increase in CD21+CD19+ cells in Tg26 BM was significant (P < 0.05, Mann–Whitney U test).
Fig. 2.
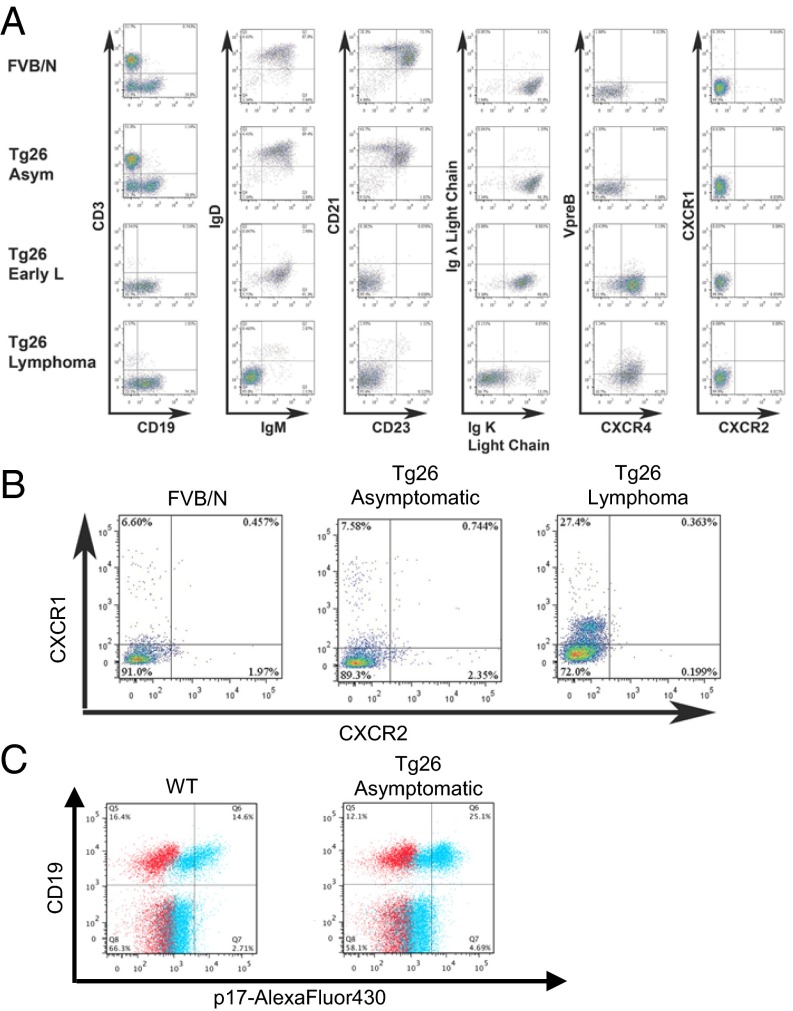
Characterization of peripheral B cells in Tg26 mice. (A) Spleen cells from the indicated mice were stained for surface markers and analyzed by flow cytometry. Plots are gated on B cells (CD3−CD19+) shown at left. Data are representative of three mice per group. (B) Mouse PBMCs were gated on B cells as in A and analyzed for CXCR1 and CXCR2 expression. (C) PBMCs from WT and Tg26 mice were analyzed for binding of p17-Alexa Fluor 430. Live PBMCs were gated on exclusion of Live/Dead dye and low SSC profile (not shown). Blue: stained with p17-Alexa Fluor 430; red: stained without p17-Alexa Fluor 430. A majority of CD19+ B cells bound labeled p17, whereas CD19− cells showed minimal binding.
Tumor Cells in the Periphery Resemble Pro-B Cells in BM.
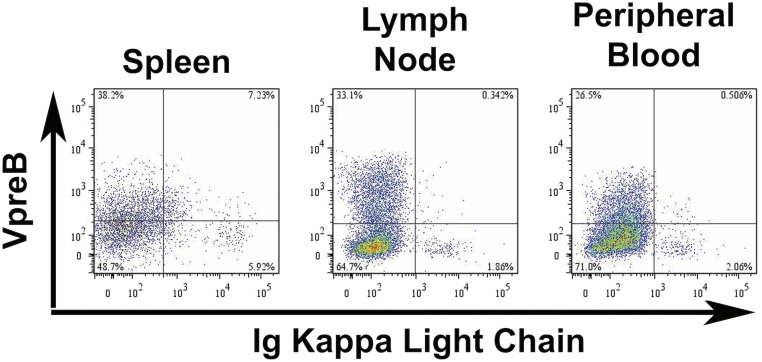
To determine the developmental stage of the transformed cells, we characterized CD19+ splenic B cells by flow cytometry (Fig. 2A). Splenocytes from asymptomatic Tg26 mice were comparable to those from control FVB/N mice, with similar B-cell/T-cell ratios and peripheral B-cell subsets, including follicular (IgMloIgDhiCD21loCD23+) and marginal zone (IgMhiIgDloCD21hiCD23−) B cells. At the early lymphoma stage, CD3+ cells were absent and CD19+ cells lacked expression of IgD, CD21, and CD23 but retained expression of κ light chain. Interestingly, these immature B cells also expressed high levels of CXCR4, a chemokine receptor that promotes the proliferation and development of B-cell precursors in the BM and is responsible for homing to the BM, among other functions (32). At the late stage of disease, splenic CD19+ cells lacked expression of IgM and κ light chain, whereas approximately one-half of the cells expressed VpreB/CD179a, part of the surrogate light chain and pre–B-cell receptor (BCR) complex. The expression of VpreB and loss of κ light chain was systemic, with similar patterns noted in CD19+ cells isolated from lymph nodes and from peripheral blood (Fig. S2). Thus, the tumor cells resemble pro-B cells, based on Hardy’s classification scheme (33).
Fig. S2.
Phenotype of Tg26 lymphoma cells. CD19+ cells from spleen, lymph node, and peripheral blood from a Tg26 mouse with lymphoma were evaluated for κ light chain and VpreB receptor expression.
Mouse B Cells Express Little CXCR1 or CXCR2.
Human IL-8 receptors, CXCR1/2, are putative receptors for HIV matrix protein p17 and are thought to be important for the proangiogenic activity observed in vitro with endothelial cells, as well as the chemotactic activity observed with human primary monocytes and B cells (19, 21). Although the expression of CXCR1/2 on human B cells is limited, up-regulation of the receptors on peripheral blood B cells from HIV-infected patients or by cytokines in vitro has been reported (34). Mice lack a homolog of human IL-8, the natural ligand of CXCR1/2, but they do express functional homologs of human CXCR1 and CXCR2 (35). Therefore, we tested whether murine CXCR1/2 were present on B cells at various disease stages in the Tg26 mice by flow cytometry (Fig. 2 A and B). Murine CXCR1/2 were not found on CD19+ cells from the spleen in any mouse tested; however, when peripheral blood mononuclear cells (PBMCs) were examined, CXCR1 was detected on ∼7% of CD19+ B cells in FVB/N controls and asymptomatic Tg26 mice (Fig. 2B). In Tg26 mice with lymphoma, 14–30% of lymphoma cells expressed low levels of CXCR1 in blood (n = 3; Fig. 2B).
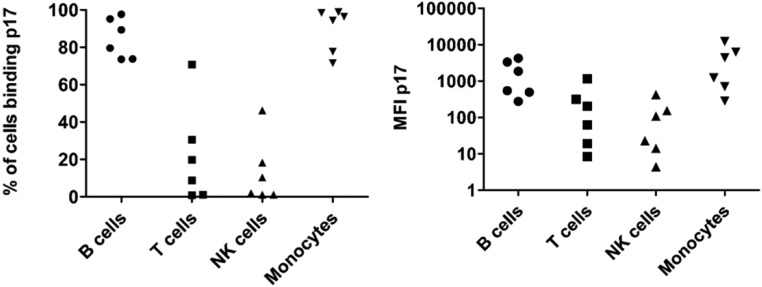
We next asked whether mouse B cells possess a receptor for the viral protein by staining PBMCs with a fluorescently labeled p17. We first confirmed that labeled p17 bound to subsets of human PBMCs, including the majority of B cells and monocytes in six of six donors as well as a proportion of natural killer (NK) and T cells in four of six donors (Fig. S3). This reagent showed low-level staining on mouse PBMCs in general; however, high-level staining was observed only on CD19+ cells, comprising 50–70% of total B cells in WT and asymptomatic Tg26 mice (Fig. 2C). Taken together, our findings show that extracellular p17 bound a majority of normal mouse B cells, but the low expression of mCXCR1 and mCXCR2 suggests one or more alternate receptors in mice.
Fig. S3.
Human PBMC subsets express receptors for p17. PBMCs were isolated from leukopaks from healthy donors (New York Blood Center) with Lymphoprep. After RBC lysis, cells were stained with p17-Alexa Fluor 430 and surface markers. Live cells were gated as follows: B cells, CD19+CD3−; T cells, CD19−CD3+; NK cells, CD56+CD3−; and monocytes, CD14+. The percent positive (Left) and median fluorescence intensity (MFI; Right) for p17 staining among each subset is plotted (n = 6). The majority of B cells and monocytes bound p17, as expected.
Microarray Analysis of Leukemia/Lymphomas in Tg26 Mice.
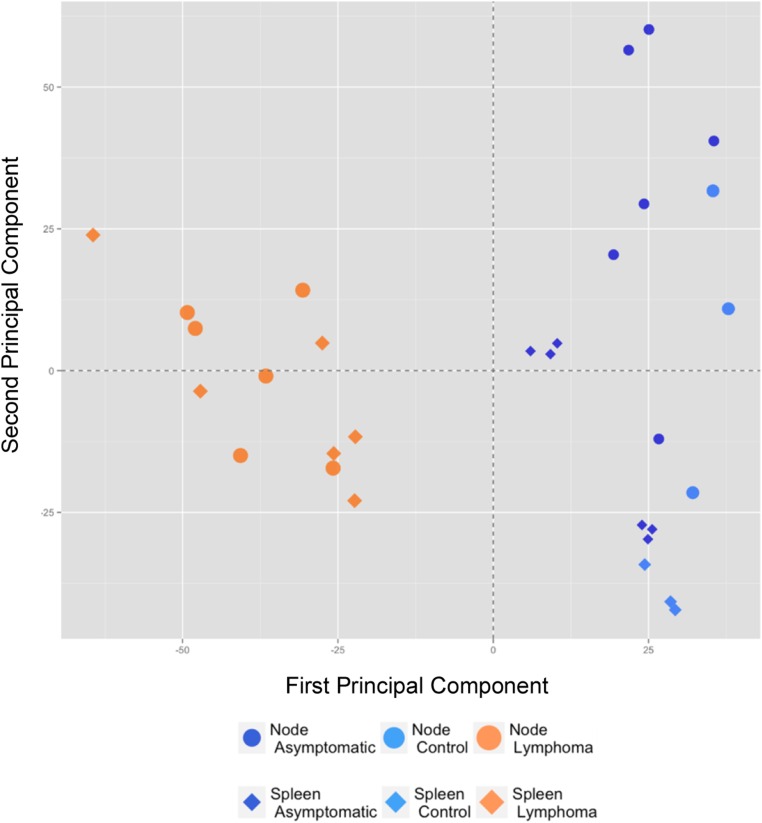
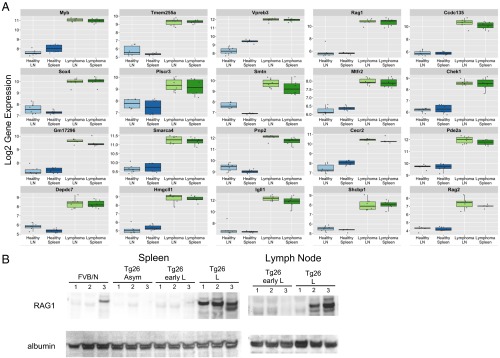
To identify candidate genes important in lymphomagenesis in HIV transgenic mice, we performed a microarray analysis on RNA from spleen and lymph nodes from three groups of animals: FVB/N control mice (n = 3), Tg26 asymptomatic mice (n = 6), and Tg26 mice with lymphoma (n = 6). Principal component analysis showed that lymphoma tissues from the six diseased animals were similar, whether from spleen or lymph nodes (Fig. S4). Differential gene expression analysis comparing Tg26 lymphoma and asymptomatic Tg26 yielded numerous significant results (Fig. 3A, Fig. S5, and Dataset S1).
Fig. S4.
Microarray analysis of Tg26 lymphomas. Principal component analysis shows that the lymphoma samples from spleen and lymph node of Tg26 mice (n = 6; orange symbols) are similar to one another, whereas tissue samples from asymptomatic Tg26 (n = 6; dark-blue symbols) and FVB/N controls (n = 3; light-blue symbols) cluster together to the right. The relationship between the analyzed animal groups used the top 10% most variant genes.
Fig. 3.
Up-regulation of Rag1 and other genes associated with early B-cell development in Tg26 lymphoma. (A) The first 20 most up-regulated genes in Tg26 lymphoma lymph nodes and spleen (green) vs. Tg26 asymptomatic lymph nodes and spleen (healthy; blue) are shown. Nine of the 20 most highly up-regulated genes in lymphoma are important at the early B-cell stage, including Rag1 and Rag2. There were more than 1,000 significant genes with an FDR <1% and an absolute log twofold change >1; however, all 20 genes reported had an FDR <1e-10. The top 5% most differentially expressed genes are listed in Dataset S1, and the first 20 most down-regulated genes are presented in Fig. S5. (B) RAG1 protein is highly expressed in lymphoma tissues. Cell lysates from spleen and lymph node from indicated mice were probed by Western blot analysis for RAG1 and albumin.
Fig. S5.
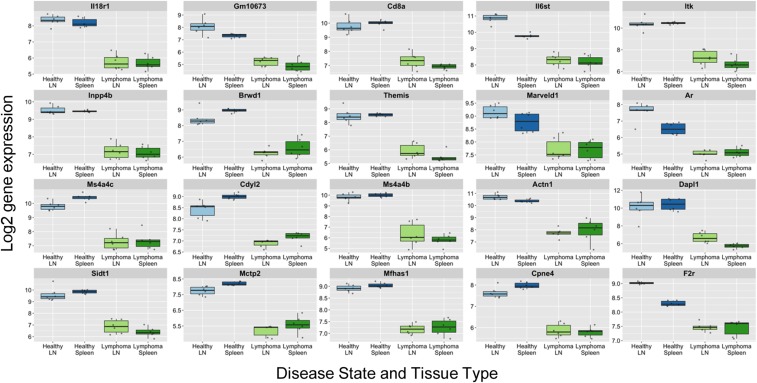
Down-regulated genes in lymphoma tissues. The first 20 most down-regulated genes in Tg26 lymphoma lymph nodes and spleen (green) vs. Tg26 asymptomatic lymph nodes and spleen (healthy, blue) are shown. There were more than 1,000 significant genes with an FDR <1% and an absolute log twofold-change >1; however, all 20 genes reported had an FDR <1e-10. The top 5% most differentially expressed genes are listed in Dataset S1.
Among the top 20 most highly up-regulated genes in lymphoma, 9 are known to be important in early stages of B-cell development: Igll1, Rag1, Myb, CD93, Vpreb3, Gpr97, Vpreb1, Rag2, and Erg. Gene set enrichment analysis (GSEA) revealed an up-regulation of hallmark gene sets related to the cell cycle and proliferation, including E2F targets, the G2M checkpoint, MYC targets, DNA repair, mTORC1 signaling, and the mitotic spindle (Table S1). Conversely, there was down-regulation of inflammatory response pathways, cytokine signaling, and apoptosis, among others. In addition, GSEA analysis of transcription factor targets showed significant down-regulation of NF-κB and GATA-1 signaling in lymphoma samples compared with asymptomatic Tg26 samples [false discovery rate (FDR) q values of <0.018 and <0.021, respectively]. Of 188 gene sets of oncogenic signatures derived from the Broad Institute’s Molecular Signature Database, collection C6 (36), 49 were significantly modulated (FDR q values <0.025). Of note, oncogenic signatures included loss of the retinoblastoma protein function as well as inhibition of mTOR signaling, commonly dysregulated in human cancers.
Table S1.
GSEA of hallmark pathways in Tg26 lymphomas
| Name | Size* | NES | FDR q |
| GSEA hallmark pathways: consistency with the most up-regulated genes | |||
| E2F | 172 | 3.3005993 | 0 |
| G2M CHECKPOINT | 176 | 3.2788227 | 0 |
| MYC TARGETS V1 | 175 | 3.0990205 | 0 |
| MYC TARGETS V2 | 48 | 2.3560371 | 0 |
| DNA REPAIR | 134 | 2.2059152 | 0 |
| MTORC1 SIGNALING | 178 | 2.1621082 | 0 |
| MITOTIC SPINDLE | 180 | 2.0368228 | 0 |
| UNFOLDED PROTEIN RESPONSE | 103 | 1.7171309 | 0.001916676 |
| SPERMATOGENESIS | 123 | 1.6502607 | 0.003589697 |
| GSEA Hallmark Pathways: consistency with the most down-regulated genes | |||
| ALLOGRAFT REJECTION | 172 | −2.4777253 | 0 |
| INFLAMMATORY RESPONSE | 184 | −2.393372 | 0 |
| EPITHELIAL MESENCHYMAL TRANSITION | 187 | −2.326842 | 0 |
| HALLMARK UV RESPONSE DN | 132 | −2.2021167 | 0 |
| APICAL JUNCTION | 188 | −2.1883261 | 0 |
| IL6 JAK STAT3 SIGNALING | 84 | −2.099998 | 0 |
| IFN GAMMA RESPONSE | 172 | −2.0646842 | 1.80 × 10⁻⁴ |
| TNFA SIGNALING VIA NFKB | 182 | −2.054592 | 1.57 × 10⁻⁴ |
| ADIPOGENESIS | 183 | −1.9837885 | 3.62 × 10⁻⁴ |
| IL2 STAT5 SIGNALING | 178 | −1.895978 | 7.39 × 10⁻⁴ |
| COMPLEMENT | 170 | −1.776054 | 0.001883127 |
| MYOGENESIS | 193 | −1.7416193 | 0.002376778 |
| KRAS SIGNALING UP | 183 | −1.7353489 | 0.002540431 |
| IFN ALPHA RESPONSE | 81 | −1.6767852 | 0.003450024 |
| ANGIOGENESIS | 33 | −1.6052388 | 0.007246819 |
| BILE ACID METABOLISM | 108 | −1.5792547 | 0.008601794 |
| APICAL SURFACE | 42 | −1.5046679 | 0.015674971 |
| HYPOXIA | 181 | −1.5025636 | 0.015196791 |
| APOPTOSIS | 153 | −1.4934539 | 0.01546518 |
NES, normalized enrichment score.
Number of genes in gene set.
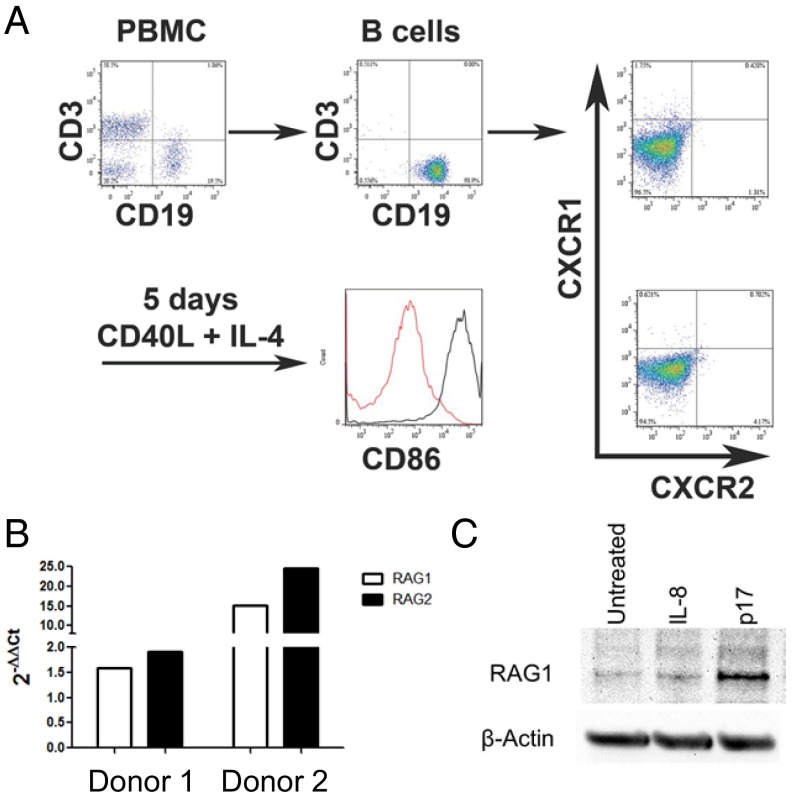
Given that RAG1/2 expression has the potential to introduce genomic instability, we confirmed by Western blot analysis that RAG1 protein was expressed in spleen and lymph nodes of Tg26 mice with lymphoma (Fig. 3B). We hypothesized that HIV matrix protein p17 can directly induce RAG1 expression in B cells, which may lead to transformation. To test this hypothesis in the human system, primary human B cells were negatively selected from PBMCs, activated with CD40L and IL-4 for 5 d, then treated with exogenous p17 (100 ng/mL), IL-8 (100 ng/mL), or media for 24 h (Fig. 4A). Real-time quantitative PCR (qPCR) of cDNA from p17-treated activated B cells showed an up-regulation of RAG1 and RAG2 gene expression compared with media alone in three of seven donors (range of fold changes, 1.43–24.57 for responders and 0.50–1.40 for nonresponders) (Fig. 4B).
Fig. 4.
Expression of RAG1 by activated human B cells can be enhanced by treatment with extracellular p17. (A) Activation strategy. B cells were negatively selected from fresh human PBMCs and analyzed for purity (99% were CD19+) and expression of CXCR1 and CXCR2 before culture. After 5 d of culture with CD40L and IL-4, B cells were activated, as shown by up-regulation of CD86. (B) Real-time qPCR for Rag1 and Rag2 expression in two representative donors. After 5 d of activation, B cells were cultured for 24 h with medium alone or p17. The fold change of p17 treated vs. untreated cells is shown. (C) Western blot analysis for RAG1 protein expression. After 5 d of activation, B cells were cultured for 24 h with medium alone, IL-8, or p17. p17 induced RAG1 expression in B cells from three of seven donors; one donor is shown.
In line with the qPCR analysis, Western blot analysis of additional donors showed that human RAG1 expression was induced by the addition of p17, but not of IL-8, in three of seven human donors (Fig. 4C). In the three donors, densitometry showed that the range of fold change of p17 treatment compared with media alone was 1.3- to 3.7-fold, normalized to loading control. After activation, the human B cells up-regulated CD86 but did not express detectable CXCR1/2, a candidate receptor for p17 (Fig. 3A). Taken together, the foregoing results suggest that HIV matrix protein p17 has the potential to induce RAG1 expression in human B cells, which may lead to genomic instability and transformation.
Discussion
The heterogeneity of lymphoma subtypes among HIV-infected individuals suggests a variety of pathophysiologies. Animal models are needed to study the drivers of lymphomagenesis. Tg26 mice offer a unique model for investigating the role of HIV proteins in the disease process with intact immunity. We found that expression of matrix protein p17 in lymph nodes of Tg26 mice was associated with disease, consistent with a potential role in lymphomagenesis. The diffuse staining pattern of p17 on IHC suggested extracellular localization in the microenvironment of lymphoid tissues.
Whereas most previous studies on p17 have focused on its intracellular activities, p17 has been detected in human plasma (37). Matrix p17 may influence tumor development at one or more stages, including early B-cell development in BM, B-cell growth in the periphery, and/or support angiogenesis/lymphangiogenesis (18–22). Although we cannot completely exclude the role of other viral proteins, we did not detect gp120 or Nef in lymph nodes in early disease stages.
As the lymphoma progressed, the surface phenotype of peripheral CD19+ cells became more immature, with loss of IgD, CD21, CD23, and eventually IgM and light chain and gain of CXCR4 and surrogate light chain. This phenotype resembles the pro-B-cell stage of development, Hardy’s fraction B/C. In normal B lymphopoiesis, at this stage RAG1/2 are responsible for VDJ recombination to produce μ heavy chain, which pairs with surrogate light chain to assemble the pre-BCR. Signaling through the pre-BCR is responsible for a proliferative burst (33). The μ heavy chain is not detected at the late stage of lymphoma, yet other pre-BCR components are highly expressed on tumor cells, based on microarray results as well as flow cytometry. It is possible that during B-cell development in Tg26 mice, pre-BCR signaling somehow loses dependence on μ, resulting in rapid proliferation. GSEA analysis showed an up-regulation of many hallmark gene sets related to cell cycle and proliferation, including MYC targets. Of note, constitutive expression of MYC due to translocation is a hallmark of human BL.
The expression of genes related to NF-κB signaling was significantly lower in lymphoma samples compared with asymptomatic Tg26 samples, suggesting the presence of inflammatory signals before lymphoma development. In plasma of otherwise asymptomatic Tg26 mice compared with FVB/N controls, earlier work revealed elevated levels of cytokines and chemokines, including IL-12 p40 and MIP-1β, which are downstream of NF-κb (25). Because the viral LTR is regulated by NF-κB as well, transgene expression may be driven by inflammatory signals resulting from normal encounters with the environment during the asymptomatic stage. In turn, viral protein expression may influence hematopoiesis and/or peripheral immune responses. The activity of GATA-1, a transcription factor important for erythropoiesis (38), was also down-regulated in lymphoma samples, in line with the observed anemia.
A common genetic abnormality in lymphoid malignancies is chromosomal translocation between antigen receptor genes and proto-oncogenes. Mistakes in VDJ recombination during lymphocyte development may lead to B-cell malignancy, although multiple genetic hits are required because signature translocations can be readily detected in lymphocytes from healthy individuals, at a frequency increasing with age (39). Mouse models support the idea that VDJ recombinase (RAG1/2) plays a central role in lymphomagenesis; for example, disseminated pro-B-cell tumors similar to those in Tg26 mice develop in SCID p53−/− mice (40). In this model, a mutation affecting the ability of the DNA–protein kinase complex to rejoin coding ends combined with an impaired response to DNA damage leads to tumors with recurrent translocations involving the IgH locus. The addition of a Rag2-null mutation suppressed tumor development in SCID p53−/− mice, suggesting that DNA breaks resulting from VDJ recombination are required for transformation. Microarray analysis of Tg26 tissues showed high expression of Rag1/2 transcripts in tumors, and high expression of RAG1 protein was confirmed by Western blot analysis (Fig. 4B). Perhaps translocations involving the IgH locus are present in the Tg26 model, similar to the SCID p53−/− mouse and human lymphomas. With regard to human HIV lymphomas, a comparison of the molecular characteristics of DLBCL in HIV-infected and uninfected patients from the pre-cART era showed that 10 of 32 (31%) of HIV-associated cases had one of three translocations tested, most commonly MYC/IgH [t (8, 14)(q24;32)] (41).
In contrast to uninfected cases, in which a strong relationship between certain translocations and cell of origin (either centroblastic/germinal center B-cell type or immunoblastic/activated B-cell type) was seen, the presence of a translocation in HIV-associated DLBCL was not related to the cell of origin. Although based on a small number of patients, these data are consistent with the possibility that translocations in DLBCL of HIV-infected patients may occur before entry to the lymph nodes, perhaps in the BM, where p17 can be found (31). Rag1/2 expression has been documented in human B-lineage acute lymphoblastic leukemias (42), but has not been rigorously tested in more differentiated human lymphomas. Among HIV-negative patients, early studies found Rag1/2 transcripts in two of three EBV-negative lymphoblastic lymphomas (43) but in none of nine surface Ig+ B nodular lymphomas (42). Although Rag1/2 expression may be lacking at the time of patient diagnosis, the mouse lymphoma described herein raises the question of whether Rag1/2 plays a role in human HIV-associated lymphomagenesis.
RAG1/2 expression is tightly regulated during lymphocyte development to prevent genetic errors. It is also appreciated that mature B cells can be induced to re-express RAG proteins when secondary rearrangements are necessary, such as in germinal centers. RAG1/2 expression has been documented in human and murine mature B-cell subsets and can be induced in culture by cross-linking the BCR and CD40 (44–46). Costimulation promotes the release of IL-6, which initiates RAG expression. In three of seven healthy donors, extracellular HIV-1 matrix protein p17 enhanced RAG1 expression after costimulation of peripheral blood B cells in culture (Fig. 4 B and C). It would be interesting to compare the expression of RAG1 within germinal center B cells from HIV patients and controls.
Our experiments also showed that human IL-8 had little effect on RAG1 expression in human B cells. Thus, aside from CXCR1/2, an alternate receptor for p17 may exist on human B cells to mediate this effect. The p17 receptor density varied between human subjects, as demonstrated by up to a 15-fold difference in the mean fluorescence intensity of labeled p17 (Fig. S3). Perhaps genetic polymorphism in the alternate receptor or activation status of the B cells accounts for the variability observed. Taken together, our findings indicate that HIV-1 matrix protein p17 has the potential to enhance RAG1 expression in costimulated human B cells, which may lead to genomic instability and transformation.
Materials and Methods
Animals.
The transgenic mouse line Tg26 has been described previously (24). The transgene is derived from the pNL4-3 provirus and contains a 3-kb deletion that spans the majority of the gag/pol region. Heterozygous mice were used, because homozygotes rarely survive to weaning. The colony developing leukemia/lymphoma was generated by cross-breeding heterozygous mice with skin lesions (25). Mice were euthanized at age 5–12 mo. All mice were on the FVB/N background (Harlan), except those studied in Fig. 2C and Fig. S1, which were on the F1 background (FVB/N × BALB/c). All animal studies were conducted at the Animal Care Facility of the Institute of Human Virology, University of Maryland, Baltimore and were approved by and conducted in accordance with Animal Care and Use Committee oversight.
IHC.
Sections were processed and stained following standard techniques, using mouse IgG anti-p17 mAb (clone 32/5.8.42; ZeptoMetrix). The methodology is described in detail in SI Materials and Methods. Images were collected on a Nikon Eclipse TE300 inverted microscope with SPOT 5.0 software. Scoring of sections for p17 staining was performed by five independent reviewers in a blind fashion. The average score for one section per mouse is presented. To assign scores, the coverage area of brown DAB stain within one image per mouse was estimated by each reviewer. Scoring was as follows: 0, 0–10%; 1, 10–40%; 2, 40–70%; 3, 70–100%.
RNA Purification and Microarray.
Total cellular RNA from spleen and lymph nodes from three groups of animals—FVB/N control mice (n = 3), Tg26 asymptomatic mice (n = 6), and Tg26 mice with lymphoma (n = 6)—was isolated and subjected to a cleanup protocol with the RNeasy Mini Kit (Qiagen), according to the manufacturer’s specifications. The quality of total RNA was assessed using an Agilent Bioanalyzer 2100. Affymetrix GeneChip Mouse Gene 1.0 ST Array was used for hybridization according to the manufacturer’s instructions. The detailed methodology followed for the analysis of microarray data is provided in SI Materials and Methods.
Human B-Cell Isolation and Culture.
Human PBMCs were isolated using Lymphoprep (Axis-Shield) from healthy blood donors' leukopaks obtained from the New York Blood Center, Long Island, NY, in accordance with their guidelines and those of the Institutional Review Board of the University of Maryland School of Medicine. B cells were negatively isolated from unstimulated PBMCs using the EasySep Human B Cell Enrichment Kit without CD34 Depletion (Stem Cell Technologies) and were cultured in complete RPMI-1640. Cells were activated with soluble 1 μg/mL CD40L (MEGACD40L; Enzo Life Sciences) and 10 ng/mL IL-4 (R&D Systems) for 5 d. HPLC-purified HIV-1BH10 p17 was chemically synthesized via solid-phase peptide synthesis by W. Lu, Institute of Human Virology, University of Maryland School of Medicine, Baltimore, as reported previously (12).
Western Blot, Flow Cytometry, and Real-Time qPCR.
Detailed methodology is provided in SI Materials and Methods.
SI Materials and Methods
Western Blot Analysis.
Spleen or pooled lymph nodes from Tg26 mice were analyzed for protein expression as described previously (25). For positive controls, 20 ng of the following viral proteins, derived from HIV-1 IIIB, were used: synthetic p17 (provided by W. Lu), recombinant Nef (Bioclone), and recombinant gp120 (CHO; National Institutes of Health AIDS Reagent Program). Human B cells were probed with anti-RAG1 antibody (Santa Cruz Biotechnology) and anti–β-actin (Thermo Fisher Scientific).
IHC.
Mouse lymph nodes and femurs were fixed in formalin. Bones were decalcified in 14% EDTA, pH 7.1 for 5–7 d. Paraffin-embedded sections were incubated at 55 °C under vacuum for 1 h, allowed to cool, deparaffinized in xylene, and then rehydrated in graded ethanol. For p17 staining, sections were blocked with 5% goat serum, followed by blocking for endogenous biotin with the Avidin/Biotin Blocking Kit (Invitrogen) and blocking for endogenous mouse IgG with 0.1 mg/mL Fab goat anti-mouse IgG (Rockland Immunochemicals). Mouse IgG anti-p17 mAb (clone 32/5.8.42; ZeptoMetrix) was used at 1 μg/mL in 1% BSA and incubated overnight at 4 °C. Endogenous peroxidase was blocked with 3% hydrogen peroxide, followed by biotin-Fab goat anti-mouse IgG (Jackson ImmunoResearch) and HRP-streptavidin (Life Technologies). Signals were visualized with a DAB Kit (Vector Laboratories). Slides were counterstained with hematoxylin and dehydrated for mounting.
Flow Cytometry.
Single-cell suspensions of mouse spleen, peripheral blood, and BM cells were analyzed after RBC lysis. Antibodies for mouse antigens included CD3 (145-2C11), CD19 (1D3), and CXCR4 (2B11) (eBioscience); IgD (11-26c.2a), IgM (RMM-1), CD21 (7E9), CD23 (B3B4), and VpreB (R3) (Biolegend); mouse Ig λ1, λ2, and λ3 light chain (R26–46) and mouse Ig κ light chain (187.1) (BD Biosciences); mCXCR1 rabbit polyclonal (Biorbyt); and mCXCR2 (R&D Systems). Antibodies for human antigens included CD3 (OKT3), CD19 (HIB19), CD14 (61D3), and CD56 (MEM188) (Ebioscience); CD86 (IT2.2) (Biolegend); and hCXCR1 and hCXCR2 (R&D Systems). Synthetic p17-Alexa Fluor 430 reagent was kindly provided by W. Lu and used at a concentration of 20 μg/mL. Fixable viability dye eFluor520 (eBioscience) or Live/Dead Fixable Aqua (Molecular Probes) was used to gate live cells.
Microarray Analysis.
All analytical procedures described below were performed using state-of-the-art methods implemented in the oligo, affy, frma, limma, and sva packages available though the R/Bioconductor project (47). Raw data preprocessing was monitored using standard diagnostic plots (i.e., 2D image plots, RNA degradation plots, MA plots, and boxplots). Affymetrix microarray data were normalized at probe level using the frozen robust multiarray analysis method (48). A generalized linear model approach, coupled with empirical Bayes SEs (49), was used to identify differentially expressed genes between animal groups. Correction for multiple testing was performed using the Benjamini–Hochberg method (50). Classical multidimensional scaling (i.e., principal component analysis) (51) was used to display the relationship between the analyzed animal groups in a multidimensional space using the top 10% most variant genes.
Finally, we identified the differentially expressed pathways and biological processes using GSEA (36) and Analysis of Functional Annotation, as described previously (52–55). To this end, we relied on the Broad Institute’s Molecular Signature Database (36), a well-established initiative funded by the NIH, the National Cancer Institute, and the National Institute of General Medical Sciences, to assemble curated collections of functional gene sets (FGS) for data mining and GSEA. In the present study, we focused on (i) signaling pathways from the Kyoto Encyclopedia of Genes and Genomes (56), Reactome (57), and Biocarta (www.genecarta.com); (ii) biological processes from Gene Ontology (58); (iii) FGS containing genes that share cis-regulatory motifs, corresponding to microRNA seed sequences or transcription factor binding sites, that are conserved across the human, mouse, rat, and dog genomes (59); and (iv) manually curated FGS corresponding to fundamental biological processes (hallmark FGS), immunologic expression profiles, and oncogenic signatures derived from peer-reviewed papers. Raw expression data and the required minimum information about a microarray experiment (MIAME) are available from the Gene Expression Omnibus (GEO) database (accession no. GSE87546).
Real-Time qPCR.
Activated human B cells were treated with medium, IL-8 (100 ng/mL), or p17 (100 ng/mL) for 24 h. RNA was extracted using the RNeasy Kit with On-Column DNase digestion (Qiagen). First-strand cDNA was synthesized from 500 ng of total RNA using the iScript cDNA Synthesis Kit (Bio-Rad). cDNA was analyzed by real-time qPCR with iQSYBR Green Supermix (Bio-Rad) with the following primers: RAG1: forward, 5′-GTGCTGAATTTCATCTGGGG-3′; reverse, 5′-ATCTCAACACTTTGGCCAGG-3′; RAG2: forward, 5′-TGACTGTTACCATCTGCAGAGAC-3′; reverse, 5′-TGGTTTAGCGGCAAAGATTC-3′; and 18S: forward, 5′-ATCAACTTTCGATGGTAGTCG-3′; reverse, 5′-TCCTTGGATGTGGTAGCCG-3′. The ΔΔCt method was used to calculate fold changes between untreated and treated cells normalized to 18S ribosomal RNA.
Supplementary Material
Acknowledgments
We thank Dr. Qing Chen for help in interpreting histology slides and Dr. W. Lu for p17 synthesis. We also thank Dr. Albert E. Reece (University of Maryland School of Medicine) for supporting this work through the Dean’s Challenge Award to Accelerate Innovation and Discovery in Medicine and the Director of the Greenebaum Cancer Center for funding support through the Cigarette Restitution Fund Pilot Grant Program. L.M. was supported by NIH Grants UL1 TR 001079 and P30CA006973. M.K.L. was supported by National Cancer Institute Institutional Training Grant 1T32 CA154274.
Footnotes
The authors declare no conflict of interest.
Data deposition: Raw expression data and the required minimum information about a microarray experiment (MIAME) have been deposited in the Gene Expression Omnibus (GEO) database (accession no. GSE87546).
This article contains supporting information online at www.pnas.org/lookup/suppl/doi:10.1073/pnas.1615258113/-/DCSupplemental.
References
- 1.Hleyhel M, et al. French Hospital Database on HIV–ANRS CO4 Cohort Risk of AIDS-defining cancers among HIV-1–infected patients in France between 1992 and 2009: Results from the FHDH-ANRS CO4 cohort. Clin Infect Dis. 2013;57(11):1638–1647. doi: 10.1093/cid/cit497. [DOI] [PubMed] [Google Scholar]
- 2.Gaidano G, Pastore C, Lanza C, Mazza U, Saglio G. Molecular pathology of AIDS-related lymphomas: Biologic aspects and clinicopathologic heterogeneity. Ann Hematol. 1994;69(6):281–290. doi: 10.1007/BF01696556. [DOI] [PubMed] [Google Scholar]
- 3.Cesarman E. Pathology of lymphoma in HIV. Curr Opin Oncol. 2013;25(5):487–494. doi: 10.1097/01.cco.0000432525.70099.a4. [DOI] [PMC free article] [PubMed] [Google Scholar]
- 4.Dunleavy K, Wilson WH. Implications of the shifting pathobiology of AIDS-related lymphoma. J Natl Cancer Inst. 2013;105(16):1170–1171. doi: 10.1093/jnci/djt192. [DOI] [PubMed] [Google Scholar]
- 5.Ambinder RF. Epstein-Barr virus and Hodgkin lymphoma. Hematology (Am Soc Hematol Educ Program) 2007;2007(1):204–209. doi: 10.1182/asheducation-2007.1.204. [DOI] [PubMed] [Google Scholar]
- 6.Gaidano G, et al. Human herpesvirus type-8 (HHV-8) in haematopoietic neoplasia. Leuk Lymphoma. 1997;24(3-4):257–266. doi: 10.3109/10428199709039013. [DOI] [PubMed] [Google Scholar]
- 7.Chao C, et al. Epstein-Barr virus infection and expression of B-cell oncogenic markers in HIV-related diffuse large B-cell lymphoma. Clin Cancer Res. 2012;18(17):4702–4712. doi: 10.1158/1078-0432.CCR-11-3169. [DOI] [PMC free article] [PubMed] [Google Scholar]
- 8.Liapis K, et al. The microenvironment of AIDS-related diffuse large B-cell lymphoma provides insight into the pathophysiology and indicates possible therapeutic strategies. Blood. 2013;122(3):424–433. doi: 10.1182/blood-2013-03-488171. [DOI] [PMC free article] [PubMed] [Google Scholar]
- 9.Dunleavy K, Wilson WH. How I treat HIV-associated lymphoma. Blood. 2012;119(14):3245–3255. doi: 10.1182/blood-2011-08-373738. [DOI] [PMC free article] [PubMed] [Google Scholar]
- 10.Gopal S, et al. Temporal trends in presentation and survival for HIV-associated lymphoma in the antiretroviral therapy era. J Natl Cancer Inst. 2013;105(16):1221–1229. doi: 10.1093/jnci/djt158. [DOI] [PMC free article] [PubMed] [Google Scholar]
- 11.Molyneux EM, et al. Burkitt’s lymphoma. Lancet. 2012;379(9822):1234–1244. doi: 10.1016/S0140-6736(11)61177-X. [DOI] [PubMed] [Google Scholar]
- 12.Dolcetti R, et al. Role of HIV-1 matrix protein p17 variants in lymphoma pathogenesis. Proc Natl Acad Sci USA. 2015;112(46):14331–14336. doi: 10.1073/pnas.1514748112. [DOI] [PMC free article] [PubMed] [Google Scholar]
- 13.Carroll V, Garzino-Demo A. HIV-associated lymphoma in the era of combination antiretroviral therapy: Shifting the immunological landscape. Pathog Dis. 2015;73(7):ftv044. doi: 10.1093/femspd/ftv044. [DOI] [PMC free article] [PubMed] [Google Scholar]
- 14.Popovic M, et al. Persistence of HIV-1 structural proteins and glycoproteins in lymph nodes of patients under highly active antiretroviral therapy. Proc Natl Acad Sci USA. 2005;102(41):14807–14812. doi: 10.1073/pnas.0506857102. [DOI] [PMC free article] [PubMed] [Google Scholar]
- 15.Vendrame E, et al. Serum levels of cytokines and biomarkers for inflammation and immune activation, and HIV-associated non-Hodgkin B-cell lymphoma risk. Cancer Epidemiol Biomarkers Prev. 2014;23(2):343–349. doi: 10.1158/1055-9965.EPI-13-0714. [DOI] [PMC free article] [PubMed] [Google Scholar]
- 16.Epeldegui M, et al. Elevated expression of activation-induced cytidine deaminase in peripheral blood mononuclear cells precedes AIDS-NHL diagnosis. AIDS. 2007;21(17):2265–2270. doi: 10.1097/QAD.0b013e3282ef9f59. [DOI] [PubMed] [Google Scholar]
- 17.Huysentruyt LC, McGrath MS. The role of macrophages in the development and progression of AIDS-related non-Hodgkin lymphoma. J Leukoc Biol. 2010;87(4):627–632. doi: 10.1189/jlb.0809564. [DOI] [PMC free article] [PubMed] [Google Scholar]
- 18.Giagulli C, et al. Opposite effects of HIV-1 p17 variants on PTEN activation and cell growth in B cells. PLoS One. 2011;6(3):e17831. doi: 10.1371/journal.pone.0017831. [DOI] [PMC free article] [PubMed] [Google Scholar]
- 19.Caccuri F, et al. Simian immunodeficiency virus and human immunodeficiency virus type 1 matrix proteins specify different capabilities to modulate B cell growth. J Virol. 2014;88(10):5706–5717. doi: 10.1128/JVI.03142-13. [DOI] [PMC free article] [PubMed] [Google Scholar]
- 20.Caccuri F, et al. HIV-1 matrix protein p17 promotes angiogenesis via chemokine receptors CXCR1 and CXCR2. Proc Natl Acad Sci USA. 2012;109(36):14580–14585. doi: 10.1073/pnas.1206605109. [DOI] [PMC free article] [PubMed] [Google Scholar]
- 21.Caccuri F, et al. HIV-1 matrix protein p17 promotes lymphangiogenesis and activates the endothelin-1/endothelin B receptor axis. Arterioscler Thromb Vasc Biol. 2014;34(4):846–856. doi: 10.1161/ATVBAHA.113.302478. [DOI] [PubMed] [Google Scholar]
- 22.Basta D, et al. Angiogenic, lymphangiogenic and adipogenic effects of HIV-1 matrix protein p17. Pathog Dis. 2015;73(8):ftv062. doi: 10.1093/femspd/ftv062. [DOI] [PMC free article] [PubMed] [Google Scholar]
- 23.Zoufaly A, et al. ClinSurv Study Group Cumulative HIV viremia during highly active antiretroviral therapy is a strong predictor of AIDS-related lymphoma. J Infect Dis. 2009;200(1):79–87. doi: 10.1086/599313. [DOI] [PubMed] [Google Scholar]
- 24.Dickie P, et al. HIV-associated nephropathy in transgenic mice expressing HIV-1 genes. Virology. 1991;185(1):109–119. doi: 10.1016/0042-6822(91)90759-5. [DOI] [PubMed] [Google Scholar]
- 25.Curreli S, et al. B cell lymphoma in HIV transgenic mice. Retrovirology. 2013;10:92. doi: 10.1186/1742-4690-10-92. [DOI] [PMC free article] [PubMed] [Google Scholar]
- 26.Kopp JB, et al. Progressive glomerulosclerosis and enhanced renal accumulation of basement membrane components in mice transgenic for human immunodeficiency virus type 1 genes. Proc Natl Acad Sci USA. 1992;89(5):1577–1581. doi: 10.1073/pnas.89.5.1577. [DOI] [PMC free article] [PubMed] [Google Scholar]
- 27.Kopp JB, et al. Cutaneous disorders and viral gene expression in HIV-1 transgenic mice. AIDS Res Hum Retroviruses. 1993;9(3):267–275. doi: 10.1089/aid.1993.9.267. [DOI] [PubMed] [Google Scholar]
- 28.He B, et al. HIV-1 envelope triggers polyclonal Ig class switch recombination through a CD40-independent mechanism involving BAFF and C-type lectin receptors. J Immunol. 2006;176(7):3931–3941. doi: 10.4049/jimmunol.176.7.3931. [DOI] [PubMed] [Google Scholar]
- 29.Qiao X, et al. Human immunodeficiency virus 1 Nef suppresses CD40-dependent immunoglobulin class switching in bystander B cells. Nat Immunol. 2006;7(3):302–310. doi: 10.1038/ni1302. [DOI] [PubMed] [Google Scholar]
- 30.Xu W, et al. HIV-1 evades virus-specific IgG2 and IgA responses by targeting systemic and intestinal B cells via long-range intercellular conduits. Nat Immunol. 2009;10(9):1008–1017. doi: 10.1038/ni.1753. [DOI] [PMC free article] [PubMed] [Google Scholar]
- 31.Wiley EL, Nightingale SD. Opportunistic events and p17 expression in the bone marrow of human immunodeficiency virus-infected patients. J Infect Dis. 1994;169(3):617–620. doi: 10.1093/infdis/169.3.617. [DOI] [PubMed] [Google Scholar]
- 32.Nagasawa T. CXCL12/SDF-1 and CXCR4. Front Immunol. 2015;6:301. doi: 10.3389/fimmu.2015.00301. [DOI] [PMC free article] [PubMed] [Google Scholar]
- 33.Hardy RR, Hayakawa K. B cell development pathways. Annu Rev Immunol. 2001;19:595–621. doi: 10.1146/annurev.immunol.19.1.595. [DOI] [PubMed] [Google Scholar]
- 34.Jinquan T, et al. Chemotaxis and IL-8 receptor expression in B cells from normal and HIV-infected subjects. J Immunol. 1997;158(1):475–484. [PubMed] [Google Scholar]
- 35.Fan X, et al. Murine CXCR1 is a functional receptor for GCP-2/CXCL6 and interleukin-8/CXCL8. J Biol Chem. 2007;282(16):11658–11666. doi: 10.1074/jbc.M607705200. [DOI] [PubMed] [Google Scholar]
- 36.Subramanian A, et al. Gene set enrichment analysis: A knowledge-based approach for interpreting genome-wide expression profiles. Proc Natl Acad Sci USA. 2005;102(43):15545–15550. doi: 10.1073/pnas.0506580102. [DOI] [PMC free article] [PubMed] [Google Scholar]
- 37.Fiorentini S, et al. HIV-1 matrix protein p17 induces human plasmacytoid dendritic cells to acquire a migratory immature cell phenotype. Proc Natl Acad Sci USA. 2008;105(10):3867–3872. doi: 10.1073/pnas.0800370105. [DOI] [PMC free article] [PubMed] [Google Scholar]
- 38.Bresnick EH, Lee HY, Fujiwara T, Johnson KD, Keles S. GATA switches as developmental drivers. J Biol Chem. 2010;285(41):31087–31093. doi: 10.1074/jbc.R110.159079. [DOI] [PMC free article] [PubMed] [Google Scholar]
- 39.Liu Y, Hernandez AM, Shibata D, Cortopassi GA. BCL2 translocation frequency rises with age in humans. Proc Natl Acad Sci USA. 1994;91(19):8910–8914. doi: 10.1073/pnas.91.19.8910. [DOI] [PMC free article] [PubMed] [Google Scholar]
- 40.Vanasse GJ, et al. Genetic pathway to recurrent chromosome translocations in murine lymphoma involves V(D)J recombinase. J Clin Invest. 1999;103(12):1669–1675. doi: 10.1172/JCI6658. [DOI] [PMC free article] [PubMed] [Google Scholar]
- 41.Morton LM, et al. Molecular characteristics of diffuse large B-cell lymphoma in human immunodeficiency virus-infected and -uninfected patients in the pre-highly active antiretroviral therapy and pre-rituximab era. Leuk Lymphoma. 2014;55(3):551–557. doi: 10.3109/10428194.2013.813499. [DOI] [PMC free article] [PubMed] [Google Scholar]
- 42.Bories JC, Cayuela JM, Loiseau P, Sigaux F. Expression of human recombination activating genes (RAG1 and RAG2) in neoplastic lymphoid cells: Correlation with cell differentiation and antigen receptor expression. Blood. 1991;78(8):2053–2061. [PubMed] [Google Scholar]
- 43.Meru N, Jung A, Lisner R, Niedobitek G. Expression of the recombination activating genes (RAG1 and RAG2) is not detectable in Epstein-Barr virus–associated human lymphomas. Int J Cancer. 2001;92(1):75–78. [PubMed] [Google Scholar]
- 44.Hillion S, Dueymes M, Youinou P, Jamin C. IL-6 contributes to the expression of RAGs in human mature B cells. J Immunol. 2007;179(10):6790–6798. doi: 10.4049/jimmunol.179.10.6790. [DOI] [PubMed] [Google Scholar]
- 45.Giachino C, Padovan E, Lanzavecchia A. Re-expression of RAG-1 and RAG-2 genes and evidence for secondary rearrangements in human germinal center B lymphocytes. Eur J Immunol. 1998;28(11):3506–3513. doi: 10.1002/(SICI)1521-4141(199811)28:11<3506::AID-IMMU3506>3.0.CO;2-J. [DOI] [PubMed] [Google Scholar]
- 46.Han S, Zheng B, Schatz DG, Spanopoulou E, Kelsoe G. Neoteny in lymphocytes: Rag1 and Rag2 expression in germinal center B cells. Science. 1996;274(5295):2094–2097. doi: 10.1126/science.274.5295.2094. [DOI] [PubMed] [Google Scholar]
- 47.Gentleman RC, et al. Bioconductor: Open software development for computational biology and bioinformatics. Genome Biol. 2004;5(10):R80. doi: 10.1186/gb-2004-5-10-r80. [DOI] [PMC free article] [PubMed] [Google Scholar]
- 48.McCall MN, Jaffee HA, Irizarry RA. fRMA ST: Frozen robust multiarray analysis for Affymetrix Exon and Gene ST arrays. Bioinformatics. 2012;28(23):3153–3154. doi: 10.1093/bioinformatics/bts588. [DOI] [PMC free article] [PubMed] [Google Scholar]
- 49.Smyth GK. Linear models and empirical Bayes methods for assessing differential expression in microarray experiments. Stat Appl Genet Mol Biol. 2004;3:Article3. doi: 10.2202/1544-6115.1027. [DOI] [PubMed] [Google Scholar]
- 50.Benjamini Y, Hochberg Y. Controlling the false discovery rate: A practical and powerful approach to multiple testing. J Roy Stat Soc B. 1995;57(1):289–300. [Google Scholar]
- 51.Gower JC. Some distance properties of latent root and vector methods used in multivariate analysis. Biometrika. 1966;53(3/4):325–338. [Google Scholar]
- 52.Kortenhorst MS, et al. Analysis of the genomic response of human prostate cancer cells to histone deacetylase inhibitors. Epigenetics. 2013;8(9):907–920. doi: 10.4161/epi.25574. [DOI] [PMC free article] [PubMed] [Google Scholar]
- 53.Ross AE, et al. Molecular effects of genistein on male urethral development. J Urol. 2011;185(5):1894–1898. doi: 10.1016/j.juro.2010.12.095. [DOI] [PMC free article] [PubMed] [Google Scholar]
- 54.Guerrero-Preston R, et al. Key tumor suppressor genes inactivated by “greater promoter” methylation and somatic mutations in head and neck cancer. Epigenetics. 2014;9(7):1031–1046. doi: 10.4161/epi.29025. [DOI] [PMC free article] [PubMed] [Google Scholar]
- 55.Iglesias-Ussel M, Vandergeeten C, Marchionni L, Chomont N, Romerio F. High levels of CD2 expression identify HIV-1 latently infected resting memory CD4+ T cells in virally suppressed subjects. J Virol. 2013;87(16):9148–9158. doi: 10.1128/JVI.01297-13. [DOI] [PMC free article] [PubMed] [Google Scholar]
- 56.Kanehisa M, Goto S, Kawashima S, Okuno Y, Hattori M. The KEGG resource for deciphering the genome. Nucleic Acids Res. 2004;32(Database issue):D277–D280. doi: 10.1093/nar/gkh063. [DOI] [PMC free article] [PubMed] [Google Scholar]
- 57.Croft D, et al. The Reactome pathway knowledgebase. Nucleic Acids Res. 2014;42(Database issue):D472–D477. doi: 10.1093/nar/gkt1102. [DOI] [PMC free article] [PubMed] [Google Scholar]
- 58.Ashburner M, et al. The Gene Ontology Consortium Gene Ontology: Tool for the unification of biology. Nat Genet. 2000;25(1):25–29. doi: 10.1038/75556. [DOI] [PMC free article] [PubMed] [Google Scholar]
- 59.Xie X, et al. Systematic discovery of regulatory motifs in human promoters and 3′ UTRs by comparison of several mammals. Nature. 2005;434(7031):338–345. doi: 10.1038/nature03441. [DOI] [PMC free article] [PubMed] [Google Scholar]
Associated Data
This section collects any data citations, data availability statements, or supplementary materials included in this article.


