Significance
STAT6 is a transcription factor and plays a predominant role in IL-4/IL-13 and virus-mediated signaling pathways. Extensive studies have linked malfunctions of STAT6 to pathological features of asthma and cancer. Targeting the function of STAT6 has become an attractive therapy. Understanding the molecular mechanisms of STAT6 transcriptional regulation is still scarce. Here, we report the atomic-level structures of the phosphorylated STAT6 core fragment homodimer, both in DNA-free and complexed with N4 or N3 site DNA, uncovering both a larger dimer interface intersection angle and the unique residue H415 of STAT6 as important factors for discrimination of N4 from N3 site DNA. This study uncovers a dramatic conformational change in STAT6 dimer for recognizing and preferring N4 site DNA.
Keywords: STAT6, N4 site DNA recognition, JAK-STAT pathway, antiviral innate immunity, crystal structure
Abstract
STAT6 participates in classical IL-4/IL-13 signaling and stimulator of interferon genes-mediated antiviral innate immune responses. Aberrations in STAT6-mediated signaling are linked to development of asthma and diseases of the immune system. In addition, STAT6 remains constitutively active in multiple types of cancer. Therefore, targeting STAT6 is an attractive proposition for treating related diseases. Although a lot is known about the role of STAT6 in transcriptional regulation, molecular details on how STAT6 recognizes and binds specific segments of DNA to exert its function are not clearly understood. Here, we report the crystal structures of a homodimer of phosphorylated STAT6 core fragment (STAT6CF) alone and bound with the N3 and N4 DNA binding site. Analysis of the structures reveals that STAT6 undergoes a dramatic conformational change on DNA binding, which was further validated by performing molecular dynamics simulation studies and small angle X-ray scattering analysis. Our data show that a larger angle at the intersection where the two protomers of STAT meet and the presence of a unique residue, H415, in the DNA-binding domain play important roles in discrimination of the N4 site DNA from the N3 site by STAT6. H415N mutation of STAT6CF decreased affinity of the protein for the N4 site DNA, but increased its affinity for N3 site DNA, both in vitro and in vivo. Results of our structure–function studies on STAT6 shed light on mechanism of DNA recognition by STATs in general and explain the reasons underlying STAT6’s preference for N4 site DNA over N3.
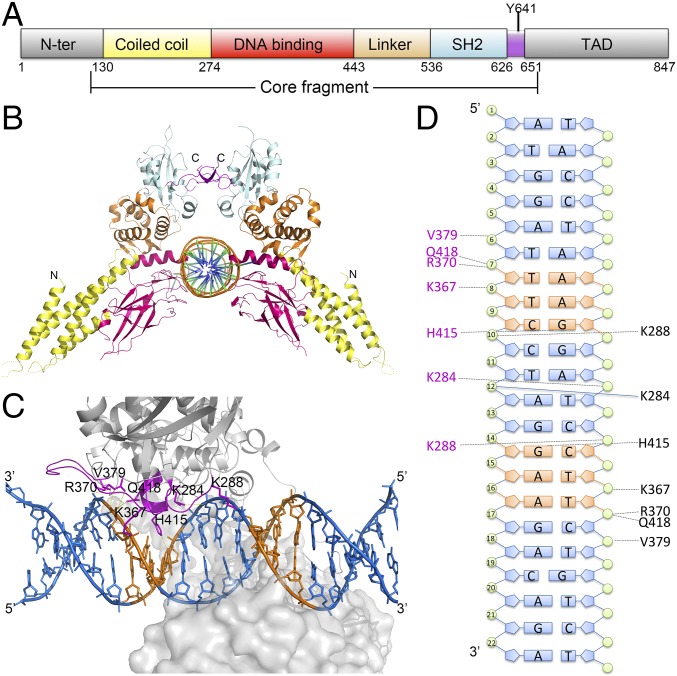
Proteins belonging to the STAT family mediate transmission of signals of numerous cytokines and growth factors from the cell membrane to the nucleus via the classical JAK-STAT pathway (1). Malfunctions in this pathway are known to result in immune system disorder and cancers. Therefore, the JAK-STAT pathway is considered to be of great importance in the development of therapeutic interventions (2). The mammalian STAT family is made up of seven structurally and functionally related proteins named STAT1, 2, 3, 4, 5a, 5b, and 6 (3). All of the STAT proteins share a conserved domain organization (Fig. 1A).
Fig. 1.
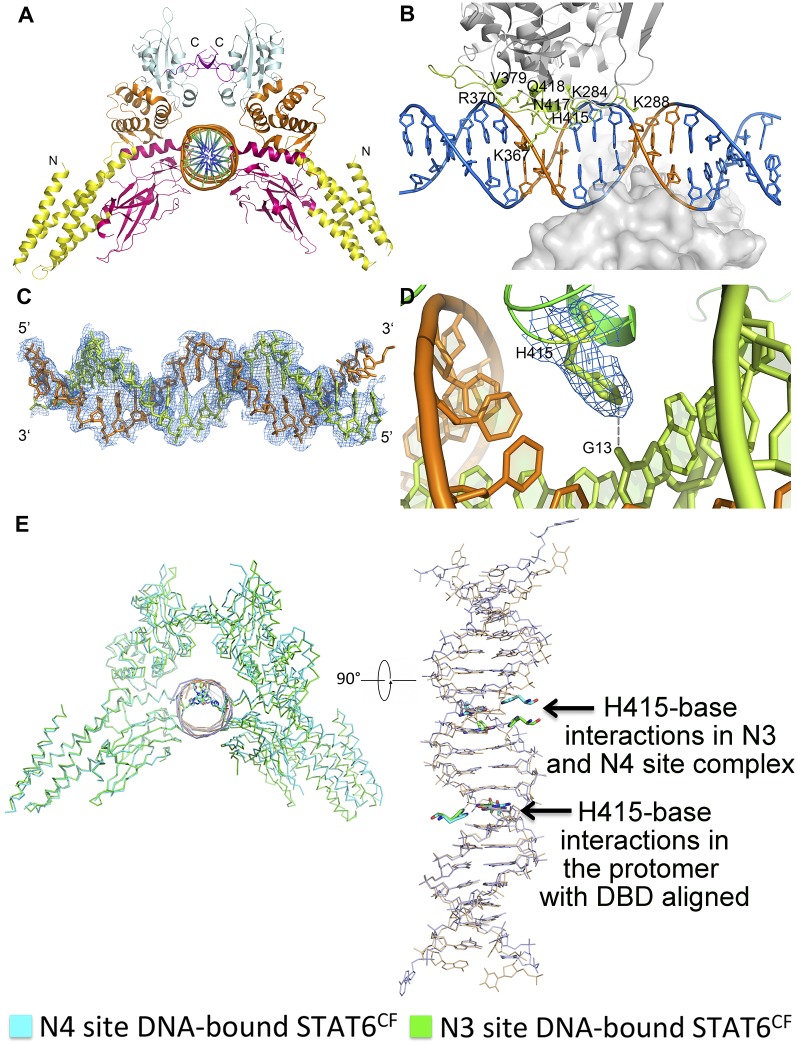
Structure of STAT6CF and N4 site DNA complex. (A) Schematic diagram showing the domain organization of human STAT6, including N-terminal domain (gray), coiled coil domain (yellow), DNA-binding domain (red), linker domain (orange), SH2 domain (cyan), and TAD domain (gray). The core fragment and phosphorylation site Y641 are indicated. (B) Cartoon diagram of the STAT6CF-N4 complex (in front view). Colors of each domain are the same as in A. (C) Drawing depicting details of the STAT6CF–DNA interface. The side chains of residues (A chain) donating hydrogen bonds are shown as magenta colored sticks, and the hydrogen bonds are shown as yellow dashed lines. The conserved palindromic bases (TTC/GAA) in both sides of the DNA molecule are shown in orange. (D) A schematic drawing highlighting STAT6CF–DNA interactions. Residues forming hydrogen bonds are colored in magenta (D chain) and black (B chain).
STAT6, an important member of the STAT family, plays a crucial role in the differentiation of Th2 cells and has been implicated in the development of asthma (4). This STAT is primarily stimulated by IL-4 and IL-13. A recent study reported that STAT6 plays a pivotal role in antiviral signaling initiated by host cells in response to viral infections (5). STAT6 could be activated by the stimulator of interferon genes/TBK1 cascade via phosphorylation of Y641. Intriguingly, residue S407 located in the DNA-binding domain (DBD) of STAT6 has been shown to be phosphorylated by TBK1. However, its implication for biological function of STAT6 is currently unknown (5). Thus, structural studies on STAT6 and its complex with DNA are essential to address several unanswered questions related to signals that morph STAT6 into a conformation, which is competent for binding DNA and transcription of genes.
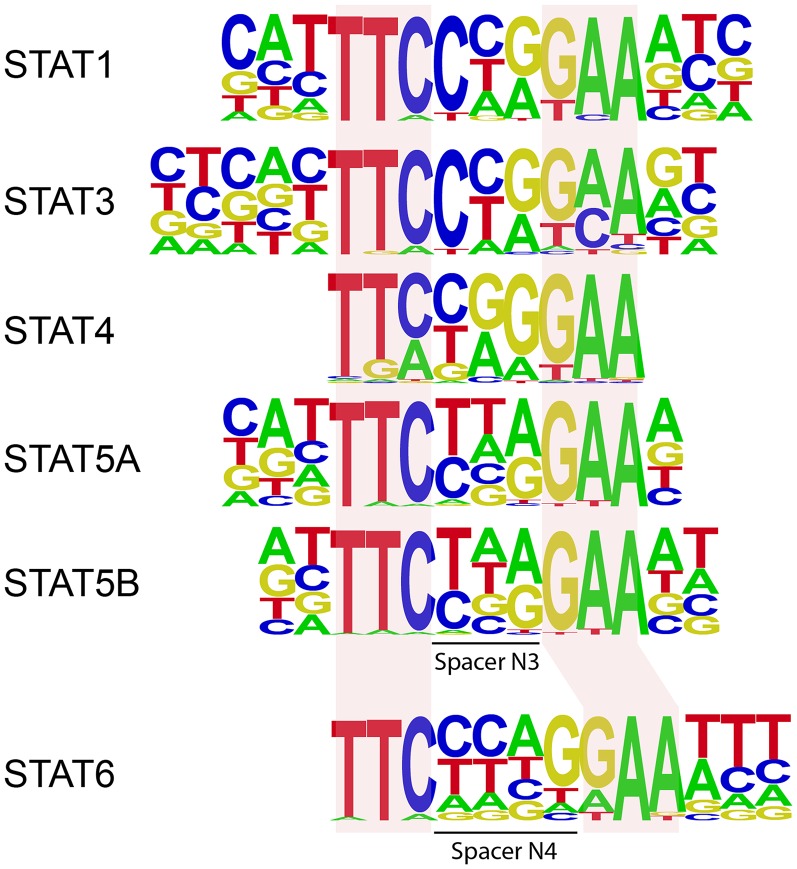
STATs recognize DNA motifs with a consensus sequence of 5′-TTCN3/4GAA-3′ in the regions of target genes that regulate expression of the protein, where N3/4 denotes a spacer consisting of three (N3) or four (N4) nucleotides of any of the four types found in the DNA. STAT6 is reported as the only member that prefers N4 over N3 site DNA (6), which is in agreement with our observations during initial studies on DNA binding by STATs (Fig. S1) (7). Interestingly, STAT5 has been shown to bind N4 site DNA weakly (8). Thus far, only homodimeric structures of STAT1 and STAT3 in complex with N3 site DNA [phosphorylated STAT1 and STAT3, protein data bank (PDB) ID codes 1BF5 and 1BGl, respectively; unphosphorylated STAT3, PDB ID code 4E68] have been solved (9–11). In addition, structures of unphosphorylated monomeric STAT1 (PDB ID code 1YVL) and STAT3 (PDB ID code 3CWG), as well as unphosphorylated dimeric STAT5a (PDB ID code 1Y1U) in protein-alone form, have been published (12–14). These structures shed light on the domain organization, nature of dimerization, and mode of N3 site DNA binding by STATs. However, to the best of our knowledge, there was no instance where structures of a phosphorylated STAT protein alone and in complex with DNA were available for the same STAT protein. This gap has hampered our ability to comprehend the conformational changes induced on DNA binding by a phosphorylated STAT. Furthermore, there is no structural information available on STAT6. This situation has further limited our understanding of the mechanisms underlying DNA recognition by STAT6 and the molecular basis for how STAT6 discriminates N4 site DNA from N3 type of DNA.
Fig. S1.
DNA sequences preferred by STAT proteins based on the existing experimental determination of STAT DNA-binding motifs (7, 35).
Here, we report the crystal structures of phosphorylated dimeric STAT6 core fragment encompassing amino acids (aa) 123–658 (hereafter referred to as STAT6CF) in unliganded form and its complexes with N3 and N4 site DNAs. Using these structures, we could analyze the conformational changes induced by DNA binding without having to resort to qualitative comparisons with phylogenetically distant homologs. Furthermore, we identified key residues in the DBD that are important for DNA recognition and verified their roles in the function of STAT6 by performing in vitro and in vivo experiments. Notably, we show that, a larger angle at the intersection where the two protomers of STAT meet and the unique residue H415 in the DBD of STAT6 are important for recognition of N4 site DNA.
Results
Phosphorylated STAT6CF Forms a Homodimer and Binds DNA with High Affinity.
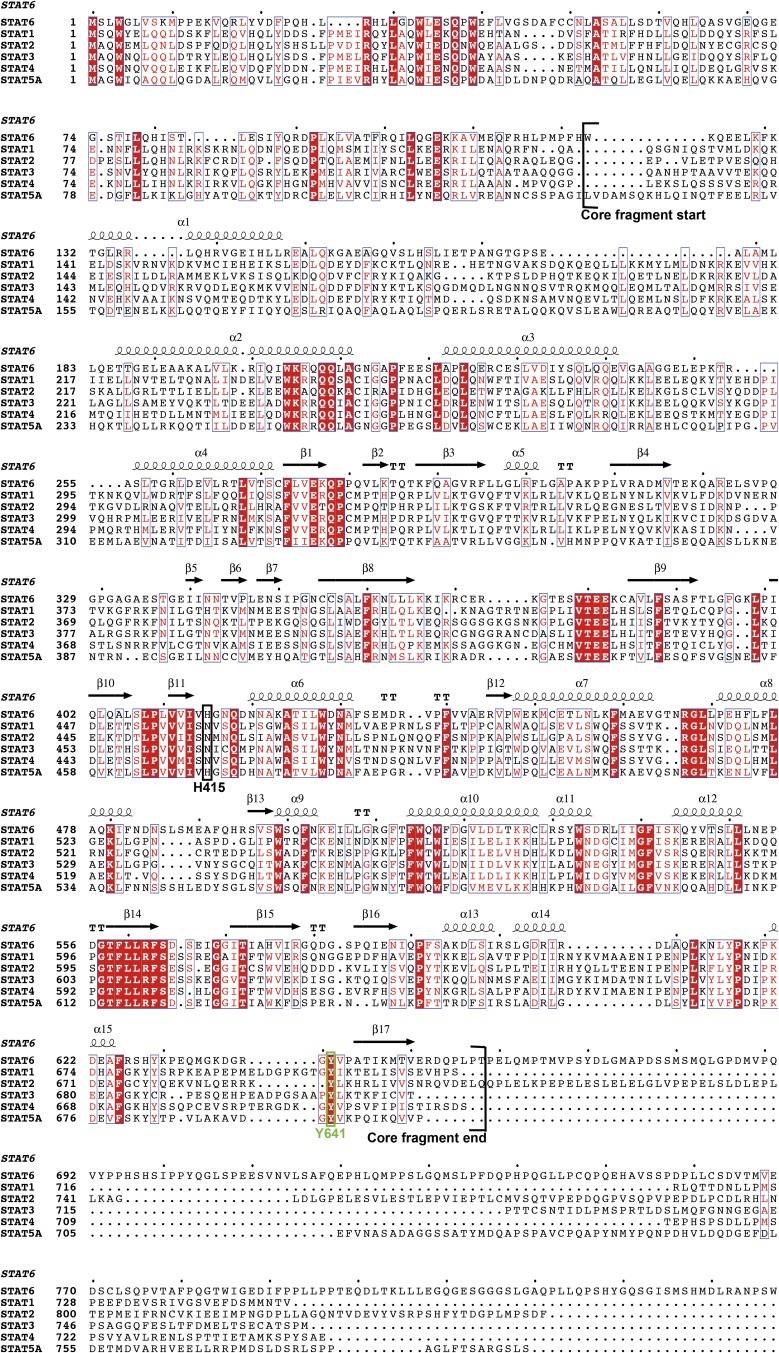
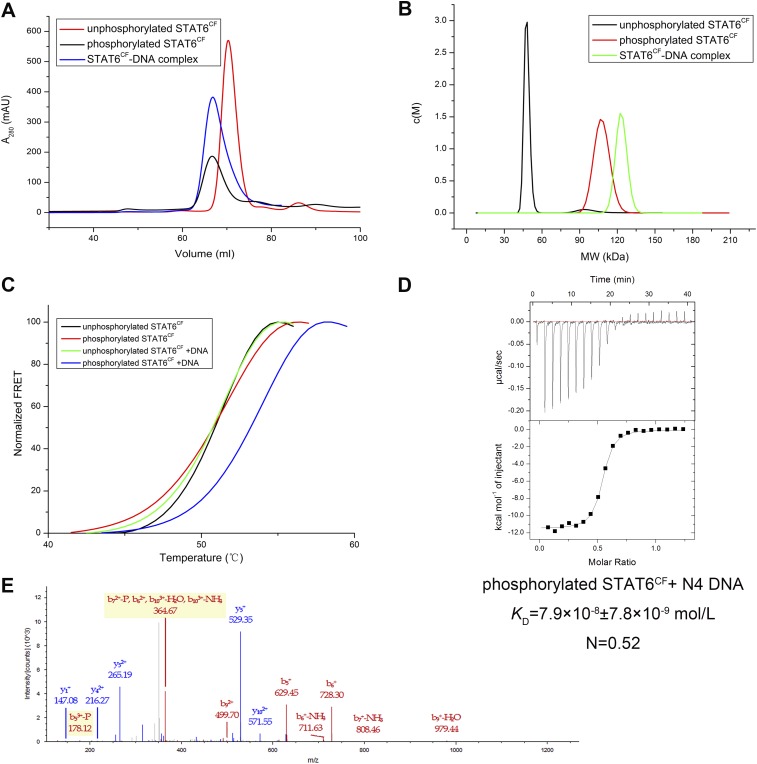
Previous studies have shown that truncations of STAT, termed as the core fragment (STATCF), can bind DNA with affinities comparable to those of the full-length STATs (10, 15). Therefore, we designed a truncation encompassing human STAT6CF (aa 123–658) based on alignment of primary sequence of STAT6 with STAT1 and STAT5a core fragments (Fig. 1A, Fig. S2, and Tables S1 and S2). The STAT6CF purified to homogeneity existed as a monomer in solution. However, this form of STAT6CF neither bound DNA nor did it crystallize after extensive screening. These features of STAT6 are unlike STAT1 and STAT3, which are known to bind DNA regardless of phosphorylation (11, 16). Because the unphosphorylated STAT6CF did not bind DNA, we produced phosphorylated STAT6CF as described previously (17, 18) (Fig. S3). The phosphorylated form of STAT6CF eluted as a dimer (Fig. S3 A and B) and bound DNA with a high affinity (KD = 79 nM for N4 site DNA; Table 1). Results of isothermal titration calorimetry (ITC), analytical ultracentrifugation (AUC) analysis, thermal shift assay (TSA), and gel filtration chromatography experiments were consistent with the ability of dimeric phosphorylated STAT6CF to bind DNA (Fig. S3 A–D). Thus, phosphorylated STAT6CF forms a homodimer that is capable of binding DNA in solution.
Fig. S2.
Multiple sequence alignment of STAT6 and other STAT proteins produced by ClusterW and ESpript (espript.ibcp.fr/ESPript/ESPript/). Every 10 residues are indicated with a dot (·) shown above the sequences. Strictly conserved residues are boxed in white on a red background, and highly conserved residues are boxed in red on a white background. The key residue (H415 in STAT6) for distinguishing N4 and N3 site DNA and the strictly conserved tyrosine phosphorylation site (Y641 in STAT6) are highlighted by a black box and a green box, respectively. The core fragment of STAT6 (aa 123–658) used in the study is marked.
Table S1.
List of the RMSD and sequence identity of STAT6CF with structures of STAT proteins
| PDB ID code | Protein | Phosphorylation | Protein stoichiometry | Species | Identity (%) | Z score* | RMSD of Cα (Å)* |
| 1BF5 | STAT1-DNA | Yes | Dimer | Human | 30 | 29.8 | 2.7 |
| 1BG1 | STAT3b-DNA | Yes | Dimer | Mouse | 31 | 29.0 | 2.6 |
| 4E68 | STAT3b-DNA | No | Dimer | Mouse | 31 | 28.6 | 2.6 |
| 1YVL | STAT1 | No | Monomer | Human | 27 | 29.9 | 2.4 |
| 3CWG | STAT3 | No | Monomer | Mouse | 30 | 30.7 | 2.3 |
| 1Y1U | STAT5a | No | Dimer | Mouse | 46 | 34.3 | 2.2 |
| 1UUR | Dd-STATa | Yes | Dimer | Mold | 31 | 18.7 | 5.1 |
| 1UUS | Dd-STATa | Yes | Dimer | Mold | 31 | 17.1 | 4.3 |
Data were derived from DALI service using STAT6CF structure as reference.
Table S2.
DNA sequences used for crystallization, ITC, and SPR in this study
| Name | Sequence | Uses |
| CS4 | 5′-TGATTTCctagGAAGACA-3′ | ITC, SPR |
| CS4-22 | 5′-ATGGATTTCctagGAAGACAGA-3′ | Crystallization |
| CS-21 | 5′-ATGGATTTCctgGAAGACAGA-3′ | Crystallization |
| IHG | 5′-CGACTTCccaaGAACAGA-3′ | ITC |
| M67 | 5′-TGCATTTCccgTAAATCT-3′ | ITC, SPR |
| T1 | 5′-CGCTTTCcccTAAATGG-3′ | ITC |
The lowercase letters for sequences indicate the spacer sequences between the consensus sequences.
Fig. S3.
Characterization of STAT6CF. (A) Comparison of elution profiles of unphosphorylated STAT6CF (monomer), phosphorylated STAT6CF (dimer), and STAT6CF-N4 complex during gel filtration chromatography. (B) AUC analysis of unphosphorylated STAT6CF, phosphorylated STAT6CF, and STAT6CF-N4 complex shows that unphosphorylated STAT6CF forms a monomer, whereas phosphorylated STAT6CF forms a dimer in solution. (C) TSA results of unphosphorylated STAT6CF and phosphorylated STAT6CF with or without DNA. Both unphosphorylated and phosphorylated STAT6CF had high melting temperature, but only phosphorylated STAT6CF formed a complex with DNA, which resulted in a higher melting temperature than the protein alone. (D) ITC results show that phosphorylated STAT6CF interacts with DNA with a molar ratio of 2:1. (E) Identification of phosphorylation of Y641 by MS. The identified peptide is “DGRGYVPATIK” phosphorylated at Y5, Charge: +3 and monoisotopic m/z: 419.53912 Da.
Table 1.
Affinities of STAT6-WT, STAT1-WT, and their mutants for N3 and N4 site DNAs
| Method | Protein | N4 site (CS4) KD (M) | N4 site (IHG) KD (M) | N3 site (M67) KD (M) | N3 site (T1) KD (M) |
| ITC | STAT6CF-WT | 7.9 × 10⁻⁸ ± 7.8 × 10⁻⁹ | 1.2 × 10⁻⁷ ± 3.4 × 10⁻⁸ | 1.8 × 10⁻⁶ ± 2.0 × 10⁻⁷ | 2.8 × 10⁻⁶ ± 2.6 × 10⁻⁷ |
| STAT6CF-H415N | 2.2 × 10⁻⁶ ± 5.1 × 10⁻⁷ | 2.2 × 10⁻⁶ ± 8.7 × 10⁻⁷ | 2.4 × 10⁻⁷ ± 2.4 × 10⁻⁸ | 7.4 × 10⁻⁷ ± 2.5 × 10⁻⁸ | |
| STAT6CF-K374E | 4.9 × 10⁻⁷ ± 2.0 × 10⁻⁸ | — | 5.5 × 10⁻⁶ ± 1.1 × 10⁻⁷ | — | |
| SPR | STAT6CF-WT | 7.6 × 10⁻⁸ | — | 6.5 × 10⁻⁷ | — |
| STAT6CF-H415N | 1.0 × 10⁻⁶ | — | 1.4 × 10⁻⁷ | — | |
| STAT1CF-WT | 3.2 × 10⁻⁷ | — | 2.6 × 10⁻¹⁰ | — | |
| STAT1CF-N460H | 6.2 × 10⁻⁸ | — | 2.2 × 10⁻⁹ | — |
Overall Structure of STAT6CF and Comparison with Other Unliganded STAT Structures.
Crystal structure of the phosphorylated form of STAT6CF homodimer was determined at 2.70-Å resolution (Table S3). Each asymmetric unit (ASU) contains two STAT6CF protomers arranged in a dimer, consistent with the oligomeric state of the protein in solution. Two protomers within a dimer form a V-shaped structure. The architecture of STAT6CF is similar to those of other STATs, and each protomer of STAT6CF can be divided into five distinct modules: an N-terminal coiled coil domain, a DNA-binding domain, a linker domain, an SH2 domain, and a C-terminal phosphotyrosine tail segment (Fig. S4A).
Table S3.
Data collection and refinement statistics
| Crystal | STAT6CF | STAT6CF-N4 complex | STAT6CF-N3 complex |
| Data collection | |||
| PDB ID code | 4Y5U | 4Y5W | 5D39 |
| X-ray source | SSRF/BL17U1 | SSRF/BL19U | GM/CA-CAT/23ID-C |
| Detector distance (mm) | 360 | 620 | 480 |
| Number of images | 360 | 360 | 720 |
| Oscillation width (°) | 0.5 | 1.0 | 0.5 |
| Wavelength (Å) | 0.98 | 0.98 | 0.98 |
| Space group | P212121 | P1 | P1 |
| a, b, c (Å) | 66.15, 94.32, 179.36 | 68.30, 94.24,147.78 | 68.40, 94.70, 145.64 |
| α, β, γ (°) | 90.00, 90.00, 90.00 | 99.85, 101.73, 89.93 | 79.62, 78.31, 89.58 |
| Mosaicity (°) | 1.13 | 0.59 | 0.60 |
| No. protein molecules/ASU | 2 | 4 | 4 |
| No. DNA chains/ASU | 0 | 4 | 4 |
| Resolution range (Å) | 50.00–2.70 | 50.00–3.10 | 50.00–3.20 |
| (2.80–2.70) | (3.21–3.10) | (3.26–3.20) | |
| Rsym (%) | 8.7 (51.5) | 11.0 (65.4) | 8.2 (69.5) |
| Mean I/σ(I) | 17.68 (4.10) | 11.2 (1.89) | 16.7 (1.22) |
| Completeness (%) | 94.9 (95.3) | 98.0 (95.2) | 99.0 (98.9) |
| Redundancy | 5.2 (5.3) | 3.5 (3.4) | 3.4 (3.1) |
| Refinement | |||
| Resolution (Å) | 46.36–2.70 | 38.81–3.10 | 44.12–3.20 |
| No. reflections | 28,460 | 57,478 | 57,110 |
| Rwork/Rfree (%) | 18.51/25.29 | 24.96/27.80 | 21.03/23.61 |
| No. atoms | 7,227 | 17,098 | 17,397 |
| No. protein atoms | 7,051 | 15,057 | 15,469 |
| No. DNA atoms | 0 | 1,804 | 1,722 |
| No. water | 176 | 237 | 206 |
| Mean B (Å2) | 21.0 | 69.0 | 118.0 |
| Wilson B (Å2) | 23.2 | 65.58 | 98.70 |
| RMSDs | |||
| Bond lengths (Å) | 0.008 | 0.008 | 0.006 |
| Bond angles (°) | 1.237 | 1.064 | 1.321 |
| Ramachandran analysis | |||
| Favored region (%) | 97.19 | 96.47 | 96.38 |
| Allowed region (%) | 2.34 | 3.10 | 3.15 |
| Outliers (%) | 0.47 | 0.43 | 0.47 |
The numbers in parentheses represent the values for the highest-resolution shell.
Fig. S4.
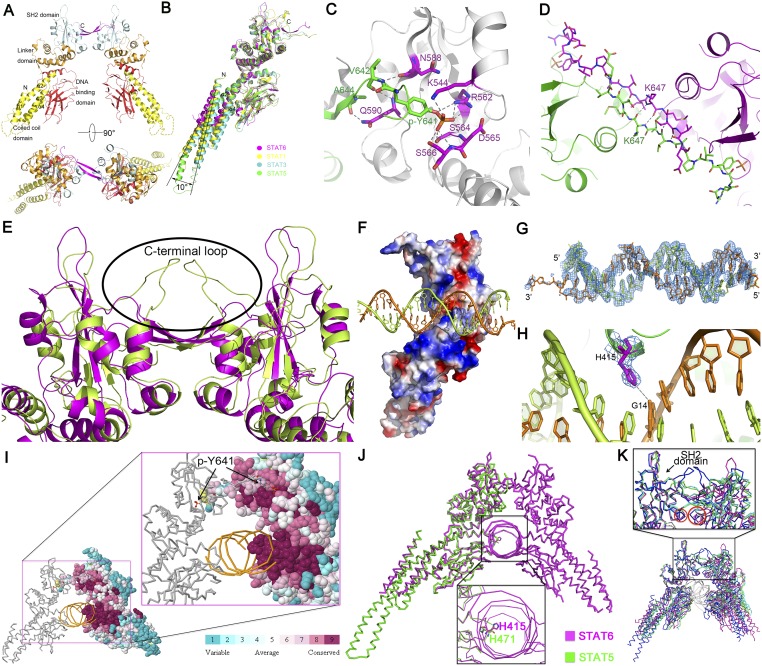
STAT6CF dimer formation and its complex with N4 DNA. (A) Cartoon representation of STAT6CF homodimer, shown from the front view (Upper) and the top view (Lower). The coloring scheme for each domain is the same as in Fig. 1B. The N and C termini of one protomer are labeled with N and C, and missing loops are shown by dashed lines. (B) Superimposition of STAT6CF and previously reported unphosphorylated STAT1CF (PDB ID code 1YVL), STAT3CF (PDB ID code 3CWG), and STAT5CF (PDB ID code 1Y1U) protomers is shown. (C) Drawing depicting details of the interactions between the phosphorylated tail of Y641 from one molecule and the SH2 domain of another molecule. The phosphorylated tail is shown in green; the residues directly participating in the hydrogen bonding interactions are colored magenta. (B) Drawing depicting details of the interactions between two phosphorylated tail fragments as an antiparallel β-sheet. The residue K647 was placed at the center of the dimer interface. (C) Superimposition of STAT6 over STAT1 shows that STAT6CF (magenta) has a shorter C-terminal loop than STAT1CF (green). The C-terminal loops of both proteins are highlighted by black ellipse. (D) Surface electrostatic potential representation of STAT6CF bound with 22-bp N4 site DNA. A positively charged area inserts into the major groove of dsDNA. Blue, positively charged; red, negatively charged; white, neutral. (E) A simulated annealing (SA) omit electron density map (2Fo-Fc), contoured at 1.0σ, of N4 site dsDNA bound to phosphorylated STAT6CF. (F) Electron density map (2Fo-Fc), contoured at 1.0σ, of H415 at DNA binding domain of STAT6. (G) DNAs in STAT1/STAT3 complex structures are bent, forming a 140° angle. (H) DNA molecules in STAT6CF complex are straight and connected to each other end to end, depicting an appearance of a long continuous stretch of DNA in the crystal packing. (I) Residues of the DNA binding interface of STAT6 are highly conserved. Amino acid conservation of STAT6CF via 150 homologs was displayed on STAT6CF-N4 structure using ConSurf (consurftest.tau.ac.il/). (J) Superimposition of N4 site DNA bound STAT6 with STAT5 (PDB ID code 1Y1U) showing the position of side chain of H415 in STAT6 (cyan) and H471 in STAT5 (orange). (K) Structures of apo STAT6CF and its complex with N4 and N3 site DNA were aligned with STAT1-N3 DNA structure using SH2 domain as reference (indicated by an arrow). A larger angle at the intersection where monomers meet is observed in STAT6CF structures (Inset). Magenta, DNA-free STAT6CF; green, N3 site DNA-bound STAT6CF; cyan, N4 site DNA-bound STAT6CF; blue, N3 site DNA-bound STAT1CF.
Comparison of the structures indicates that all four α-helixes, especially the α1 and α2 helixes of the coiled coil domain of STAT6, are shorter than the corresponding regions of STAT1, STAT3, and STAT5a (Fig. S4B), which is consistent with the fact that STAT6 is 41 aa shorter than STAT1, 43 aa shorter than STAT3, and 49 aa shorter than STAT5a as indicated by primary sequence analysis (Fig. S2). In addition, this domain rotates ∼10° outward from the core of the dimer compared with unphosphorylated STAT1, 3, and 5 structures (Fig. S4B).
As expected, residue Y641 of STAT6CF is phosphorylated, forming a phosphotyrosine tail segment, which mediates dimerization (Fig. S4C). The phosphorylated tail segment of each protomer passes through the gap between the two protomers to interact with the SH2 domain of the adjacent protomer and then returns, forming a gate with its own SH2 domain that allows the phosphorylated tail segment of the other molecule to pass through. These types of intermolecular interactions between the phosphorylated tail segments are also observed in STAT1 and STAT3 homodimers (9, 10). Two K647 residues located in the antiparallel β-sheet formed by the dimerization of STAT6 serve as hinge axis points around which the two molecules of STAT6CF rotate when the dimer binds to DNA (Fig. S4D). In addition, our structure of STAT6CF suggests that truncations ending before residue V650 lose the ability to bind to DNA (19) owing to the destruction of the intermolecular interactions of the β-strands of the phosphorylated tail segments, which affects dimerization.
A key structural difference between the dimers of STAT6 and STAT1/STAT3 is located at the C-terminal loop (aa 609–620) region of the SH2 domain. In STAT1 and STAT3, the C-terminal loop is 10 aa longer than in STAT6 (Fig. S4E). The loops from the two protomers are observed converging to form a closed tunnel just above the antiparallel β-sheet. In STAT6, this upper cover of the tunnel disappears completely because the two C-terminal loops are short. Another notable difference between the dimers of STAT6 and other STATs is observed at the intersection where the two protomers meet during dimerization. The angle formed at the intersection of dimerization between the protomers of STAT6 is larger than those observed for STAT1 and STAT3 dimers in complex with DNA, implying the possibility of functional differences between them (see below). Interestingly, like STAT6, STAT5 also contains a shorter C-terminal loop in its amino acid sequence (Fig. S2) so it would most likely assume a relatively more open dimeric structure after activation like STAT6. Thus, structural analysis seems to suggest that the dimeric assembly of STAT6 and STAT5 appears more flexible and accessible for DNA binding compared with other STATs.
Crystal Structures of STAT6CF in Complex with DNA.
Crystal structures of STAT6CF in complex with N4 or N3 site DNA were both determined and refined to 3.10- and 3.20-Å resolutions, respectively (Table S3, Fig. 1, and Figs. S4 F–H and S5 A–D). B-form DNA molecules with lengths of 22 bp (N4 site) and 21 bp (N3 site, by deletion of an adenine in the N4 spacer) are modeled in our STAT6CF-DNA complex structures (Fig. 1 and Fig. S5 A–D).
Fig. S5.
Crystal structure of STAT6CF-N3 complex and its comparison with STAT6CF-N4 complex structure. (A) Cartoon diagram of the STAT6CF-N3 complex. Colors of each domain are the same as in Fig. 1B. (B) Drawing depicting details of the STAT6CF-N3 interface. The side chains of residues (A chain) donating hydrogen bonds are shown by sticks in lemon and hydrogen bonds are shown in gray dash. The conserved palindromic bases (TTC/GAA) are shown in orange. (C) A simulated annealing (SA) omit electron density map (2Fo-Fc), contoured at 1.0σ, of N3 site DNA in STAT6CF-N3 complex. (D) Electron density map (2Fo-Fc), contoured at 1.0σ, of H415 at DNA binding domain of STAT6. Hydrogen bond formed by H415 and G13 of DNA chain is shown in gray dash. (E) Conformational changes between STAT6CF-N3 and N4 site DNA complexes. The DNA binding domains are aligned together in one protomer of the STAT6CF dimer and the difference in the movement of H415-base interactions in the DNA binding domains in another protomer of the STAT6CF dimer is shown (in bottom view).
The two overall structures of STAT6CF bound with N4 and N3 DNA are similar, with an RMSD of 0.636 Å between the main chain Cα atoms of the protomer chains. The interfaces for DNA binding observed in the two complexes are highly conserved (Fig. S4I). One STAT6CF dimer binds one palindromic DNA duplex and each protomer binds only half of the palindromic sequence on average (Fig. 1B). Such interactions of STAT6CF with DNA are similar to those observed for STAT1CF and STAT3CF in their respective complexes with DNA (9, 10). Three loop regions (aa 284–288, aa 365–379, and aa 413–419) of the DBD participate in the recognition of DNA and binding of STAT6CF to the palindromic DNA (Fig. 1C). Several residues in the DBD, including K284, K288, K367, K370, K379, and Q418, form hydrogen bond interactions with the DNA backbone (Fig. 1D). Intriguingly, H415 is the only residue of STAT6CF that forms hydrogen bond with a base. Specifically, H415 forms a 2.91-Å hydrogen bond with the O6 of guanine at position 14 in the N4 site DNA (position 13 in the N3 site DNA; Fig. 1D and Fig. S4H). This structural observation suggests an important role for residue H415 in recognition of DNA by STAT6CF.
Residue H415 Is Essential for N4 Site DNA Recognition by STAT6.
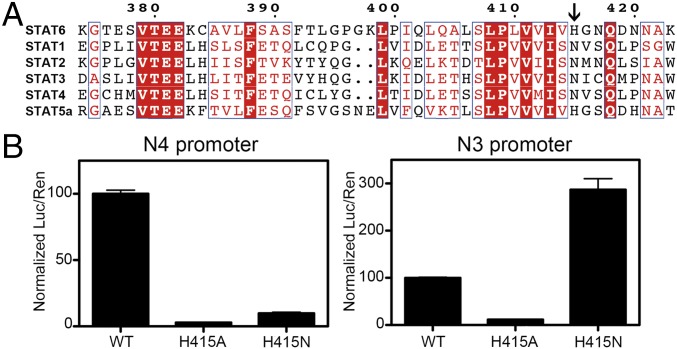
The architecture of the DBD of STAT6CF and the overall mode of DNA binding is similar to that of those reported for other STATs. However, STAT6 differs from other STATs in the ability to forge interactions with the bases of DNA. Although three residues of STAT1 form interactions with DNA bases, only one residue of STAT6, H415, forms a hydrogen bond with a DNA base. Furthermore, sequence alignment of all of the STATs indicates that H415 of STAT6 is replaced by an asparagine (N) in STAT1-4, whereas STAT5, which is reported to recognize a few N4 site DNAs with low affinity in addition to N3 site DNAs (8, 20), retains histidine (H471 in STAT5) at an equivalent position (Fig. 2A). Interestingly, in the unphosphorylated STAT5CF structure (PDB ID code 1Y1U), the side chain of H471 of STAT5 points toward the interior of the protein and does not form any interactions with its neighboring residues (Fig. S4J). However, in all of the structures of STAT6 being reported here, the side chain of residue H415 is oriented toward outside and poised for DNA binding. The relatively inaccessible nature of the position assumed by the side chain of H471 in STAT5 may partially explain its low affinity for N4 site DNA.
Fig. 2.
Residue H415 is essential for N4 site DNA recognition by STAT6. (A) Multiple sequence alignment of STAT6 and other STAT proteins produced by ClusterW and ESpript (espript.ibcp.fr/ESPript/ESPript/). The location of residues (histidine in STAT6/STAT5 and asparagine in STAT1-4) used for distinguishing N4 and N3 site DNA are indicated by a black arrow. Strictly conserved residues are boxed in white on a red background, and highly conserved residues are boxed in red on a white background. (B) The plasmids containing STAT6FL-WT, STAT6FL-H415A, or STAT6FL-H415N were transfected into HEK 293T cells together with renilla reporter and N4 site STAT6 luciferase reporter (Left) or N3 site STAT6 luciferase reporter genes (Right). After 24 h, cells were stimulated with IL-4 (10 ng/mL) for 2 h, and the results of dual-luciferase assay are shown for triplicate samples. Numbers are normalized with respect to the STAT6FL-WT data and presented as percentages.
To investigate the role of residue H415 in recognition of DNA, we compared the affinities of a H415N mutant of STAT6CF for N3 and N4 site DNA with that of the WT STAT6CF. Different types of DNA containing N3 or N4 site DNA motifs were selected as substrates for the studies. Results of ITC experiments revealed that the binding affinity of H415N mutant for an 18-bp-long stretch of the c-γ3 sterile transcript promoter (referred to as CS4; N4 site GAS motif) decreased dramatically from 79 nM to 2.2 µM (Table 1). Similarly, the affinity of H415N mutant for another N4 site DNA, IHG, decreased from 0.12 to 2.2 µM. In addition to N4 site DNAs, we also used two different types of N3 site DNA substrates, M67 and T1, for testing the affinity of the mutant for N3 site DNAs. Remarkably, the affinity of H415N mutant of STAT6CF for M67 increased 7.5 times (from 1.8 to 0.24 µM). Similarly, the affinity of the mutant for T1 increased 3.8 times (from 2.8 to 0.74 µM) (Table 1).
Next, we tested and confirmed the changes in DNA binding affinities of the H415N mutant independently by performing surface plasmon resonance (SPR) experiments. Similar to the ITC results, the affinity of mutant H415N for CS4 (N4 site DNA) decreased by almost 12-fold compared with that of STAT6CF-WT, whereas the affinity for M67 (N3 site DNA) increased by 4.7-fold of that of STAT6CF-WT (Table 1). Thus, a single mutation, H415N, switches the DNA binding preference of STAT6CF from the N4 site DNA to N3 in vitro.
To further corroborate our findings that residue H415 plays an important role in conferring specificity in recognition of DNA by STAT6, we mutated an equivalent residue of STAT1, N460, to histidine and tested the ability of N460H mutant of STAT1 to bind N3 and N4 site DNAs. The affinities of STAT1CF-WT and the mutant STAT1CF-N460H for the N3 and N4 site DNAs were tested using SPR method. Interestingly, STAT1CF-N460H showed a remarkable decrease in affinity for N3 site DNA (M67) and an increase in affinity for N4 site DNA (CS4) compared with STAT1CF-WT (Table 1). Thus, residue N460 of STAT1CF probably plays an important role in conferring specificity for DNA binding. Taken together, the results of mutagenesis studies on H415 of STAT6 and N460 of STAT1 suggest that residue H415 plays an important role in conferring specificity on STAT6 for binding N4 site DNA.
To further verify the significance of residue H415 in conferring specificity for DNA binding, we performed in vivo luciferase reporter-based assays using full-length STAT6 (STAT6FL). STAT6FL-H415N and STAT6FL-H415A mutants were generated and tested in vivo for their ability to regulate the reporter’s expression via the N3 and N4 site DNAs on stimulation by IL-4 (Fig. 2B). As expected and consistent with the in vitro studies performed using STAT6CF, STAT6FL-H415N was deficient in its ability to activate an N4 site DNA. The same mutant exhibited a much stronger luciferase signal than that of STAT6FL-WT when bound to the N3 site DNA (Fig. 2B). In stark contrast to the H415N mutation, STAT6FL-H415A completely lost its ability to activate both N3 and N4 site DNAs, further confirming the essentiality of residue H415 in IL-4/IL-13 signaling (21). Thus, results of the in vitro and in vivo studies using mutants of STAT6 indicate that residue H415 of STAT6 plays an important role in the mechanism of discrimination of N4 site DNA from N3.
Structural Basis for Recognition of N4 Site DNA by STAT6.
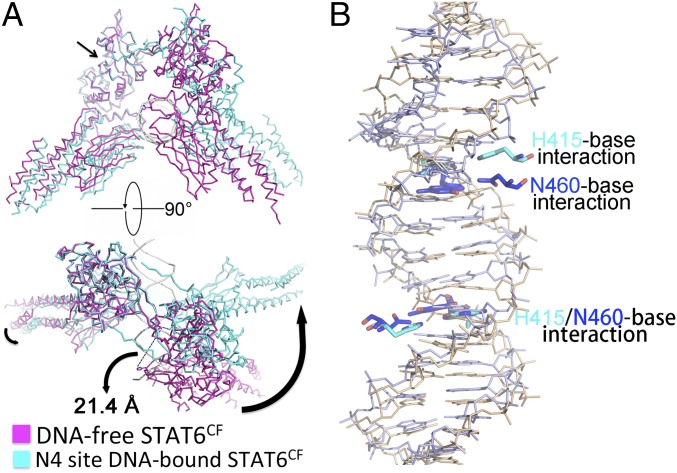
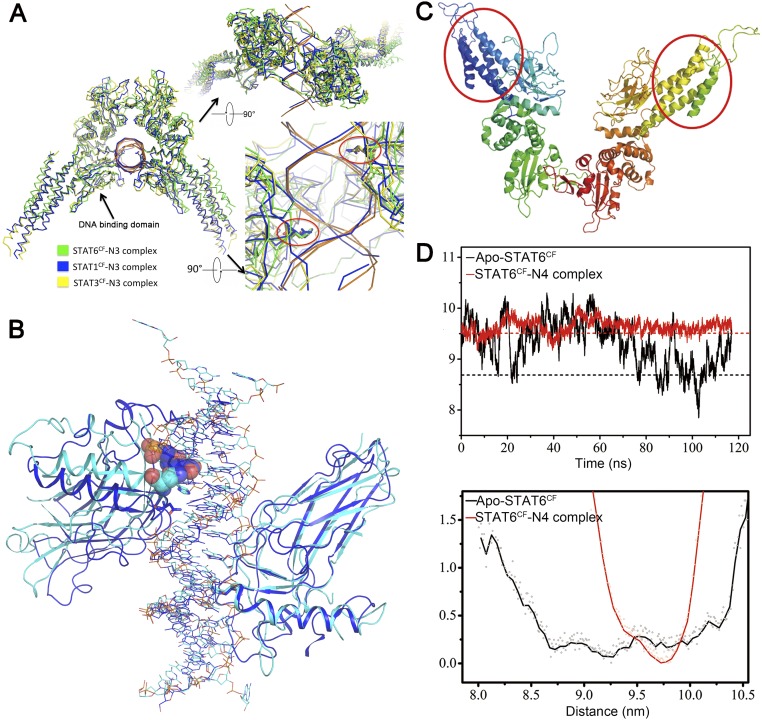
Superimposition of our N4 site DNA-bound STAT6CF over N3 site DNA-bound STAT1 and STAT3 reveals that the mechanism of dimerization within STATs is similar (Fig. S4K). However, the angle of intersection where the two protomers of STAT6 meet in the DNA-bound and DNA-free STAT6CF structures is larger than those observed for STAT1 or STAT3 in complex with DNA (Fig. S4K). Superimposition of our crystal structures of the DNA-free and N4 site DNA-bound STAT6CF by aligning the SH2 domain in one protomer, as shown in Fig. 3A, reveals that the SH2 and linker domains overlapped well. However, the DNA-binding domain and coiled coil domain, when considered as a rigid body, have shifted slightly toward the DNA (Fig. 3A). The most remarkable difference between the two structures becomes evident when the dimers of unliganded and DNA-bound STAT6CF are superimposed. The protomers within the dimer seem to have undergone a significant rotation during DNA binding. Consequently, the position of H415 shifts by 21.4 Å in the DNA-bound structure (Fig. 3A and Movie S1). Due to the flexibility between the four domains of STAT6CF, the DBD of each STAT6CF has rotated to an optimal position for DNA binding (Fig. 3A). The whole STAT6CF dimer is squeezed into a more compact architecture after the phosphorylated STAT6CF dimer encounters and binds N4 site DNA.
Fig. 3.
Conformational change of STAT6CF upon DNA binding. (A) Motion of STAT6CF on DNA binding is shown by using SH2 domain as reference (indicated by an arrow in front view). The movements are indicated by bent black arrows in top view. Dash line indicates the movement of key residue H415 in DNA-free and N4 DNA-bound STAT6CF. (B) Comparison of N4 DNA-bound STAT6CF (residue and base in cyan) and N3 DNA-bound STAT1CF (residue and base in blue) using the DNA-binding domain as the reference. The differences between N4 and N3 site DNA recognition by STAT proteins are shown.
Similar to the STAT6CF-N4 complex, the STAT6CF-N3 complex also undergoes a rotational conformational change on DNA binding (Fig. S4K). We aligned the DBD of our STAT6CF-N3 complex structure with the other three reported STAT protein structures in complex with N3 site DNA, i.e., STAT1 (PDB ID code 1BF5) and STAT3 (PDB ID codes 1BG1 and 4E68) (9–11). Although the proteins exhibit some flexibility, the position of the key residue, H415 in STAT6, N460 in STAT1, and N466 in STAT3, in both the protomers within the dimer of these STATs overlaps (Fig. S6A), suggesting that all members of the STAT family recognize N3 site DNA in a conserved fashion despite slight variations in the overall structures.
Fig. S6.
(A) Our STAT6CF-N3 site DNA complex structure compared with previously reported N3 site DNA bound structures using the DNA binding domain as the reference. The structures show very little divergence and the residues, H415 in STAT6, N460 in STAT1, and N466 in STAT3 (indicated by red circles), are almost at the same place as in the two protomers of the dimer. (B) The comparison of DNA binding domain of STAT6CF-N4 site DNA complex structure (cyan) and STAT1CF-N3 site DNA complex structure (blue) is shown as cartoon representation. The steric hindrance between residue N417 in STAT6 and the DNA base (the fifth T) in the N3 site DNA bound STAT1 (PDB ID code 1BF5) are shown as spheres. (C and D) The conformation of STAT6CF is stabilized by DNA binding. Cartoon display of the region selected for molecular dynamics simulation calculation (red circle) on the model containing missing loops generated by MODELER program based on our STAT6CF-N4 complex (C) and time series of the distance between N-terminal coiled coil domains from molecular dynamics simulation (Upper) and one-dimensional free energy profile as the function of N-terminal coiled coil domain distance for Apo-STAT6CF (black) and STAT6CF-N4 complex (red), respectively (Lower). The dotted lines in the upper panel show the observed distances, derived from crystal structures of phosphorylated STAT6CF (black) and STAT6CF-N4 complex (red).
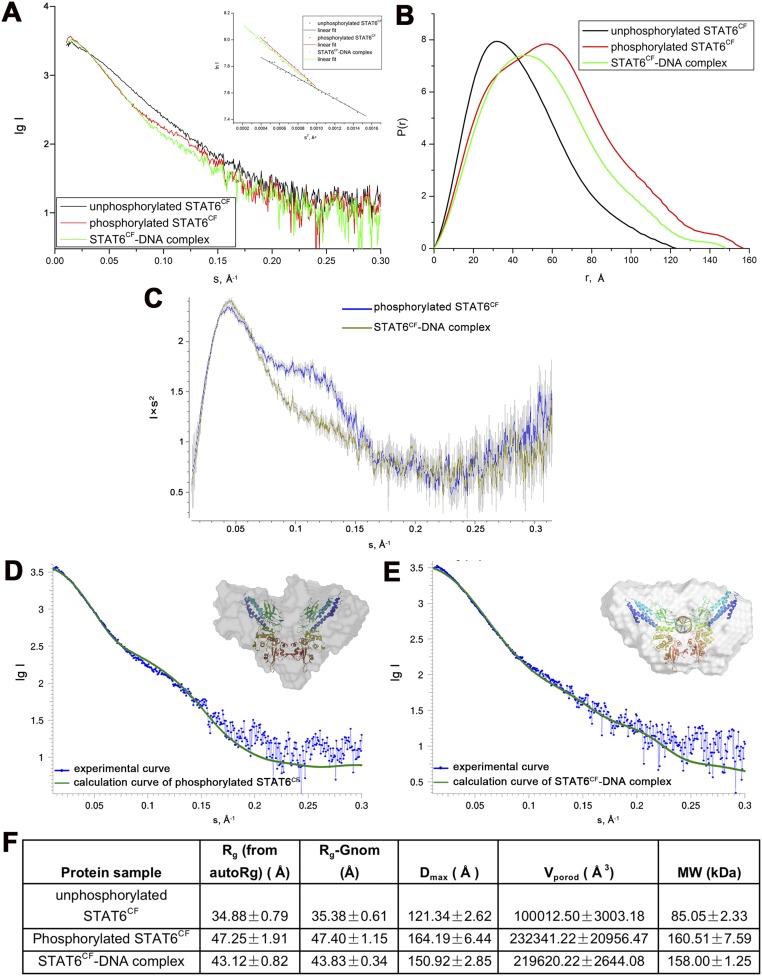
Superposition of the structure of the phosphorylated STAT6CF-N4 site DNA over the structure of STAT1CF-N3 DNA reveals that the overall topology of the members belonging to STAT family is highly conserved, further suggesting that they may share a similar mechanism of DNA recognition (Fig. S4K). We then compared the key residues of STAT6CF and STAT1CF participating in DNA binding. As shown in Fig. 3B, when DBDs are aligned, H415 of STAT6 and its counterpart N460 in STAT1, as well as their interacting bases in respective DNAs, overlap. Interestingly, in the adjacent protomer of the dimer, H415 of STAT6 has moved further inside by a distance of about 4.0 Å than the corresponding equivalent N460 residue in STAT1, which is very close to the regulation of ∼3.4-Å rise/bp along the axis of a B-DNA double helix (Fig. 3B). A similar change in positions of H415 and its equivalent residue is observed between STAT6CF-N4 and -N3 site DNA complexes (Fig. S5E). In addition, we noticed that the residue N417 of STAT6 would sterically clash with the fifth base of DNA, a thiamine, of the complex of STAT1 with the N3 site DNA, which further explains why STAT6 prefers the N4 site DNA but not N3 (Fig. S6B). Furthermore, our small angle X-ray scattering (SAXS) analysis of STAT6CF indicates that the conformation of STAT6CF could be stabilized by DNA (Fig. S7). In addition, molecular dynamics (MD) simulations results indicate the decreased structural flexibility of STAT6CF after DNA binding (SI Results). Thus, the conformation of DNA-bound STAT6CF is stable compared with the unliganded STAT6CF.
Fig. S7.
SAXS analysis of unphosphorylated STAT6CF, phosphorylated STAT6CF, and STAT6CF-N4 complex. Scattering curves (A) and P(r) distribution (B) of unphosphorylated STAT6CF (black), phosphorylated STAT6CF (red), and STAT6CF-N4 complex (green) are indicated. The Inset in A is Guinier plots. (C) Kratky plots. (D and E) Experiential scattering profiles (in blue) of the 2.5 mg/mL phosphorylated STAT6CF (D) and STAT6CF -N4 complex (E) vs. the ideal scattering profiles (in green) of their corresponding crystal structures (phosphorylated STAT6CF, χ2 = 2.089; STAT6CF-N4 complex, χ2 = 1.060, respectively) calculated using CRYSOL (36). Also shown in these figures are the ribbon models of the X-ray crystal structures superposed onto the molecular envelopes based on SAXS data calculated by program DAMMIF (37). These envelopes were calculated from the average of 16 DAMMIF runs with P1 symmetry. The crystal structures were superimposed onto their corresponding envelopes using ref. 38. (F) Parameters derived from SAXS curves.
Mutagenic Analysis of the STAT6 DNA-Binding Surface and Interpretation of Disease-Associated Mutations.
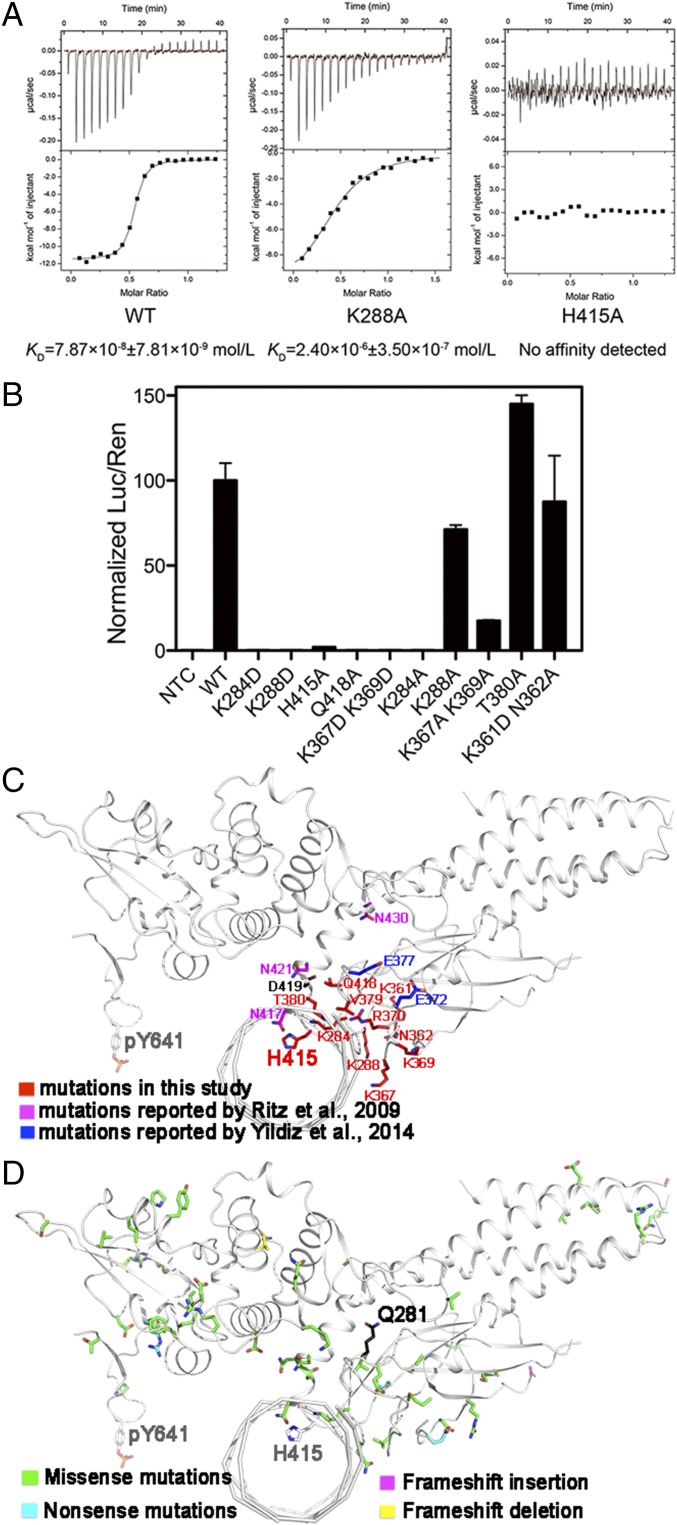
Using the structures of STAT6CF-DNA as a guide, we probed the role of residues located at the protein-DNA interface in binding DNA by mutagenesis. K284D, K288D, K367/369D, H415A, Q418A, K284A, K288A, and K367/369A mutations were introduced in both STAT6CF and STAT6FL. The in vitro affinity of the mutants for DNA was estimated using ITC (Fig. 4A). Most of the mutants of STAT6CF did not bind the CS4 (N4 site DNA), which happens to be the core fragment of DNA used for formation of the STAT6CF-N4 complex for crystallization (20). Only mutants K288A and K367/369A of STAT6CF retained a low affinity of 2.4 and 8 μM, respectively, for the DNA. The WT STAT6CF (STAT6CF-WT) had an affinity of 79 nM for the same DNA when tested under identical conditions (Fig. 4A). We further tested the ability of the STAT6 mutants to recognize DNA in vivo using a luciferase reporter-based assay as described previously (5). Consistent with the results of the in vitro experiments performed using STAT6CF, K288A and K367/369A mutants of STAT6FL exhibited significantly reduced ability to activate the reporter gene (Fig. 4B) compared with WT STAT6FL. As expected, K284D, K288D, K367/369D, H415A, Q418A, and K284A mutants of STAT6FL almost completely lost their ability to activate the reporter gene on stimulation by IL-4 (Fig. 4B). These mutagenesis results confirmed a role for the residues of the DBD of STAT6 in binding DNA and that the protein-DNA interface observed in the crystal structure is functionally relevant.
Fig. 4.
Identification of key residues for DNA binding by mutagenesis. (A) ITC measurements of affinities of STAT6CF-WT (Left), STAT6CF-K288A (Middle), and STAT6CF-H415A (Right) for N4 site DNA (CS4) are shown. (B) The ability of several mutants of STAT6FL to activate gene transcription was assessed. Mean ratio luciferase/renilla light units activities are shown for triplicate samples. Normalized results are presented as percent activity relative to the activity in cells transfected with STAT6FL-WT. (C) The residues (in red) mentioned above for mutagenesis, mutations reported by Ritz et al. (in magenta) (26) and Yildiz et al. (in blue) (22) were mapped on a protomer of STAT6CF-N4 structure (in front view). The key residue Y641 is also shown. (D) Unique mutations from a large-scale cancer genomics dataset analysis in cBioPortal (www.cbioportal.org) web tool are mapped on a protomer of STAT6CF-N4 structure.
We next investigated whether our findings can be used to interpret the disease-associated STAT6 mutations with respect to the STAT6 protein–DNA interaction interface observed in our crystal structures. Recently, several mutations of STAT6 have been identified in follicular lymphoma cases, which include E372K, E377K, D419H, D419A, and D419G (22). Luciferase reporter-based assays and results of quantitative PCR (qPCR) studies have indicated that these mutations could result in an increase in the transactivation of STAT6 (22). Interestingly, mapping of these mutations on our structure of the STAT6CF-N4 complex reveals that they locate on the DNA binding loops (Fig. 4C). Switching E or D to K, H, A, or G could decrease the electro-negativity of the DNA binding interface, enhancing the ability of the protein to bind DNA. In addition, we used the cBioPortal (www.cbioportal.org) web tool to analyze large-scale cancer genomics datasets (23). The results of the analysis identified 165 mutations of STAT6 that affected the pathophysiology of cancer. Of these, 52 unique mutations can be mapped on our STA6CF structures. As shown in Fig. 4D, the majority of these mappable mutations are located on the STAT6 DBD, which is essential for DNA binding, and the dimerization domain (SH2 domain), which is critical for recognizing N4 site DNA due to its flexible nature. This analysis lends further support to previously published studies on STAT6 and other STAT proteins that recommend targeting of STATs with inhibitors for improving outcomes of therapeutic interventions (24, 25).
SI Results
In agreement with crystallographic observations, during SAXS analysis of STAT6CF, the Dmax of STAT6CF decreased from 164.2 to 150.9 Å after binding of DNA. Furthermore, the Rg and Vporod calculated from SAXS data also decreased after DNA binding (Fig. S7), indicating an obvious change in morphology of the STAT6CF dimer induced by DNA binding. Moreover, Kratky plots generated from SAXS data reveal a bump around 0.1 s for STAT6CF compared with the STAT6CF-N4 complex, suggesting that the DNA-free form of phosphorylated STAT6CF is probably more flexible than the STAT6CF-N4 complex in the mid-q region (Fig. S7). This observation also indicates that the conformation of STAT6CF could be stabilized by DNA.
To further investigate the DNA binding dynamics, MD simulations of the STAT6CF-N4 complex and apo STAT6CF (after removal of DNA from the STAT6CF-N4 complex structure) were performed. The total potential energy remained steady during the simulation (Fig. S6 C and D). The stabilized structures from the simulations do not deviate significantly from the respective crystal structures. This observation suggests that the crystal structures could be reasonable representatives of these molecules in their physiological states. Using the distance between two N-terminal coiled coil domains as the reaction coordinate, the one-dimensional free energy profile was calculated. The structure of the apo STAT6CF shows large structural flexibility as revealed by the large distance fluctuation between the apo STAT6CF state and DNA-bound state (Fig. S6 C and D). In contrast, the tendency of protein to undergo conformational change is significantly reduced in the STAT6CF-DNA complex. These simulation results clearly indicate a decreased structural flexibility of STAT6CF after DNA binding. Thus, the crystal structures, SAXS analysis, and MD simulation experiments indicate that the conformation of STAT6CF changes substantially after DNA binding. This conformation of DNA-bound STAT6CF is stable compared with the unliganded STAT6CF.
Discussion
STAT6 exhibits a preference for N4 site DNA during binding of regions of target genes that regulate expression of the protein. In this context, STAT6 is a unique member of STAT family because the other STATs show a preference for binding N3 site DNA. This study sheds light on the determinants of specificity underlying this preferential binding of STAT6 to N4 site DNA. The first crystal structures of phosphorylated STAT6CFdimer and its two complexes with N3 and N4 site DNA unveil the mode of DNA binding by STAT6. We show that both residue H415 and dimer interface confer specificity on STAT6 for binding N4 site DNA. Thus far, except for STAT6, there are no crystal structures of DNA-free phosphorylated dimeric STATs belonging to the mammalian STAT family deposited in PDB. Results of MD and SAXS analysis indicate that STAT6 retains some degree of flexibility after dimerization. The crystal structure of STAT6CFprobably represents a snapshot of one of the dominant conformations assumed by STAT6. These results advance our understanding of the JAK-STAT pathway; in particular, they unveil the molecular mechanisms underlying the recognition and binding of DNAs by an activated phosphorylated STAT6 dimer.
Residue H415 was identified as a critical residue for DNA selection in STAT6. A single mutation, H415N, switched the DNA binding preference of STAT6 from N4 to N3 site DNA. Among the N3 site DNAs tested, the affinity of the H415N mutant for both M67 and T1 increased compared with that of STAT6CF-WT. M67 and T1 have a mismatch (TTCN3TAA) in the palindromic site. Because residue H415 interacts directly with the base G (TTCN3/4GAA) of the palindromic site in the structures of our STAT6CF-DNA complexes, STAT6CF-WT probably has a low tolerance for the mismatch and therefore exhibited lower affinity for these kinds of DNAs. On mutation (H415N), the tolerance of STAT6 for the mismatch increased and therefore the affinities for the DNA increased accordingly. Thus, the H415N mutation decreased the affinity of STAT6 for N4 site DNA, but increased the affinity for N3 site DNA with a mismatch in the palindromic site. Interestingly, another reported functional site residue S407 (5), which is buried and not exposed on the surface of our structures, is not likely to be accessible for phosphorylation by any kinase (SI Discussion, Fig. S8).
Fig. S8.
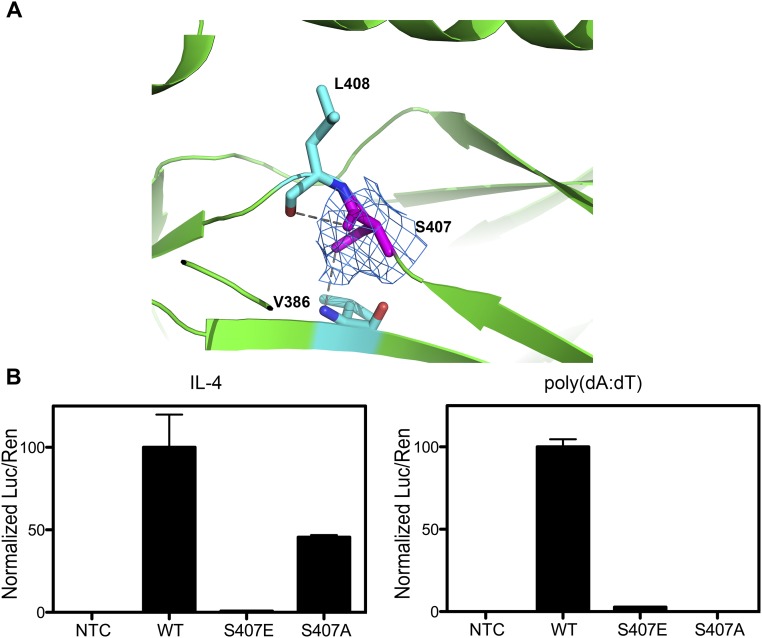
S407 of STAT6 is not accessible for phosphorylation. (A) Side chain of S407 points toward the interior of STAT6 and forms two hydrogen bonds with the residues V386 and L408, which was confirmed by electron density map (2Fo-Fc), contoured at 1.0 σ, of S407. (B) HEK 293T cells were transfected with a 4 × STAT6 luciferase (Luc) reporter, renilla (Ren) reporter, and pcDNA3.1 empty (NTC), STAT6FL-WT, STAT6FL-S407E, or STAT6FL-S407A. After 24 h, cells were stimulated with IL-4 (10 ng/mL) or transfected with poly(dA:dT) (2 μg/μL) for 2 h. Mean ratio luciferase/renilla light units activity is shown for triplicate samples. Normalized results are presented as percent activity relative to the activity in cells transfected with STAT6FL-WT.
In summary, crystal structures of phosphorylated STAT6CF dimer and its two complexes with N4 and N3 site DNAs clarify the differences in DNA binding and substrate specificities between STAT6 and other STATs. A remarkable conformational change is first observed on DNA binding. The dimer interface and residue H415 were identified as important factors for distinguishing N4 from N3 site DNA. These findings enhance our understanding of the STAT–DNA interactions that are crucial for the transcription of specific genes on activation of STATs via phosphorylation. The studies also open up avenues for targeting aberrant STAT6-mediated signaling for development of therapeutics against diseases like asthma and cancer.
SI Discussion
In the crystal structure of the STAT6CF-DNA complex, two molecules of STAT6CF form a homotypic dimer to bind one duplex of DNA. Each protomer of STAT6 within a dimer binds half of the palindromic DNA. However, the DNA sequences used for crystallization are not palindromic in a strict sense. Consequently, there is a possibility that the DNAs may have gotten packed in random orientations similar to the crystallographic average observed in STAT1CF-DNA and STAT3CF-DNA complex structures (9, 10). In our particular case, the moderate resolution of the two protein-DNA complexes limits us from drawing similar conclusions. However, this ambiguity does not impair the interpretation of the structures. Most of the interactions during DNA binding occur between STAT6 and the sugar-phosphate backbone. Only one interaction of STAT6 with G14 (N4 site)/G13 (N3 site) is directed toward a base. Incidentally, this base is located within the palindromic region.
Recently, STAT6 was shown to participate in immune responses initiated by host cells during viral infections. TBK1 was shown to phosphorylate S407 of the DBD of STAT6 (5). However, our crystal structures of STAT6 reveal that S407 is buried and not exposed on the surface. Specifically, the side chain of S407 points toward the interior of the protein and forms two hydrogen bonds with its neighboring residues V386 and L408 (Fig. S8A). The location and conformation of S407, as well as the microenvironment around it, are highly conserved in all of the STAT structures reported thus far (PDB ID codes 1BF5, 1BG1, 1Y1U, 1YVL, 3CWG, and 4E68). Therefore, residue S407 is not likely to be accessible for phosphorylation by any kinase in the conformations of the protein observed in the crystal structures. Furthermore, the results from a luciferase reporter-based assay result demonstrated that a S407E mutation in STAT6, which was generated to simulate the phosphorylated state, compromised the ability of STAT6 to activate the reporter gene in both IL-4 and antiviral signaling pathways. Another mutant of STAT6, S407A, retains only partially the ability of the WT protein to activate the reporter gene in an IL-4–dependent manner (Fig. S8B). S407E and S407A mutations of STAT6CF are insoluble when expressed using the E. coli-based expression system, limiting any further structural and biochemical characterization of these mutations. Perhaps, the S407 mutants of STAT6 may have lost their function due to misfolding of the protein. Analysis of the structures of STAT proteins indicates that if S407 is indeed phosphorylated during the antiviral response, the DNA-binding domain would have to undergo a large conformational change to bring S407 to the surface so that it could be accessed by a kinase. Given the conformational diversity of STAT proteins, this could be possible. Further structural and biochemical studies are required to shed more light on role of additional phosphorylation sites of STAT6.
Materials and Methods
Detailed discussion of materials and methods is given in SI Materials and Methods.
Phosphorylation of the protein was achieved by coexpressing STAT6CF with the tyrosine kinase receptor domain of Elk in the Escherichia coli BL21 (DE3) TKB1 strain (Agilent Technology) as described previously (17). Soluble recombinant protein was isolated and purified. The protein were pooled and concentrated for crystallization and other experiments. Unphosphorylated STAT6CF and STAT1CF (aa 132–713) were purified using the same procedures as described for phosphorylated STAT6CF. All of the STAT6CF-DNA complexes crystals were obtained by incubating the purified phosphorylated STAT6CF with annealed oligonucleotide duplexes at a molar ratio of 1:1.2 for 1 h in an ice bath. Phosphorylated STAT6CF in complex with the 22-bp N4 site duplex and 21-bp N3 site duplex formed crystals that were suitable for data collection. Crystals were frozen before data collection. Datasets were indexed, integrated, and scaled using HKL2000. All three structures were determined by molecular replacement (MR) method. The details of data collection and refinement statistics are listed in Table S3.
SI Materials and Methods
Protein Expression and Purification.
The human STAT6CF (aa 123–658) was cloned into the pMCSG7 expression vector using the ligation-independent cloning method as described previously (27, 28). In brief, the clone expressed STAT6CF with an N-terminal 6x His-tag. Phosphorylation of the protein was achieved by coexpressing STAT6CF with the tyrosine kinase receptor domain of Elk in the E. coli BL21 (DE3) TKB1 strain (Agilent Technology) as described previously (17, 18). Harvested cells were suspended in PBS and lysed by ultrasonication. Soluble recombinant protein present in the clarified supernatant was isolated and purified using a Ni-NTA column (Qiagen) followed by further purification using a heparin column. The phosphorylated protein was eluted from the heparin column with ∼400 mM NaCl and then incubated with TEV protease overnight at 16 °C to remove the His-tag. The tag-less protein was loaded on a Superdex S200 column (GE Healthcare) equilibrated with 20 mM Hepes (pH 7.0), 200 mM NaCl, 0.5 mM EDTA, 10 mM MgCl2, and 4 mM DTT (Fig. S3A). Pure, phosphorylated STAT6CF eluted in a single peak. Fractions containing the protein were pooled and concentrated for crystallization and other experiments. Unphosphorylated STAT6CF was overexpressed in E. coli BL21 (DE3) and purified by Ni2+ affinity chromatography followed by gel filtration chromatograph using the same procedures as described for phosphorylated STAT6CF. The phosphorylated core fragment of human STAT1 (aa 132–713, STAT1CF) was cloned, expressed, and purified using the same protocols as described for phosphorylated STAT6CF.
Crystallization.
Phosphorylated STAT6CF was concentrated to 20 mg/mL. The protein concentration was estimated using a NanoDrop 2000 machine (Thermo Scientific). Phosphorylated STAT6CF was screened for crystallization using commercially available sparse matrix screens. Crystallization drops containing protein and precipitant (1:1 ratio) were dispensed by a Mosquito robot (TTP LabTech). Optimization of the crystals was performed manually in hanging drops containing 1.0 μL protein mixed with 1.0 μL mother liquor. Crystals for data collection were grown in 0.1 M imidazole (pH 7.5), 0.2 M Li2SO4, and 12% (wt/vol) PEG3000.
Single-stranded DNAs used in the study were chemically synthesized by Sangon Biotech. Double-stranded DNAs were produced by annealing. Nucleic acids were dissolved in the gel filtration chromatography buffer. All of the STAT6CF-DNA complexes were obtained by incubating the purified phosphorylated STAT6CF (10 mg/mL) with annealed oligonucleotide duplexes at a molar ratio of 1:1.2 for 1 h in an ice bath. A variety of DNAs of different lengths were used for formation of protein-DNA complexes. These complexes were screened for crystallization. Phosphorylated STAT6CF in complex with the 22-bp N4 site duplex and 21-bp N3 site duplex formed crystals that were suitable for data collection. Crystals of both the complexes were grown in 0.1 M citrate (pH 5.6), 0.1 M NaCl, 20% (vol/vol) isopropyl alcohol, and 8% (wt/vol) PEG4000.
Data Collection and Structure Determination.
All crystals were harvested, cryoprotected in the mother liquor containing an additional 25% (vol/vol) glycerol, and then flash-frozen at 100 K in liquid nitrogen. The diffraction data for STAT6CF were collected on beamline BL17U1 at the Shanghai Synchrotron Radiation Facility (SSRF). The data for the STAT6CFand N4 site DNA complex (STAT6CF-N4 complex) were collected on beamline BL19U of SSRF. The data for STAT6CF and N3 site DNA complex (STAT6CF-N3 complex) were collected on beamline 23ID-C of the General Medical Sciences and Cancer Institutes Structural Biology Facility–Collaborative Access Team (GM/CA-CAT), Argonne National Laboratory. All datasets were indexed, integrated, and scaled using HKL2000 software package (29). All three structures were determined by MR. The structure of STAT6CF was solved first using the structure of mouse STAT5 (PDB ID code 1Y1U) as the search model during MR (13). Subsequent structures of the two complexes of STAT6CF with DNA were solved by MR using our own STAT6CF structure as the search model. All three structures were manually improved in Coot (30). Refinement for each structure was carried out using Phenix Refine (31), alternately. The details of data collection and refinement statistics are listed in Table S3.
ITC.
ITC measurements were performed on an iTC200 calorimeter (Microcal). All experiments were carried out in the buffer containing 20 mM Hepes (pH 7.0), 200 mM NaCl, 10 mM MgCl2, 4 mM DTT, and 0.5 mM EDTA at 25 °C. Phosphorylated STAT6CF and its mutants were placed into the sample chamber, and different DNAs were added using the syringe with 20 successive additions of 2 μL for 4 s (the first injection was 0.5 μL), and the injection interval was 120 s. The data analysis was performed using ORIGIN software (Microcal).
SPR Assay.
The interactions between STAT1CF or STAT6CF and DNAs were further explored using Biacore 3000 at 25 °C. Running buffer was composed of 20 mM Hepes (pH 7.0), 150 mM NaCl, 1 mM MgCl2, and 0.1% Tween-20. DNAs labeled with biotin at the 5′ end were immobilized onto two ligand channels of a SA sensor chip (GE Healthcare) with ∼50 RU each. First, we made a blank injection of the running buffer, followed by injections of the proteins at different concentrations (0.625 nM to 5.12 μM) in the running buffer at a flow rate of 30 μL/min for 60 s. Each injection was followed by 120-s disassociation and 15-s regeneration with 0.1% SDS. The sensorgrams obtained were fit simultaneously after subtracting a reference blank of running buffer using Biacore 3000 evaluation software to obtain on (Ka) and off (Kd) rates. The kinetic KD was calculated based on the on and off rates. An equilibrium analysis of the data was also performed to calculate the KD.
Dual Luciferase Assay.
Full-length STAT6 (STAT6FL) with an N-terminal Flag-tag was cloned into pCDNA3.1/hygro(−) vector between the XhoI and KpnI restriction sites. HEK293T cells were transfected using Polyethylenimine (PEI) with p4×STAT6-Luc2P (a STAT6-Firefly luciferase plasmid purchased from Addgene; 35554) along with renilla-luciferase plasmid as a transfection control and WT or mutated STAT6FL plasmids. The STAT6FL-Firefly luciferase plasmid contains four copies of the STAT6 N4 site response element 5′-TTCccaaGAA-3′. An N3 site response element 5′-TTCcaaGAA-3′ was obtained through site-directed mutagenesis. The lowercase letters for sequences indicate the spacer sequences between the consensus sequences. Cells were treated 24 h after transfection with IL-4 (10 ng/mL) or transfected with Poly(dA:dT) (Invivogen) by Lipofectamine 2000 (2 μg/μL) for 2 h. Cell lysates were collected and analyzed using the Promega Dual-Luciferase Reporter Assay System (32). Mean ratio luciferase/renilla light unit activities are shown for triplicate samples.
AUC.
Analytical sedimentation velocity experiments were conducted using a ProteomeLab XL-I system (Beckman Coulter) according to our previous report (32). Briefly, an An-60Ti rotor was used to centrifuge protein samples suspended in 20 mM Hepes (pH 7.0), 200 mM NaCl, 0.5 mM EDTA, 10 mM MgCl2, and 4 mM DTT. Unphosphorylated STAT6CF was centrifuged at 55,000 rpm with an A280nm of ∼0.7, whereas phosphorylated STAT6CF and the STAT6CF-N4 complex were centrifuged at 30,000 rpm with an A280nm of ∼0.7. A set of 93 scans was collected at 1-min intervals. Sedfit software was used for size distribution analysis with a continuous c(s) distribution model with the default parameters. After interpretation and refinement of the results, the distribution was displayed and exported with a confidence level (F-ratio) of 0.9. The molecular weights (MWs) of the globular proteins were obtained by converting the S values with the f/f0 ratio in Sedfit. The percentage distribution of each peak was obtained by S peak integration in Sedfit.
Mutagenesis.
Mutagenesis was performed using a QuikChange site-directed mutagenesis kit following the manufacturer’s instructions (Agilent Technology). All of the recombinant plasmids were sequenced to verify the clones. Mutants were overexpressed and purified following the same procedures as described for the phosphorylated STAT6CF.
TSA.
TSA was conducted using 0.05 mg/mL STAT6CF with or without 50 μM N4 site DNA (CS4) in 20 mM Hepes (pH 7.0), 200 mM NaCl, 10 mM MgCl2, 4 mM DTT, and 0.5 mM EDTA supplemented with a 1,000 dilution of SYPRO Orange dye (Invitrogen). The experimental procedure and data analysis are the same as previously described (28).
SAXS.
SAXS data for unphosphorylated STAT6CF, phosphorylated STAT6CF, and its complex with N4 site DNA were collected on the beam line 12.3.1 at the Advanced Light Source (ALS), Lawrence Berkeley National Laboratory, and the data were treated as previously described (28, 33, 34). Each sample was measured at three exposures (0.5, 1.0, and 2.0 s) at 10 °C and three concentrations (2.5, 5.0, and 10.0 mg/mL) in a buffer composed of 20 mM Hepes (pH 7.0), 200 mM NaCl, 0.5 mM EDTA, 10 mM MgCl2, and 4 mM DTT. The scattering intensity I (Q) was measured for s values (s = 4πsinθ/λ, where 2θ is the scattering angle) ranging from 0.01 to 0.3 Å−1. The data were integrated, scaled, and buffer subtracted to obtain the standard scattering curves. Scattering carves at concentration of 2.5 mg/mL and at exposure time of 0.5 s were used for further calculation. The initial Rg values from the Guinier plot analysis, pair distance distribution function, P(r), curves, and the MWs were calculated as described in ref. 34.
MD Simulation.
All of the simulations were performed by GROMACS 1.4.9. In the simulation system, counter ions were added for charge neutralization. To prepare for the simulations, the system temperature was increased from 0 to 300 K in 5 ns with harmonic restraints on the protein and N4 site DNA, followed by several nanoseconds of equilibration. The temperature was kept close to 300 K by using a V-rescale thermostat, whereas the pressure was maintained at 1 bar using the Berendsen barostat method. The particle Mesh Ewald (PME) algorithm was applied to calculated electrostatic interaction. The Linear Constraint Solver (LINCS) was used to restrain the bond lengths.
The principal component analysis (PCA) was carried out to address the collective motions of STAT6 protein by using the positional covariance matrix C of the atomic coordinates and its eigenvectors. The elements of the positional covariance matrix C are defined by the following equation:
| [1] |
where is the Cartesian coordinate of the ith Cα atom, N is the number of Cα atoms considered, and represents the time average over all of the configurations obtained in the simulation.
Statistical Analysis.
The significance of differences between groups exhibiting similar variance was evaluated using the Student t test.
Supplementary Material
Acknowledgments
We thank the staff at Synchrotron Beamlines (17U1 and 19U of SSRF, 5.0.1 and 12.3.1 of Advanced Light Source, and 23ID-C of the General Medical Sciences and Cancer Institutes Structural Biology Facility–Collaborative Access Team) for technical support and Y. Han, Y. Wang, P. Xue, and Y. Y. Chen (Protein Science Core Facility of Institute of Biophysics) for technical help with initial X-ray diffraction studies, automated protein crystallization, MS, and surface plasmon resonance assay experiments, respectively. This work was supported by National Natural Science Foundation of China Grants 31570875, 31330019, and 81590761; Ministry of Science and Technology of China Grants 2014CB910400 and 2013CB911103); Beijing Nova Program Grant Z141102001814020, and Youth Innovation Promotion Association Chinese Academy of Sciences Grant 2013065 (to S.O.).
Footnotes
The authors declare no conflict of interest.
This article is a PNAS Direct Submission.
Data deposition: Atomic coordinates and structure factors have been deposited in the Protein Data Bank, www.pdb.org (PDB ID codes 4Y5U, 4Y5W, and 5D39).
This article contains supporting information online at www.pnas.org/lookup/suppl/doi:10.1073/pnas.1611228113/-/DCSupplemental.
References
- 1.Abroun S, et al. STATs: An old story, yet mesmerizing. Cell J. 2015;17(3):395–411. doi: 10.22074/cellj.2015.1. [DOI] [PMC free article] [PubMed] [Google Scholar]
- 2.Lai PS, et al. A STAT inhibitor patent review: Progress since 2011. Expert Opin Ther Pat. 2015;25(12):1397–1421. doi: 10.1517/13543776.2015.1086749. [DOI] [PubMed] [Google Scholar]
- 3.Miklossy G, Hilliard TS, Turkson J. Therapeutic modulators of STAT signalling for human diseases. Nat Rev Drug Discov. 2013;12(8):611–629. doi: 10.1038/nrd4088. [DOI] [PMC free article] [PubMed] [Google Scholar]
- 4.Takeda K, et al. Essential role of Stat6 in IL-4 signalling. Nature. 1996;380(6575):627–630. doi: 10.1038/380627a0. [DOI] [PubMed] [Google Scholar]
- 5.Chen H, et al. Activation of STAT6 by STING is critical for antiviral innate immunity. Cell. 2011;147(2):436–446. doi: 10.1016/j.cell.2011.09.022. [DOI] [PubMed] [Google Scholar]
- 6.Seidel HM, et al. Spacing of palindromic half sites as a determinant of selective STAT (signal transducers and activators of transcription) DNA binding and transcriptional activity. Proc Natl Acad Sci USA. 1995;92(7):3041–3045. doi: 10.1073/pnas.92.7.3041. [DOI] [PMC free article] [PubMed] [Google Scholar]
- 7.Weirauch MT, et al. Determination and inference of eukaryotic transcription factor sequence specificity. Cell. 2014;158(6):1431–1443. doi: 10.1016/j.cell.2014.08.009. [DOI] [PMC free article] [PubMed] [Google Scholar]
- 8.Moucadel V, Constantinescu SN. Differential STAT5 signaling by ligand-dependent and constitutively active cytokine receptors. J Biol Chem. 2005;280(14):13364–13373. doi: 10.1074/jbc.M407326200. [DOI] [PubMed] [Google Scholar]
- 9.Becker S, Groner B, Müller CW. Three-dimensional structure of the Stat3beta homodimer bound to DNA. Nature. 1998;394(6689):145–151. doi: 10.1038/28101. [DOI] [PubMed] [Google Scholar]
- 10.Chen X, et al. Crystal structure of a tyrosine phosphorylated STAT-1 dimer bound to DNA. Cell. 1998;93(5):827–839. doi: 10.1016/s0092-8674(00)81443-9. [DOI] [PubMed] [Google Scholar]
- 11.Nkansah E, et al. Observation of unphosphorylated STAT3 core protein binding to target dsDNA by PEMSA and X-ray crystallography. FEBS Lett. 2013;587(7):833–839. doi: 10.1016/j.febslet.2013.01.065. [DOI] [PubMed] [Google Scholar]
- 12.Mao X, et al. Structural bases of unphosphorylated STAT1 association and receptor binding. Mol Cell. 2005;17(6):761–771. doi: 10.1016/j.molcel.2005.02.021. [DOI] [PubMed] [Google Scholar]
- 13.Neculai D, et al. Structure of the unphosphorylated STAT5a dimer. J Biol Chem. 2005;280(49):40782–40787. doi: 10.1074/jbc.M507682200. [DOI] [PubMed] [Google Scholar]
- 14.Ren Z, et al. Crystal structure of unphosphorylated STAT3 core fragment. Biochem Biophys Res Commun. 2008;374(1):1–5. doi: 10.1016/j.bbrc.2008.04.049. [DOI] [PubMed] [Google Scholar]
- 15.Vinkemeier U, et al. DNA binding of in vitro activated Stat1 alpha, Stat1 beta and truncated Stat1: Interaction between NH2-terminal domains stabilizes binding of two dimers to tandem DNA sites. EMBO J. 1996;15(20):5616–5626. [PMC free article] [PubMed] [Google Scholar]
- 16.Chatterjee-Kishore M, Wright KL, Ting JP, Stark GR. How Stat1 mediates constitutive gene expression: A complex of unphosphorylated Stat1 and IRF1 supports transcription of the LMP2 gene. EMBO J. 2000;19(15):4111–4122. doi: 10.1093/emboj/19.15.4111. [DOI] [PMC free article] [PubMed] [Google Scholar]
- 17.Becker S, Corthals GL, Aebersold R, Groner B, Müller CW. Expression of a tyrosine phosphorylated, DNA binding Stat3beta dimer in bacteria. FEBS Lett. 1998;441(1):141–147. doi: 10.1016/s0014-5793(98)01543-9. [DOI] [PubMed] [Google Scholar]
- 18.Baudin F, Müller CW. Bacterial expression, purification, and crystallization of tyrosine phosphorylated STAT proteins. Methods Mol Biol. 2013;967:301–317. doi: 10.1007/978-1-62703-242-1_21. [DOI] [PubMed] [Google Scholar]
- 19.Mikita T, Daniel C, Wu P, Schindler U. Mutational analysis of the STAT6 SH2 domain. J Biol Chem. 1998;273(28):17634–17642. doi: 10.1074/jbc.273.28.17634. [DOI] [PubMed] [Google Scholar]
- 20.Ehret GB, et al. DNA binding specificity of different STAT proteins. Comparison of in vitro specificity with natural target sites. J Biol Chem. 2001;276(9):6675–6688. doi: 10.1074/jbc.M001748200. [DOI] [PubMed] [Google Scholar]
- 21.Ohmori Y, Hamilton TA. Interleukin-4/STAT6 represses STAT1 and NF-kappa B-dependent transcription through distinct mechanisms. J Biol Chem. 2000;275(48):38095–38103. doi: 10.1074/jbc.M006227200. [DOI] [PubMed] [Google Scholar]
- 22.Yildiz M, et al. Activating STAT6 mutations in follicular lymphoma. Blood. 2015;125(4):668–679. doi: 10.1182/blood-2014-06-582650. [DOI] [PMC free article] [PubMed] [Google Scholar]
- 23.Cerami E, et al. The cBio cancer genomics portal: An open platform for exploring multidimensional cancer genomics data. Cancer Discov. 2012;2(5):401–404. doi: 10.1158/2159-8290.CD-12-0095. [DOI] [PMC free article] [PubMed] [Google Scholar]
- 24.Furqan M, et al. STAT inhibitors for cancer therapy. J Hematol Oncol. 2013;6:90. doi: 10.1186/1756-8722-6-90. [DOI] [PMC free article] [PubMed] [Google Scholar]
- 25.Mandal PK, et al. Targeting the Src homology 2 (SH2) domain of signal transducer and activator of transcription 6 (STAT6) with cell-permeable, phosphatase-stable phosphopeptide mimics potently inhibits Tyr641 phosphorylation and transcriptional activity. J Med Chem. 2015;58(22):8970–8984. doi: 10.1021/acs.jmedchem.5b01321. [DOI] [PMC free article] [PubMed] [Google Scholar]
- 26.Ritz O, et al. Recurrent mutations of the STAT6 DNA binding domain in primary mediastinal B-cell lymphoma. Blood. 2009;114(6):1236–1242. doi: 10.1182/blood-2009-03-209759. [DOI] [PMC free article] [PubMed] [Google Scholar]
- 27.Stols L, et al. New vectors for co-expression of proteins: Structure of Bacillus subtilis ScoAB obtained by high-throughput protocols. Protein Expr Purif. 2007;53(2):396–403. doi: 10.1016/j.pep.2007.01.013. [DOI] [PubMed] [Google Scholar]
- 28.Niu F, et al. Structure of the Leanyer orthobunyavirus nucleoprotein-RNA complex reveals unique architecture for RNA encapsidation. Proc Natl Acad Sci USA. 2013;110(22):9054–9059. doi: 10.1073/pnas.1300035110. [DOI] [PMC free article] [PubMed] [Google Scholar]
- 29.Otwinowski Z, Minor W. Processing of X-ray diffraction data collected in oscillation mode. Macromol Crystallogr Pt A. 1997;276:307–326. doi: 10.1016/S0076-6879(97)76066-X. [DOI] [PubMed] [Google Scholar]
- 30.Emsley P, Lohkamp B, Scott WG, Cowtan K. Features and development of Coot. Acta Crystallogr D Biol Crystallogr. 2010;66(Pt 4):486–501. doi: 10.1107/S0907444910007493. [DOI] [PMC free article] [PubMed] [Google Scholar]
- 31.Adams PD, et al. PHENIX: A comprehensive Python-based system for macromolecular structure solution. Acta Crystallogr D Biol Crystallogr. 2010;66(Pt 2):213–221. doi: 10.1107/S0907444909052925. [DOI] [PMC free article] [PubMed] [Google Scholar]
- 32.Ouyang S, et al. Structural analysis of the STING adaptor protein reveals a hydrophobic dimer interface and mode of cyclic di-GMP binding. Immunity. 2012;36(6):1073–1086. doi: 10.1016/j.immuni.2012.03.019. [DOI] [PMC free article] [PubMed] [Google Scholar]
- 33.Hura GL, et al. Robust, high-throughput solution structural analyses by small angle X-ray scattering (SAXS) Nat Methods. 2009;6(8):606–612. doi: 10.1038/nmeth.1353. [DOI] [PMC free article] [PubMed] [Google Scholar]
- 34.Jiao L, et al. Structure of severe fever with thrombocytopenia syndrome virus nucleocapsid protein in complex with suramin reveals therapeutic potential. J Virol. 2013;87(12):6829–6839. doi: 10.1128/JVI.00672-13. [DOI] [PMC free article] [PubMed] [Google Scholar]
- 35.Liu T, et al. Cistrome: An integrative platform for transcriptional regulation studies. Genome Biol. 2011;12(8):R83. doi: 10.1186/gb-2011-12-8-r83. [DOI] [PMC free article] [PubMed] [Google Scholar]
- 36.Svergun D, Barberato C, Koch M. CRYSOL-a program to evaluate X-ray solution scattering of biological macromolecules from atomic coordinates. J Appl Cryst. 1995;28(6):768–773. [Google Scholar]
- 37.Franke D, Svergun DI. DAMMIF, a program for rapid ab-initio shape determination in small-angle scattering. J Appl Cryst. 2009;42(Pt 2):342–346. doi: 10.1107/S0021889809000338. [DOI] [PMC free article] [PubMed] [Google Scholar]
- 38.Kozin MB, Svergun DI. Automated matching of high-and low-resolution structural models. J Appl Cryst. 2001;34(1):33–41. [Google Scholar]
Associated Data
This section collects any data citations, data availability statements, or supplementary materials included in this article.


