Abstract
Differential expression (DE) analysis is commonly used to identify biomarker candidates that have significant changes in their expression levels between distinct biological groups. One drawback of DE analysis is that it only considers the changes on single biomolecule level. Recently, differential network (DN) analysis has become popular due to its capability to measure the changes on biomolecular pair level. In DN analysis, network is typically built based on correlation and biomarker candidates are selected by investigating the network topology. However, correlation tends to generate over-complicated networks and the selection of biomarker candidates purely based on network topology ignores the changes on single biomolecule level. In this paper, we propose a novel approach, INDEED, that builds sparse differential network based on partial correlation and integrates DE and DN analyses for biomarker discovery. We applied this approach on real proteomic and glycomic data generated by liquid chromatography coupled with mass spectrometry for hepatocellular carcinoma (HCC) biomarker discovery study. For each omic data, we used one dataset to select biomarker candidates, built a disease classifier and evaluated the performance of the classifier on an independent dataset. The biomarker candidates, selected by INDEED, were more reproducible across independent datasets, and led to a higher classification accuracy in predicting HCC cases and cirrhotic controls compared with those selected by separate DE and DN analyses. INDEED also identified some candidates previously reported to be relevant to HCC, such as intercellular adhesion molecule 2 (ICAM2) and c4b-binding protein alpha chain (C4BPA), which were missed by both DE and DN analyses. In addition, we applied INDEED for survival time prediction based on transcriptomic data acquired by analysis of samples from breast cancer patients. We selected biomarker candidates and built a regression model for survival time prediction based on a gene expression dataset and patients’ survival records. We evaluated the performance of the regression model on an independent dataset. Compared with the biomarker candidates selected by DE and DN analyses, those selected through INDEED led to more accurate survival time prediction.
Keywords: Differential expression analysis, differential network analysis, transcriptomics, proteomics, glycomics
1 Introduction
Recent advances in high-throughput technique enable the generation of a large amount of omic data such as genomics, transcriptomics, proteomics, metabolomics, glycomics, etc. These data have been investigated to understand the mechanism of diseases or discover biomarkers. Typically, differential expression (DE) analysis (e.g., student’s t-test, ANOVA, etc.) is performed to identify biomolecules (e.g., genes, proteins, metabolites, glycans, etc.) with significant changes in their expression levels between distinct biological groups (e.g., cases vs. controls, treated and untreated samples, etc.). However, DE analysis on independent studies for the same clinical types of patients often led to different sets of significant biomolecules and had only few in common [1]. This may be attributed to the fact that biomolecules are members of strongly intertwined biological pathways and highly interactive with each other. Without considering the interactions between them, DE analysis could lead to misleading results [2].
Network-based methods are useful to study the interactions among biomolecules [3–6]. A network is constructed with nodes representing biomolecules and edges indicating the interactions between them. There has been a growing interest in differential network (DN) analysis recently [7–9]. In a differential network, the connection represents a statistically significant change in the pairwise association between two biomolecules on distinct groups. Its goal is to identify sub-networks (i.e., connected biomolecules) that are dysfunctional in a given disease state. The conventional way to measure the pairwise association is based on correlation. A drawback for using correlation is that correlation confounds direct and indirect associations [10]. For example, a strong correlation between x1 and x2 as well as x2 and x3 (direct associations) is very likely to introduce a relatively weak but still significantly strong correlation between x1 and x3 (indirect association). When the number of biomolecules is large, correlation tends to generate over-complicated networks, impacting the selection of reliable biomarker candidates in the subsequent analysis. Therefore, refined measurements that can distinguish direct and indirect associations are desirable in generating a sparse differential network that can benefit both network visualization and biomarker discovery.
Given a differential network, a straightforward way to select biomarker candidates is based on node degree (i.e., the number of connections for each node) [11]. The assumption is that biomolecules that have a strongly altered connectivity between distinct biological groups might play an important role in the disease under study [12]. While the underlying assumption seems reasonable, this simple method does not consider the changes on expression levels of individual biomolecules between distinct biological groups. In fact, DE and DN analyses investigate omic data from two separate but complementary perspectives: the former focuses on the change of single biomolecule in its mean expression level while the latter concentrates on the change in pairwise association for a biomolecular pair. Therefore, an approach that can integrate DE and DN analyses is likely to discover more reliable biomarkers by considering the difference between distinct biological groups on both single biomolecule and biomolecular pair levels.
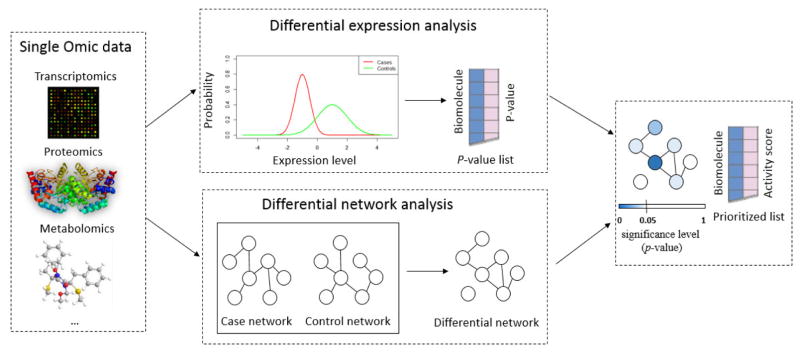
In this paper, we propose a novel approach, INDEED (INtegrated DiffErential Expression and Differential network analysis), to integrate DE and DN analyses for biomarker discovery (Figure 1). Given an omic dataset, DE analysis is first performed to obtain p-value, which indicates the change of single biomolecule between distinct biological groups. Then, a differential network is built based on partial correlation, which can distinguish between direct and indirect associations when evaluating the change of pairwise association on a biomolecular pair between distinct biological groups. Activity scores are computed based on p-values and the topology of the differential network. Finally, biomolecules are prioritized by their activity scores for biomarker candidate selection. We show the application of INDEED through proteomic and glycomic data we previously acquired in our liver cancer biomarker discovery studies [13, 14]. We also apply INDEED on transcriptomic data we downloaded from online repository for breast cancer study [15, 16].
Figure 1.
An overview of INDEED. The input is data matrix of one omic type (e.g., transcriptomics, proteomics, metabolomics) and the output is a prioritized list based on the activity score defined within INDEED.
The rest of the paper is organized as follows. Section 2 introduces INDEED. Section 3 presents the performance of INDEED on real proteomic, glycomic, and transcriptomic data. Finally, Section 4 summarizes our work and discusses possible future extensions.
2 Material and methods
2.1 INDEED
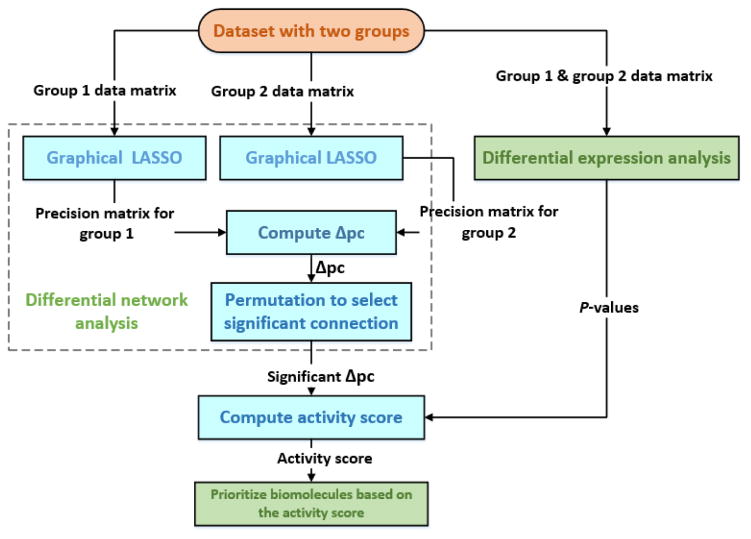
Figure 2 shows the framework of INDEED. It includes four steps: 1), performing DE analysis to obtain p-value for each biomolecule; 2), building a differential network by evaluating the changes in partial correlation for each biomolecular pair between distinct biological groups; 3), computing the activity score for each biomolecule based on p-values from DE analysis and the topology of the differential network; 4), prioritizing the biomolecules with the activity score.
Figure 2.
The framework of INDEED. In differential network analysis, the network is built based on partial correlation (pc).
Specifically, in step 1, DE analysis is typically performed through student’s t-test, ANOVA, logistic regression or LASSO based method. Its aim is to detect the change in the expression level (i.e., p-value) of a single biomolecule between distinct biological groups.
In step 2, we build a differential network. Unlike the conventional way of using correlation to measure the pairwise association, we can obtain a sparse differential network by using partial correlation. This is due to the fact that conventional correlation confounds direct and indirect associations, while partial correlation can remove the effect of other biomolecules when evaluating a biomolecular pair [10, 17]. While correlation can be computed from covariance matrix, partial correlation can be computed from inverse covariance matrix (i.e., precision matrix Θ) as shown in Equation 1 [10].
| (1) |
where pcij represents the partial correlation between xi and xj, and θij ∈ Θ.
Due to the ‘large p small n’ problem in omic data, the precision matrix Θ is non-trivial to compute since the covariance matrix is singular. Graphical LASSO algorithm is widely used to efficiently estimate Θ by solving the following optimization problem shown in Equation 2 [18, 19].
| (2) |
where Θ ≻ 0 is the constraint that Θ has to be positive definite, S is the sample covariance matrix, tr denotes trace, the sum of the diagonal elements in a matrix, ||Θ||1 represents the ℓ1 norm of Θ, the sum of the absolute values of all the elements in Θ, and λ is the tuning parameter controlling the sparsity of Θ.
We perform graphical LASSO on distinct biological groups to obtain group-specific precision matrices (i.e., Θ1 and Θ2). The sparsity parameters λ1 and λ2 in graphical LASSO as shown in Equations 3-1 and 3-2 are tuned by cross validation using one standard error rule. By applying one standard error rule, we can achieve the simplest (most regularized) model whose error is within one standard deviation of the minimal error. Based on our experience, other techniques such as Akaike information criterion (AIC), Bayesian information criterion (BIC), and stability selection [20], are either prone to data under-fitting, leading to very large λ (e.g., AIC, BIC) or computationally very intensive (e.g., stability selection).
| (3-1) |
| (3-2) |
From the group-specific precision matrices Θ1 and Θ2, we compute the partial correlation for each biomolecular pair in distinct biological groups and as shown in Equation 4 [10].
| (4) |
The change for each biomolecular pair in partial correlations between distinct biological groups is calculated as shown in Equation 5.
| (5) |
To evaluate the statistical significance of Δpcij ≠ 0, we conduct a permutation test by randomly permuting the sample labels in distinct biological groups for each biomolecule, applying graphical LASSO under the same sparsity parameters previously used λ̃1 = λ1, λ̃2 = λ2 and finally computing , and . This procedure is repeated 1000 times to obtain an empirical distribution of . Δpcij ≠ 0 is considered statistically significant if Δpcij falls into the 2.5% tails on either end of the empirical distribution curve for . To build a differential network, we assign a connection between xi and xj when Δpcij ≠ 0 is statistically significant.
In step 3, p-value (pk) for each biomolecule is converted into z-score (|zk|) as shown in Equation 6. An activity score (sk) is defined as the summation of |zk| and the z-scores for all its neighbors in the differential network, as shown in Equation 7. A higher activity score indicates that the corresponding biomolecule has more neighbors connected in the differential network and their p-values are more statistically significant.
| (6) |
where ϕ−1 is the inverse cumulative distribution function of the standard Gaussian distribution.
| (7) |
where nei indicates xk and its neighbors in the differential network.
Finally, in step 4, biomolecules are prioritized based on the activity score sk and the top ranking biomolecules are selected as biomarker candidates.
2.2 Evaluation of INDEED using proteomic data
The proteomic datasets were acquired by analysis of proteins in sera from hepatocellular carcinoma (HCC) cases and liver cirrhotic controls [13]. Briefly, adult patients were recruited from MedStar Georgetown University Hospital (GU cohort) in Washington, DC, USA and the Tanta University Hospital (TU cohort) in Tanta, Egypt. The GU cohort is comprised of 116 subjects (57 HCC cases and 59 liver cirrhotic controls) and the TU cohort consists of 89 subjects (40 HCC cases and 49 liver cirrhotic controls). We used liquid chromatography coupled with mass spectrometry (LC-MS) for both untargeted and targeted analyses of sera from subjects in the GU and TU cohorts. Proteins that are statistically significant between the two groups were selected from the untargeted proteomic data. A total of 101 proteins were then evaluated in sera from the GU and TU cohorts through targeted quantitation using multiple reaction monitoring (MRM). More details on experiment design and statistical analysis can be found in [13].
Our goal is to obtain a prioritized list of proteins using INDEED in one cohort, select the top ranking proteins to build a disease classifier and evaluate the performance of these proteins and the classifier on the other cohort with independent subjects. GU cohort was used as the training set for the selection of proteins and the built of the classifier, since it has more subjects and almost the same number of HCC cases and liver cirrhotic controls. In contrast, TU cohort was used as the testing set.
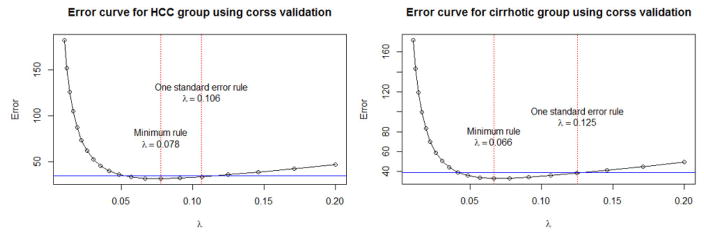
We performed student’s t-test on the GU cohort to investigate the changes on the expression level of individual proteins between HCC cases and liver cirrhotic controls. For each protein, we obtained a p-value (pk) from student’s t-test. The group-specific matrix (i.e., HCC cases or liver cirrhotic controls) from GU cohort was then used as the input for graphical LASSO algorithm to obtain the group-specific precision matrices (Θ1 and Θ2 for HCC and cirrhotic groups, respectively). In graphical LASSO, we performed 5-fold cross validation and chose the optimal tuning parameter λ in Equation 3-1 and 3-2 by one standard error rule as shown in Figure 3.
Figure 3.
Error curves to choose optimal tuning parameter λ using 5-fold cross validation by one standard error rule for HCC and cirrhotic groups on proteomic data. The blue line indicates the one standard error for the minimum λ in the direction of increasing regularization.
From Θ1 and Θ2, we computed the partial correlation for each biomolecular pair in HCC and cirrhotic groups and (Equation 4) and the change for pairwise partial correlation between the two groups Δpcij (Equation 5). To evaluate the statistical significance of Δpcij ≠ 0, we conducted permutation test as explained in Section 2.1. To build a differential network, we assigned a connection between xi and xj, when Δpcij ≠ 0 is statistically significant.
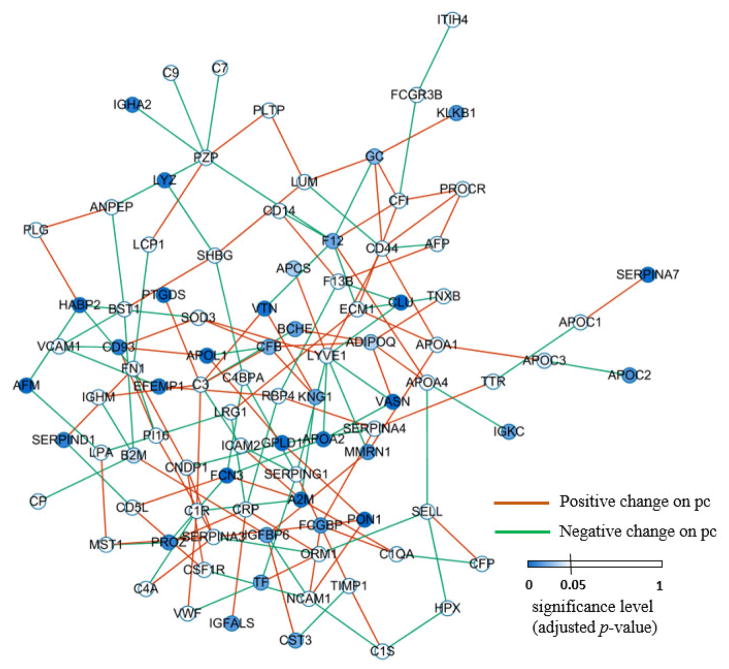
We mapped the p-values (pk) for each protein onto the differential network as shown in Figure 4, computed the activity score (sk) for each protein, as defined in Equations 6 and 7, and prioritized the 101 proteins according to their activity scores in a decreasing order.
Figure 4.
Differential network. Node color indicates the significance level of the individual protein between the HCC and cirrhotic groups. Orange edge represents a significantly positive change on partial correlation (pc) of a protein pair from HCC to cirrhotic groups while green one indicates a significantly negative change.
To evaluate the performance of INDEED, we also prioritized the 101 proteins according to DE analysis (i.e., the p-values from student’s t-test) and DN analysis. In DN analysis, we used the differential network in Figure 4 and prioritized the proteins according to the node degree of each protein (i.e., how many neighbors one node is connected to). The top ranking proteins from the three prioritized lists were used to train three logistic regression classifiers and tested their performances on the independent testing dataset.
2.3 Evaluation of INDEED using glycomic data
The glycomic datasets were acquired by analysis of glycans in sera from HCC cases and liver cirrhotic controls [14]. Similar to the proteomic datasets, adult patients were recruited from MedStar Georgetown University Hospital (GU cohort) in Washington, DC, USA and the Tanta University Hospital (TU cohort) in Tanta, Egypt. The GU cohort is comprised of 94 subjects (48 HCC cases and 46 patients with liver cirrhosis) and the TU cohort consists of 89 subjects (40 HCC cases and 49 liver cirrhotic controls). Both untargeted and targeted analyses were conducted by using LC-MS in the GU and TU cohorts. Glycans that are statistically significant between the HCC and cirrhotic groups were selected from the untargeted glycomic data. A total of 82 glycans were then evaluated in sera from the GU and TU cohorts through targeted quantitation using MRM. More details on experiment design and statistical analysis can be found in [14].
Similar to the approach we used for evaluating INDEED on proteomic data, we used GU cohort as the training set and TU cohort as the testing set. We performed ANOVA to investigate the changes on the expression level of individual glycans between HCC cases and liver cirrhotic controls. For each glycan, we obtained a p-value (pk) from ANOVA. Then the differential network was built by performing graphical LASSO on HCC and cirrhotic groups separately, computing partial correlation for each glycan pair and evaluating the statistical significance of the change on the pairwise partial correlation between HCC and cirrhotic groups using permutation test. Once the differential network was built, we mapped p-values (pk) onto the differential network and computed the activity score (sk) for each glycan. At last, we prioritized the 82 glycans according to their activity scores in a decreasing order. To evaluate the performance of INDEED, we also prioritized the 82 glycans according to DE analysis (i.e., the p-values from ANOVA) and DN analysis (i.e., node degrees). The top ranking glycans from the three prioritized lists were used to train three logistic regression classifiers. We tested the performances of the classifiers on the independent testing dataset.
2.4 Evaluation of INDEED using transcriptomic data
The transcriptomic data consist of two microarray datasets previously acquired in breast cancer studies: van de Vijver et al.’s and Pawitan et al.’s datasets [15, 16]. The former includes 295 patients with their survival records, and was used for training. Pawitan et al.’s dataset contains 159 patients, together with their survival records, and was used for independent testing. Both datasets are available at PRECOG website (https://precog.stanford.edu/), an online repository for querying cancer gene expression and clinical data, and have been properly preprocessed for subsequent statistical analysis [21]. The raw data are also available at R package seventyGeneData and Gene Expression Omnibus (GSE1456), respectively [22].
With proteomic and glycomic data in Sections 2.3 and 2.4, we evaluated INDEED by obtaining a prioritized list of proteins/glycans based on one dataset (i.e., GU cohort), selected top ranking ones to build a disease classifier, and tested the performance of the classifier on the independent dataset (i.e., TU cohort). For transcriptomic data, we evaluated INDEED by building a regression model for survival time prediction. We first conducted univariate analysis on van de Vijver et al.’s dataset to select a list of statistically significant genes based on their expression values and the survival time across patients using univariate Cox regression model. For each gene, we obtained a p-value (pk) and selected statistically significant genes for subsequent analysis. In order to build a differential network, we excluded patients with less than 5-year follow-up time from the van de Vijver et al.’s dataset. Among the remaining patients, 91 with less than 5-year survival during the follow-up time were considered high risk group while the other 196 formed the low risk group. The differential network was built by performing graphical LASSO on high and low risk groups separately using the pre-selected genes, computing partial correlation for each gene pair, and evaluating the statistical significance of the change on the pairwise partial correlation between high and low risk groups using permutation test. Once the differential network was built, we mapped p-values (pk) onto the differential network and computed the activity score (sk) for each pre-selected gene. At last, we prioritized the pre-selected genes according to their activity scores in a decreasing order. To evaluate the performance of INDEED, we prioritized the pre-selected genes according to DE (i.e., the p-values from univariate Cox regression model) and DN (i.e., node degrees) analyses. The top ranking genes from the three prioritized lists were used to train three multivariate Cox regression models and to test their performance on the independent testing dataset.
3 Results and discussion
3.1 Proteomic datasets
Figure 3 shows our choice of λ1 = 0.106 (HCC group) and λ2 = 0.125 (cirrhotic group) in performing graphical LASSO to obtain group-specific precision matrices (Θ1 and Θ2 for HCC and cirrhotic groups, respectively).
The differential network built based on partial correlation is shown in Figure 4. Table S-1 in supplementary material lists all the 101 proteins together with their adjusted p-values, activity scores and node degrees. Proteins are named after their corresponding gene symbols.
We performed DE analysis, DN analysis, and INDEED on GU cohort initially. Using student’s t-test, 45 proteins with adjusted p-values less than 0.05 were selected in DE analysis. The inflation of Type I error was controlled by the false discovery rate (FDR) using the Benjamini-Hochberg procedure. To make a fair comparison, we also selected the top 45 proteins based on DN analysis (i.e., node degrees) and INDEED (i.e., activity scores). We conducted student’s t-test on the TU cohort to select a total of 39 proteins whose adjusted p-values were less than 0.05. We compared the overlap of the 45 proteins selected based on DE analysis, DN analysis and INDEED on GU cohort, with the 39 proteins selected by student’s t-test on the TU cohort. The result is shown in Table 1, where the number of overlapping proteins are 21, 17, and 25 for DE analysis, DN analysis and INDEED, respectively. Here the 39 proteins selected by student’s t-test on the TU cohort are used to approximate the ground truth to evaluate the reproducibility of the protein biomarker candidates selected based on DE analysis, DN analysis and INDEED from GU cohort. As expected, INDEED can select biomarker candidates that are more reproducible across GU and TU cohorts.
Table 1.
The top ranking 45 proteins prioritized by differential expression (DE) analysis (adjusted p-value < 0.05), differential network (DN) analysis and INDEED on GU cohort. The reference is the top ranking proteins prioritized by DE analysis (adjusted p-value < 0.05) on TU cohort. The overlapping proteins between the three prioritized lists on GU cohort and the reference on TU cohort are in bold. All proteins are represented by their corresponding gene symbols.
| GU cohort | TU cohort | ||||||
|---|---|---|---|---|---|---|---|
|
| |||||||
| DE analysis (Overlap:21) | DN analysis (Overlap:17) | INDEED (Overlap:25) | DE analysis | ||||
| FCN3 | IGFALS | LYVE1 | F13B | LYVE1 | FCGBP | PLG | C7 |
| CLU | IGKC | F12 | APOA4 | C3 | CD44 | APCS | ADIPOQ |
| PON1 | BCHE | C3 | SOD3 | FCN3 | PON1 | ICAM2 | APOA2 |
| AFM | IGFBP6 | PZP | SELL | CFB | F13B | VCAM1 | SERPIND1 |
| VASN | COMP | SERPINA3 | IGFBP6 | SOD3 | VTN | CFB | B2M |
| PTGDS | TF | CD44 | SERPINA4 | F12 | MMRN1 | TNXB | PTGDS |
| APOL1 | F12 | FCN3 | LUM | GPLD1 | FN1 | SERPINA4 | BST1 |
| GPLD1 | CST3 | CFB | B2M | ADIPOQ | CD5L | C3 | APOC2 |
| SERPINA7 | KNG1 | A2M | GPLD1 | APOA2 | APOA4 | KNG1 | LUM |
| HABP2 | IGJ | CRP | BST1 | APOL1 | VCAM1 | CLU | VASN |
| A2M | CFB | FN1 | HABP2 | SERPING1 | PROZ | VTN | APOC3 |
| VTN | GC | GC | CNDP1 | A2M | ECM1 | F13B | CST3 |
| APOA2 | FGB | SERPING1 | CD93 | HABP2 | APOA1 | PROZ | C4BPA |
| LYZ | IGHA1 | CFI | APOL1 | KNG1 | CFI | SELL | CD93 |
| EFEMP1 | APCS | NCAM1 | CD5L | CD93 | CLU | APOC1 | CFI |
| IGHA2 | ADIPOQ | ADIPOQ | TIMP1 | NCAM1 | ICAM2 | RBP4 | FGG |
| SERPIND1 | CLEC3B | ECM1 | KNG1 | VASN | B2M | CSF1R | |
| CD93 | B2M | FCGBP | APOA2 | GC | CST3 | GPLD1 | |
| PROZ | APOC3 | C1R | C1QA | IGFBP6 | TIMP1 | EFEMP1 | |
| FCGBP | TIMP1 | APOA1 | LRG1 | RBP4 | C4BPA | MMRN1 | |
| APOC2 | VCAM1 | RBP4 | AFP | PZP | APOC3 | ITIH4 | |
| MMRN1 | LYVE1 | ORM1 | TF | SERPINA4 | BST1 | ECM1 | |
| KLKB1 | SHBG | CRP | LYVE1 | ||||
Figure 5 shows a Venn diagram of the 21, 17, and 25 overlapping proteins selected by DE analysis, DN analysis and INDEED from GU cohort. Two proteins, intercellular adhesion molecule 2 (ICAM2) and c4b-binding protein alpha chain (C4BPA) are unique to INDEED. We further investigated these two proteins by their relevance to HCC studies from the past literatures. ICAM2 has been previously reported as a liver cirrhosis signature in plasma that can be used as a potential predictive biomarker for HCC among hepatitis B virus (HBV) carriers [23]. C4BPA has also been previously reported as one of the 14 protein biomarkers for HCC based on a study comparing HCC cases with healthy controls and the HBV group [24]. The literature survey has confirmed the prospective of using INDEED to select HCC related biomarker candidates that can be missed by DE and DN analyses.
Figure 5.
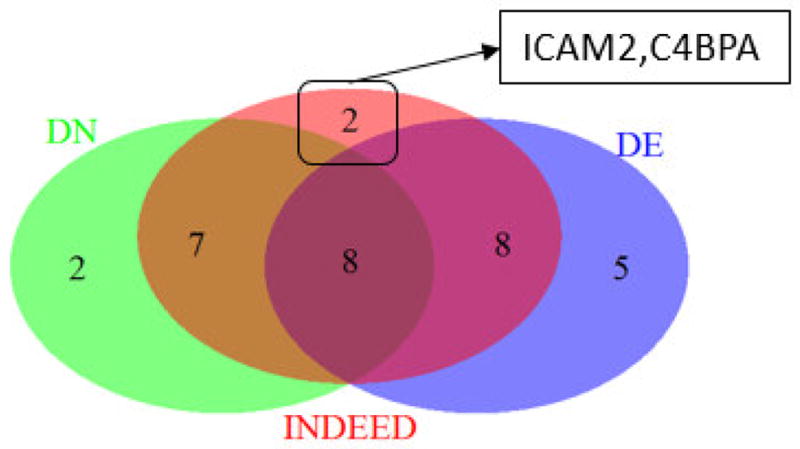
Venn diagram for the 21, 17 and 25 overlapping proteins from differential expression (DE) analysis, differential network (DN) analysis and INDEED on GU cohort in Table 1. Proteins ICAM2 and C4BPA are unique to INDEED.
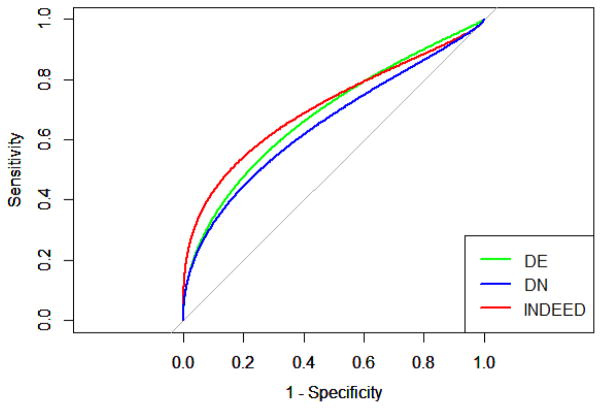
To make more comprehensive comparisons among DE analysis, DN analysis, and INDEED, we trained three logistic regression classifiers on GU cohort using the 45 proteins from DE analysis, DN analysis and INDEED in Table 1, and tested the classifiers on the TU cohort. To overcome the potential over-fitting problem, we first performed a LASSO based logistic regression using R package, glmnet, to select the most relevant biomarker candidates among the 45 proteins in Table 1 [25]. The sparsity parameter was tuned based on the leave-one-out cross validation procedure. This led to 10, 10, and 13 proteins for DE analysis, DN analysis, and INDEED, respectively, as shown in Table 2. We then refitted the logistic regression classifiers using the above 10, 10, and 13 proteins and tested the classifiers on the TU cohort. The classification accuracy for the logistic regression classifiers on TU cohort are 0.64, 0.64, and 0.69 for DE analysis, DN analysis and INDEED, respectively. We also plotted the ROC curves associated with DE analysis, DN analysis and INDEED, as shown in Figure 6. The AUC for DE analysis, DN analysis and INDEED are 0.68, 0.65 and 0.71, respectively.
Table 2.
The 10, 10, 13 proteins selected by LASSO based logistic regression for differential expression (DE) analysis, differential network (DN) analysis and INDEED on GU cohort.
| DE analysis (10) | DN analysis (10) | INDEED (13) |
|---|---|---|
|
| ||
| FCN3 | F12 | FCN3 |
| IGHA2 | FCN3 | F12 |
| CLEC3B | A2M | SERPING1 |
| SERPINA7 | SERPING1 | A2M |
| CLU | FCGBP | VASN |
| PTGDS | IGFBP6 | IGFBP6 |
| AFM | GPLD1 | FCGBP |
| LYZ | HABP2 | PON1 |
| VASN | TIMP1 | APOA4 |
| FCGBP | AFP | PROZ |
| CLU | ||
| B2M | ||
| CST3 | ||
Figure 6.
ROC curves associated with differential expression (DE) analysis, differential network (DN) analysis and INDEED when training a logistic regression classifier on GU cohort and testing it on TU cohort for proteomic data. The AUC are 0.68, 0.65 and 0.71 for DE analysis, DN analysis and INDEED, respectively.
3.2 Glycomic datasets
Figure S-1 in the supplementary material shows our chose of λ1 = 0.066 (HCC group) and λ2 = 0.057 (cirrhotic group) in performing graphical LASSO to obtain group-specific precision matrices (Θ1 and Θ2 for HCC and cirrhotic groups, respectively). Figure S-2 shows the differential network built based on partial correlation. Table S-2 lists all 82 glycans together with their p-values, activity scores and node degrees.
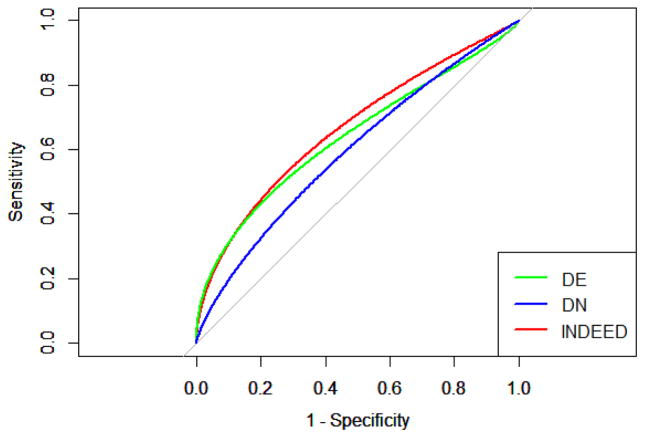
We performed DE analysis, DN analysis, and INDEED on GU cohort. Using ANOVA, 11 glycans with p-values less than 0.1 were selected in DE analysis. To make a fair comparison, we selected the top 11 glycans based on DN analysis (i.e., node degrees) and INDEED (i.e., activity scores) (Table S-3). We then trained three logistic regression classifiers on GU cohort using the 11 glycans from DE analysis, DN analysis and INDEED in Table S-3, and tested the classifiers on the TU cohort. The same procedure as the proteomic data has been applied for the glycomic data. Briefly, we first performed a LASSO based logistic regression to select the most relevant biomarker candidates among the 11 glycans in Table S-3. This led to 4, 2, and 5 glycans for DE analysis, DN analysis, and INDEED, respectively, as shown in Table 3. We then refitted logistic regression classifiers using the above 4, 2, and 5 glycans and tested the classifiers on the TU cohort. The classification accuracy for the logistic regression classifiers on TU cohort are 0.58, 0.56, and 0.63 for DE analysis, DN analysis and INDEED, respectively. We also plotted the ROC curves associated with DE analysis, DN analysis, and INDEED, as shown in Figure 7. The AUC for DE analysis, DN analysis and INDEED are 0.64, 0.59 and 0.67, respectively.
Table 3.
The 4, 2, 5 glycans selected by LASSO based logistic regression classifier for differential expression (DE) analysis, differential network (DN) analysis and INDEED on GU cohort. Glycans are characterized by the number of five monosaccharides: GlcNAc, mannose, galactose, fucose, and NeuNAc.
| DE analysis (4) | DN analysis (2) | INDEED (5) |
|---|---|---|
|
| ||
| [43100] | [34101] | [53212] |
| [53000] | [53100] | [34101] |
| [53411] | [33101] | |
| [53111] | [53411] | |
| [43202] | ||
Figure 7.
ROC curves associated with differential expression (DE) analysis, differential network (DN) analysis, and INDEED when training a logistic regression classifier on GU cohort and testing it on TU cohort for glycomic data. The AUC are 0.64, 0.59 and 0.67 for DE analysis, DN analysis and INDEED, respectively.
3.3 Transcriptomic datasets
We performed univariate analysis on van de Vijver et al.’s dataset to select a list of statistically significant genes based on their expression value and the survival time across patients using univariate Cox regression model. This led to a total of 402 genes whose adjusted p-values were less than 0.05 after correcting for multiple testing based on FDR. Using cross-validation similar to Figures 3 and S-1, we chose λ1 = 0.103 (high risk group) and λ2 = 0.074 (low risk group) in performing graphical LASSO to obtain group-specific precision matrices (Θ1 and Θ2 for high and low risk groups, respectively). Table S-4 lists all 402 genes together with their p-values, activity scores, and node degrees.
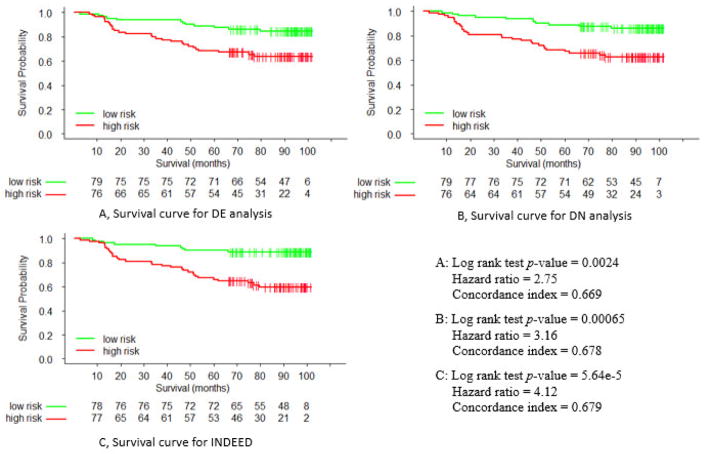
We performed DE analysis, DN analysis, and INDEED to prioritize the 402 genes based on their p-values, node degrees, and activity scores, respectively. From the three prioritized lists, the top 50 genes were selected to train three multivariate Cox regression models for survival time prediction. In training each multivariate Cox regression model, we used LASSO to select the most relevant biomarker candidates among the 50 genes. This led to 16, 23, and 22 genes selected by DE analysis, DN analysis, and INDEED, respectively, as shown in Table 4. We then refitted the multivariate Cox regression models using the above 16, 23, and 22 genes and tested their performance on the independent Pawitan et al.’s dataset. Figure 8 presents survival curves associated with DE analysis, DN analysis, and INDEED based on Kaplan-Meier survival analysis. As shown in the figure, INDEED yielded the best performance (log rank p-value=5.64e−5, hazard ratio=4.12), compared to DE analysis (log rank p-value=0.0024, hazard ratio=2.75) and DN analysis (log rank p-value=0.00065, hazard ratio=3.16).
Table 4.
The 16, 23, 22 genes selected by LASSO based multivariate Cox regression models for differential expression (DE) analysis, differential network (DN) analysis and INDEED on van de Vijver et al.’s dataset.
| DE analysis (16) | DN analysis (23) | INDEED (22) | ||
|---|---|---|---|---|
| QSOX2 | LRIG1 | SPEF1 | ZWINT | MED11 |
| UBE2C | ZWINT | PLK2 | CCNA2 | ODF2 |
| POLD1 | MASTL | C20ORF24 | SIK3 | DSCR6 |
| BIRC5 | CSNK1D | TBC1D8 | LZTFL1 | NEIL1 |
| PSMA7 | CHMP1A | DSCR6 | ABCB6 | JMJD1C |
| SPC25 | STK32B | JMJD1C | PSMC4 | GPI |
| MYBL2 | SIK3 | GPI | PKMYT1 | |
| CCNE2 | HMGB3 | PSMB2 | ||
| WDR62 | ABCB6 | RRM2 | ||
| E2F7 | VPS4A | DLX2 | ||
| CENPA | PSMB2 | DSN1 | ||
| TIMELESS | DLX2 | PTTG1/PTTG2 | ||
| TK1 | LYPD6 | SAC3D1 | ||
| KIF20A | STC2 | TROAP | ||
| CKAP5 | BNIP3L | TIMELESS | ||
| C15ORF42 | PTTG1/PTTG2 | NUP93 | ||
Figure 8.
Survival curves for A) differential expression (DE) analysis, B) differential network (DN) analysis, and C) INDEED.
In summary, DE and DN analyses identify biomarker candidates from two complementary perspectives: the former investigates the change of single biomolecule in its expression level between distinct biological groups, while the latter focuses on the change at the biomolecular pair level. The improved performance of INDEED is attributed to its capability to simultaneously consider the changes between cases and controls on individual biomolecule and bimolecular pair levels, while DE and DN analyses can only capture changes on one of the two levels.
4 Conclusions
In this work, we propose a novel approach, INDEED, to build a sparse differential network based on partial correlation for better visualization, and integrate DE and DN analyses for biomarker discovery. The application of INDEED on real transcriptomic, proteomic and glycomic data revealed its potential to select biomarker candidates that are more reproducible across independent studies, and led to improved classification and regression accuracy when compared with DE and DN analyses, separately. Future work includes developing an R package to share INDEED with the scientific community and extending INDEED to integrate multiple omic data of various types for biomarker discovery.
Supplementary Material
Figure S-1: Error curves to choose optimal tuning parameter λ in performing graphical LASSO for HCC and cirrhotic groups on glycomic data.
Figure S-2: Differential network built for glycomic data.
Table S-1: The total 101 proteins together with their adjusted p-values, activity scores and node degrees.
Table S-2: The total 82 glycans together with their p-values, activity scores and node degrees.
Table S-3: The top 11 glycans prioritized based on differential expression (DE) analysis, differential network (DN) analysis and INDEED, respectively.
Table S-4: The total 402 genes together with their p-values, activity scores, and node degrees.
A novel approach, INDEED, that integrates differential expression and differential network analyses is proposed for biomarker discovery using omic data.
INDEED builds sparse differential network based on partial correlation for better network visualization.
Transcriptomic, proteomic and glycomic datasets from cancer patients demonstrate INDEED’s improved performance in solving classification and regression tasks, compared with separate differential expression and differential network analyses.
Acknowledgments
This work is in part supported by the National Institutes of Health Grants U01CA185188, R01GM086746 and R01CA143420 awarded to HWR.
Footnotes
Publisher's Disclaimer: This is a PDF file of an unedited manuscript that has been accepted for publication. As a service to our customers we are providing this early version of the manuscript. The manuscript will undergo copyediting, typesetting, and review of the resulting proof before it is published in its final citable form. Please note that during the production process errors may be discovered which could affect the content, and all legal disclaimers that apply to the journal pertain.
Contributor Information
Yiming Zuo, Email: zyiming@vt.edu.
Yi Cui, Email: cuiyi@stanford.edu.
Cristina Di Poto, Email: cd329@georgetown.edu.
Rency S. Varghese, Email: rsv4@georgetown.edu.
Guoqiang Yu, Email: yug@vt.edu.
Ruijiang Li, Email: rli2@stanford.edu.
Habtom W. Ressom, Email: hwr@georgetown.edu.
References
- 1.Ein-Dor L, Zuk O, Domany E. Thousands of samples are needed to generate a robust gene list for predicting outcome in cancer. Proceedings of the National Academy of Sciences. 2006;103:5923–5928. doi: 10.1073/pnas.0601231103. [DOI] [PMC free article] [PubMed] [Google Scholar]
- 2.Lui TW, Tsui NB, Chan LW, Wong CS, Siu PM, Yung BY. DECODE: an integrated differential co-expression and differential expression analysis of gene expression data. BMC bioinformatics. 2015;16:182. doi: 10.1186/s12859-015-0582-4. [DOI] [PMC free article] [PubMed] [Google Scholar]
- 3.Zuo Y, Yu G, Zhang C, Ressom HW. A new approach for multi-omic data integration. Bioinformatics and Biomedicine (BIBM), 2014 IEEE International Conference on; 2014; pp. 214–217. [Google Scholar]
- 4.Zhang B, Horvath S. A general framework for weighted gene co-expression network analysis. Statistical applications in genetics and molecular biology. 2005;4:1128. doi: 10.2202/1544-6115.1128. [DOI] [PubMed] [Google Scholar]
- 5.Atul ISK, Butte J. Unsupervised Knowledge Discovery in Medical Databases Using Relevance Networks. 1999. [PMC free article] [PubMed] [Google Scholar]
- 6.Friedman Nir, Linial Michal, Nachman Iftach, Vega NM. Using Bayesian Networks to Analyze Expression Data. 2000. [DOI] [PubMed] [Google Scholar]
- 7.de la Fuente A. From ‘differential expression’ to ‘differential networking’–identification of dysfunctional regulatory networks in diseases. Trends in genetics. 2010;26:326–333. doi: 10.1016/j.tig.2010.05.001. [DOI] [PubMed] [Google Scholar]
- 8.Zhang B, Li H, Riggins RB, Zhan M, Xuan J, Zhang Z, et al. Differential dependency network analysis to identify condition-specific topological changes in biological networks. Bioinformatics. 2009;25:526–532. doi: 10.1093/bioinformatics/btn660. [DOI] [PMC free article] [PubMed] [Google Scholar]
- 9.Tian Y, Zhang B, Hoffman EP, Clarke R, Zhang Z, Shih IM, et al. Knowledge-fused differential dependency network models for detecting significant rewiring in biological networks. BMC systems biology. 2014;8:1. doi: 10.1186/s12918-014-0087-1. [DOI] [PMC free article] [PubMed] [Google Scholar]
- 10.Zuo Y, Yu G, Tadesse MG, Ressom HW. Biological network inference using low order partial correlation. Methods. 2014;69:266–273. doi: 10.1016/j.ymeth.2014.06.010. [DOI] [PMC free article] [PubMed] [Google Scholar]
- 11.Padi M, Quackenbush J. Integrating transcriptional and protein interaction networks to prioritize condition-specific master regulators. BMC systems biology. 2015;9:1. doi: 10.1186/s12918-015-0228-1. [DOI] [PMC free article] [PubMed] [Google Scholar]
- 12.Reverter A, Ingham A, Lehnert SA, Tan SH, Wang Y, Ratnakumar A, et al. Simultaneous identification of differential gene expression and connectivity in inflammation, adipogenesis and cancer. Bioinformatics. 2006;22:2396–2404. doi: 10.1093/bioinformatics/btl392. [DOI] [PubMed] [Google Scholar]
- 13.Tsai TH, Song E, Zhu R, Di Poto C, Wang M, Luo Y, et al. LC-MS/MS-based serum proteomics for identification of candidate biomarkers for hepatocellular carcinoma. Proteomics. 2015;15:2369–2381. doi: 10.1002/pmic.201400364. [DOI] [PMC free article] [PubMed] [Google Scholar]
- 14.Tsai TH, Wang M, Di Poto C, Hu Y, Zhou S, Zhao Y, et al. LC–MS profiling of N-glycans derived from human serum samples for biomarker discovery in hepatocellular carcinoma. Journal of proteome research. 2014;13:4859–4868. doi: 10.1021/pr500460k. [DOI] [PMC free article] [PubMed] [Google Scholar]
- 15.Van De Vijver MJ, He YD, van’t Veer LJ, Dai H, Hart AA, Voskuil DW, et al. A gene-expression signature as a predictor of survival in breast cancer. New England Journal of Medicine. 2002;347:1999–2009. doi: 10.1056/NEJMoa021967. [DOI] [PubMed] [Google Scholar]
- 16.Pawitan Y, Bjöhle J, Amler L, Borg AL, Egyhazi S, Hall P, et al. Gene expression profiling spares early breast cancer patients from adjuvant therapy: derived and validated in two population-based cohorts. Breast Cancer Research. 2005;7:1. doi: 10.1186/bcr1325. [DOI] [PMC free article] [PubMed] [Google Scholar]
- 17.Zuo Y, Yu G, Ressom HW. Integrating prior biological knowledge and graphical LASSO for network inference. Bioinformatics and Biomedicine (BIBM), 2015 IEEE International Conference on; 2015; pp. 1543–1547. [Google Scholar]
- 18.Friedman J, Hastie T, Tibshirani R. Sparse inverse covariance estimation with the graphical lasso. Biostatistics. 2008;9:432–441. doi: 10.1093/biostatistics/kxm045. [DOI] [PMC free article] [PubMed] [Google Scholar]
- 19.Witten DM, Friedman JH, Simon N. New insights and faster computations for the graphical lasso. Journal of Computational and Graphical Statistics. 2011;20:892–900. [Google Scholar]
- 20.Meinshausen N, Bühlmann P. Stability selection. Journal of the Royal Statistical Society: Series B (Statistical Methodology) 2010;72:417–473. [Google Scholar]
- 21.Gentles AJ, Newman AM, Liu CL, Bratman SV, Feng W, Kim D, et al. The prognostic landscape of genes and infiltrating immune cells across human cancers. Nat Med. 2015 Aug;21:938–45. doi: 10.1038/nm.3909. [DOI] [PMC free article] [PubMed] [Google Scholar]
- 22.Marchionni L, Afsari B, Geman D, Leek JT. A simple and reproducible breast cancer prognostic test. BMC genomics. 2013;14:1. doi: 10.1186/1471-2164-14-336. [DOI] [PMC free article] [PubMed] [Google Scholar]
- 23.Liu CC, Wang YH, Chuang EY, Tsai MH, Chuang YH, Lin CL, et al. Identification of a liver cirrhosis signature in plasma for predicting hepatocellular carcinoma risk in a population-based cohort of hepatitis B carriers. Molecular carcinogenesis. 2014;53:58–66. doi: 10.1002/mc.21952. [DOI] [PubMed] [Google Scholar]
- 24.He X, Wang Y, Zhang W, Li H, Luo R, Zhou Y, et al. Screening differential expression of serum proteins in AFP-negative HBV-related hepatocellular carcinoma using iTRAQ-MALDI-MS/MS. Neoplasma. 2013;61:17–26. [PubMed] [Google Scholar]
- 25.Friedman J, Hastie T, Tibshirani R. Regularization paths for generalized linear models via coordinate descent. Journal of statistical software. 2010;33:1. [PMC free article] [PubMed] [Google Scholar]
Associated Data
This section collects any data citations, data availability statements, or supplementary materials included in this article.
Supplementary Materials
Figure S-1: Error curves to choose optimal tuning parameter λ in performing graphical LASSO for HCC and cirrhotic groups on glycomic data.
Figure S-2: Differential network built for glycomic data.
Table S-1: The total 101 proteins together with their adjusted p-values, activity scores and node degrees.
Table S-2: The total 82 glycans together with their p-values, activity scores and node degrees.
Table S-3: The top 11 glycans prioritized based on differential expression (DE) analysis, differential network (DN) analysis and INDEED, respectively.
Table S-4: The total 402 genes together with their p-values, activity scores, and node degrees.


