

Abstract
mTOR signaling controls several critical cellular functions and is deregulated in many cancers, including pancreatic cancer. To date, most efforts have focused on inhibiting the mTORC1 complex. However, clinical trials of mTORC1 inhibitors in pancreatic cancer have failed, raising questions about this therapeutic approach. We employed a genetic approach to delete the obligate mTORC2 subunit Rictor and identified the critical times during which tumorigenesis requires mTORC2 signaling. Rictor deletion resulted in profoundly delayed tumorigenesis. Whereas previous studies showed most pancreatic tumors were insensitive to rapamycin, treatment with a dual mTORC1/2 inhibitor strongly suppressed tumorigenesis. In late-stage tumor-bearing mice, combined mTORC1/2 and PI3K inhibition significantly increased survival. Thus, targeting mTOR may be a potential therapeutic strategy in pancreatic cancer.
Keywords: Pancreatic cancer, GEMM, mTORC2, Rictor
Introduction
Pancreatic Ductal Adenocarcinoma (PDAC) accounts for 85% of cases of pancreatic cancer and is a highly aggressive form of the disease (1). Indeed, PDAC is predicted to become the second-leading cause of cancer death in the US by 2030 (2). At diagnosis, the disease is characterized by local invasion and distant metastases, so that even the few patients eligible for resection inevitably develop recurrent or metastatic disease (1). Most systemic therapies are ineffective, thus, PDAC is almost universally lethal, with a 5-year survival of ~7% (3). Up until the recent adoption of combination chemotherapy regimens, FOLFIRINOX, and gemcitabine-Abraxane, gemcitabine monotherapy had been the standard-of-care for PDAC patients since 1997 (4). Yet, median survival with FOLFIRINOX or gemcitabine-Abraxane is 11 and 9 months respectively. Thus, PDAC presents a significant therapeutic challenge and novel, effective therapies are required.
The genetic drivers of pancreatic cancer have been well-studied. Activating mutations in KRAS occur in ~90% of cases and are thought to be the initiating event driving the formation of precursor lesions termed pancreatic intraepithelial neoplasia (PanINs). Accumulation of further mutations in tumor suppressor genes, including CDKN2A, TP53, DPC4 and BRCA2 occurs throughout tumor progression (1). In fact, recent wide-scale genomic studies have revealed that 100s of genetic aberrations accrue (5). PDAC is also histologically complex, and interactions between tumor cells and the microenvironment contribute to tumor progression. Indeed, the extensive desmoplastic stroma that characterizes PDAC may protect tumor cells from a number of stresses, including chemotherapy, although this is somewhat controversial (6). Therefore, a greater understanding of the signals that drive tumor progression is required.
Activated KRAS drives a complex signaling network, involving multiple downstream effectors, including the MEK/ERK, PI3K/AKT and RAL pathways (7). The PI3K pathway regulates a number of processes integral to cancer, including cell growth, cell cycle entry, cell survival and metabolism (8). Indeed, PI3K signaling has been shown to be a key mediator of the effects of oncogenic KRAS in the pancreas (9). PI3K inhibitors have been developed for clinical trials, however, the pathway interacts with many other signals and there are several feedback loops making it difficult to predict the effects of pathway suppression (10).
One of the major downstream effectors of PI3K signaling is mTOR, a serine/threonine kinase that acts as part of two distinct complexes (11). The mTORC1 complex, which includes Raptor, is responsible for several well-studied functions of mTOR, including sensing nutrient stress and regulating translation through interaction with p70S6K and 4E-BP1 (11). p70S6K can also phosphorylate IRS1 on an inhibitory serine residue, thus causing negative feedback that inhibits insulin and IGF signaling to PI3K/AKT (12). Inhibition of mTORC1 can also lead to feedback activation of MEK/ERK signaling (13).
The mTORC2 complex, which includes the essential subunit RICTOR, regulates cell growth, metabolism and survival, and organization of the actin cytoskeleton, through activation of AKT, SGK and PKC (14,15). We previously showed that high levels of phospho-AKTS473 in human PDAC were significantly associated with poor survival (16). More recently, RICTOR amplifications have been described in human lung cancers and melanomas (17,18). However, since the tumor promoting properties of mTORC2 signaling have only recently been identified (19,20), a full understanding of the mechanisms underlying this effect is still developing.
Initial strategies to inhibit mTOR function focused on mTORC1 and the development of analogs of the mTORC1 inhibitor rapamycin. However, clinical trials using these compounds have proved disappointing (21). More recently, small molecule inhibitors that block mTOR kinase activity, and therefore impair both mTORC1 and mTORC2 have been developed. Not only do these inhibitors target both arms of mTOR signaling, they target 4E-BP1, and thus translational initiation, more efficiently than rapalogs, which primarily inhibit S6 kinase (22). We recently showed that pancreatic tumors in mice bearing mutations in Kras and Pten, a negative regulator of PI3K-mTOR signaling, were exquisitely sensitive to rapamycin whereas mice wild-type for Pten, but expressing mutant p53, were resistant (23). These findings suggest that mTORC2 signaling may play a critical role downstream of commonly occurring PDAC gene mutations and that inhibition of this complex may enhance therapeutic efficacy in PDAC.
Global deletion of Rictor or Raptor in the mouse embryo results in embryonic lethality (20), however, conditional models of Rictor and Raptor deletion that allow interrogation of tissue-specific roles of mTORC1 and 2 are now available (20). We have utilized pancreas-specific deletion of Rictor to discern the requirement for mTORC2 signaling during pancreatic tumorigenesis. We show that genetic inactivation of mTORC2 significantly blocks PanIN development, impairs progression to invasive carcinoma, and prolongs survival in a PDAC GEMM. Moreover, pharmacologic inhibition of mTOR extends survival, even in mice with late-stage disease. Our findings demonstrate an important role for mTORC2 signaling during pancreatic tumorigenesis and support the use of mTOR inhibitors as part of therapeutic strategies in PDAC.
Materials and Methods
Animal Experiments
Mice were maintained on a mixed background and given access to standard diet and water ad libitum. Ptf1a-cre, Pdx1-Cre, LSL-KrasG12D, Trp53R172H and Rictorflox mice have been described previously (24-27). Experiments were approved by UMass Medical School IACUC or performed under UK Home Office regulations and license approved by the local ethics committee. For more information see supplemental data.
Caerulein injections
Caerulein (50μg/kg, Sigma), or vehicle control (0.05M NH4OH in PBS) was injected intraperitoneally into 5-7-week old mice as previously described (28).
In vivo treatment experiments
Mice were randomly assigned to cohorts. Treatments were administered as follows: AZD2014 (AstraZeneca), in 20% w/v Captisol in H2O, at 15mg/kg by oral gavage (p.o.) daily; Gemcitabine (LC labs), in PBS, at 100mg/kg by intraperitoneal injection twice weekly; and AZD8186 (AstraZeneca), in 0.5% HPMC in H2O, at 50mg/kg p.o. twice daily.
Histology
Following necropsy pancreata were formalin fixed overnight, embedded in paraffin, and 4-5-micron sections mounted on positively charged slides. H&E and quadchrome staining was done as standard. A licensed pathologist blinded to genotype performed quantification of tissue area. See supplemental data for more information.
Immunohistochemistry
IHC was performed on FFPE sections using standard protocols. For further details and antibodies see supplemental data and Table S1.
RNAscope
In situ detection of Rictor transcripts in FFPE mouse PDAC samples was performed using a Rictor specific RNAscope® assay (Advanced Cell Diagnostics, 1:5) according to the manufacturers protocol.
Primary PanIN cell culture experiments
Primary PanIN lines (isolated in the Bardeesy lab) (29) were grown on Laminin-coated plates as previously described (30) and infected with lentiviruses encoding Rictor or GFP-targeting shRNAs (Table S2). Viable cells were counted using trypan blue exclusion. SA-β-Galactosidase activity was assessed using a standard protocol. See supplemental data for more information.
PDAC cell lines
PDAC cell lines were generated in-house from KPC tumors as described previously (23). Testing was performed in-house to confirm that cells were mycoplasma-free. Cells were maintained at 37°C and 5% CO2 in DMEM (Invitrogen) with 10% FBS (PAA), 2mM L-Glutamine (Invitrogen), and 1% Penicillin/Streptomycin (Invitrogen). Cells were treated with AZD2014 +/- AZD8186. Cell viability was measured using the Cell Titer Blue assay (Promega).
Synergy assay in PDAC cell lines
Mouse PDAC cell line K8484 (established in-house from a KPC tumor) and human PDAC cell line MiaPaca2 (from the European Collection of Cell Cultures, UK, in 2009 (authenticated by STR genotyping)) were treated with AZD2014 +/- Gemcitabine for 96h. Cell viability was determined by measuring total protein content using the sulforhodamine B assay. Combenefit software was used to analyze the data for potential synergy (http://www.cruk.cam.ac.uk/research-groups/jodrell-group/combenefit).
Western Blotting
Cell lysates were prepared and Western blot analysis was performed using standard protocols. Antibodies are listed in Table S3.
Results
Loss of Rictor does not impair pancreas differentiation
To determine the impact of mTORC2 inactivation on pancreas development, we generated mice lacking the essential mTORC2 subunit Rictor, specifically within the pancreas, by crossing mice bearing Ptf1a-cre and Rictorflox alleles (24,25) (Figure S1A). The absence of Rictor protein was confirmed by immunoblotting of protein lysates isolated from 2-month old pancreata (Figure S1B). Mice lacking pancreatic Rictor were viable and showed no difference in body weight relative to their wild-type littermates (Figure S1C). However, Rictor null pancreata weighed significantly less than Rictor intact pancreata (Figure S1D). Measurement of cell size (Figure S1E) and quantification of the total amount of genomic DNA as a surrogate measurement for cell number (Figure S1F), demonstrated that the reduced pancreas size likely results from decreased cell numbers. Histologically, Rictor null pancreata appeared normal, with the relative abundance of acinar, α- and β-cells similar to Rictor intact pancreata, as determined by immunostaining for the markers amylase, glucagon and insulin, respectively (Figure S1G). Glucose tolerance tests revealed that mice with Rictor null pancreata did show impaired glucose metabolism compared with wild-type littermates (Figure S1H). Importantly, however, mice with Rictor null pancreata were monitored for 500 days and did not exhibit any symptoms of ill health (n=11).
mTORC2 deficiency impairs development and progression of KRASG12D-driven PanIN lesions
Both 3-phosphoinositide-dependent protein kinase 1 (PDK1) and mTORC2 are required for full activation of AKT and SGK family members. PDK1 is essential for the development of KRAS-driven PanIN lesions and PDAC (9). We therefore hypothesized that mTORC2 is similarly required for KRAS-driven tumorigenesis. The well-established Ptf1a-Cre+/-; LSL-KrasG12D/wt mouse model develops PanIN lesions that mirror the human lesions that can progress to PDAC (31). To investigate the role of mTORC2 signaling in this model, Ptf1a-Cre+/-;LSL-KrasG12D/wt;Rictorwt/wt (KC) and Ptf1a-Cre+/-;LSL-KRASG12D/wt;Rictorfl/fl (KC RictorΔ/Δ) siblings were produced and their pancreata analyzed at 4 or 8 months of age. Consistent with published studies, significant replacement of acinar cells by PanIN lesions containing abundant reactive stroma was evident in KC mice at 4 months of age (Figure 1A,B). In contrast, KC RictorΔ/Δ pancreata displayed fewer PanIN lesions and significant retention of acinar tissue (Figure 1A, B). Moreover, while KC pancreata displayed PanIN1B and PanIN2 lesions, precursors lesions observed in KC RictorΔ/Δ pancreata were restricted to PanIN1A. Quadchrome staining of the mucins produced by PanIN cells and collagen deposited by the reactive stromal cells, highlighted the differences between pancreata of the two genotypes (Figure 1A). Importantly, Rictor RNAscope showed that the PanINs arising in KC RictorΔ/Δ pancreata lacked Rictor RNA, ruling out the possibility that these cells had escaped recombination (Figure 1A).
Figure 1. Loss of Rictor impairs the development and progression of KrasG12D- driven PanINs.

Histological evaluation of PanIN lesions in pancreata from 4-month (A, B) and 8-month old (C, D) KC and KC RictorΔ/Δ mice. (A) Representative images from H&E stained tissues, quadchrome stained tissues and Rictor RNAscope® stained tissues. The quadchrome stain marks collagen red, mucin blue, cytoplasm yellow-brown, and nucleic acids black. (B) Quantification of normal and neoplastic tissue as a percentage of total tissue area in 4-month old KC and KC RictorΔ/Δ pancreata. (C) Representative images from H&E stained tissues, quadchrome stained tissues and Rictor RNAscope® stained tissues. (D) Quantification of normal and neoplastic tissue as a percentage of total tissue area in 8-month old KC and KC RictorΔ/Δ pancreata. Student’s t test: *p<0.05, **p<0.01, ***p<0.001.
Acinar replacement in KC mice was nearly complete by 8 months and most PanIN lesions had progressed to PanIN2 (Figure 1C, D). This KRAS-driven phenotype is significantly impaired in KC RictorΔ/Δ pancreata, with retention of acinar tissue, fewer PanINs and reduced reactive stroma (Figure 1C, D). Again, the PanINs present still lacked Rictor RNA (Figure 1C). Moreover, the PanINs present failed to progress beyond PanIN1 (Figure 1D). Together, these data indicate that Rictor deletion impairs the development of KRAS-driven PanINs and blocks their progression to higher-grade lesions.
Rictor null PanIN lesions display impaired mTORC2 signaling
To determine the status of mTORC2 signaling in PanIN lesions, pancreata from 8-month old mice were stained for mTORC2 targets. Relative to PanINs present in KC mice, KC RictorΔ/Δ PanINs displayed significantly reduced mTORC2 signaling, as measured by phospho-AKTS473 and phospho-NDRG1T346 (Figure 2). The reduced activity was specific to mTORC2 as PDK1-dependent phosphorylation of AKT on Thr308 was unaffected, as was phosphorylation of the mTORC1 target S6Kinase, and the MAPK signaling components ERK1/2 (Figure 2). Thus, the PanINs present in KC RictorΔ/Δ pancreata have not escaped Rictor gene deletion and develop in the absence of active mTORC2 signaling.
Figure 2. mTORC2, but not mTORC1, is functionally absent in KC RictorΔ/Δ PanINs.
Immunostaining for pAKT, pNDRG1, pERK and pSGK1 in pancreata from 8-month old KC and KC RictorΔ/Δ mice (200x magnification).
Loss of mTORC2 signaling induces proliferative arrest
The lack of compensatory activation of other signaling pathways and the limited progression of KC RictorΔ/Δ PanINs indicated fundamental phenotypic differences between KC and KC RictorΔ/Δ PanINs. We therefore compared the proliferation and apoptosis rates in PanINs of each genotype and found that the percentage of Ki67-positive nuclei in KC RictorΔ/Δ PanIN1 lesions was significantly lower than in KC PanIN1 lesions, at both 4 and 8 months (Figure S2A, B). Apoptosis rates, as assessed by cleaved caspase 3 staining, were very low in both genotypes and not different between the groups (Figure S2C, D). Together, these data suggest that mTORC2 inactivation impairs cell cycle progression in early PanIN lesions.
The cyclin dependent kinase (CDK) inhibitor p16Ink4a has been proposed as a barrier to KRAS-driven PDAC development (32). We therefore assessed p16Ink4a expression in KC and KC RictorΔ/Δ PanIN lesions by immunostaining. We found that the number of cells with nuclear localized p16Ink4a was significantly increased in KC RictorΔ/Δ PanINs, relative to KC PanINs, at both the 4- and 8-month time points (Figure 3A, Figure S3A). We also evaluated the CDK inhibitors p21Cip1 and p27Kip1 and found the number of p21Cip1- and p27Kip1-positive nuclei was similar between groups at the 4-month time point (Figure 3B, C; Figure S3B, C). However, we observed that while the number of positive nuclei decreased in PanIN lesions in 8-month old KC mice, they remained elevated in KC RictorΔ/Δ PanIN lesions (Figure 3B, C; Figure S3B, C). Thus, KC RictorΔ/Δ PanIN lesions display coordinate elevation of multiple CDK inhibitors.
Figure 3. Rictor-deficient PanINs display increased nuclear expression of CDK inhibitors and decreased nuclear expression of BMI1.

(A-D) Quantification of nuclear staining in PanIN1 lesions in 4- (left) and 8- (right) month old KC and KC RictorΔ/Δ mice. (A) p16Ink4a, (B) p21Cip, (C) p27Kip1 and (D) BMI1. **p<0.01, ***p<0.001 as determined by student’s t-test in individual comparisons of cohorts. (E) Doubling time of a PanIN-derived cell line 4-6 days following shRNA-mediated Rictor knockdown. P values determined by counter variance analysis of inverse slopes. (F) Senescence-associated β-galactosidase positivity in a PanIN-derived cell line 4 days following shRNA-mediated Rictor knockdown. **p<0.01, ***p<0.001 as determined by student’s t-test.
The concomitant elevation in p16Ink4a, p21Cip1, and p27Kip1 levels suggested the possibility that their expression may be regulated by a common factor. The polycomb repressor group complex 1 protein BMI1 is a negative regulator of p16Ink4a expression and has been implicated in p21Cip1 and p27Kip1 down-regulation (33). Moreover, BMI1 is required for Kras-driven PanIN formation and progression (34). We therefore evaluated BMI1 expression in KC and KC RictorΔ/Δ PanIN1 lesions. We found that the percentage of cells with nuclear BMI1 staining was decreased in KC RictorΔ/Δ PanIN lesions relative to KC controls at both the 4-month and 8-month time points (Figure 3D, Figure S3D).
We next sought to model the effect of mTORC2 inhibition in PanIN cells in an in vitro system. We performed shRNA-mediated knockdown of Rictor in two primary PanIN cell lines established from KC mice with early PanIN lesions (29). Rictor knockdown significantly reduced proliferation in both cell lines and enhanced the expression of senescence-associated beta galactosidase (Figure 3E, F; Figure S3E). In contrast to our observations in vivo, however, we did not observe any changes in the expression of the CDK inhibitors p16Ink4a, p21Cip1 or p27Kip1, nor did we observe changes in BMI1 expression (Figure S3F, G). It is possible that this difference is due to transformation in culture, given that these cell lines are able to form tumors when transplanted into immunocompromised mice. Taken together, our data suggest that Rictor knockdown impairs PanIN development and progression at least in part by robustly blocking cell proliferation.
mTORC2 loss impairs PanIN progression following pancreas injury
Pancreatitis is a major risk factor for the development of PDAC and can be modeled in mice using caerulein-induced pancreatic injury (28). To determine whether Rictor deletion impacted the response to injury we performed serial caerulein injections in 6-week old wild-type and RictorΔ/Δ mice. Wild-type and RictorΔ/Δ mice displayed similar responses with stereotypical histologic changes - including acinar-to-ductal metaplasia (ADM), levels of which were not significantly altered by Rictor deletion, and increased separation of acinar lobules - evident 2 days following injection (Figure S4). As expected, injury was fully resolved by 21 days post-injection in wild-type mice, and also in RictorΔ/Δ mice (Figure S4). These data suggest that Rictor is not required for pancreatic tissue repair, although it is possible that tissue repair could be delayed at earlier stages post-injury.
Expression of activated Kras enhanced the response to caerulein, with extensive ADM visible 2 days following treatment (Figure 4A). However, Rictor deletion blunted ADM development (Figure 4A). Moreover, while KC mice evaluated 21 days following treatment displayed complete replacement of the pancreas parenchyma with PanIN lesions, many of which had progressed to PanIN1B and PanIN2, KC RictorΔ/Δ pancreata displayed significant retention of normal acinar tissue, and significantly fewer PanIN1B and PanIN2 lesions (Figure 4A, B).
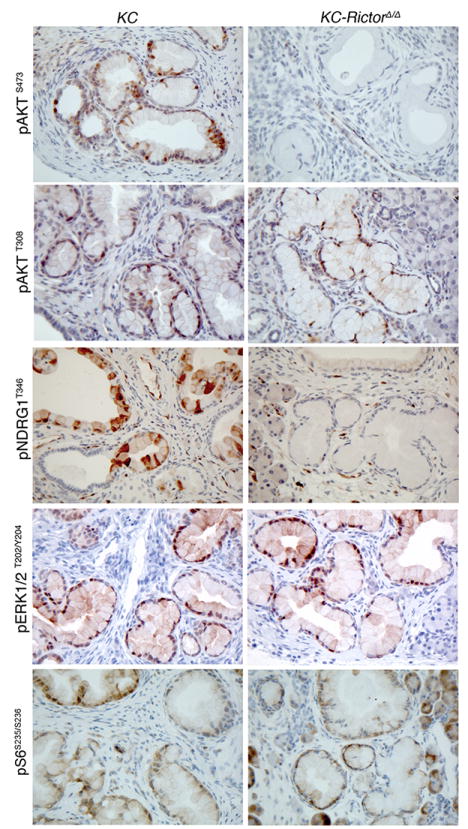
Figure 4. Rictor deletion impairs the progression of pancreatitis-induced PanINs.
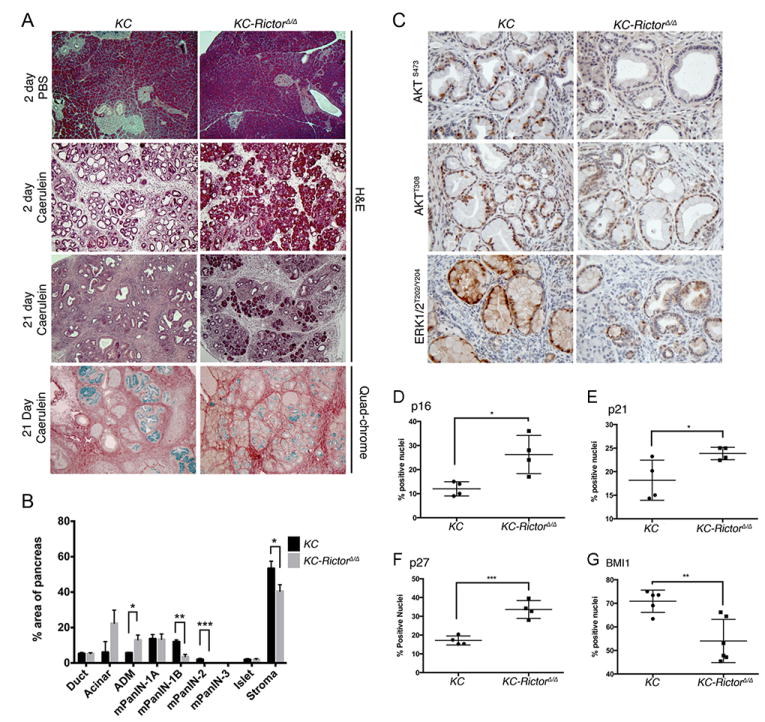
(A) H&E and quadchrome staining of pancreata from KC and KC RictorΔ/Δ mice harvested 2 or 21 days following injection of caerulein or PBS (100x magnification). (B) Quantification of normal and neoplastic tissue as a percentage of total tissue area in pancreata from KC and KC RictorΔ/Δ mice 21 days post-caerulein injection (n=5-6 mice per cohort). (C) IHC for pAKTS473, pAKTT308, and pERK1/2T202/Y204 in pancreata from KC and KC RictorΔ/Δ mice 21 days post-caerulein injection (200x magnification). (D-G) Quantification of positive nuclei in PanIN1 lesions in KC and KC RictorΔ/Δ pancreata 21 days post-caerulein injection. (D) p16Ink4a, (E) p21Cip, (F) p27Kip1 and (G) BMI1. Student’s t test: *p<0.05, **p<0.01, ***p<0.001.
Evaluation of mTORC2 signaling via immunostaining for p-AKTS473 demonstrated that mTORC2 activity was impaired in KC RictorΔ/Δ lesions compared with KC lesions (Figure 4C). By contrast, p-AKTT308 staining was equivalent between both genotypes (Figure 4C). Intriguingly, we observed that p-ERK staining was elevated in KC lesions relative to KC RictorΔ/Δ lesions, suggesting that mTORC2 signaling is required for activation of the MEK/ERK signaling cascade following injury-mediated PanIN progression (Figure 4C). To ascertain whether similar mechanisms mediate inhibition of PanIN progression in this model, we assessed the presence of nuclear CDK inhibitors p16Ink4a, p21 and p27. We found that KC RictorΔ/Δ lesions had elevated levels of these markers (Figure 4D-F, S5A-C). Moreover, CDK inhibitor levels inversely correlated with nuclear BMI1 localization (Figure 4G, S5D).
Assessment of CD45-positive infiltrating immune cells failed to show differences between KC and KC RictorΔ/Δ pancreata (Figure S5E). Further evaluation of the expression levels of inflammation associated genes using the Nanostring platform demonstrated differences between the pancreata of KC and KC RictorΔ/Δ mice injected with PBS (Figure S5F). Notably, macrophage associated genes, including Il6 and Stat3, which have been shown to be involved in macrophage-mediated inflammation in the KC mouse model, were reduced in the KC RictorΔ/Δ samples relative to the KC samples (35). However, whilst these differences remained, they were not further enhanced following caerulein treatment (Figure S5F). Together, these data suggest that the absence of mTORC2 signaling impairs the progression of PanIN lesions following pancreatic injury.
Rictor deletion delays tumor formation in KPC mice
Our data above demonstrated that Rictor gene deletion severely impairs PanIN development and progression. To determine whether Rictor deletion inhibits the progression from PanIN to PDAC in an aggressive model of pancreatic tumorigenesis, we crossed Rictorfl/fl mice with KPC (Pdx1-Cre;LSL-KrasG12D/wt;LSL-Trp53R172H/wt) mice, to generate KPC RictorΔ l Δ mice. We found that Rictor deletion dramatically delayed tumor formation in the KPC model, with median survival almost doubled in KPC RictorΔ l Δ mice compared with KPC Rictor+/+ mice (Figure 5A). Further, 8 out of 47 KPC RictorΔ l Δ mice sacrificed due to other pathologies were found to be tumor-free at over 200 days old. Deletion of one copy of Rictor was insufficient to affect tumor development (Figure 5A). Interestingly, we did not observe any apparent histological or pathological differences in the tumors that eventually developed in the KPC RictorΔ l Δ mice compared with those in KPC Rictor+/+ mice. However, using RNAscope® we confirmed the absence of Rictor RNA demonstrating that the tumors were not derived from cells that failed to delete the Rictor locus (Figure 5B). These findings are supported by in vitro observations in murine PDAC cell lines in which Rictor knockdown impairs cell proliferation (Figure S6A-B, D-E), and reduces anchorage independent growth (Figure S6C, F).
Figure 5. Rictor deletion delays tumor formation in a mouse model of pancreatic cancer.

(A) Kaplan-Meier survival analysis showing PDAC-free survival in KPC, KPC RictorΔ/+, and KPC RictorΔ/Δ mice. Ticks indicate mice censored due to extra-pancreatic pathologies. p values determined by Log Rank test comparing individual cohorts separately. (B) RNAscope® showing absence of Rictor in tumors from KPC RictorΔ/Δ (spleen shown as positive control) compared with KPC mice. (C) IHC for downstream mTOR signaling pathway components in KPC and KPC RictorΔ/Δ tumors as indicated. (D) IHC for Ki67, p21, p27 and pERK in KPC and KPC RictorΔ/Δ tumors as indicated.
We next examined the effects of Rictor deletion on mTOR targets by immunohistochemistry. Rictor deletion had no effect on phosphorylation of the mTORC1 signaling targets, S6 and 4E-BP1, but as expected, completely abrogated phosphorylation of the mTORC2 downstream specific targets pAKTS473 and pNDRG1 (Figure 5C). We did not observe any differences in proliferation, as determined by Ki67 staining, or in p21 expression, which is perhaps unsurprising in advanced tumors (Figure 5D). We did however observe slightly elevated nuclear p27 in KPC RictorΔ l Δ tumors, and interestingly, decreased pERK, suggesting that in this system Akt activation does not result in Raf-MEK-ERK inhibition (Figure 5D). Taken together, our results show that mTORC2 signaling plays a significant role in pancreatic tumorigenesis and targeting mTORC2 could have therapeutic impact in this disease.
Pharmacological inhibition of mTORC1/2 delays tumor formation in KPC mice
To test this hypothesis we used AZD2014, a dual mTORC1/2 inhibitor recently investigated in a phase I clinical trial (36). We previously showed that KPC mice were resistant to treatment with rapamycin, and therefore not dependent on mTORC1 signaling (23), however, AZD2014 allowed us to evaluate the impact of inhibiting both mTOR signaling complexes using a clinically relevant inhibitor. We first tested AZD2014 in vitro using KPC tumor cell lines and showed that signaling downstream of both mTORC1 and mTORC2, assessed by immunoblotting for pAKTS473, pS6 and p4E-BP1, was effectively inhibited (Figure S7A). We next treated cohorts of KPC mice from 10 weeks of age with gemcitabine, AZD2014 or AZD2014 in combination with gemcitabine. This timepoint was selected in order to mimic surgically resectable disease, and to exclude tumor-promoting effects that may not be evident when mice with late-stage disease are treated. In line with previous studies, gemcitabine treatment offered negligible benefit (Figure 6A). In contrast, AZD2014 treatment significantly delayed tumor progression. Combination of AZD2014 and gemcitabine further prolonged survival, and mice treated with this combination had a median survival of 280 days compared with 147 days for those treated with gemcitabine alone (Figure 6A). These data were supported by our demonstration that AZD2014 and gemcitabine act synergistically to induce PDAC cell death in vitro (Figure S7B). When we assessed inhibition of mTOR targets by IHC we found that phosphorylation of both mTORC1 and mTORC2 targets was suppressed, although mTORC2 signaling was more efficiently inhibited (Figure 6B). Similar to KPC RictorΔ/Δ mice, we did not observe any differences in p21 expression upon AZD2014 treatment, however we did observe a decrease in proliferation based on Ki67 staining, and as in KPC RictorΔ l Δ tumors, we also observed slightly elevated nuclear p27 and decreased pERK (Figure 6C). Thus, we conclude that dual mTORC1/2 inhibition can effectively block signaling downstream of mTOR, and may hold promise as a novel therapeutic strategy in pancreatic cancer.
Figure 6. Pharmacological inhibition of mTORC1/2 delays tumor formation in KPC mice.

(A) Kaplan-Meier survival analysis showing PDAC-free survival in KPC mice treated from 10w with AZD2014, Gemcitabine, or AZD2014+Gemcitabine. Ticks indicate mice censored due to extra-pancreatic pathologies. p values determined by Log Rank test comparing individual cohorts separately. (B) IHC for downstream mTOR signaling pathway components in tumors from AZD2014-treated and untreated KPC mice as indicated. (C) IHC for Ki67, p21, p27 and pERK in KPC and KPC RictorΔ/Δ tumors as indicated.
Inhibition of mTORC1/2 prolongs survival in late stage tumors
We also tested the effects of AZD2014 treatment in mice with late stage tumors. We monitored KPC mice until they exhibited clinical signs of PDAC, including swollen abdomen, cachexia, hunching, and the presence of a palpable tumor. At this stage mice were randomized onto treatment with vehicle, gemcitabine, AZD2014, or AZD2014 combined with gemcitabine. We found that survival from the commencement of treatment was significantly prolonged by AZD2014 treatment (Figure 7A). Interestingly, combination of AZD2014 with gemcitabine did not further extend survival (Fig. 7A). When we assessed inhibition of mTOR targets by IHC we found that phosphorylation of downstream targets of both mTORC1 (S6, 4E-BP1) and mTORC2 (AKT, NDRG1) was suppressed (Figure 7B), although again, mTORC2 signaling was more efficiently suppressed. Although we saw an impact in a very aggressive late stage model, mice still rapidly progressed to end stage disease. Consistent with this, in this late setting in vivo we did not observe induction of CDK inhibitors, nor did we observe changes in other potential targets of RICTOR such as c-MYC (37), showing that as tumors progress in vivo they become less susceptible to mTORC2 inhibition as a single agent.
Figure 7. Pharmacological inhibition of mTORC1/2 prolongs survival in mice with late stage tumors.
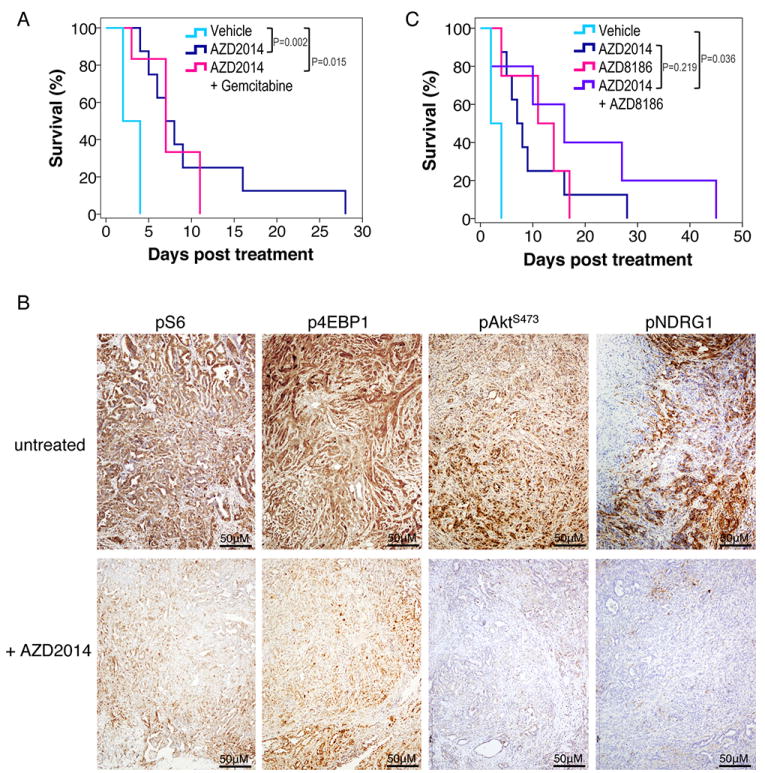
(A) Kaplan-Meier survival analysis showing survival in KPC mice treated from the onset of symptoms with vehicle (n=4), AZD2014 (n=8), or AZD2014+Gemcitabine (n=6). (B) IHC for downstream mTOR signaling pathway components in treated and untreated KPC tumors as indicated. (C) Kaplan-Meier survival analysis showing survival in KPC mice treated from the onset of clinical symptoms with vehicle (n=4), AZD2014 (n=8), AZD8186 (n=4), or AZD2014+AZD8186 (n=5). P values calculated by Log Rank test.
Inhibition of PI3K co-operates with mTORC1/2 inhibition to prolong survival in late- stage tumor-bearing mice
Recent studies have suggested that cancer cells can escape the requirement for mTOR through uptake of nutrients (38). In addition, mTORC1 inhibition results in feedback activation of the PI3K/AKT axis (39). Therefore, we tested whether inhibiting PI3K signaling could enhance the chemotherapeutic effects of AZD2014. Previous elegant studies have shown deletion of PI3Kα blocked tumor formation but not tumor growth (9), consistent with our findings with Rictor gene deletion. Moreover Rac1 deletion strongly suppresses pancreatic carcinogenesis and this was suggested to be downstream of PI3K (40,41). Given Rac1 can also modify macropinocytosis, inhibiting PI3K may also suppress some of the mechanisms of nutrient uptake when mTOR is depleted. Since PI3Kβ is the primary isoform that links PI3K signaling to RAC1 (42), we combined AZD2014 with a PI3Kβ kinase inhibitor, AZD8186 (43). We first investigated whether AZD2014-AZD8186 co-treatment reduced KPC tumor cell viability in vitro (Figure S8A). AZD2014 proved potent in reducing cell viability (as observed previously with Rictor knockdown) and combined treatment with AZD8186 (which alone had little effect) further reduced cell viability (Figure S8A). Interestingly, in this scenario we were able to detect diminished Myc expression and p27 upregulation in the dual treated cell lines (Figure S8B).
Therefore, we decided to investigate the effects of inhibiting mTORC1/2 and PI3K in mice with late stage tumors. As previously, we monitored KPC mice until they exhibited symptoms of PDAC and a palpable tumor, and then treated with AZD2014 and/or AZD8186. We found that survival was extended by AZD2014 and AZD8186 co-treatment relative to treatment with either compound alone (Figure 7C). Taken together, our data show that Rictor-mediated signaling plays a crucial role in pancreatic cancer tumorigenesis. Moreover, mTORC2 inhibition, particularly as part of a combinatorial approach, potentially represents a new therapeutic strategy for this disease.
Discussion
Pancreatic cancer is an almost universally lethal disease, and better understanding of the signaling pathways involved in its pathogenesis is required. Cytotoxic chemotherapy has limited efficacy, so the development of targeted therapeutic strategies is an attractive approach. Mutation of KRAS is almost universally the driving force in initiation. Indeed, inducible mouse models have demonstrated that pancreatic tumors retain dependence on activated KRAS signaling (44,45). Past attempts to directly inhibit KRAS have failed, however, inhibition of key signaling pathways downstream of KRAS may hold promise. Prior studies have shown PI3K signaling to be a key mediator of oncogenic KRAS in the pancreas (9). mTOR is one of the major effectors of PI3K, however, its involvement in pancreatic tumorigenesis has been relatively understudied. Clinical trials aimed at inhibiting mTORC1 have failed, and given the high cost of trials and the high attrition rate for most novel putative therapeutic agents, a greater understanding of how signaling through mTORC1 and mTORC2 contributes to pancreatic tumorigenesis is required.
Here we demonstrate that genetic deletion of the mTORC2 complex component, Rictor, strongly suppresses pancreatic tumorigenesis. This anti-tumorigenic effect of Rictor deletion was associated with increased expression of CDK inhibitors, reduced proliferation, and features of senescence in vitro. Our findings are in line with recent studies in prostate cancer (19) and melanoma (46) that demonstrated a requirement for mTORC2 signaling. Importantly, while loss of Rictor significantly prolonged tumor latency in KPC mice, tumors ultimately progressed, and the anti-proliferative signals observed in pre-neoplastic lesions were lost in late-stage tumors, perhaps due to loss of p53. Indeed, the presence of wild-type p53 may augment the anti-proliferative effects of mTOR inhibition (47). Our findings suggest that mTORC2 signaling plays an important role during pancreatic tumorigenesis. However, it remains possible that mTORC2-independent functions of Rictor contribute to the observed phenotypes. Additional studies utilizing null alleles for other mTORC2 components would address this issue.
Given our prior finding that pharmacologic inhibition of mTORC1 with rapamycin showed no efficacy in the ‘gold-standard’ KPC mouse model (23), recapitulating negative results using mTORC1 inhibitors in clinical trials, it was important to determine whether inhibition of both mTOR signaling complexes is an effective strategy. Our data using the mTOR kinase inhibitor AZD2014 demonstrate that blockade of mTOR signaling impairs the progression to end-stage disease and enhanced the benefit of gemcitabine. The mechanism for this cooperation is unclear, however, inhibition of mTOR signaling may reduce expression of the low-density lipoprotein receptor (LDLR) (48), and LDLR depletion can increase the efficacy of gemcitabine in KPC mice (49). It would be interesting in the future to compare directly the effects of clinically relevant mTORC1 inhibitors with dual mTOR inhibitors. Nevertheless, our findings indicate that dual targeting of mTOR may represent a potential treatment strategy in PDAC.
Dual targeting of mTORC1/2 has a number of benefits. mTORC2 signaling is almost completely abrogated in tumors from treated mice, similar to the effects we observed with Rictor deletion. Further, mTORC1 inhibition alone may actually enhance proliferation of activated KRAS-expressing cells in the setting of nutrient deprivation, by increasing the efficiency of utilization of extracellular proteins (38). Considering that PDAC is characterized by a dense stroma that may provide not only physical, but nutritional support for tumor cells, it is perhaps not surprising that inhibition of mTORC1 alone is ineffective. It should also be noted that in all in vitro systems we found that AZD2014 or Rictor knockdown had profound effects on soft agar growth and tumor cell proliferation suggesting that the tumor microenvironment might also be the source of support for the late stage aggressive tumors.
Molecularly targeted therapeutics often fail to display expected anti-tumor effects due to stimulation of feedback mechanisms. Indeed, mTOR inhibition can promote feedback activation of PI3K (39), which, in turn, can specifically activate mTORC2 through release of SIN1-mediated suppression of mTOR by PIP3 binding (50). Therefore, our finding that combined mTOR and PI3Kβ inhibition prolonged survival in mice with end-stage disease provides further support for the evaluation of mTOR kinase inhibitors in PDAC where most patients present with disseminated disease.
The pathways downstream of mTORC2 signaling may also represent potential therapeutic targets. For example, in addition to AKT, mTORC2 signaling also regulates SGK1 (14) and PKCα (51). Increased expression of SGK has been observed in several cancer types, while cancer cell lines bearing PIK3CA mutations have been shown to be dependent on SGK (52). mTORC2 can also regulate PKCα and RAC (51,53), both of which potentially influence tumorigenesis by affecting the spatial control of cell growth. In fact, RAC1 is reported to play an important role in KRAS-driven pancreatic tumorigenesis (40,41). MYC is also a reported target of mTORC2 (37), and we recently demonstrated that pancreatic tumorigenesis is significantly delayed by Myc deficiency (54). Defining the relative contributions of these downstream molecules is required to determine the mechanisms underlying the requirement for mTORC2 signaling described here. In addition, recent work demonstrated that the temporal sequence of drug delivery can dramatically alter cellular response (55). Therefore, it will be vital to determine the optimal sequence and timing of delivery of mTOR inhibitors (and other targeted drugs) when used in combination with each other or cytotoxic drugs such as gemcitabine.
Supplementary Material
Acknowledgments
The authors apologize to all those colleagues whose important work was not cited in this paper owing to restrictions. The authors would like to thank the CRUK Glasgow Centre and the BSU facilities and Histology Service at the CRUK Beatson Institute. This work was funded by CRUK (C596/A18076, C596/A17196) and NIH grants R01CA155784 (to BCL) and F30CA168063 (to BJQ). The authors thank Victor Adelanwa for excellent technical assistance and Sabine Cosulich for discussions on the manuscript.
Footnotes
Disclosure: The authors have no competing interests to disclose
References
- 1.Ryan DP, Hong TS, Bardeesy N. Pancreatic adenocarcinoma. The New England journal of medicine. 2014;371:2140–1. doi: 10.1056/NEJMc1412266. [DOI] [PubMed] [Google Scholar]
- 2.Rahib L, Smith BD, Aizenberg R, Rosenzweig AB, Fleshman JM, Matrisian LM. Projecting cancer incidence and deaths to 2030: the unexpected burden of thyroid, liver, and pancreas cancers in the United States. Cancer Res. 2014;74:2913–21. doi: 10.1158/0008-5472.CAN-14-0155. [DOI] [PubMed] [Google Scholar]
- 3.Siegel RL, Miller KD, Jemal A. Cancer statistics, 2015. CA: a cancer journal for clinicians. 2015;65:5–29. doi: 10.3322/caac.21254. [DOI] [PubMed] [Google Scholar]
- 4.Garrido-Laguna I, Hidalgo M. Pancreatic cancer: from state-of-the-art treatments to promising novel therapies. Nature reviews Clinical oncology. 2015;12:319–34. doi: 10.1038/nrclinonc.2015.53. [DOI] [PubMed] [Google Scholar]
- 5.Biankin AV, Waddell N, Kassahn KS, Gingras MC, Muthuswamy LB, Johns AL, et al. Pancreatic cancer genomes reveal aberrations in axon guidance pathway genes. Nature. 2012;491:399–405. doi: 10.1038/nature11547. [DOI] [PMC free article] [PubMed] [Google Scholar]
- 6.Neesse A, Algul H, Tuveson DA, Gress TM. Stromal biology and therapy in pancreatic cancer: a changing paradigm. Gut. 2015;64:1476–84. doi: 10.1136/gutjnl-2015-309304. [DOI] [PubMed] [Google Scholar]
- 7.Baines AT, Xu D, Der CJ. Inhibition of Ras for cancer treatment: the search continues. Future medicinal chemistry. 2011;3:1787–808. doi: 10.4155/fmc.11.121. [DOI] [PMC free article] [PubMed] [Google Scholar]
- 8.Cully M, You H, Levine AJ, Mak TW. Beyond PTEN mutations: the PI3K pathway as an integrator of multiple inputs during tumorigenesis. Nature reviews Cancer. 2006;6:184–92. doi: 10.1038/nrc1819. [DOI] [PubMed] [Google Scholar]
- 9.Eser S, Reiff N, Messer M, Seidler B, Gottschalk K, Dobler M, et al. Selective Requirement of PI3K/PDK1 Signaling for Kras Oncogene-Driven Pancreatic Cell Plasticity and Cancer. Cancer cell. 2013;23:406–20. doi: 10.1016/j.ccr.2013.01.023. [DOI] [PubMed] [Google Scholar]
- 10.Rodon J, Dienstmann R, Serra V, Tabernero J. Development of PI3K inhibitors: lessons learned from early clinical trials. Nature reviews Clinical oncology. 2013;10:143–53. doi: 10.1038/nrclinonc.2013.10. [DOI] [PubMed] [Google Scholar]
- 11.Huang K, Fingar DC. Growing knowledge of the mTOR signaling network. Seminars in cell & developmental biology. 2014;36:79–90. doi: 10.1016/j.semcdb.2014.09.011. [DOI] [PMC free article] [PubMed] [Google Scholar]
- 12.Zhang J, Gao Z, Yin J, Quon MJ, Ye J. S6K directly phosphorylates IRS-1 on Ser-270 to promote insulin resistance in response to TNF-(alpha) signaling through IKK2. The Journal of biological chemistry. 2008;283:35375–82. doi: 10.1074/jbc.M806480200. [DOI] [PMC free article] [PubMed] [Google Scholar]
- 13.Carracedo A, Ma L, Teruya-Feldstein J, Rojo F, Salmena L, Alimonti A, et al. Inhibition of mTORC1 leads to MAPK pathway activation through a PI3K-dependent feedback loop in human cancer. The Journal of clinical investigation. 2008;118:3065–74. doi: 10.1172/JCI34739. [DOI] [PMC free article] [PubMed] [Google Scholar]
- 14.Garcia-Martinez JM, Alessi DR. mTOR complex 2 (mTORC2) controls hydrophobic motif phosphorylation and activation of serum- and glucocorticoid-induced protein kinase 1 (SGK1) The Biochemical journal. 2008;416:375–85. doi: 10.1042/BJ20081668. [DOI] [PubMed] [Google Scholar]
- 15.Guertin DA, Stevens DM, Thoreen CC, Burds AA, Kalaany NY, Moffat J, et al. Ablation in mice of the mTORC components raptor, rictor, or mLST8 reveals that mTORC2 is required for signaling to Akt-FOXO and PKCalpha, but not S6K1. Developmental cell. 2006;11:859–71. doi: 10.1016/j.devcel.2006.10.007. [DOI] [PubMed] [Google Scholar]
- 16.Kennedy AL, Morton JP, Manoharan I, Nelson DM, Jamieson NB, Pawlikowski JS, et al. Activation of the PIK3CA/AKT pathway suppresses senescence induced by an activated RAS oncogene to promote tumorigenesis. Mol Cell. 2011;42:36–49. doi: 10.1016/j.molcel.2011.02.020. [DOI] [PMC free article] [PubMed] [Google Scholar]
- 17.Cheng H, Zou Y, Ross JS, Wang K, Liu X, Halmos B, et al. RICTOR Amplification Defines a Novel Subset of Patients with Lung Cancer Who May Benefit from Treatment with mTORC1/2 Inhibitors. Cancer Discov. 2015;5:1262–70. doi: 10.1158/2159-8290.CD-14-0971. [DOI] [PMC free article] [PubMed] [Google Scholar]
- 18.Laugier F, Finet-Benyair A, Andre J, Rachakonda PS, Kumar R, Bensussan A, et al. RICTOR involvement in the PI3K/AKT pathway regulation in melanocytes and melanoma. Oncotarget. 2015;6:28120–31. doi: 10.18632/oncotarget.4866. [DOI] [PMC free article] [PubMed] [Google Scholar]
- 19.Guertin DA, Stevens DM, Saitoh M, Kinkel S, Crosby K, Sheen JH, et al. mTOR complex 2 is required for the development of prostate cancer induced by Pten loss in mice. Cancer cell. 2009;15:148–59. doi: 10.1016/j.ccr.2008.12.017. [DOI] [PMC free article] [PubMed] [Google Scholar]
- 20.Xu K, Liu P, Wei W. mTOR signaling in tumorigenesis. Biochim Biophys Acta. 2014;1846:638–54. doi: 10.1016/j.bbcan.2014.10.007. [DOI] [PMC free article] [PubMed] [Google Scholar]
- 21.Nelson V, Altman JK, Platanias LC. Next generation of mammalian target of rapamycin inhibitors for the treatment of cancer. Expert opinion on investigational drugs. 2013;22:715–22. doi: 10.1517/13543784.2013.787066. [DOI] [PubMed] [Google Scholar]
- 22.Guertin DA, Sabatini DM. The pharmacology of mTOR inhibition. Sci Signal. 2009;2:pe24. doi: 10.1126/scisignal.267pe24. [DOI] [PubMed] [Google Scholar]
- 23.Morran DC, Wu J, Jamieson NB, Mrowinska A, Kalna G, Karim SA, et al. Targeting mTOR dependency in pancreatic cancer. Gut. 2014;63:1481–9. doi: 10.1136/gutjnl-2013-306202. [DOI] [PMC free article] [PubMed] [Google Scholar]
- 24.Kawaguchi Y, Cooper B, Gannon M, Ray M, MacDonald RJ, Wright CV. The role of the transcriptional regulator Ptf1a in converting intestinal to pancreatic progenitors. Nature genetics. 2002;32:128–34. doi: 10.1038/ng959. [DOI] [PubMed] [Google Scholar]
- 25.Shiota C, Woo JT, Lindner J, Shelton KD, Magnuson MA. Multiallelic disruption of the rictor gene in mice reveals that mTOR complex 2 is essential for fetal growth and viability. Developmental cell. 2006;11:583–9. doi: 10.1016/j.devcel.2006.08.013. [DOI] [PubMed] [Google Scholar]
- 26.Bentzinger CF, Romanino K, Cloetta D, Lin S, Mascarenhas JB, Oliveri F, et al. Skeletal muscle-specific ablation of raptor, but not of rictor, causes metabolic changes and results in muscle dystrophy. Cell metabolism. 2008;8:411–24. doi: 10.1016/j.cmet.2008.10.002. [DOI] [PubMed] [Google Scholar]
- 27.Hingorani SR, Wang L, Multani AS, Combs C, Deramaudt TB, Hruban RH, et al. Trp53R172H and KrasG12D cooperate to promote chromosomal instability and widely metastatic pancreatic ductal adenocarcinoma in mice. Cancer cell. 2005;7:469–83. doi: 10.1016/j.ccr.2005.04.023. [DOI] [PubMed] [Google Scholar]
- 28.Lerch MM, Gorelick FS. Models of acute and chronic pancreatitis. Gastroenterology. 2013;144:1180–93. doi: 10.1053/j.gastro.2012.12.043. [DOI] [PubMed] [Google Scholar]
- 29.Corcoran RB, Contino G, Deshpande V, Tzatsos A, Conrad C, Benes CH, et al. STAT3 plays a critical role in KRAS-induced pancreatic tumorigenesis. Cancer Res. 2011;71:5020–9. doi: 10.1158/0008-5472.CAN-11-0908. [DOI] [PMC free article] [PubMed] [Google Scholar]
- 30.Schreiber FS, Deramaudt TB, Brunner TB, Boretti MI, Gooch KJ, Stoffers DA, et al. Successful growth and characterization of mouse pancreatic ductal cells: functional properties of the Ki-RAS(G12V) oncogene. Gastroenterology. 2004;127:250–60. doi: 10.1053/j.gastro.2004.03.058. [DOI] [PubMed] [Google Scholar]
- 31.Hingorani SR, Petricoin EF, Maitra A, Rajapakse V, King C, Jacobetz MA, et al. Preinvasive and invasive ductal pancreatic cancer and its early detection in the mouse. Cancer cell. 2003;4:437–50. doi: 10.1016/s1535-6108(03)00309-x. [DOI] [PubMed] [Google Scholar]
- 32.Aguirre AJ, Bardeesy N, Sinha M, Lopez L, Tuveson DA, Horner J, et al. Activated Kras and Ink4a/Arf deficiency cooperate to produce metastatic pancreatic ductal adenocarcinoma. Genes & development. 2003;17:3112–26. doi: 10.1101/gad.1158703. [DOI] [PMC free article] [PubMed] [Google Scholar]
- 33.Zheng X, Wang Y, Liu B, Liu C, Liu D, Zhu J, et al. Bmi-1-shRNA inhibits the proliferation of lung adenocarcinoma cells by blocking the G1/S phase through decreasing cyclin D1 and increasing p21/p27 levels. Nucleic acid therapeutics. 2014;24:210–6. doi: 10.1089/nat.2013.0459. [DOI] [PMC free article] [PubMed] [Google Scholar]
- 34.Bednar F, Schofield HK, Collins MA, Yan W, Zhang Y, Shyam N, et al. Bmi1 is required for the initiation of pancreatic cancer through an Ink4a-independent mechanism. Carcinogenesis. 2015;36:730–8. doi: 10.1093/carcin/bgv058. [DOI] [PMC free article] [PubMed] [Google Scholar]
- 35.Lesina M, Kurkowski MU, Ludes K, Rose-John S, Treiber M, Kloppel G, et al. Stat3/Socs3 activation by IL-6 transsignaling promotes progression of pancreatic intraepithelial neoplasia and development of pancreatic cancer. Cancer cell. 2011;19:456–69. doi: 10.1016/j.ccr.2011.03.009. [DOI] [PubMed] [Google Scholar]
- 36.Basu B, Dean E, Puglisi M, Greystoke A, Ong M, Burke W, et al. First-in-Human Pharmacokinetic and Pharmacodynamic Study of the Dual m-TORC 1/2 Inhibitor AZD2014. Clin Cancer Res. 2015;21:3412–9. doi: 10.1158/1078-0432.CCR-14-2422. [DOI] [PMC free article] [PubMed] [Google Scholar]
- 37.Guo Z, Zhou Y, Evers BM, Wang Q. Rictor regulates FBXW7-dependent c-Myc and cyclin E degradation in colorectal cancer cells. Biochemical and biophysical research communications. 2012;418:426–32. doi: 10.1016/j.bbrc.2012.01.054. [DOI] [PMC free article] [PubMed] [Google Scholar]
- 38.Palm W, Park Y, Wright K, Pavlova NN, Tuveson DA, Thompson CB. The Utilization of Extracellular Proteins as Nutrients Is Suppressed by mTORC1. Cell. 2015;162:259–70. doi: 10.1016/j.cell.2015.06.017. [DOI] [PMC free article] [PubMed] [Google Scholar]
- 39.O’Reilly KE, Rojo F, She QB, Solit D, Mills GB, Smith D, et al. mTOR inhibition induces upstream receptor tyrosine kinase signaling and activates Akt. Cancer research. 2006;66:1500–8. doi: 10.1158/0008-5472.CAN-05-2925. [DOI] [PMC free article] [PubMed] [Google Scholar]
- 40.Heid I, Lubeseder-Martellato C, Sipos B, Mazur PK, Lesina M, Schmid RM, et al. Early requirement of Rac1 in a mouse model of pancreatic cancer. Gastroenterology. 2011;141:719–30. 30 e1–7. doi: 10.1053/j.gastro.2011.04.043. [DOI] [PubMed] [Google Scholar]
- 41.Wu CY, Carpenter ES, Takeuchi KK, Halbrook CJ, Peverley LV, Bien H et al. PI3K regulation of RAC1 is required for KRAS-induced pancreatic tumorigenesis in mice. Gastroenterology. 2014;147:1405–16. e7. doi: 10.1053/j.gastro.2014.08.032. [DOI] [PMC free article] [PubMed] [Google Scholar]
- 42.Yuzugullu H, Baitsch L, Von T, Steiner A, Tong H, Ni J, et al. A PI3K p110beta-Rac signalling loop mediates Pten-loss-induced perturbation of haematopoiesis and leukaemogenesis. Nature communications. 2015;6:8501. doi: 10.1038/ncomms9501. [DOI] [PMC free article] [PubMed] [Google Scholar]
- 43.Hancox U, Cosulich S, Hanson L, Trigwell C, Lenaghan C, Ellston R, et al. Inhibition of PI3Kbeta signaling with AZD8186 inhibits growth of PTEN-deficient breast and prostate tumors alone and in combination with docetaxel. Mol Cancer Ther. 2015;14:48–58. doi: 10.1158/1535-7163.MCT-14-0406. [DOI] [PubMed] [Google Scholar]
- 44.Collins MA, Bednar F, Zhang Y, Brisset JC, Galban S, Galban CJ, et al. Oncogenic Kras is required for both the initiation and maintenance of pancreatic cancer in mice. The Journal of clinical investigation. 2012;122:639–53. doi: 10.1172/JCI59227. [DOI] [PMC free article] [PubMed] [Google Scholar]
- 45.Ying H, Kimmelman AC, Lyssiotis CA, Hua S, Chu GC, Fletcher-Sananikone E, et al. Oncogenic Kras maintains pancreatic tumors through regulation of anabolic glucose metabolism. Cell. 2012;149:656–70. doi: 10.1016/j.cell.2012.01.058. [DOI] [PMC free article] [PubMed] [Google Scholar]
- 46.Damsky W, Micevic G, Meeth K, Muthusamy V, Curley DP, Santhanakrishnan M, et al. mTORC1 activation blocks BrafV600E-induced growth arrest but is insufficient for melanoma formation. Cancer cell. 2015;27:41–56. doi: 10.1016/j.ccell.2014.11.014. [DOI] [PMC free article] [PubMed] [Google Scholar]
- 47.Herzog A, Bian Y, Vander Broek R, Hall B, Coupar J, Cheng H, et al. PI3K/mTOR inhibitor PF-04691502 antitumor activity is enhanced with induction of wild-type TP53 in human xenograft and murine knockout models of head and neck cancer. Clin Cancer Res. 2013;19:3808–19. doi: 10.1158/1078-0432.CCR-12-2716. [DOI] [PMC free article] [PubMed] [Google Scholar]
- 48.Ai D, Chen C, Han S, Ganda A, Murphy AJ, Haeusler R, et al. Regulation of hepatic LDL receptors by mTORC1 and PCSK9 in mice. The Journal of clinical investigation. 2012;122:1262–70. doi: 10.1172/JCI61919. [DOI] [PMC free article] [PubMed] [Google Scholar]
- 49.Guillaumond F, Bidaut G, Ouaissi M, Servais S, Gouirand V, Olivares O, et al. Cholesterol uptake disruption, in association with chemotherapy, is a promising combined metabolic therapy for pancreatic adenocarcinoma. Proc Natl Acad Sci U S A. 2015;112:2473–8. doi: 10.1073/pnas.1421601112. [DOI] [PMC free article] [PubMed] [Google Scholar]
- 50.Liu P, Gan W, Chin YR, Ogura K, Guo J, Zhang J, et al. PtdIns(3,4,5)P3-Dependent Activation of the mTORC2 Kinase Complex. Cancer Discov. 2015;5:1194–209. doi: 10.1158/2159-8290.CD-15-0460. [DOI] [PMC free article] [PubMed] [Google Scholar]
- 51.Sarbassov DD, Ali SM, Kim DH, Guertin DA, Latek RR, Erdjument-Bromage H, et al. Rictor, a novel binding partner of mTOR, defines a rapamycin-insensitive and raptor-independent pathway that regulates the cytoskeleton. Current biology : CB. 2004;14:1296–302. doi: 10.1016/j.cub.2004.06.054. [DOI] [PubMed] [Google Scholar]
- 52.Vasudevan KM, Barbie DA, Davies MA, Rabinovsky R, McNear CJ, Kim JJ, et al. AKT-independent signaling downstream of oncogenic PIK3CA mutations in human cancer. Cancer cell. 2009;16:21–32. doi: 10.1016/j.ccr.2009.04.012. [DOI] [PMC free article] [PubMed] [Google Scholar]
- 53.Jacinto E, Loewith R, Schmidt A, Lin S, Ruegg MA, Hall A, et al. Mammalian TOR complex 2 controls the actin cytoskeleton and is rapamycin insensitive. Nature cell biology. 2004;6:1122–8. doi: 10.1038/ncb1183. [DOI] [PubMed] [Google Scholar]
- 54.Walz S, Lorenzin F, Morton J, Wiese KE, von Eyss B, Herold S, et al. Activation and repression by oncogenic MYC shape tumour-specific gene expression profiles. Nature. 2014;511:483–7. doi: 10.1038/nature13473. [DOI] [PMC free article] [PubMed] [Google Scholar]
- 55.Lee MJ, Ye AS, Gardino AK, Heijink AM, Sorger PK, MacBeath G, et al. Sequential application of anticancer drugs enhances cell death by rewiring apoptotic signaling networks. Cell. 2012;149:780–94. doi: 10.1016/j.cell.2012.03.031. [DOI] [PMC free article] [PubMed] [Google Scholar]
Associated Data
This section collects any data citations, data availability statements, or supplementary materials included in this article.