

Abstract
A central challenge of natural products research is assigning bioactive compounds from complex mixtures. The gold standard approach to address this challenge, bioassay-guided fractionation, is often biased towards abundant, rather than bioactive, mixture components. This study evaluated the combination of bioassay-guided fractionation with untargeted metabolite profiling to improve active component identification early in the fractionation process. Key to this methodology was statistical modeling of the integrated biological and chemical datasets (biochemometric analysis). Three data analysis approaches for biochemometric analysis were compared, namely, partial least squares loading vectors, S-plots, and the selectivity ratio. Extracts from the endophytic fungi Alternaria sp. and Pyrenochaeta sp. with antimicrobial activity against Staphylococcus aureus served as test cases. Biochemometric analysis incorporating the selectivity ratio performed best in identifying bioactive ions from these extracts early in the fractionation process, yielding altersetin (3, MIC 0.23 μg/mL) and macrosphelide A (4, MIC 75 μg/mL) as antibacterial constituents from Alternaria sp. and Pyrenochaeta sp., respectively. This study demonstrates the potential of biochemometrics coupled with bioassay-guided fractionation to identify bioactive mixture components. A benefit of this approach is the ability to integrate multiple stages of fractionation and bioassay data into a single analysis.
Natural products research has as its central goal the isolation and identification of bioactive constituent(s) from complex natural product mixtures. To achieve this, natural products chemists have developed a robust repertoire of techniques broadly termed “bioassay-guided fractionation”.1 Bioassay-guided fractionation is an iterative methodology that alternates between chemical fractionation and bioassays. With each stage of fractionation, the complexity of the mixture is reduced, and eventually the compound(s) responsible for the observed biological effect can be isolated and characterized. This methodology has long been the gold standard in natural products research, and has resulted in the discovery of critically important drugs, including camptothecin and taxol (paclitaxel),2,3 artemisinin,4 and vinblastine.5 Weller reported in 2012 that over 1,500 publications in ISI Web of Science employed bioassay-guided fractionation, with hundreds more citations using variants of the nomenclature.6
Despite the popularity and historical effectiveness of bioassay-guided fractionation, it has several limitations.7 The process tends to be biased towards dominant peaks in each extract or fraction and, as a result, bioactive constituents in low abundance can be overlooked.8 Furthermore, isolation of all trace constituents can be difficult, given that each chemical separation step witnesses a decrease in material. Finally, there is the potential to lose activity due to irreversible binding of mixture components to chromatographic resins or degradation during the separation process.9 In light of these limitations, new methods capable of focusing the isolation process on components most likely to be responsible for the desired biological effect are needed.
Recently, there has been a great deal of interest in the application of untargeted metabolomics to study biologically active natural product mixtures.10–15 Metabolomics approaches are employed to profile multiple mixture components simultaneously, typically through the application of chromatographic analysis coupled to spectroscopic or spectrometric approaches (IR, UV, MS, or NMR detection). Such approaches can enable the detection of unstable compounds that would be lost upon purification, and consider all compounds together rather than as distinct fractions in series.7,16
Metabolomic profiling results in the generation of large data sets that include both major and minor components.11–13,15 Data-driven methods are needed to extract meaning from these complex chemical datasets, and multivariate statisticians and chemometricians have developed a number of strategies towards this goal.17,18 The most commonly employed tool in metabolomics data analysis is principal component analysis (PCA), in which a dataset is projected onto a series of latent variables, which are then mapped in two-dimensional space. Groupings of objects are discerned by their covariance, which is analyzed visually by the proximity of one object to another in the PCA scores plot.18
One limitation of metabolomics for studying natural product mixtures is the difficulty in tying identified metabolites to bioactive effects. If the end goal is determining which compounds are responsible for the biological activity of a mixture, comparing the chemical composition of different mixtures (the central goal of metabolomics) is not sufficient.14,19 There is a need to go beyond the metabolomics datasets, and to use biological assay data to inform their interpretation. To address this need is an even greater data analysis challenge than that faced in classical metabolomics, and requires the integration of both biological and chemical datasets. In 2006, chemometricians working to integrate chemical and biological data dubbed the field “biochemometrics.”20 The present report is concerned primarily with the development of effective approaches for applying biochemometrics to natural products drug discovery.
Several approaches have been developed for correlating metabolite profiles with biological datasets (Table 1). Partial least squares (PLS) decomposes the spectral dataset (i.e., retention time and mass-to-charge (m/z) pairings), into uncorrelated latent variables. PLS differs from PCA in that it seeks to maximize the covariance of independent variables (spectral data from IR, UV, or MS analysis) with a dependent variable (i.e., biological activity).21 As an example of the effectiveness of this approach, Ali et al.22 utilized PLS analysis of NMR signal data to identify bioactive metabolites from marine sponges against the adenosine A1 receptor. In some cases, however, data interpretation may be difficult with PLS, because variables possessing large variance yet small correlation may mask other variables with low variance and high correlation to the dependent (response) variable. In addition, multiple PLS components are often needed to optimize the discrimination between response groups.23
Table 1.
Summary of Data Analysis Methods for Biochemometric Data Sets.
| method | methodology | applications | analysis output |
|---|---|---|---|
| principal component analysis (PCA) | • map objects and variables onto latent variables separately • identify correlations within groupings |
• outliers • quality control • object diversity |
• scores plot: summary of objects • loadings plot: summary of variables |
|
| |||
| partial least squares (PLS) | • incorporate objects and variables for predictive modeling | • discriminating between groups • biomarker identification |
• scores plot: summary of objects • loadings plot: summary of variables |
|
| |||
| s-plot | • combine modeled covariance and correlation from pls in a scatter plot | • same as pls | • low correlation/intensity variables are close to origin • highly correlated variables are distanced from origin |
|
| |||
| selectivity ratio | • ratio of explained (predictive) and residual (uncorrelated) variance • variance developed from univariate “target projection” |
• variable discrimination • biomarker identification |
• x-axis: independent variables (spectral data, retention time, etc.) • single variable for identifying highly-correlated peaks |
Recently, Wiklund et al.24 described the S-plot as a means for interpreting orthogonal PLS (OPLS) predictive components. With an S-plot, the covariance and correlation loading variables are displayed graphically, which allows for visual identification of spectral variables that strongly correlate with a dependent biological activity variable.24 S-plots have been utilized several times for natural product research, most recently to discover immunomodulatory components from Phaleria nisidai25 and antidiabetic compounds of Cree medicinal plants.26 A limitation of the S-plot approach is that the large number of spectral variables can make visualization and interpretation of the data difficult. In addition, the S-plot relies only on the correlation and covariance of independent variables to the dependent variable, which can lead to false positives.27
As another strategy for interpreting biochemometric datasets, Kvalheim and Karstang28 developed the “target projection” component, wherein PLS components are transformed into a univariate metric that facilitates analysis and interpretation of correlative data. The variance explained by the target projection component can be calculated for each independent (spectral) variable and compared against the residual variance. The ratio between explained and residual variance of the spectral variables of the target-projection component, termed the selectivity ratio, represents a quantitative measure of each variable's power to distinguish between different groups. Variables with a high selectivity ratio have an excellent ability to separate bioactive and non-bioactive groupings. This approach has been utilized to identify clinical biomarkers from human spinal fluid (CSF) samples27 as well as for chemical fingerprint analysis of the herbal medicine Puerariae lobatae (Radix Puerariae).29 However, the selectivity ratio has not been applied to identify individual bioactive components of natural product mixtures.
With this study, we compared three data analysis strategies (PLS, S-plot, and selectivity ratio) for integrating biological and chemical datasets from natural product mixtures. Our objective was to demonstrate which of these approaches would be most effective for distinguishing active and inactive compounds in the mixtures. As a case study, two endophytic fungi isolated from the botanical goldenseal [Hydrastis canadensis L. (Ranunculaceae)], were selected, namely, Alternaria sp. and Pyrenochaeta sp. Alternaria sp. was chosen because the extract from this fungus demonstrated marked antimicrobial activity in screens performed in our laboratory (data not shown), but dereplication using a UPLC-HRMS-MS/MS protocol30 identified only one primary chemical constituent, alternariol monomethyl ether (1), which is mildly active against Gram-positive bacteria. For Pyrenochaeta sp., the activity of the extract could not be correlated to known compounds in the dereplication library. Thus, these fungal extracts were a good example of mixtures containing unknown active compounds. The goal of our studies was to conduct biochemometric analysis on these fungi at an early stage of extraction and fractionation, and subsequently to verify the predictions of the biochemometric analysis with follow up isolation, structure elucidation, and biological evaluation.
RESULTS AND DISCUSSION
Biochemometric Analysis of Alternaria sp
The first goal of these studies was to contrast various chemometric and biochemometric analysis techniques as applied to an extract from the fungus Alternaria sp. Towards this goal, chemometric profiling was first conducted on a crude extract from the Alternaria sp. fungus (AS-CR) and four fractions (AS-1 to AS-4). Untargeted metabolomic analysis of these fractions using ultra-performance liquid chromatography coupled to high-resolution mass spectrometry (UPLC-HRMS) yielded 472 total marker ions (unique retention time-m/z pairs), which were compared using principal component analysis (PCA) (Figure 1). The first three components of the PCA scores plot accounted for 93.09% of total variability of the model (component 1: 52.97%; component 2: 32.45%; component 3: 7.68%). The technical replicates (triplicate UPLC-HRMS analyses) of each sample are overlaid on the plot, indicating excellent repeatability of the chemical analysis (Figure 1). The AS-CR and AS-2 fractions group together, separated from the AS-1, AS-3, and AS-4 fractions (Figure 1), which indicates distinct chemical profiles between AS-2 and the fractions AS-1, -3, and -4.
Figure 1.
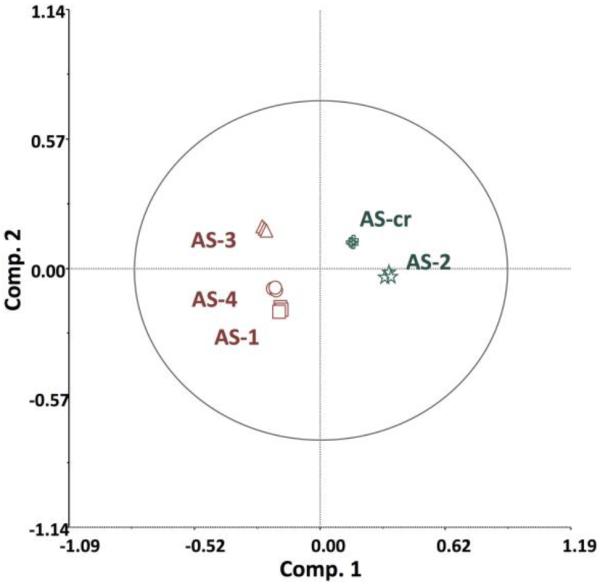
Principal Component Analysis (PCA) scores plot of Alternaria sp. crude extract (AS-CR) and fractions AS1 – AS4, drawn with Hotelling's 95% confidence ellipse. All fractions were run in triplicate, and the resulting 472 marker ions were used to compute differences in mycochemical composition.
Bioactivity screening revealed complete inhibition of S. aureus strain SA1199 by the Alternaria sp. crude extract (AS-CR) as well as the second fraction (AS-2) (Table 2). At the 100 μg/mL level, the crude extract exhibited complete growth inhibition of Staphylococcus aureus, while fraction AS-2 evidenced near-complete inhibition (99.83 ± 0.01%) (Table 2). The fractions AS-1, AS-3, and AS-4 demonstrated negligible growth inhibition of S. aureus (< 1.0%).
Table 2.
Antimicrobial Activity of Alternaria sp. (AS) Crude Extract (CR) and Fractions AS-1-AS-4.a
| sample | S. aureus growth inhibition (%) |
|---|---|
| chloramphenicolb | 98.3 ± 0.4% |
| AS-CR | 100 ± 1% |
| AS-1 | 0.00 ± 0.03% |
| AS-2 | 99.83 ± 0.01% |
| AS-3 | 0.14 ± 0.02% |
| AS-4 | 0.76 ± 0.01% |
Growth inhibition of S. aureus strain SA1199 relative to the vehicle control as measured by OD600. AS samples measured at a concentration of 100 μg/mL. Data presented as mean of triplicate analyses ± SEM.
Chloramphenicol functioned as the positive control.
Pairing the antibacterial screening with high-resolution mass spectral data, the resulting biochemometric analytical matrix evidenced differences between the Alternaria sp. fractions based on their bioactivity. The internal cross-validated construction of the PLS model yielded four components, accounting for 100% of the independent (spectral) and dependent (bioactivity) block variation (component 1: 52.94% independent, 98.06% dependent; component 2: 10.60%, 1.79%; component 3: 29.08%, 0.16%; component 4: 7.38%, 0.00%). The PLS scores plot (Figure 2A) showed a similar clustering of fractions as the PCA analysis, with AS-CR and AS-2 separated graphically from the other, non-bioactive fractions. Also similar to the PCA analysis, the triplicate data points representing each sample are closely grouped together in the PLS scores plot, although the addition of biological variability causes a slight increase in the spread among replicates, as might be expected.
Figure 2.


Marker ion selection from a biochemometric dataset. The biochemometric dataset was obtained from the mass spectral data coupled with bacterial growth inhibition data (against S. aureus SA1199) at a concentration of 100 μg/mL (Table 2). (A) Partial least squares (PLS) scores plot, showing the grouping of bioactive and non-bioactive fractions from Alternaria sp. (AS-CR and AS-1 – AS-4). Each fraction was analyzed in triplicate via UPLC-MS and was subjected to triplicate biological assays. Thus, the replicate datapoints represent both biological and technical variability. (B) Loadings plot from the PLS analysis of biochemometric data. Variables located in the same region in the loadings plot (B) as the bioactive groups AS-CR and AS-2 in the scores plot (A) have the highest positive correlation with the dependent variable (bioactivity). Thus, three ions corresponding to alternariol monomethyl ether (1), tenuazonic acid (2), and altersetin (3) were identified from visual analysis of the loadings plot as potentially most bioactive. (C) S-plot from PLS model of antibacterial activity of Alternaria sp. extract and fractions. The upper right quadrant are the peaks with highest correlation to bioactivity, and ions 1, 2, and 3 were also identified from the S-plot. (D) The selectivity ratio analysis of the PLS model data. The ratio relates the explained variance of the variable to the residual variance. Higher values (taller lines) represent a more significant contribution to the observed bioactivity. The selectivity ratio indicates compound 3 to have the highest activity, and does not find strong correlation for compounds 1 and 2.
PLS scores plots do not provide information regarding which specific chemical species contribute to the observed antibacterial bioactivity. To obtain this information, three distinct analytical methods were contrasted: the loadings plot from the PLS model, the multivariate transformed S-plot, and the selectivity ratio. Examination of the PLS loadings plot (Figure 2B) yielded three major metabolites that were shifted in the same direction as the bioactive fractions from the PLS scores plot (Figure 2A). Identities of these compounds were proposed using literature and high-resolution mass spectrometry data (Table 3) as: alternariol monomethyl ether (1), tenuazonic acid (2), and altersetin (3). The difference in location in the scores plot between 1, 2, and 3 was not sufficient to ascertain which of the three compounds was most responsible for the antibacterial activity of the fraction. The identifications of 1 and 3 were confirmed from the NMR spectra of the isolated compounds (Figures S2 and S4, Supporting Information, respectively) and NMR data were consistent with literature reports.31,32 Due to the low abundance and lack of bioactivity of fractions containing compound 2, this compound was not pursued for isolation, and identification is only tentative, based on matching accurate mass with literature values.29
Table 3.
Identification of Bioactive Marker Ions from Alternaria Sp.
| marker ion | ion (molecular formula, δ (ppm)) | adducts and fragments (molecular formula, δ (ppm)) | tentative identification |
|---|---|---|---|
| 1 | 273.0756 [M+H]+ (C15H13O5, 0.5) | 255.0699 [M+H-H2O]+ (C15H11O4, 4.2) | Alternariol monomethyl ethera |
| 2 | 198.1124 [M+H]+ (C10H17NO3, 0.4) | Tenuazonic acida | |
| 3 | 400.2480 [M+H]+ (C24H34NO4, 0.6) | 422.2292 [M+Na]+ (C24H33NO4Na, 1.6) | Altersetina |
| 382.2375 [M+H-H2O]+ (C24H32NO3, 0.7) |
Previously reported from cultured Alternaria spp.31
The S-plot graphically displays the covariance and correlation of loading variables against the dependent variable as a scatter plot (Figure 2C). In an S-plot, the further a marker ion is from the origin, the greater its contribution is to the variance between bioactivity levels. For the Alternaria sp. biochemometric model, the upper right quadrant of the S-plot contributed the most to the differentiation of biologically-active versus inactive fractions, and compounds 1 and 2 were highlighted as possessing the greatest contribution to the observed bioactivity.
The selectivity ratio produces a graphical representation in which the most abundant peaks correspond to marker ions that are most strongly associated with bioactivity (Figure 2D). From the selectivity ratio plot, the dominant marker ions were altersetin (3) and its sodium adduct, suggesting that this compound dominated the contributions to the antibacterial potency of the Alternaria sp. extract and fractions. In contrast to the PLS loadings plot (Figure 2B) and the S-plot (Figure 2C), alternariol monomethyl ether (1) and tenuazonic acid (2) were not among the most significant marker ions identified according to the selectivity ratio analysis (Figure 2D).
Selectivity ratio analysis has an additional advantage of enabling the application of multiple independent variables, which facilitates interpretation by natural product chemists consistent with the type of instrumentation being employed. Utilizing mass spectrometry data (signal versus m/z) creates a plot similar to a mass spectrum (Figure 2D), where the x-axis is the m/z of the detected ion, and the y-axis represents how strongly associated that particular ion is with the biological activity.23 The use of chromatographic data (detector signal versus retention time) yields a similar selectivity ratio plot to that generated with mass spectrometric data, except that the x-axis represents retention time rather than m/z.33
Identification of Marker Compounds in Alternaria sp
Additional purification of the most active Alternaria sp. fraction (AS-2) was conducted to investigate the accuracy of the predictions provided by the biochemometric analysis. Subfractions of AS-2 (coded AS-2-1 – AS-2-10) obtained with reversed-phase preparative scale HPLC revealed marked differences in both chemical makeup and bioactivity. UPLC-HRMS analysis of individual subfractions showed that subfraction AS-2-3 was 94% enriched in tenuazonic acid (2) (Figure 3B), subfraction AS-2-7 was 94% alternariol monomethyl ether (1) (Figure 3C), and altersetin (3) was isolated in subfraction AS-2-9 at 85% purity (Figure 3D). The other subfractions contained insignificant quantities of these compounds. From the antibacterial screening protocol, subfraction AS-2-3 only displayed 0.01 ± 0.02% inhibition of S. aureus SA1199, AS-2-7 yielded 0.08 ± 0.01% growth inhibition, and AS-2-9 inhibited bacterial growth by 99.5 ± 0.01%. These data indicate that 3 was, indeed, the most active compound from the original extract. The application of the selectivity ratio made it possible to distinguish between active and inactive ions at an early stage of the analysis (with just the crude extract and four fractions). The selectivity ratio correctly predicted that ion 3 was the most active, while the S-plot and PLS loading vectors attributed activity to ions 1, 2, and 3. Follow up antimicrobial assays on pure compounds 1 and 3 supported the data in Figure 4, indicating that 1 is weakly active against S. aureus, with a minimum inhibitory concentration (MIC) of 275 μM (75 μg/mL), while 3 possesses pronounced activity (MIC 0.59 μM (0.23 μg/mL)) (Table 4). Antimicrobial activity was also observed for both of these compounds against methicillin resistant Staphylococcus aureus (MRSA) (Table 4).
Figure 3.

UPLS-HRMS chromatograms of fraction AS-2 (A), along with selected subfractions AS-2-3 (B), AS-2-7 (C), and AS-2-9 (D) representing the semi-pure fractions of tenuazonic acid (2), alternariol monomethyl ether (1), and altersetin (3), respectively.
Figure 4.

Marker ion selection from the post-fractionation biochemometric dataset of Alternaria sp. The biochemometric dataset was obtained from the triplicate mass spectral data coupled with bacterial growth inhibition data (against S. aureus SA1199) at a concentration of 100 μg/mL. (A) Partial least squares (PLS) scores plot, showing the grouping of bioactive and inactive fractions from Alternaria sp. (AS-CR, AS-1 – AS-4, and AS-2-1 – AS-2-10). Each fraction was analyzed in triplicate, as shown in the scores plot. (B) Loadings plot from the PLS analysis of biochemometric data. Variable 3 was the most correlated to bioactivity, as implied by being shifted in the same direction as the bioactive samples in the scores plot. (C) S-plot from the larger PLS model of antibacterial activity of Alternaria sp. extract, fractions, and subfractions. The marker ion for 3 is distinctly separate from the others, indicating its greater contribution to the bioactivity (D) The selectivity ratio analysis of the more comprehensive PLS model data. Similar to the initial selectivity ratio analysis (Figure 2D), ion 3 displays the highest selectivity ratio.
Table 4.
Antimicrobial Activity of Isolated Compounds from Alternaria Sp. and Pyrenochaeta sp.a
| sample | MIC S. aureus | MIC MRSA | ||
|---|---|---|---|---|
| μM | μg/mL | μM | μg/mL | |
| berberine (+ control) | 446 | 150 | 446 | 150 |
| alternariol monomethyl ether (1) | 275 | 75 | NDb | ND |
| altersetin (3) | 0.59 | 0.23 | 4.67 | 1.9 |
| macrosphelide A (4) | 219 | 75 | ND | ND |
Minimum inhibitory concentrations (MIC) against S. aureus strain SA1199 and a strain of MRSA (USA300 LAC strain AH1263) are presented as mean of triplicate analyses. Berberine functioned as the positive control.
ND - not detected
Refined Biochemometric Analysis
Multivariate statistical modeling increases in accuracy and precision as the sample size (number of objects) increases;33 thus, it was hypothesized that further fractionation of the bioactive Alternaria sp. fraction AS-2 would provide enhanced separation between the active and inactive marker ions in the biochemometric analysis. The incorporation of subfractions (AS-2-1 through AS-2-10) of the original active fraction (AS-2) into the biochemometric matrix yielded a more refined statistical model and subsequent analysis. The PLS scores plot (Figure 4A) distinguished the active fractions and subfractions (AS-CR, AS-2, AS-2-9, and AS-2-10) from the non-active fractions and subfractions. The increased analytical power of adding subfractions to the biochemometric matrix was reflected in changes in both the PLS loading plot (Figure 4B) and the S-plot (Figure 4C) compared to the initial matrix analysis (Figure 2B and 2C, respectively). In the expanded data matrix, both plots yielded altersetin (3) as the principal marker ion that contributed to the observed antibacterial activity, while the signals for compounds 1 and 2 were shifted downward towards a region of low covariance and correlation. The selectivity ratio (Figure 4D) maintained altersetin (3) as the principal bioactive marker ion. The inclusion of the subfractions in the selectivity ratio analysis effectively increased the abundance of the altersetin signals relative to those of other ions.
With the incorporation of 15 objects spanning three different degrees of chemical complexity - crude extract, fractions, and subfractions - the PLS loadings plot and S-plot could be employed to correctly identify 3 as the antibacterial compound from the mixture. However, the selectivity ratio analysis enabled identification of the active mixture components at an earlier stage of the isolation process.
Application of Biochemometrics to Pyrenochaeta sp
To confirm the analytical capability of the selectivity ratio, a second bioactive endophytic fungus (Pyrenochaeta sp.) was analyzed via the same methodology. Biochemometric profiling was conducted on the crude Pyrenochaeta sp. extract (PS-CR) and four fractions (PS-1 to PS-4). UPLC-HRMS analysis yielded 659 marker ions, and bioactivity screening highlighted PS-4 as the most bioactive fraction (Table 5). The PLS scores plot (Figure 5A) separated the two active samples (PS-CR and PS-4) distinctly from the inactive samples. For Pyrenochaeta sp., the PLS loadings plot (Figure 5B) and the selectivity ratio (Figure 5C) revealed macrosphelide A (4) as the principal bioactive constituent. Subsequent isolation efforts confirmed the presence of macrosphelide A through high-resolution mass spectrometry and 1H and 13C NMR (Figure S6, Supporting Information),34 and its MIC value against S. aureus was determined to be 219 μM (75 μg/mL) (Table 4).
Table 5.
Antimicrobial Activity of Pyrenochatea sp. (PS) Crude Extract (CR) and Fractions PS-1-PS-4.a
| sample | S. aureus growth inhibition (%) |
|---|---|
| chloramphenicolb | 99.2 ± 0.2% |
| PS-CR | 78.2 ± 2.4% |
| PS-1 | 40.0 ± 1.2% |
| PS-2 | 36.3 ± 1.5% |
| PS-3 | 26.4 ± 4.7% |
| PS-4 | 95.8 ± 1.7% |
Growth inhibition of S. aureus strain SA1199 is displayed as percent growth inhibition normalized to the vehicle control as measured by OD600. Pyrenochatea sp. samples were measured at a concentration of 100 μg/mL. Data presented as mean of triplicate analyses ± SEM.
Chloramphenicol functioned as the positive control.
Figure 5.

Identification of the bioactive principle from Pyrenochaeta sp. from the biochemometric dataset. The biochemometric dataset was obtained from the triplicate mass spectral data coupled with growth inhibition data against S. aureus (SA1199) at a concentration of 100 μg/mL. (A) The partial least squares (PLS) scores plot shows the grouping of bioactive and inactive fractions from Pyrenochaeta sp. (PS-CR, PS-1 – PS-4). Each fraction was analyzed in triplicate, as shown in the scores plot. (B) Loadings plot from the PLS analysis of biochemometric data. The ion for macrosphelide A (4) was the most correlated with the bioactive samples in the scores plot. (C) The selectivity ratio analysis of the PLS model data.
In summary, the identification of bioactive compounds without the need for multiple bioactivity-guided isolation steps remains an important goal to improve the efficiency and productivity of natural product discovery programs. The study presented herein has utilized multivariate statistical modeling coupled to the selectivity ratio (a univariate metric) to reveal compounds from a complex chemical profile that were responsible for the observed antibacterial bioactivity. Application of this biochemometric approach has led to the identification of a minor compound (altersetin, 3) from Alternaria sp. with potent antibacterial activity against both S. aureus and MRSA. The same approach was applied with a second endophytic fungus, Pyrenochaeta sp., which revealed the bioactive compound macrosphelide A. Although these are both known compounds, they were not identified in the crude extracts because they were not included in the database of experimental UPLC-MS data used for dereplication.30 However, once it was determined (based on biochemometric analysis) that these ions were likely responsible for the biological activity of the extracts, their structures could be rapidly predicted by comparison of UPLC-MS data with published literature. Such literature searches would have been inefficient and impractical had they been conducted for all of the unique features identified by UPLC-HRMS in the Alternaria sp. and Pyrenochaeta sp. extracts (472 and 659 ions, respectively).
Importantly, by using biochemometrics to integrate chemical and biological datasets, the bioactive extract compounds (3 and 4) were identified as active very early in the isolation process, after just one stage of fractionation. For the purpose of the study presented here, subsequent fractionation and isolation steps were then conducted to confirm the predictions of the biochemometric analysis. In future studies, such follow up isolation efforts might not be pursued if it was determined that the putative active compounds were of known structure and biological activity. In this way, biochemometrics could serve as a useful tool in dereplication efforts. The inclusion of biochemometrics in the dereplication process could prevent the rejection of an extract for further study based on the presence of a known (but inactive) compound, a potential pitfall of dereplication approaches that rely exclusively on chemical data. Additionally, as was the case with Alternaria sp., biochemometric analysis can point to the biological importance of a seemingly minor extract component, enabling focused efforts to rapidly solve its structure. The data presented here suggest that selectivity ratio analysis, which made better predictions than other data analysis procedures early in the fractionation process, could be a particularly effective tool for integrating biological and chemical datasets as part of dereplication efforts.
Another potentially important application of the biochemometrics approach is for integrating the chemical and bioassay data obtained from multiple fractionation steps. In the process of bioassay guided fractionation, each stage of separation and bioassay data is typically considered in isolation from previous isolation steps. Using biochemometrics, it was possible to develop a model in which the active mixture components were predicted based on the data from several stages of fractionation in combination. Indeed, the study described herein shows that adding successive stages of fractionation and bioassay to the biochemometric analysis (original extract plus fractions and sub-fractions) improves the quality of the resulting selectivity plot. A future goal of our work is to apply biochemometrics using selectivity ratios to identify active components from more complex mixtures such as botanical extracts. Towards this goal, it may be necessary to conduct additional stages of purification to obtain sufficient sample size (number of objects) to accurately predict the compounds responsible for the observed biological activity. A highly complex extract could be fractionated and subjected to biochemometric analysis repeatedly, with each successive step of the fractionation and bioassay added into the dataset until a quality selectivity ratio plot could be obtained.
EXPERIMENTAL SECTION
General Experimental Procedures
NMR spectra were acquired with a JEOL ECA-400 spectrometer (400 MHz) using DMSO-d6. Optical rotations were obtained using a Rudolph Research Autopol III polarimeter (Rudolph Research Analytical, Hackettstown, NJ, USA). UPLC-HRESIMS data were acquired using a Q Extractive Plus quadrupole-orbitrap mass spectrometer (Thermo Scientific, Waltham, MA, USA) with an electrospray ionization source coupled to an Acquity UPLC system (Waters, Milford, MA, USA). To collect UPLC-HRESIMS data, each sample was re-suspended in MeOH to a concentration of 1 mg/mL, and triplicate 3 μL injections of each sample were performed. The samples were eluted from the column (Acquity UPLC BEH C18 1.7μm, 2.1 × 50 mm, Waters) at a flow rate of 0.3 mL/min using the following binary gradient with solvent A consisting of H2O (0.1% formic acid added) and solvent B consisting of CH3CN (0.1% formic acid added): initial isocratic composition of 95:5 (A:B) for 1.0 min, increasing linearly to 0:100 over 20 min, followed by an isocratic hold at 0:100 for 1 min, gradient returned to starting conditions of 95:5 for 2 min, and held isocratically again for 1 min. The mass spectrometer was operated in the positive ionization mode over a scan range of 150–2000 with the following settings: capillary voltage set at 5 V, capillary temperature set at 300 °C, tube lens offset set at 35 V, spray voltage set at 3.80 kV, sheath gas flow set at 35, and auxiliary gas flow set at 20.
Flash chromatography separations were accomplished using an automated CombiFlash RF system (Teledyne-Isco, Lincoln, NE, USA) and monitored with a PDA detector and as an evaporative light scattering detector. HPLC separations were performed on a Varian HPLC system (Agilent Technologies, Santa Clara, CA, USA) with Galaxie Chromatography Workstation software (version 1.9.3.2, Agilent Technologies). Analytical and preparative-scale HPLC separations employed a Gemini-NX C18 column (5 μm, 110 Å, 250 × 4.60 mm (analytical) or 250 × 21.20 mm (preparative); Phenomenex, Torrance, CA, USA). Unless otherwise noted, all chemicals were of spectroscopic or microbiological grade and obtained from Sigma-Aldrich (St. Louis, MO, USA).
Plant Collection and Fungal Isolation
Individual, asymptomatic goldenseal (Hydrastis canadensis L.) plants were collected in July 2010 from William Burch in Hendersonville, North Carolina (N 35° 24.2770, W 082° 20.9930). A voucher specimen was deposited at the herbarium of the University of North Carolina at Chapel Hill (NCU583414) and authenticated by Dr. Alan S. Weakly. Isolation of fungal endophytes was performed using methods outlined previously.35,36 Two strains: G28 (isolated from seeds), and G41 (isolated from leaf segments) were used in the present study. Axenic fungal cultures are maintained at 9 °C at the University of North Carolina at Greensboro, Department of Chemistry and Biochemistry Fungal Culture Collection.
Identification of Fungal Isolates
For molecular identification of fungal endophytes isolated from goldenseal, the internal transcribed spacer region of the 5.8S ribosomal RNA gene (ITS1-5-5S-ITS2) was sequenced using methods described previously.35–38 Based on BLAST search conducted with published ITS data in NCBI GenBank, strain G28 was identified as an Alternaria sp. (Pleosporales, Dothideomycetes), while strain G41 was identified as a Pyrenochaeta sp. (Pleosporales, Dothideomycetes), using cut off proxies for ITS sequence similarity outlined previously.36 The sequences from strains utilized in the present study were deposited in GenBank under accession numbers KT825854 (strain G28) and KT825855 (strain G41).
Solid-state Fermentation of Fungal Cultures
For chemical extraction, the fungal strains utilized in this study were grown on rice a medium.39 Briefly, seeds cultures were started on the liquid medium composed of 2% soy peptone, 2% dextrose, and 1% yeast extract (YESD). The seed culture was grown for 7 days at 22 °C with agitation, and subsequently transferred to 10 g of rice autoclaved with 25 mL of water in a 250 mL Erlenmeyer flask for screener cultures. For large-scale production of fungal cultures, four 250 mL Erlenmeyer flasks were inoculated using one seed culture for each flask. All rice cultures were allowed to grow for approximately 14–21 days prior to extraction.
Extraction and Isolation
Cultures of Alternaria sp. (AS) and Pyrenochaeta sp. (PS) were extracted following the established procedure.40 Briefly, to each culture flask, 60 mL of 1:1 MeOH–CHCl3 was added, chopped, and shaken overnight (~20 h) at ~100 rpm at room temperature. The sample was vacuum-filtered, 90 mL of CHCl3 and 150 mL of H2O were added, and the mixture was stirred for 30 min. This mixture was then transferred into a separatory funnel and the bottom (CHCl3) layer collected. The CHCl3 layer was evaporated to dryness, then dissolved in 100 mL of 1:1 MeOH–CH3CN and 100 mL of hexanes. The biphasic solution shaken in a separatory funnel, and the bottom layer drawn off and evaporated to yield the crude extract (CR).
First-stage separations of the crude extract were conducted with normal-phase flash chromatography on a CombiFlash RF system with a 4 g silica gel column at 18 mL/min flow rate with a 40 min hexane-CHCl3-MeOH gradient, which yielded four fractions (AS-1 to AS-4 and PS-1 to PS-4, respectively) pooled based on LC-UV chromatograms. Active fractions were subjected to a second stage of purification using a reversed-phase preparative HPLC with a Gemini NX C18 column at a 21.20 mL/min flow rate. A linear CH3CN-H2O (both with 0.1% formic acid) gradient starting from 40:60 to 100:0 over 15 min was employed, with fractions collected every 0.5 min and pooled based on both UV and evaporative light scattering detector (ELSD) chromatograms. The Alternaria sp. (AS) extract yielded compounds 1 and 3, while 4 was isolated from the Pyrenochaeta sp. (PS) extract. Compound 2, tenuazonic acid, was putatively identified based upon its high resolution mass (m/z 198.1134 [M+H]+, calcd for C10H16NO3+, 198.1130), but was not present in sufficient quantities for isolation and confirmation of identity.
Alternariol monomethyl ether (1): white solid, HRESIMS m/z 273.0756 [M+H]+ (calcd for C15H13O5+, 273.0763); 1H NMR (400 MHz DMSO-d6) and 13C NMR (100 MHz DMSO-d6), chemical shifts were in agreement with literature values31 and are provided as Supporting Information (Table S1 and Figure S2, Supporting Information).
Altersetin (3): pale brown solid, HRESIMS m/z 400.2480 [M+H]+ (calcd for C24H34NO4+, 400.2488); 1H NMR (400 MHz DMSO-d6) and 13C NMR (100 MHz DMSO-d6), chemical shifts were in agreement with literature values31 and are provided as Supporting Information (Table S2 and Figure S4, Supporting Information).
Macrosphelide A (4): yellow solid, [α]D20 = +84 (c 0.60, MeOH) HRESIMS m/z 343.1383 [M+H]+ (calcd for C16H23O8+, 343.1393); 1H NMR (400 MHz CDCl3) and 13C NMR (100 MHz CDCl3), chemical shifts were in agreement with literature values34 and are provided as Supporting Information (Table S3 and Figure S6, Supporting Information).
Antibacterial Assay
Antibacterial activity was assessed via growth inhibition of a laboratory strain of Staphylococcus aureus (strain SA1199)41 and methicillin-resistant S. aureus (MRSA USA300 LAC strain AH1263).42 Cultures were grown from a single colony isolate of each strain to log-phase in Müeller Hinton Broth (MHB) and plated at a final density of 1.0×10⁶ CFU/mL.
For screening, samples were assayed in triplicate at a concentration of 10 μg/mL and 100 μg/mL. Samples were dissolved in 1:1 EtOH-DMSO (v/v) and diluted in Mueller Hinton broth (MHB) to achieve the appropriate concentration, with ethanol and DMSO concentrations <2%. The positive control used for the screening procedure was chloramphenicol, at the same concentrations as the samples (10 μg/mL and 100 μg/mL). Vehicle was 2% 1:1 EtOH-DMSO. Each well was inoculated with bacterial culture, and incubated at 37 °C for 24 h.
Minimum inhibitory concentration (MIC) was measured according to Clinical Laboratory Standards Institute (CLSI) standard procedures.43 Briefly, extracts or purified berberine (positive control, a known antibacterial compound from the host plant of these endophytic species, Hydrastis canadenensis L.)44 were added to 96-well plates in triplicate at concentrations ranging from 2.3 to 300 μg/mL in MHB. Vehicle (2% DMSO) served as the negative control, and DMSO content was fixed at 2% in all wells. Absorbance at 600 nm was measured after 24 h using a Synergy H1 microplate reader (Biotek, Winooski, VT, USA). The minimum inhibitory concentration (MIC) was defined as the concentration at which there was no statistically significant difference between the treatment and vehicle control. The absorbance for replicate wells containing all assay components except bacteria was subtracted from the absorbance of assay wells.
Biochemometric Analysis
Triplicate LC–MS datasets for each sample were individually analyzed, aligned and filtered with MZmine 2.17 software (http://mzmine.sourceforge.net/).45 Peak detection in MZmine was achieved as follows: m/z values were detected within each spectrum above a baseline, and a chromatogram was constructed for each of the m/z values that spanned longer than 0.1 min, and finally, deconvolution algorithms were applied to each chromatogram to recognize the individual chromatographic peaks. The parameters were set as follows for peak detection: noise level (absolute value) at 1 × 10⁷, minimum peak duration 0.5 s, tolerance for m/z variation 0.05 and tolerance for m/z intensity variation 20%. Deisotoping, peak list filtering, and retention time alignment algorithm packages were employed to refine peak detection. Finally, the join align algorithm compiled a peak table according to the following parameters: the balance between m/z and retention time was set at 10.0 each, m/z tolerance was set at 0.05, and retention time tolerance size was defined as 2 min. The spectral data matrix (comprised of m/z, retention time, and peak area for each peak) was imported to Excel (Microsoft, Redmond, WA, USA) and merged with the bioactivity data set (at 100 μg/mL concentration) to form a final biochemometric analytical matrix. Triplicate datasets were included in the analysis for each sample, which consisted of three separate bioassay measurements and three separate UPLC-HRMS analyses for the same extract or fraction.
Biochemometric analysis was performed using Sirius version 9.0 (Pattern Recognition Systems AS, Bergen, Norway).28,33 Initially, transformation from heteroscedastic to homoscedastic noise was carried out by a 4th root transform of the spectral variables. An internally cross-validated PLS model was constructed using 100 iterations, at a significance level of 0.05. Selectivity ratios from the final PLS model were calculated using algorithms internal to Sirius.
Supplementary Material
ACKNOWLEDGEMENTS
This work was supported by the National Center for Complementary and Integrative Health, National Institutes of Health (grant 1R01 AT006860), and by a Biotechnology Research Grant (2011-BRG-1206) from the North Carolina Biotechnology Center. Mass spectrometry data were collected in the Triad Mass Spectrometry Facility. We thank Sochima Anika and Dr. Amninder Kaur for technical assistance and Vincent Sica for assistance with manuscript editing.
REFERENCES
- (1).Kinghorn AD, Fong HHS, Farnsworth NR, Mehta RG, Moon RC, Moriarty RM, Pezzuto JM. Curr. Org. Chem. 1998;2:597–612. [Google Scholar]
- (2).Wall ME, Wani MC. J. Ethnopharm. 1996;51:239–253. doi: 10.1016/0378-8741(95)01367-9. [DOI] [PubMed] [Google Scholar]
- (3).Oberlies NH, Kroll DJ. J. Nat. Prod. 2004;67:129–135. doi: 10.1021/np030498t. [DOI] [PubMed] [Google Scholar]
- (4).Tu Y. Nat. Med. 2011;17:1217–1220. doi: 10.1038/nm.2471. [DOI] [PubMed] [Google Scholar]
- (5).Noble RL. Biochem. Cell Biol. 1990;68:1344–1351. [PubMed] [Google Scholar]
- (6).Weller MG. Sensors. 2012;12:9181–9209. doi: 10.3390/s120709181. [DOI] [PMC free article] [PubMed] [Google Scholar]
- (7).Prince EK, Pohnert G. Anal. Bioanal. Chem. 2010;396:193–197. doi: 10.1007/s00216-009-3162-5. [DOI] [PubMed] [Google Scholar]
- (8).Inui T, Wang Y, Pro SM, Franzblau SG, Pauli GF. Fitoterapia. 2012;83:1218–1225. doi: 10.1016/j.fitote.2012.06.012. [DOI] [PMC free article] [PubMed] [Google Scholar]
- (9).Qui F, Cai G, Jaki BU, Lankin DC, Franzblau SG, Pauli GF. J. Nat. Prod. 2013;76:413–419. doi: 10.1021/np3007809. [DOI] [PubMed] [Google Scholar]
- (10).Clendinen CS, Pasquel C, Arjredini R, Edison AS. Anal. Chem. 2015;87:5689–5706. doi: 10.1021/acs.analchem.5b00867. [DOI] [PMC free article] [PubMed] [Google Scholar]
- (11).Kleigrewe K, Almaliti J, Tian IY, Kinnel RB, Korobeynikov A, Monroe EA, Duggan BM, Di Marzo V, Sherman DH, Dorrestein PC, Gerwick L, Gerwick WH. J. Nat. Prod. 2015;78:1671–1682. doi: 10.1021/acs.jnatprod.5b00301. [DOI] [PMC free article] [PubMed] [Google Scholar]
- (12).Wu C, Du C, Gubbens J, Choi YH, van Wezel GP. J. Nat. Prod. 2015;78:2355–2363. doi: 10.1021/acs.jnatprod.5b00276. [DOI] [PubMed] [Google Scholar]
- (13).Cortina NS, Krug D, Plaza A, Revermann O, Müller R. Angew. Chem. Int. Edit. 2012;51:811–816. doi: 10.1002/anie.201106305. [DOI] [PubMed] [Google Scholar]
- (14).Sidebottom AM, Johnson AR, Karty JA, Trader DJ, Carlson EE. ACS Chem. Biol. 2013;8:2009–2016. doi: 10.1021/cb4002798. [DOI] [PMC free article] [PubMed] [Google Scholar]
- (15).Hou Y, Braun DR, Michel CR, Klassen JL, Adnani N, Wyche TP, Bugni TS. Anal. Chem. 2012;84:4277–4283. doi: 10.1021/ac202623g. [DOI] [PMC free article] [PubMed] [Google Scholar]
- (16).Yuliana ND, Khatib A, Choi YH, Verpoorte R. Phytother. Res. 2010;25:157–169. doi: 10.1002/ptr.3258. [DOI] [PubMed] [Google Scholar]
- (17).Okada T, Afendi FM, Katoh A, Hirai A, Kanaya S. In: Biotechnology for Medicinal Plants. Chandra S, Lata H, Varma A, editors. Springer-Verlag; Berlin: 2013. pp. 413–438. [Google Scholar]
- (18).Rajalahti T, Kvalheim OM. Int. J. Pharm. 2011;417:280–290. doi: 10.1016/j.ijpharm.2011.02.019. [DOI] [PubMed] [Google Scholar]
- (19).Choi YH, Kim HK, Linthorst HJM, Hollander JG, Lefeber AWM, Erkelens C, Nuzillard J, Verpoorte R. J. Nat. Prod. 2006;69:742–748. doi: 10.1021/np050535b. [DOI] [PubMed] [Google Scholar]
- (20).Martens H, Bruun SW, Adt I, Sockalingum GD, Kokhler A. J. Chemometrics. 2006;20:402–417. [Google Scholar]
- (21).Cox DG, Oh J, Keasling A, Colson KL, Hamann MT. Biochim. Biophys. Acta. 2014;1840:3460–3474. doi: 10.1016/j.bbagen.2014.08.007. [DOI] [PMC free article] [PubMed] [Google Scholar]
- (22).Ali K, Iqbal M, Yuliana ND, Lee YJ, Park S, Han S, Lee JW, Lee HS, Verpoorte R, Choi YH. Metabolomics. 2013;9:778–785. [Google Scholar]
- (23).Rajalahti T, Arneberg R, Kroksveen AC, Berle M, Myhr K, Kvalheim OM. Anal. Chem. 2009;81:2581–2590. doi: 10.1021/ac802514y. [DOI] [PubMed] [Google Scholar]
- (24).Wiklund S, Johansson E, Sjöström L, Mellerowicz EJ, Edlund U, Shockcor JP, Gottfries J, Moritz T, Trygg J. Anal. Chem. 2008;80:115–122. doi: 10.1021/ac0713510. [DOI] [PubMed] [Google Scholar]
- (25).Kulakowski DM, Wu S-B, Balick MJ, Kennelly EJ. J. Chromatogr. A. 2014;1364:74–82. doi: 10.1016/j.chroma.2014.08.049. [DOI] [PubMed] [Google Scholar]
- (26).Shang N, Saleem A, Musallam L, Walshe-Roussel B, Badawi A, Cuerrier A, Arnason JT, Haddad PS. PLoS One. 2015;10:e0135721. doi: 10.1371/journal.pone.0135721. [DOI] [PMC free article] [PubMed] [Google Scholar]
- (27).Rajalahti T, Arneberg R, Berven FS, Myhr K, Ulvik RJ, Kvalheim OM. Chemom. Intell. Lab. Syst. 2009;95:35–48. [Google Scholar]
- (28).Kvalheim OM, Karstang TV. Chemom. Intell. Lab. Syst. 1989;7:39–51. [Google Scholar]
- (29).Chau F, Chan H, Cheung C, Xu C, Liang Y, Kvalheim OM. Anal. Chem. 2009;81:7217–7225. doi: 10.1021/ac900731z. [DOI] [PubMed] [Google Scholar]
- (30).El-Elimat T, Figueroa M, Ehrmann BM, Cech NB, Pearce C, Oberlies NH. J. Nat. Prod. 2013;76:1709–1716. doi: 10.1021/np4004307. [DOI] [PMC free article] [PubMed] [Google Scholar]
- (31).Hellwig V, Grothe T, Mayer-Bartschmid A, Endermann R, Geschke F, Henkel T, Stadler M. J Antibiot. 2002;55:881–892. doi: 10.7164/antibiotics.55.881. [DOI] [PubMed] [Google Scholar]
- (32).Tan N, Tao Y, Pan J, Wang SQ, Xu F, She Z, Lin Y-J, Jones EBG. Chem. Nat. Compd. 2008;44:296–300. [Google Scholar]
- (33).Kvalheim OM, Chan H, Benzie IFF, Szeto Y, Tzang AH, Mok DK, Chau F. Chemom. Intell. Lab. Syst. 2011;107:98–105. [Google Scholar]
- (34).Takamatsu S, Kim Y-P, Hayashi M, Hiraoka H, NAtori M, Komiyama K, Omura S. Journal of Antibiotics. 1995;49:95–98. doi: 10.7164/antibiotics.49.95. [DOI] [PubMed] [Google Scholar]
- (35).Figueroa M, Jarmusch AK, Raja HA, El-Elimat T, Kavanaugh JS, Horswill AR, Cooks RG, Cech NB, Oberlies NH. J. Nat. Prod. 2014;77:1351–1358. doi: 10.1021/np5000704. [DOI] [PMC free article] [PubMed] [Google Scholar]
- (36).Raja HA, Kaur A, El-Elimat T, Figueroa M, Kumar R, Deep G, Agarwal R, Faeth SH, Cech NB, Oberlies NH. Mycology. 2015;6:8–27. doi: 10.1080/21501203.2015.1009186. [DOI] [PMC free article] [PubMed] [Google Scholar]
- (37).El-Elimat T, Raja HA, Day CS, Chen W-L, Swanson SM, Oberlies NH. J. Nat. Prod. 2014;77:2088–2098. doi: 10.1021/np500497r. [DOI] [PMC free article] [PubMed] [Google Scholar]
- (38).Raja HA, El-Elimat T, Oberlies NH, Shearer CA, Miller AN, Tanaka K, Hashimoto A, Fournier J. Mycologia. 2015;107:845–862. doi: 10.3852/15-013. [DOI] [PubMed] [Google Scholar]
- (39).VanderMolen KM, Raja HA, El-Elimat T, Oberlies NH. AMB Express. 2013;3:71–71. doi: 10.1186/2191-0855-3-71. [DOI] [PMC free article] [PubMed] [Google Scholar]
- (40).El-Elimat T, Raja HA, Graf TN, Faeth SH, Cech NB, Oberlies NH. J. Nat. Prod. 2014;77:193–199. doi: 10.1021/np400955q. [DOI] [PubMed] [Google Scholar]
- (41).Kaatz GW, Seo SM. Antimicrob. Agents Chemother. 1995;39:2650–2655. doi: 10.1128/aac.39.12.2650. [DOI] [PMC free article] [PubMed] [Google Scholar]
- (42).Junio HA, Todd DA, Ettefagh KA, Ehrmann BM, Kavanaugh JS, Horswill AR, Cech NB. J. Chromatog. B. 2013;930:7–12. doi: 10.1016/j.jchromb.2013.04.019. [DOI] [PMC free article] [PubMed] [Google Scholar]
- (43).National Committee for Clinical Laboratory Standards . Medhods for dilution antimicrobial susceptibility tests for bacteria that grow aerobically. 3rd edition Villanova, PA: 1993. [Google Scholar]
- (44).Junio HA, Sy-Cordero AA, Ettefagh KA, Burns JT, Micko KT, Graf TN, Richter SJ, Cannon RE, Oberlies NH, Cech NB. J. Nat. Prod. 2011;74:1621–1629. doi: 10.1021/np200336g. [DOI] [PMC free article] [PubMed] [Google Scholar]
- (45).Pluskal T, Castillo S, Villar-Briones A, Orešič M. BMC Bioinformat. 2010;11:395. doi: 10.1186/1471-2105-11-395. [DOI] [PMC free article] [PubMed] [Google Scholar]
Associated Data
This section collects any data citations, data availability statements, or supplementary materials included in this article.