Abstract
Mutations of the tricarboxylic acid cycle (TCA cycle) enzyme fumarate hydratase (FH) cause Hereditary Leiomyomatosis and Renal Cell Cancer (HLRCC)1. FH-deficient renal cancers are highly aggressive and metastasise even when small, leading to an abysmal clinical outcome2. Fumarate, a small molecule metabolite that accumulates in FH-deficient cells, plays a key role in cell transformation, making it a bona fide oncometabolite3. Fumarate was shown to inhibit α-ketoglutarate (aKG)-dependent dioxygenases involved in DNA and histone demethylation4,5. However, the link between fumarate accumulation, epigenetic changes, and tumorigenesis is unclear. Here we show that loss of FH and the subsequent accumulation of fumarate elicits an epithelial-to-mesenchymal-transition (EMT), a phenotypic switch associated with cancer initiation, invasion, and metastasis6. We demonstrate that fumarate inhibits Tet-mediated demethylation of a regulatory region of the antimetastatic miRNA cluster6 miR-200ba429, leading to the expression of EMT-related transcription factors and enhanced migratory properties. These epigenetic and phenotypic changes are recapitulated by the incubation of FH-proficient cells with cell-permeable fumarate. Loss of FH is associated with suppression of miR-200 and EMT signature in renal cancer patients, and is associated with poor clinical outcome. These results imply that loss of FH and fumarate accumulation contribute to the aggressive features of FH-deficient tumours.
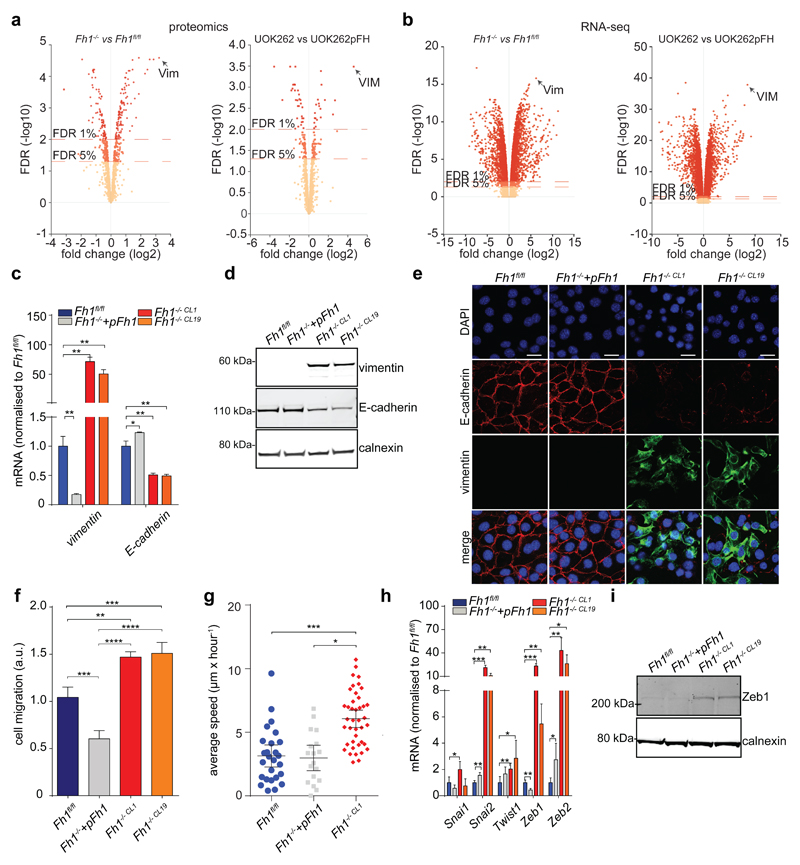
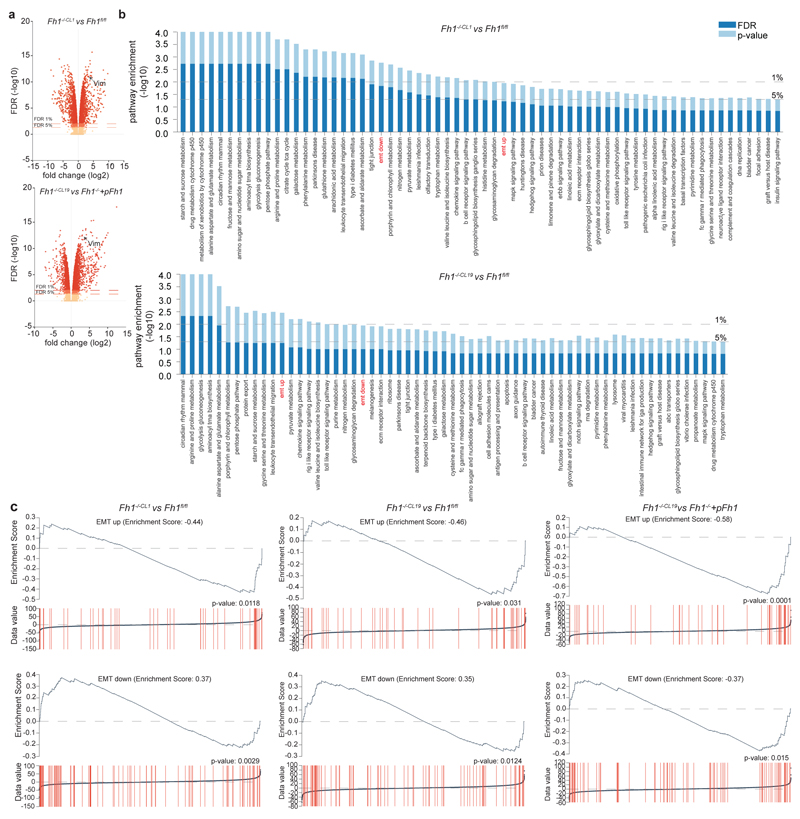
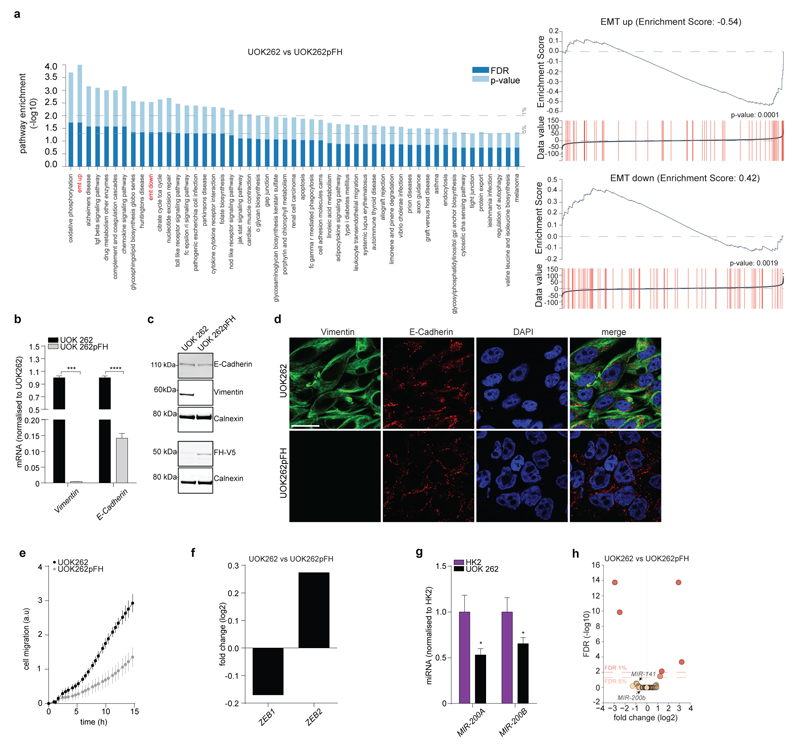
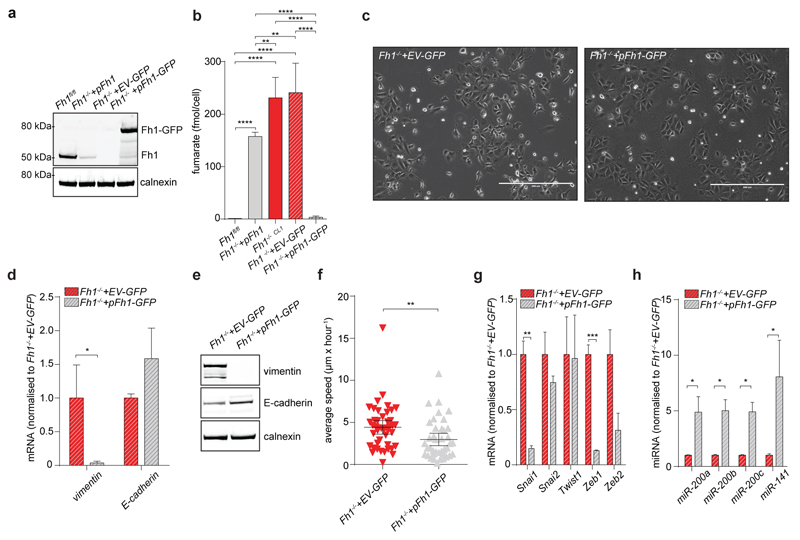
To identify oncogenic features associated with FH loss we performed unbiased proteomics analyses of mouse (Fh1-/-) and human (UOK262) FH-deficient cells7 (Extended Data Fig. 1). We found that vimentin, a known EMT marker, is the most overexpressed protein in these cells, compared to FH-proficient counterparts (Fig. 1a). Gene expression profiling (Fig. 1b) followed by Gene Set Enrichment Analysis (GSEA)8 confirmed an enrichment of EMT-related genes in FH-deficient cells (Extended Data Fig. 2 and Extended Data Fig. 3a, respectively). The reintroduction of full-length Fh1 (pFh1) in Fh1-/- cells (Extended Data Fig. 1a-e) was sufficient to rescue the EMT signature (Extended Data Fig. 2a and Extended Data Fig. 2c), to abolish vimentin expression (Fig. 1c-e), and to restore expression of E-Cadherin (Fig. 1c-d), a key epithelial marker. Fh1-/-+pFh1 cells acquired an epithelial morphology (Extended Data Fig. 1e) and their motility was reduced compared to that of Fh1-deficient cells (Fig. 1f-g). UOK262 cells exhibited a strong Vimentin expression (Extended Data Fig. 3b-d), and increased migration (Extended data Fig. 3e) compared to UOK262pFH. However, localisation of E-Cadherin at the plasma membrane was not observed in UOK262pFH (Extended Data Fig. 3d).
Figure 1. FH-deficient cells display mesenchymal features.
a, b, Volcano plots of proteomics (a) and RNA-seq (b) experiments. FDR = false discovery rate. c, d, mRNA expression measured by qPCR (c) and protein levels measured by western blot (d) of EMT markers. e, Immunofluorescence staining for vimentin and E-cadherin. Scale Bar = 25 µm. f, Cells migration assay. Data indicate cell index at 17 hours. Results were obtained from 4 (Fh1 -/-+pFh1) or 3 replicate wells and presented as mean ± S.D. p-value was calculated using One way-ANOVA. g, Average speed of cells. p-value was calculated using Mann-Whitney test. Results were obtained from 3 independent cultures. h, mRNA expression of EMT-related transcription factors measured by qPCR. i, Western blot analysis of Zeb1. Calnexin was used as loading control. All qPCR results were obtained from 3 independent cultures and presented as RQ with max values, normalised for β-actin. p-values was calculated using unpaired t-test. *P ≤0.05, **P ≤0.01, ***P ≤0.001, ****P≤0.0001. For western blot source data, see Supplementary Figure 1. For Raw data see SI Table 2.
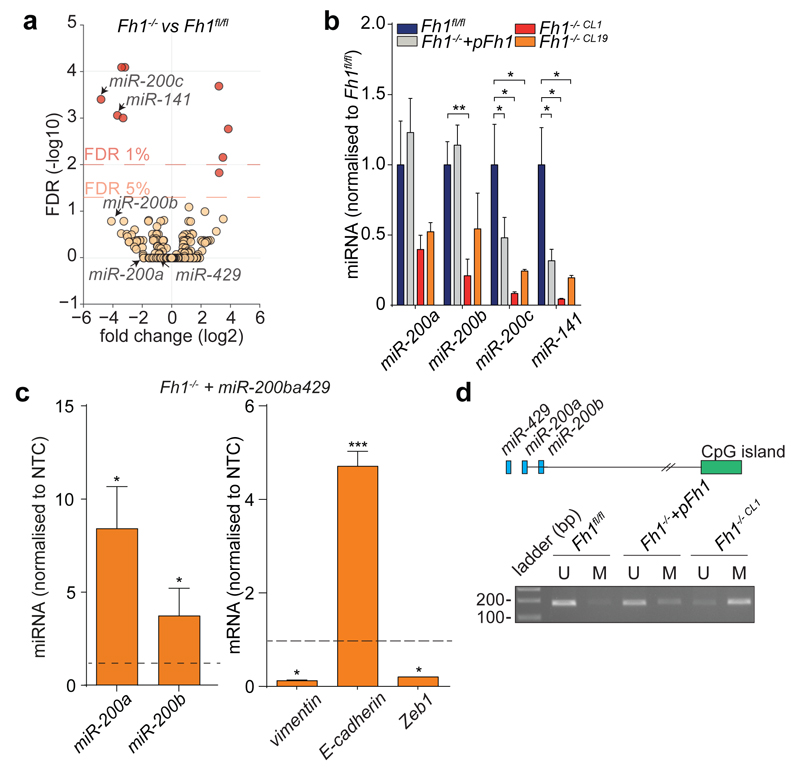
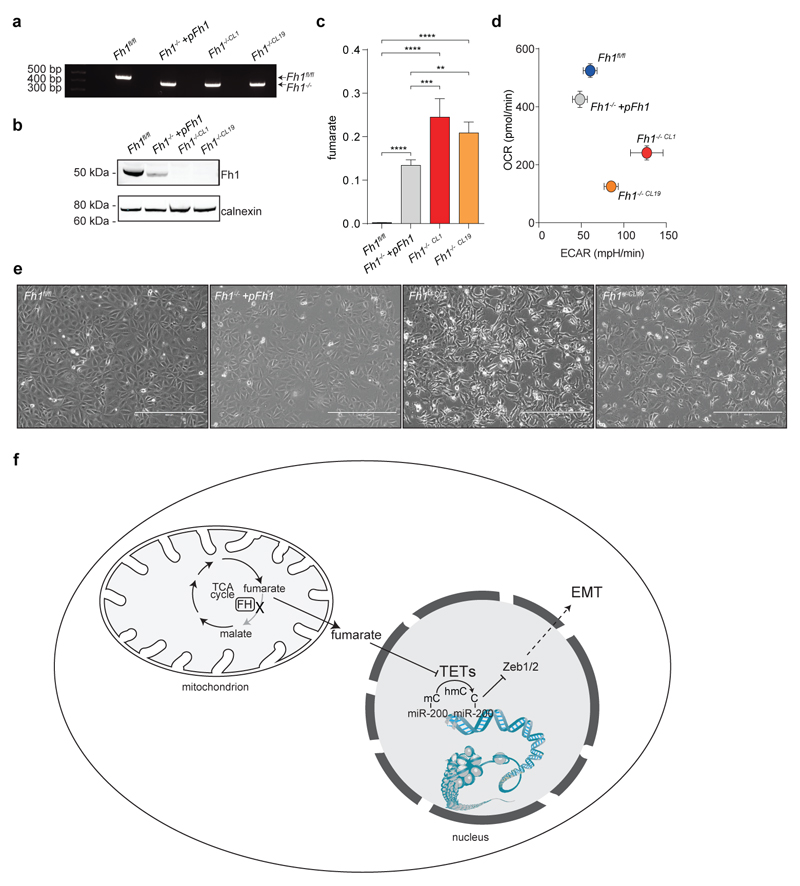
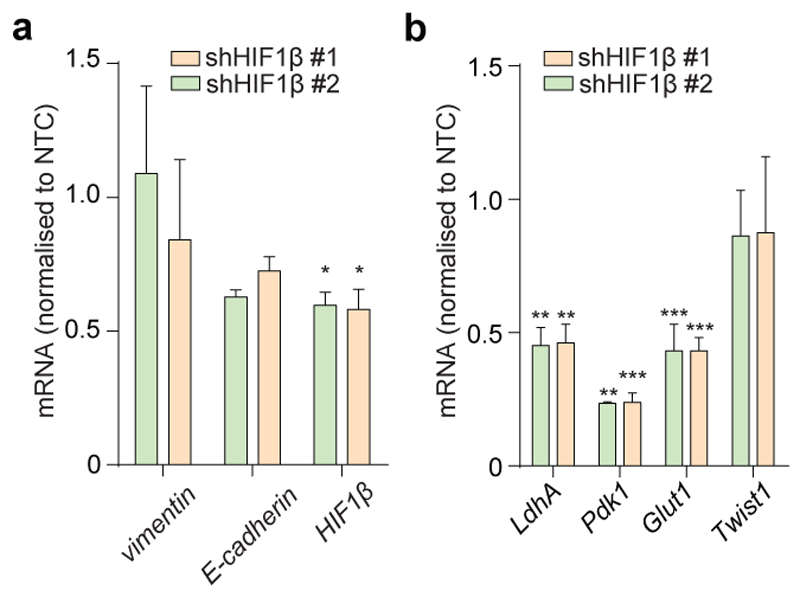
EMT is orchestrated by several transcription factors, including Twist, Snai1, Snai2, and Zeb1/2 (ref 9). Twist, which is activated by the Hypoxia-Inducible Factor HIF1 (ref 10), a key player in FH-deficient tumours11, was elevated in Fh1-deficient cells (Fig. 1h). The silencing of HIF1β, the constitutively expressed subunit of HIFs required for their transcriptional activity12, failed to reduce the expression of EMT markers (Extended Data Fig. 4a-b), suggesting that EMT in Fh1-deficient cells is likely HIF-independent. Snai2, Zeb1 and Zeb2 were also induced in Fh1-deficient cells, and their expression was reverted by Fh1 re-expression in these cells (Fig. 1h-i). Zeb2 expression was also decreased upon FH restoration in UOK262 cells (Extended Data Fig. 3f). Snai2 and Zeb1/2 are suppressed by antimetastatic miRNAs miR-200ba429 and the miR-200c141 (ref 6). miRNA profiling revealed that miR-200 family members were among the most down-regulated miRNAs in Fh1-deficient cells (Fig. 2a). Suppression of MIR-200 was also observed in UOK262 cells compared to the non-transformed counterpart HK2 and partially restored by FH re-expression (Extended Data Fig. 3g-h). qPCR confirmed the miRNA profiling results and showed that the reconstitution of Fh1 in Fh1-deficient cells restored the expression levels of miR-200a and miR-200b and, in part, that of miR-200c and miR-141 (Fig. 2b). We hypothesised that the partial restoration of miR-200c141 could be ascribed to the residual fumarate in Fh1-/-+pFh1 cells (Extended Data Fig. 1c and Extended Data Fig. 5b), which could also explain the partial recovery of the EMT gene signature (Extended Data Fig. 2a-c). Blunting fumarate levels by re-expressing high levels of Fh1 in Fh1-/- cells rescued their phenotype (Extended Data Fig. 5b-g) and led to a full reactivation of the entire miR-200 family (Extended Data Fig. 5h), indicating that members of this family have a different susceptibility to fumarate. The incomplete rescue of fumarate levels in UOK262pFH (ref 7) could also explain the partial restoration of MIRNAs and some EMT markers in these cells.
Figure 2. Loss of Fh1 triggers epigenetic suppression of miR-200.
a, Volcano plot of miRNA profiling. b, miRNAs expression measured by qPCR. Date were normalised to Snord95. c, miRNAs and EMT markers expression in Fh1-/- cells expressing miR-200ba429. β-actin and Snord95 were used as endogenous control for mRNA and miRNA, respectively. NTC= non-targeting control. d, Methylation-specific PCR of CpG43. U = un-methylated; M = methylated CpG island. The miR-200ba429 cluster (blue) and CpG43 (green) are represented in the schematic. qPCR results were obtained from at least 3 independent cultures and presented as RQ with max values. p-values was calculated using unpaired t-test. *P ≤0.05, **P ≤0.01, ***P ≤0.001, ****P≤0.0001. For gel source data, see Supplementary Figure 1. For Raw data see SI Table 2.
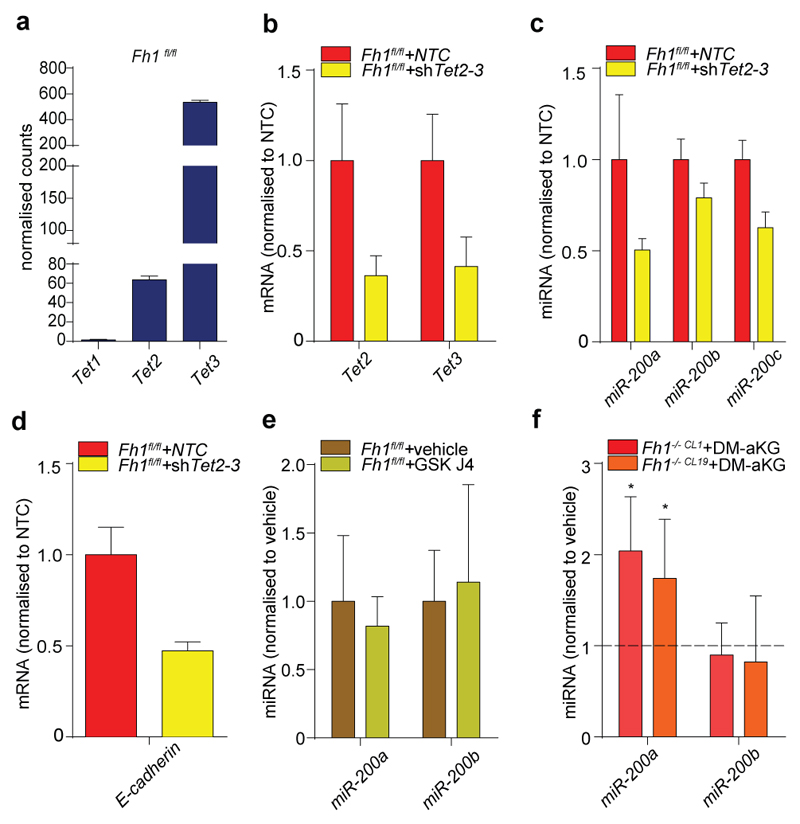
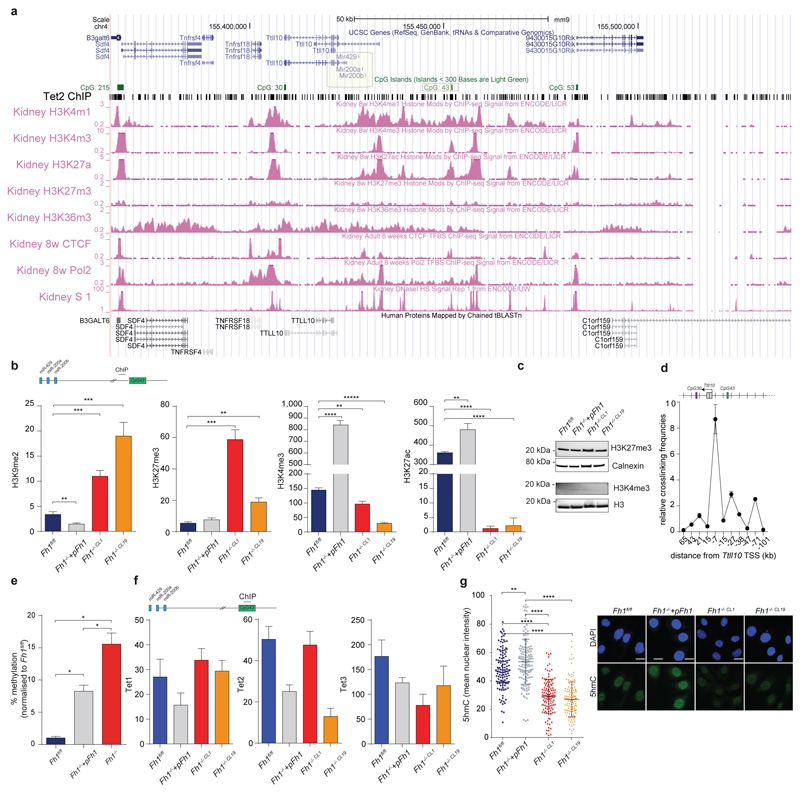
Since miR-200ba429 expression was fully restored in Fh1-/-+pFh1 and its expression was sufficient to suppress vimentin and rescue E-cadherin expression in Fh1-deficient cells (Fig. 2c), we investigated the role of this miRNA cluster in Fh1-dependent EMT. Repression of miR-200 is associated with its epigenetic silencing via CpG island hypermethylation13, which can also be caused by downregulation of Tets14,15. We hypothesised that fumarate could cause suppression of miR-200ba429 by inhibiting their Tets-mediated demethylation. The combined silencing of Tet2 and Tet3, the most abundant Tets isoform in Fh1fl/fl cells (Extended Data Fig. 6a), but not the inhibition of aKG-dependent histone demethylases with GSK-J4 (ref 16), decreased miRNAs and E-Cadherin expression (Extended Data Fig. 6b-e), highlighting the role of Tets in regulating EMT, in line with previous findings14,15. Genome Browser17 view of an ENCODE dataset generated in mouse kidney cells revealed a conserved CpG island at the 5’ end of miR-200ba429, CpG43, that is enriched in binding sites for Tets and for lysine-methylated histone H3 (Extended Data Fig. 7a). Chromatin immunoprecipitation (ChIP) experiments showed that a region adjacent to CpG43 is enriched for the repressive marks H3K9me2 and H3K27me3 and depleted of the permissive marks H3K4me3 and H3K27Ac in Fh1-deficient cells (Extended Data Fig. 7b) in the absence of changes in H3K4 and H3K27 methylation among the four cell lines (Extended data Fig. 7c). Chromosome Conformation Capture (3C) analysis18 identified a physical association between this regulatory region and the transcription starting site of miR-200ba429, which sits in the intronic region of the gene Ttl10 (Extended Data Fig. 7d). This region was hypermethylated in Fh1-deficient cells and the re-expression of Fh1 restored its methylation levels (Fig. 2d and Extended Data Fig. 7e). Binding of Tets to the CpG43 was comparable among the cell line tested (Extended Data Fig. 7f), suggesting that the changes in methylation of this region are, at least in part, caused by inhibition of Tets enzymatic activity rather than by their differential binding to chromatin. Consistently, 5-hydroxymethylcytosine (5hmc), the product of oxidation of 5-methylcytosine by Tets15, was significantly decreased in Fh1-deficient cells (Extended Data Fig. 7g).
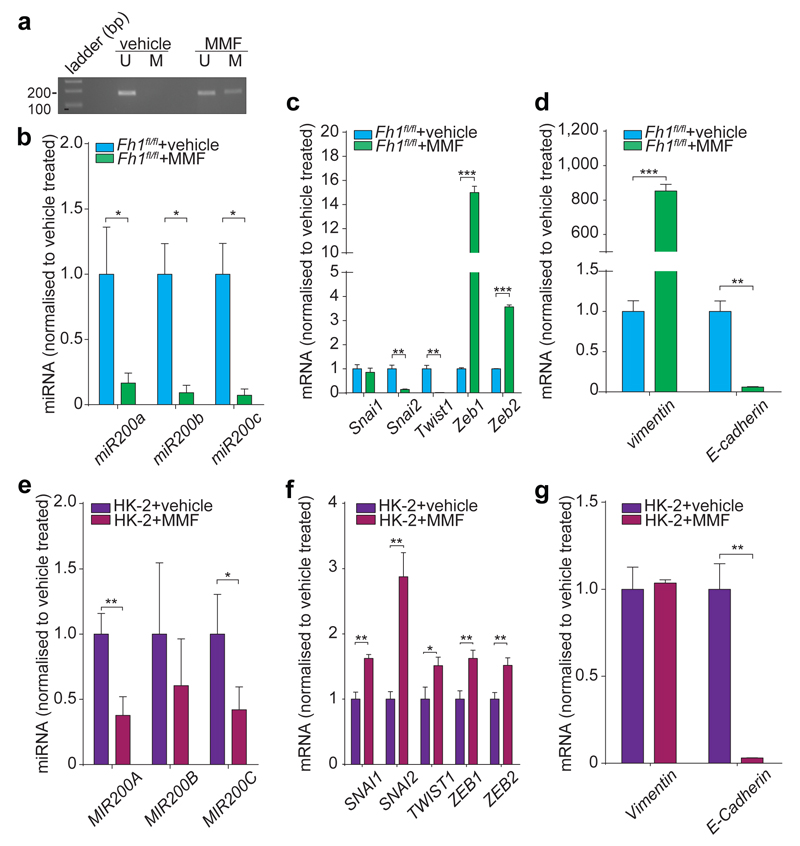
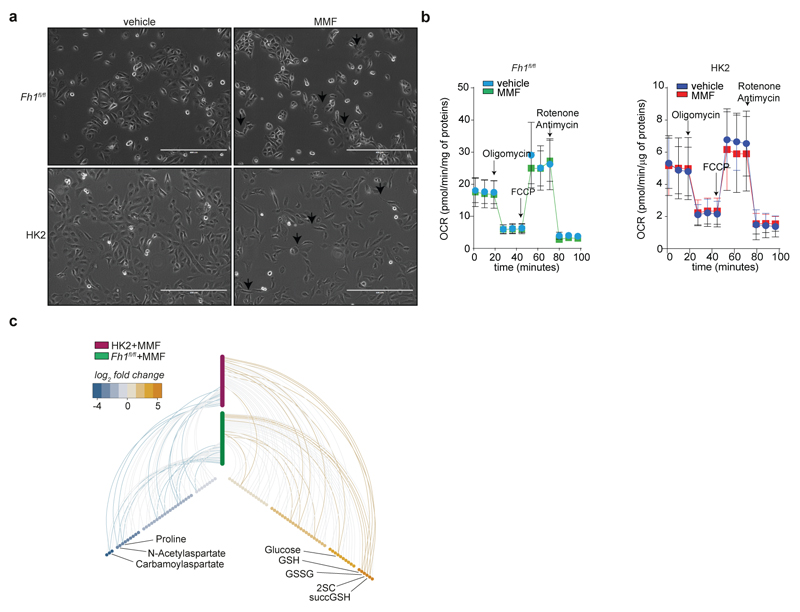
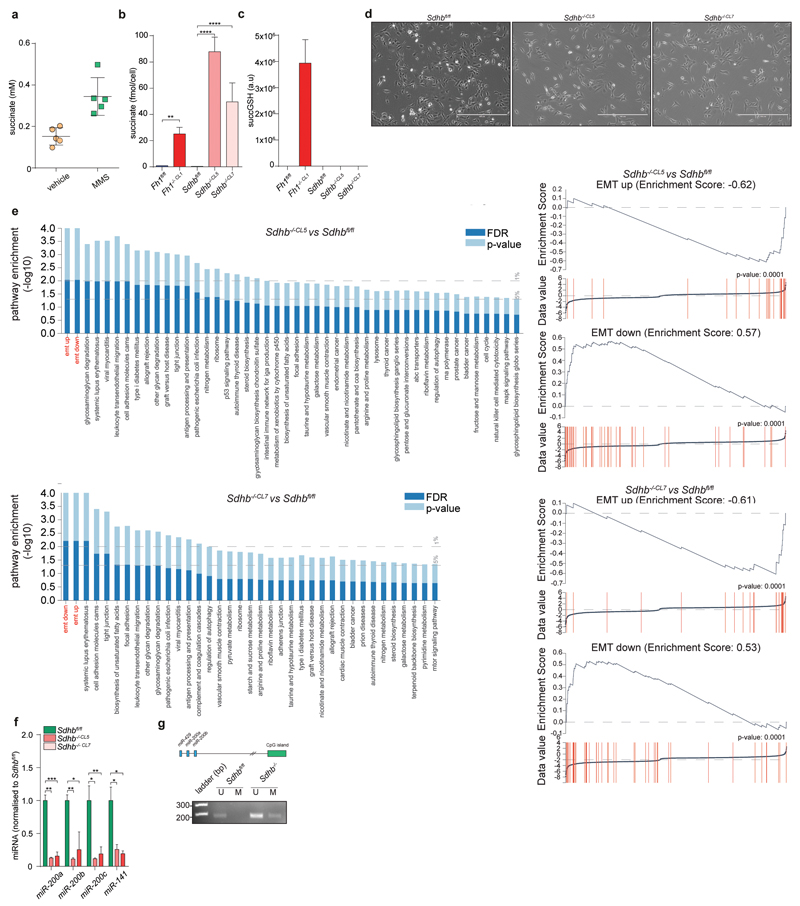
Incubating cells with dimethyl aKG (DM-aKG), a cell-permeable derivative of aKG, known to reactivate aKG-dependent dioxygenases19, restored the expression miR-200a in Fh1-deficient cells (Extended Data Fig. 6f). Conversely, treating Fh1fl/fl and human FH-proficient epithelial kidney cells HK2 with monomethyl fumarate (MMF), a cell permeable derivative of fumarate triggered profound phenotypical (Extended Data Fig. 8a) and (epi)genetic (Fig. 3a-g) changes that resembled those of FH-deficient cells. However, we could not observe induction of Snai2 that we observed in Fh1-/- cells (Fig. 1h) and changes in Vimentin in HK2 cells, which is expressed in these cells22, despite their epithelial origin. MMF did not cause mitochondrial dysfunction but lead to a typical fumarate-dependent metabolic signature, characterised in both cell types by accumulation of fumarate and fumarate-derived succinic-GSH (succGSH) and succinic-cysteine (2SC) that we and others recently described20,21 (Extended Data Fig. 8b-c and SI Table 3). To rule out the possibility that by-products of fumarate accumulation, rather than fumarate itself, elicit EMT we analysed the effects of accumulation of succinate, another metabolite that can inhibit Tets3–5, but cannot promote succination. Since we could not increase succinate levels with the cell permeable dimethyl succinate (Extended Data Fig. 9a) we used succinate dehydrogenase b (Sdhb)-deficient cell lines23, which accumulate succinate but not fumarate by-products, including succGSH (Extended Data Fig. 9b-c). These cells exhibited striking mesenchymal features (Extended Data Fig. 9d-e), and epigenetic suppression of the miR-200ba429 family (Extended Data Fig. 9f-g), in line with the hypermethylation phenotype and EMT signature recently observed in SDH-deficient cells24.
Figure 3. Fumarate triggers EMT in FH-proficient cells.
miRNA methylation (a) and expression (b, e); EMT transcription factors (c, f) and EMT markers (d, g) levels from MMF-treated cells. Results were obtained from 3 independent cultures. qPCRs are presented as RQ with max values, normalised for Snord95 (mouse) or SNORD95 (human) for miRNAs, and for β-actin for mRNA. p-values were calculated using unpaired t-test. *P ≤0.05, **P ≤0.01, ***P ≤0.001, ****P≤0.0001. For gel source data, see Supplementary Figure 1. For Raw data see SI Table 2.
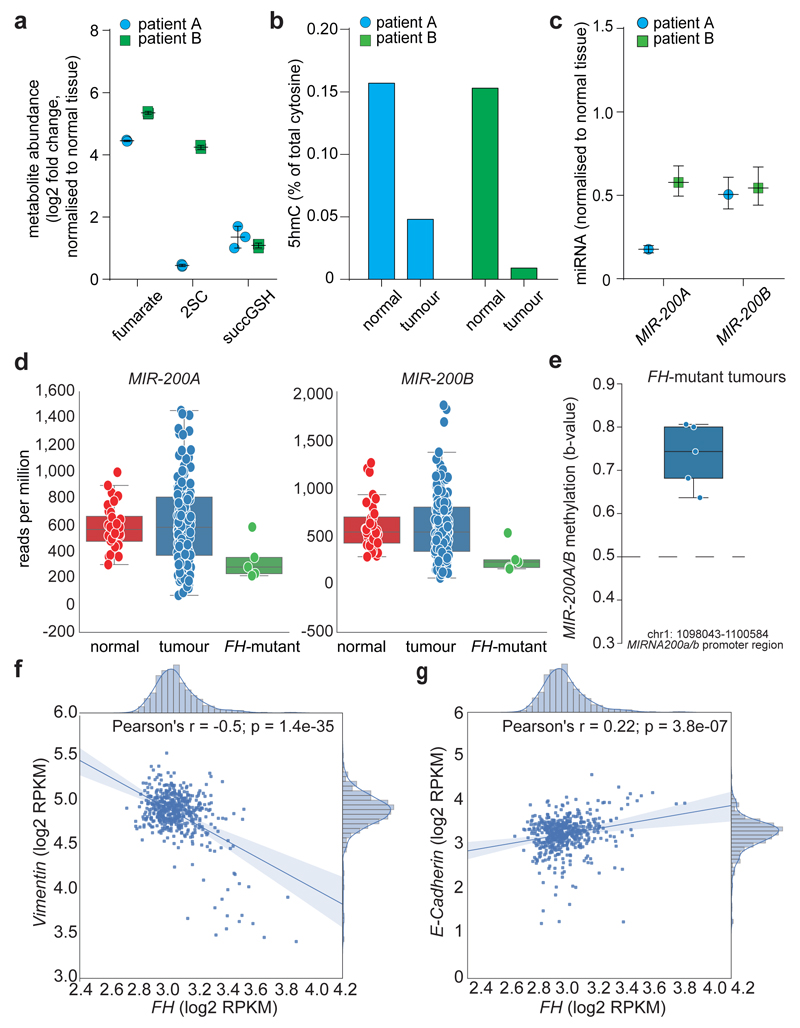
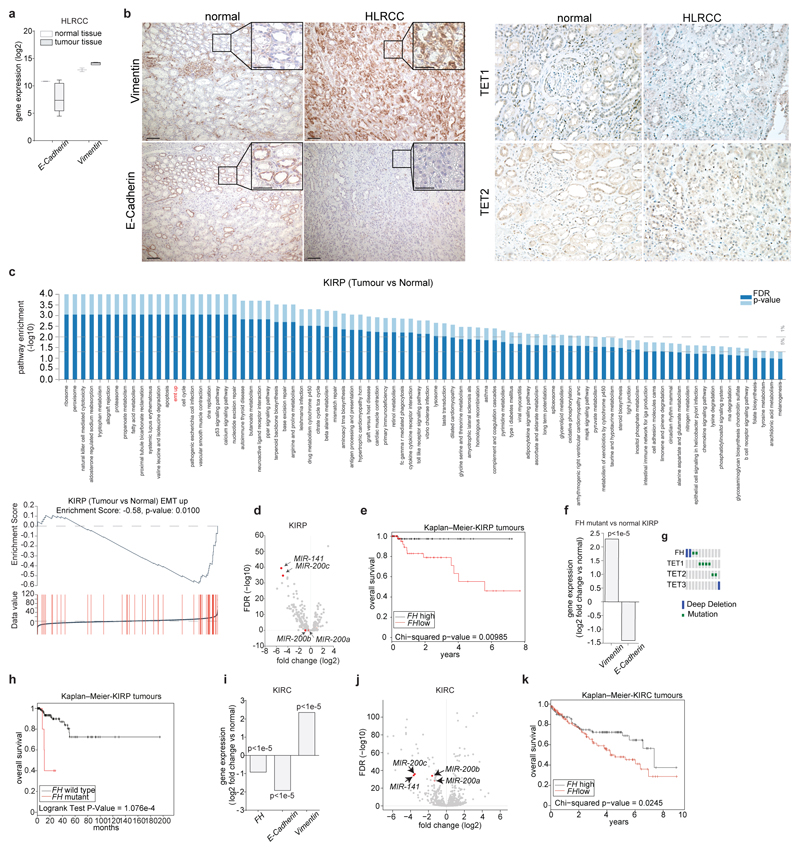
We next investigated the link between FH loss, fumarate accumulation and EMT in renal cancer samples. Vimentin was highly expressed and E-Cadherin was decreased in a previously published dataset25 of HLRCC tumour samples, when compared to normal tissue (Extended Data Fig. 10a). Two HLRCC tumours that we profiled (Fig. 4a), exhibited decreased 5hmC levels (Fig. 4b) despite comparable TETs levels (Extended Data Fig. 10b), MIR-200 suppression (Fig. 4c), a marked Vimentin staining and loss of E-Cadherin (Extended Data Fig 10b), compared to matched normal tissue. We also took advantage of data from a collection of papillary renal-cell carcinoma (KIRP), a tumour type associated with loss of FH26. These tumours exhibited a partial EMT signature (Extended Data Fig. 10c) and downregulation of MIR-200 (Extended Data Fig. 10d). FH levels were positively correlated with patients’ survival (Extended Data Fig. 10e) in line with the poor prognosis associated with EMT6. The five FH-mutant tumours in this cohort exhibited overexpression of Vimentin and suppression of E-Cadherin (Extended Data Fig. 10f), hypermethylation and suppression of MIR-200A and MIR-200B (Fig. 4d-e) in the absence of TETs mutations (Extended Data Fig. 10g). These tumours were associated with the worst prognosis among papillary cancers (Extended Data Fig. 10h). FH mRNA was also significantly decreased in a panel of clear cell renal carcinoma (KIRC)27 (Extended Data Fig. 10i) and its levels negatively correlated with Vimentin (Pearson correlation coefficient of -0.5, p-value < 1e-5; Fig. 4f) and positively with E-Cadherin (Pearson correlation coefficient of 0.22, p-value < 1e-5; Fig. 4g), and were positively correlated with patients’ survival (Extended Data Fig. 10k), confirming the role of FH in tumour malignancy and patient outcome.
Figure 4. Loss of FH correlates with EMT signature in renal cancers.
a-c, Metabolomic analysis (a), 5hmc levels in DNA (b), and MIRNAs expression (c) in tumour samples from two HLRCC patients. Results were obtained from 4 technical replicates per sample. qPCRs are presented as RQ with max values, normalised for RNU6B and SNORD61. d, e, Expression levels (d), and promoter methylation (e) of the indicated MIRNAs in KIRP patients f, g, Vimentin (f) and E-Cadherin (g) expression in clear cell renal cell carcinoma (KIRC) patients. For Raw data see SI Table 2.
Our results report a novel link between the loss of FH and epigenetic suppression of miR-200 mediated by fumarate (see Extended Data Fig. 1f for a schematic). Although other mechanisms could contribute to fumarate-driven EMT, our findings offer an explanation for the suppression of MIR-200 in papillary and clear-cell renal carcinoma and the expression of EMT-related transcription factors, including ZEB2, in KIRC28. Our data imply that dysregulation of FH activity and fumarate accumulation have roles in EMT induction and may feature in other tumour types where FH loss has been reported, including neuroblastoma29, colorectal and lung cancer30.
Online Content
Methods, along with additional Extended Data display items and Source Data, are available in the online version of the paper; references unique to these sections appear only in the online paper.
Methods
No statistical methods were used to predetermine sample size
Cell culture
Fh1-proficient (Fh1fl/fl), and the two Fh1-deficient clones (Fh1-/-CL1, and Fh1-/-CL19) cells were obtained as previously described7. Fh1-/-+pFh1 were single clones generated from Fh1-/-CL19 after stable expression of a plasmid carrying mouse wild-type Fh1 gene (Origene, MC200586). Mouse cells were cultured using DMEM (Gibco-41966-029) supplemented with 10% heat inactivated serum (Gibco-10270-106) and 50 µg x mL-1uridine. Genotyping of cells was assessed as previously described7. Human FH-deficient (UOK262) and FH-restored (UOK262pFH) were obtained as previously described7 and cultured in DMEM (Gibco-41966-029) supplemented with 10% serum heat inactivated (Gibco-10270-106). HK2 cells were a gift from the laboratory of E.R.M. These cells were authenticated by Short Tandem Repeat and cultured in DMEM (Gibco-41966-029) supplemented with heat inactivated 10% serum. All cell lines have been tested for mycoplasma contamination using MycoProbe® Mycoplasma Detection Kit (R&D Systems CUL001B), and were confirmed mycoplasma-free.
Generation of Fh1-/-+pFh1-GFP cells
Fh1-GFP vector was generated by amplifying wild-type Fh1 sequence using cDNA generated from Fh1fl/fl cells by PCR. Restriction overhangs (KpnI, EcoRI) were included in the primer sequence allowing for restriction enzyme cloning of Fh1 into the backbone vector pEF1α-V5/His (Life Technology). We then used a two-step PCR “restriction-free” method to swap the V5-His sequence within pEF1α with the AcGFP sequence to yield a fusion protein, Fh1-GFP. 1x10⁵ Fh1-/- CL1 cells were plated onto 6-well plate and the day after transfected with Fh1-GFP vector using Lipofectamine 2000 following manufacturer’s instructions. After 2 weeks, cells were sorted for GFP expression and the medium-expressing population was maintained in culture and amplified. pEF1α-GFP empty vector was used as control. Primers for cloning are listed in SI Table 1.
Short hairpin RNA (shRNA) interference experiments
Lentiviral particles for shRNA delivery was obtained as previously described7 from the filtered growth media of 2x10⁶ HEK293T transfected with 3 µg psPAX, 1 µg pVSVG and 4 µg of the plasmid of interest using Lipofectamine 2000/3000 (Life Technology). 1x10⁵ cells of the indicated genotype were then plated onto 6-well plates and infected with the viral supernatant in the presence of 4 µg x mL-1 polybrene. After two days, the medium was replaced with selection medium containing 1 µg x mL-1 puromycin. pGIPZ vectors for shRNA against mouse HIF1β (RMM4532-EG11863), Tet2 (RMM4532-EG214133), and Tet3 (RMM4532-EG194388) were purchased from GE Healthcare UK. pLenti 4.1 Ex for expression of microRNAs was purchased from Addgene (Plasmid #35533 and #35534). pLenti 4.1 Ex scrambled vector was generated cloning a scrambled DNA sequence taken from a commercially available vector (pCAG-RFP-miR-Scrint Addgene no. 198252) into the empty backbone.
RNA extraction and real time PCR
Cells were plated the day before the experiments onto 6-well plates (3x10⁵) or 12-well plates (1x10⁵). Total RNA was isolated using RNeasy Kit (Qiagen). miRCURY™ RNA Isolation Kit (Exiqon, Denmark) was used for microRNAs extraction. RNA isolation was carried following manufacturer’s protocols. RNA was quantified using the fluorimeter Qubit 2.0 (Life Technologies) following manufacturer’s instructions or Nanodrop (Thermo). Reverse transcription of RNA was performed using Quantitect-Reverse transcription kit (Qiagen) or miScript PCR kit (Qiagen) using 300-500 ng of total RNA. Real time qPCR was performed using Quantitect Syber Green master mix (Qiagen) or Taqman universal mix (Life Technology) on a Step One Plus real-time PCR system (Life Technology). Experiments were analysed using the software Expression Suite (Life Technology) and StepOne software 2.3 and Relative quantification (RQ) with max and min values (RQ max and RQ min) were calculated using S.D. algorithm. Statistical analysis was performed using Expression Suite software on at least three independent cultures. Housekeeping genes used for internal normalisation are β-Actin for mRNA and Snord95 Snord61 and RNU6B, for miRNAs. The primers were designed using ProbeFinder- Roche or purchased by Qiagen and are listed in SI Table 1.
miRNA methylation analyses
5x10⁵ cells were plated onto 6-cm dishes. Their genomic DNA was extracted using DNeasy kit (Qiagen), and purified using DNA Cleaning and Concentrator kit (Zymo Research) following manufacturer’s instructions. 20 ng/well of genomic DNA, quantified using Qubit, were digested using OneStep qMethyl kit (Zymo Research) following manufacturer’s protocol. Primers used are listed in the SI Table 1.
For methyl specific PCR (MSP) assay 500 ng of purified DNA were bisulphate converted using the EZ-DNA Methylation-direct kit (Zymo Research) following manufacturer’s datasheet. 50 ng of bisulphate-converted DNA, quantified using Nanodrop spectrofluorimeter, were used for PCR reaction with AmpliTaq Gold (Life Technology) following manufacturer’s protocol. The number of amplification cycles used was thirty. Methylation specific primers were designed using MethPrimer31 (http://www.urogene.org/cgi-bin/methprimer/methprimer.cgi) and are listed in the SI Table 1.
Migration assay
Migration experiments were performed using xCELLigence instrument (ACEA Biosciences). In brief, 5x10⁴ cells were plated onto CIM plates in medium supplemented with 1% FBS. Complete medium with 20% FBS was used as chemo attractant. Migration was registered in real time for at least 24 hours and cell index was calculated using the appropriate function of the xCELLigence software.
Motility assay
5x10⁴ mouse cells of the indicated genotype were plated the day before the experiment onto 6-cm dishes. The day after, medium was replaced with fresh medium containing Hoechst (Sigma-Aldrich) and cells were incubated for 15 minutes at 37°C with 5% CO2 before starting recording. Images were collected every minute for 3 hours using a Zeiss Axiovert 200M microscope with a 10x objective. Analysis of cells movement was performed using cell tracker (www.celltracker.website) implemented in MATLAB (MATLAB R2013b, The MathWorks Inc., 2013) as previously described32. Three replicates were analysed for each cell type. All tracks were examined and those belonging to non-isolated cells deleted. Average speed for each cell was calculated as the sum length of the cell’s trajectory divided by the total time over which the trajectory was measured. Since the data were not normally distributed (Shapiro-Wilk test), a Mann-Whitney test was used to compare the average speeds of the cells.
Oxygen consumption rate and Extracellular acidification rate measurements
Oxygen Consumption Rate (OCR) and Extracellular Acidification Rate (ECAR) were measured using the real time flux analyser XF-24e (Seahorse Bioscience) as previously described7. In brief, 4x10⁴cells were left untreated and then treated with 1 µM Oligomycin, 2 µM Carbonyl cyanide-p-trifluoromethoxyphenylhydrazone (FCCP), Rotenone and Antimycin A (both 1 µM) (all purchased from Sigma-Aldrich). At the end of the run cells were lysed using RIPA buffer (25 mM Tris/HCl pH 7.6, 150 mM NaCl, 1% NP-40, 1% sodium deoxycholate, 0.1% SDS). Protein content for each well was measured using BCA kit (Pierce) following manufacturer’s instruction. OCR and ECAR are normalised to total protein content were indicated.
Immunofluorescence experiments
5x10⁴cells were plated onto chamber slides (Lab Tech), cultured in standard condition overnight and then fixed using 100% methanol for 2 minutes at –20°C. After two washes in PBS, cells were permeabilised and incubated with blocking solution (BSA 2%, 0.1% Triton X-100, 0.1% Tween 20 in PBS) for 30 minutes at room temperature. Cells were then incubated with the primary antibody (overnight at 4°C). For 5hmc staining, cells were grown on coverslips onto a 12-well plate. Cells were then fixed with 4% PFA in PBS for 15 minutes at room temperature, washed three times in PBS and then incubated for 15 minutes with 0.4% Triton X-100 in PBS. After three washes in PBS, cells were denaturated using a solution of 2 M HCl for 15 minutes at room temperature and neutralised using 100 mM Tris pH.8, for 5 minutes. After three washes in PBS, cells were incubated with blocking solution (5% FBS, 0.1% Triton X-100, 0.1% Tween 20 in PBS) for 1 hour and then primary antibody was added at 4°C overnight. After three washes in PBS, cells were incubated with secondary antibody during 2 hours at room temperature and then slides or coverslips were mounted (Vectashield with DAPI) and images taken using Leica confocal microscope TCS SP5 using 20X or 40X objectives. Laser intensity, magnification, and microscope settings per each channel were maintained equal throughout the different experimental conditions. Antibodies used are listed in SI Table 1.
Protein lysates and Western Blot
Cell lysates were prepared in RIPA buffer. Protein content was measured using BCA kit (Pierce) following manufacturer’s instructions. 50-100 µg of proteins were heated at 70°C for 10 minutes in presence of Bolt Loading Buffer 1x supplemented with 4% β-mercaptoethanol (Sigma). Samples were then loaded onto Bolt Gel 4-12% Bis-Tris (Life Technology) and run using MOPS 1x or MES 1x buffer at 165 V constant for 40 minutes. Dry transfer of the gels was carried using IBLOT2 system (Life Technology). Membranes were then incubated in blocking buffer (5% BSA or 5% milk in TBS 1x + 0.01 % Tween 20) for one hour at room temperature. Primary antibodies in blocking buffer were incubated overnight at 4°C. Secondary antibodies (conjugated with 680 or 800 nm fluorophores from Li-Cor) were diluted 1:2000 in blocking buffer and incubated for one hour at room temperature. Images were acquired using Odyssey software (Li-Cor). Primary antibodies are listed in SI Table 1.
Chronic treatment of mouse and human cells
Fh1fl/fl cells were cultured either with 200 µM monomethyl-fumarate (MMF, Sigma-Aldrich) for 2 weeks and then with 400 µM MMF for the following 6 weeks, or with 4 mM monomethyl-succinate (MMS, Sigma-Aldrich) for 8 weeks. HK2 cells were cultured with MMF 400 µM for 8 weeks. Fh1-/- cells were treated with the indicated doses of dimethyl aKG (DM-aKG, Sigma-Aldrich). Fh1 fl/fl cells were treated with histone demethylase inhibitor GSKJ4 (Tocris) 1 µM for 8 weeks. MMF, MMS and GSKJ4 were added twice a week after passaging the cells.
Chromatin immunoprecipitation (ChIP)-real time PCR (ChIP-PCR)
ChIP was performed as previously described33. Enrichment was determined by Real-time PCR and ChIP signal was normalised to input, IgG only ChIP and negative control (genomic region devoid of histone markers). For Tets ChIP-PCR, the signal was normalised over input and IgG ChIP, as Tet-specific genomic negative controls are not as readily identifiable. Antibodies and primers for ChIP-PCR are indicated in SI Table 1.
Chromatin Conformation Capture assay (3C)
3C assay coupled with quantitative PCR (qPCR) was performed as previously described18. In brief, 107 cells were crosslinked with 1% formaldehyde for 10 minutes at room temperature and were quenched with glycine. Cells were then lysed by dounce homogenization in ice-cold lysis buffer (10 mM Tris-HCl pH 8.0, 10 mM NaCl, 0.2% Igepal CA-630, all from Sigma) supplemented with protease inhibitor (Roche). Cells were then washed in 1.2x NEB buffer 2 (New England Biolabs). Non-crosslinked proteins were removed with SDS (Sigma- Aldrich) and were then quenched with Triton X-100. Chromatin was digested overnight with EcoR I restriction enzyme (New England Biolabs). Afterwards EcoR I was inactivated by heating at 65°C for 20 minutes. In-nuclear DNA ligation was performed at 16°C for 4 hours in the mixture containing 1x T4 DNA ligase buffer (New England Biolabs), 10 mg/ml BSA (New England Biolabs), and 1U/μL T4 DNA ligase (Invitrogen). Ligation mixture was then incubated with Proteinase K (Roche) at 65°C overnight to reverse the crosslinking and was incubated with RNase A (Roche) at 37°C for 1 hour. DNA was purified with Phenol (pH 8.0, Sigma) once and then with Phenol:Chloroform:Isoamyl Alcohol (25:24:1, pH 8.0, Sigma), followed by ethanol precipitation by adding 2.5 volume of ice-cold 100% ethanol and 1/10 volume of 3 M sodium acetate (pH 5.2, Lonza). DNA pellet was washed with 70% ethanol twice and was eventually dissolved in 100 μL distilled water. The concentration of 3C DNA was determined by Qubit dsDNA HS assays (Invitrogen). 100 ng DNA was taken to run qPCR in duplicate wells for each 3C sample, using Taqman Universal PCR Master Mix (Applied Biosystems) and specific Taqman primers and probes on ABI 7900 (Applied Biosystems) following manufacturer’s instruction. Data were analysed as recommended18 and were normalized to the internal loading control of Gapdh locus. Calculation of primers location was based on the transcription start site (TSS) of Ttll10 transcript (ENSMUST00000097731). Oligo sequences are listed in the SI Table 1.
Metabolomic analyses
3x10⁵ cells were plated onto a 6-well plate and cultured in standard conditions for 24 hours. Medium was replenished with fresh one and, after 24 hours, intracellular metabolites were extracted as previously described20. LCMS analysis was performed on a QExactive Orbitrap mass spectrometer coupled to Dionex UltiMate 3000 Rapid Separation LC system (Thermo). The liquid chromatography system was fitted with either a SeQuant Zic-HILIC column (column A, 150 mm × 4.6 mm, internal diameter 3.5 µm), or a SeQuant Zic-pHilic (column B, 150 mm × 2.1 mm, internal diameter 3.5 µm) with guard columns (20 mm × 2.1 mm, internal diameter 3.5 µm) both from Merck (Darmstadt, Germany). With column A, the mobile phase was composed by 0.1% aqueous formic acid (solvent A) and 0.1% formic acid in acetonitrile (solvent B). The flow rate was set at 300 μL x min-1 and the gradient was as follows: 0-5 min 80 % B, 5-15 min 15 min 30% B, 15-20 min 10 % B, 20-21 min 80% B, hold at 80% B for 9 minutes. For column B, the mobile phase was composed of 20 mM ammonium carbonate and 0.1% ammonium hydroxide in water (solvent C), and acetonitrile (solvent D). The flow rate was set at 180 µL x min-1 with the following gradient: 0 min 70% D, 1 min 70% D, 16 min 38% D, 16.5 min 70% D, hold at 70% D for 8.5 minutes. The mass spectrometer was operated in full MS and polarity switching mode. Samples were randomised, in order to avoid machine drift, and were blinded to the operator. The acquired spectra were analysed using XCalibur Qual Browser and XCalibur Quan Browser softwares (Thermo Scientific) by referencing to an internal library of compounds. Calibration curves were generated using synthetic standards of the indicated metabolites.
Proteomics analysis
Proteomics experiments were performed using mass spectrometry as reported before34,35. In brief, cells were lysed in urea lysis buffer (8 M urea, 10 mM Na3VO4, 100 mM β-Glycerol phosphate and 25 mM Na2H2P2O7 and supplemented with phosphatases inhibitors-Sigma) and proteins reduced and alkylated by sequential addition of 1 mM DTT and 5 mM iodoacetamide. Immobilised trypsin was then added to digest proteins into peptides. After overnight incubation with trypsin, peptides were desalted by solid phase extraction (SPE) using OASIS HLB columns (Waters) in a vacuum manifold following manufacturer’s guidelines with the exception that the elution buffer contained 1 M glycolic acid.
Dried peptide extracts were dissolved in 0.1% TFA and analysed by nanoflow LCMS/MS in an LTQ-orbitrap as described before34,35. Gradient elution was from 2% to 35% buffer B in 90 minutes with buffer A being used to balance the mobile phase (buffer A was 0.1% formic acid in water and B was 0.1% formic acid in acetonitrile). MS/MS was acquired in multistage acquisition mode. MS raw files were converted into Mascot Generic Format using Mascot Distiller (version 1.2) and searched against the SwissProt database (version 2013.03) restricted to human entries using the Mascot search engine (version 2.38). Allowed mass windows were 10 ppm and 600 mmu for parent and fragment mass to charge values, respectively. Variable modifications included in searches were oxidation of methionine, pyro-glu (N-term) and phosphorylation of serine, threonine and tyrosine. Results were filtered to include those with a potential for false discovery rate less than 1% by comparing with searches against decoy databases. Quantification was performed by obtaining peak areas of extracted ion chromatographs (XICs) for the first three isotopes of each peptide ion using Pescal 36,37. To account for potential shifts in retention times, these were re-calculated for each peptide in each LCMS/MS run individually using linear regression based on common ions across runs (a script written in python 2.7 was used for this retention time alignment step). Mass and retention time windows of XICs were 7 ppm and 1.5 minutes, respectively.
Toray miRNA array
Initial sample quality control was performed using a Bioanalyzer 2200 system in conjunction with the Total RNA Nano chip (Agilent, Cheadle UK). 250 ng total RNA were labelled using the miRCURY LNA microRNA Hy5 Power labelling kit (Exiqon, Vedbæk Denmark) according to the Toray array protocol. Samples were hybridized to the Human/Mouse/Rat miRNA 4-plex miRBase v17 array (Toray, London UK) and subsequently scanned using the 3D-Gene Scanner 3000 (Toray) according the manufacturer’s instructions. Data was normalized according to instructions provided by Toray. Briefly, presence or absence of signals was determined using a cut off defined as the mean of the middle 90% of the blank control intensities (background average intensity) + 2σ. Positive control signals were removed and the background average intensity subtracted from the signal intensities to give the background subtracted signal intensities (y). Normalised signal intensities (NSI) were then calculated as follows: NSI = 25y/(y). Raw data are presented in SI Table 4.
Mass spectrometry-based analysis of methylated DNA of HLRCC tumours
DNA from healthy and tumour tissue was extracted using DNeasyKit (Qiagen) following manufacturer’s instructions. 0.5-1 µg of DNA resuspended in 25 µL of water was first denatured at 100°C for 30 seconds, cooled on ice, and then added of 2 µL of 20 mM ZnSO4. DNA was digested at 50°C for 16 hours using 1 µL Nuclease P1 (200 units x mL-1, Sigma Aldrich) and dephosphorylated at 65°C for 2 hours by adding 1 µL of Bacterial alkaline phosphatase BAP (150 U x µL-1, Life Technology). pH was then adjusted using 30 µL of 0.5 M Tris-HCl pH 7.9 for one hour at 37°C.
Analysis of global levels of C, 5hmC and 5mC was performed on a QExactive Orbitrap mass spectrometer coupled to a Dionex UltiMate 3000 Rapid Separation LC fitted with an Acquity UHPLC HSS T3 column (100 x 2.1 mm, 1.8 µm particle size). The mobile phase consisted of 0.1% aqueous formic acid (solvent A) and 0.1% formic acid in acetonitrile (solvent B) at a flow rate of 300 µl x min-1. Calibration curves were generated using synthetic standards for 2’-deoxycytidine, 5-methyl- and 5-hydroxymethyl-2’-deoxycytidine (Berry&Associates). The mass spectrometer was set in a positive ion mode and operated in parallel reaction monitoring. Ions of masses 228.10, 242.11, and 258.11 were fragmented and full scans were acquired for the base fragments 112.0505, 126.0661, and 146.0611 ± 5ppm (corresponding to C, 5mC and 5hmC, respectively). The extracted ion chromatogram (EIC) of the corresponding base-fragment was extracted using the XCalibur Qual Browser and XCalibur Quan Browser software (Thermo Scientific), and used for quantification. Quantification was performed by comparison with the standard curve obtained from the pure nucleoside standards running with the same batch of samples. The level of 5hmC present in the sample was expressed as a percentage of total cytosine content.
Immunohistochemistry on HLRCC tumours
Specimens were formalin fixed and embedded in paraffin wax; 3-μm serial sections mounted on Snowcoat X-tra slides (Surgipath, Richmond, IL) were dewaxed in xylene and rehydrated using graded ethanol washes. For antigen retrieval, sections were immersed in preheated DAKO target retrieval solution (DAKO) and treated for 90 seconds in a pressure cooker. Sections analysed contained both tumour and adjacent normal renal parenchyma acting as an internal control; in addition, substitution of the primary antibody with antibody diluent was used as a negative control. Antigen/antibody complexes were detected using the Envision system (DAKO) according to the manufacturer's instructions. Sections were counterstained with hematoxylin for 30 seconds, dehydrated in graded ethanol washes, and mounted in DPX (Lamb, London, United Kingdom). Antibodies used were: E-cadherin (HECD1, CRUK) and vimentin (clone V9, Dako). TET1 (SAB 2501479) and TET2 (HPA 019032) antibodies were purchased by Sigma Aldrich.
miRNA expression on HLRCC tumours
Total RNA was extracted from tumour and healthy tissue using miRCURY kit (Exiqon, Denmark) following manufacture’s protocols. RNA reverse-transcription and real-time qPCR were obtained as described above. Data are normalised to healthy tissue using both SNORD61 and RNU6B as endogenous controls.
Clinical details of HLRCC patients
The patients consented to use of tissues for study approved by the National Research Ethics Committee London (REF number 2002/6486 and 03/018). FH mutations in HLRCC Patient A is c.1300T>C, and in Patient B is c.1189G>A
Bioinformatics and statistical analyses
Volcano plots were generated using the log10 fold-change on the x-axis and the -log10 of the multi hypothesis corrected p-value (false-discovery rate) on the y-axis generated by Limma38 differential analysis. The Epithelial–Mesenchymal Transition gene signature was extracted from Taube and colleagues39. Signature enrichment was performed with the commonly used Gene-Set Enrichment Analysis (GSEA)8 test. Signature significance was calculated by randomizing the genes signatures 10000 times.
The TCGA RNA-seq and miRNA-seq data-sets for clear cell (KIRC) and papillary (KIRP) renal carcinoma were downloaded from the Broad Firehose webpage (http://gdac.broadinstitute.org/). Differential analysis was performed with R package Limma38 using voom40 to transform the RNA-seq counts. Cancer patients were ranked according to FH expression and survival analysis was performed by comparing the overall survival time of upper vs. lower quartile of the FH-ranked list of patients. Kaplan Meier curves were built using in-house R scripts and significance was calculated using the R package Survival by applying a χ2 test. Hive plots were generated using the R package “HiveR”.
Graphpad Prism 6 was used to generate graphs and perform statistical analysis (one-way ANOVA test with Tukey’s post hoc test for multiple comparisons was used unless otherwise indicated). ChIP statistical analysis was generated using Excel (Microsoft). Except for metabolomic experiments, no randomization or blinding was performed. No statistical method or power analysis was used to predetermine sample size.
Code availability
The R and Python scripts for the analyses above can be found at http://www.ebi.ac.uk/~emanuel/Sciacovelli_et_al/.
Extended Data
Extended Data Figure 1. Characterisation of Fh1-deficient and Fh1-rescued cells.
a, PCR to assess Fh1 recombination. The putative genotypes are indicated on the right and are based on the expected size of the genomic PCR amplification products as from Frezza et al7. Fh1fl/fl = 470 bp and Fh1-/-= 380 bp. b, Fh1 protein levels measured by western blot of cells of the indicated genotype. Calnexin was used as loading control for western blot. c, Intracellular fumarate levels measured by LCMS and normalised to total ion count. Results were obtained from 4 independent cultures and are indicated as average ± S.D.. p-values were calculated from one-way ANOVA. d, Oxygen Consumption rate (OCR) and Extracellular Acidification rate (ECAR) assessed using the Seahorse Extracellular Flux Analyser. Results were obtained from 5 replicate wells and are presented as average ± S.D.. e, Bright field images of cells of the indicated phenotype. Bar = 400 µm. Western blot and gel sources are presented in Supplementary Figure 1. Raw data are presented in SI Table 2. *P ≤0.05, **P ≤0.01, ***P ≤0.001, ****P≤0.0001. f, Schematic representation of the proposed link between loss of FH, fumarate accumulation, and epigenetic suppression of the antimetastatic cluster of miRNA miR-200. Upon accumulation of fumarate as a result of FH inactivation, the TET-mediated demethylation of the miR-200ba429 cluster is inhibited, leading to their epigenetic suppression. As a consequence, Zeb1/2 are de-repressed, eliciting a signalling cascade that leads to EMT.
Extended Data Figure 2. EMT signature in Fh1-/- cells.
a, Volcano plot of RNA-seq analysis. Gene expression was normalised to Fh1fl/fl or Fh1-/-+pFh1 cells as indicated. b, c, Gene set enrichment analysis (b) and EMT enrichment score (c) of the indicated cell lines.
Extended Data Figure 3. EMT signature in UOK262 cells.
a, Gene set enrichment analysis and EMT enrichment score of the indicated cell lines. Gene expression was normalised to UOK262pFH. b, c, mRNA expression measured by qPCR (b) and protein levels measured by western blot (c) of the indicated EMT markers. d, Immunofluorescence staining for Vimentin and E-Cadherin. DAPI was used as marker for cell nuclei. Scale Bar = 25 µm. e, Cell migration rate. Results were obtained from 14 replicate wells and presented as mean ± S.D.. f, mRNA expression of EMT-related transcription factors ZEB1 and ZEB2 from RNA-seq data as in Fig. 1a. g, Expression levels of the indicated miRNAs measured by qPCR. h, Volcano plot of miRNA profiling. All qPCR experiments were obtained from 3 independent experiments and presented as RQ with max values, normalised to β-actin or RNU6B/SNORD61 as endogenous control for mRNA and miRNA analyses, respectively. *P ≤0.05, **P ≤0.01, ***P ≤0.001, ****P≤0.0001. Western blot sources are presented in Supplementary Figure 1. Raw data are presented in SI Table 2.
Extended Data Figure 4. EMT features in Fh1-deficient cells are independent from HIF.
mRNA levels of EMT genes (a) and HIF target genes (b) in Fh1-/- cells infected with shRNA against HIF1β measured by qPCR. Results were obtained from 3 independent cultures and presented as RQ with max values using β-actin as endogenous control. NTC = non-targeting control. p-values from unpaired t-test are indicated in the graph. LdhA = lactate dehydrogenase A; Pdk1 = pyruvate dehydrogenase kinase 1; Glut 1 = glucose transporter 1. *P ≤0.05, **P ≤0.01, ***P ≤0.001, ****P≤0.0001. Raw data are presented in SI Table 2.
Extended Data Figure 5. EMT signature in Fh1-reconstituted cells.
a, Fh1 protein levels measured by western blot. Calnexin was used as loading control. b, Intracellular fumarate levels the measured by LCMS. Data are presented as average ± S.D.. c, Representative bright field images of cells of the indicated genotype. Scale Bar = 400 µm. d, e, mRNA expression measured by qPCR (d) and protein levels measured by western blot (e) of the indicated EMT markers. f, Average speed of cells calculated after tracking cells for 3 hours as in Fig. 1g. Results were generated from 3 independent cultures. g, mRNA expression of EMT-related transcription factors. β-actin was used as endogenous control. EV = empty vector. h, Expression levels of the indicated miRNAs measured by qPCR and normalised to Snord95 and Snord61 as endogenous control. All qPCR results were obtained from 3 independent cultures and presented as RQ with max values. *P ≤0.05, **P ≤0.01, ***P ≤0.001, ****P≤0.0001. Western blot sources are presented in Supplementary Figure 1. Raw data are presented in SI Table 2.
Extended Data Fig. 6. Role of Tets and Histone Demethylases in EMT induction.
a, Expression levels of Tet1-3 in Fh1 fl/fl from RNA-seq data. b, d, Expression levels of Tet2/3 (b), miRNA200 (c), and E-cadherin (d) in Fh1 fl/fl cells upon combined silencing of Tet2 and Tet3. The results are presented as RQ with max values obtained from technical replicates. β-actin and Snord61 were used as endogenous control for mRNA and miRNA, respectively. e, Expression levels of the indicated miRNAs upon inhibition of histone demethylases by GSK J4. Snord61 and Snord95 were used as endogenous controls. f, Expression of the indicated miRNAs in Fh1-/- cells incubated for 24 hours with 5 mM DM-aKG measured by qPCR. Results were obtained from 4 (vehicle) or 5 (Fh1-/-CL19) and 3 (Fh1-/-CL1) (DM-aKG) independent cultures and presented as RQ with max values, normalised to Snord95 as endogenous control. *P ≤0.05, **P ≤0.01, ***P ≤0.001, ****P≤0.0001.
Extended Data Fig. 7. Characterisation of the regulatory CpG island CpG43.
a, Snapshot of Genome Browser view of genomic DNA around the miR200ba429 cluster taken from NCBI37/mm9. Tet2 ChIP was obtained from GSE41720, sample GSM1023124. Shaded rectangles indicate miR-200ba429 and CpG43. b, ChIP-PCR of the indicated histone marks in a region adjacent CpG43. Data were obtained from 3 independent cultures and are presented as average ± S.D.. p-values from unpaired t-tests are indicated in the graph. c, Expression levels of H3 histone marks in cells of the indicated genotypes measured by western blot. H3 used as loading control. d, 3C data of the genomic region adjacent to CpG43 analysed in Fh1fl/fl cells. The position of CpG30 and CpG43, and of the predicted restriction sites are indicated in the graph. Results were generated from 2 independent cultures. e, DNA methylation of the CpG43 assessed by qPCR using OneStep qMethyl kit. Data were obtained from 3 independent experiments and normalised to methylation levels of the region in Fh1fl/fl. Data are presented as average ± S.E.M.. f, ChIP-PCR of Tets binding to CpG43. Data were obtained from three replicates and are presented as average ± S.D.. g, 5hmc nuclear staining assessed by immunofluorescence using 5hmc antibody. Nuclear staining was quantified using Image J and an average of 120 cells was used per genotype. p-values from One-way ANOVA test. Representative images of 5hmc staining are shown. DAPI is used to indicate the nuclei. Bar = 20 μm. *P ≤0.05, **P ≤0.01, ***P ≤0.001, ****P≤0.0001. Western blot sources are presented in Supplementary Figure 1. Raw data are presented in SI Table 2.
Extended Data Fig. 8. Monomethyl Fumarate (MMF) triggers EMT in FH-proficient cells.
a, Bright field images of cells treated for 6 weeks with MMF. Arrows indicate the typical protrusion of cells of mesenchymal phenotype. Bar = 400 µm. b, Oxygen consumption rate of the indicated cell lines treated chronically with MMF (as in Fig. 3). See Methods for drugs concentrations. OCR was normalised to total protein content. Results were obtained from 6 (for mouse cells) or 8 (for human cells) wells ± SD.. c, Hive plot of metabolomics data of mouse and human cells treated with MMF (as in Fig. 3). All identified metabolites are included on the y-axis and grouped into human (pink) and mouse (green) cells. Metabolites accumulated (right x-axis) or depleted (left x-axis) in MMF-treated cells versus control are indicated by a connecting arc and their fold-change is colour-coded. Metabolites accumulated commonly across the two cell lines are highlighted with a solid line. 2SC: 2-succinic-cysteine, succGSH: succinic-GSH. Raw data are presented in SI Table 2. Raw metabolomic data are presented in SI Table 3.
Extended Data Fig. 9. Succinate triggers EMT in Sdhb-deficient cells.
a, Intracellular succinate levels after incubation with 4 mM MMS measured by LCMS. Data are presented as average ±S.D.. b, c, Intracellular succinate (b) and succGSH (c) levels in Sdhb-deficient cells measured by LMCS. Data are presented as average ±S.D.. d, Bright field images of cells of the indicated genotype. Bar = 400 µm. e, Gene set enrichment analysis and EMT enrichment score from expression analysis of the indicated cell lines. f, g, miRNA expression levels normalised to Snord61 and Snord95 as endogenous control (f) and CpG43 methylation (g). Experiments were performed as in Fig. 2b and 2d, respectively. *P ≤0.05, **P ≤0.01, ***P ≤0.001, ****P≤0.0001. Gel sources are presented in Supplementary Figure 1. Raw data are presented in SI Table 2.
Extended Data Fig. 10. Expression of FH and EMT markers in kidney cancer.
a, Expression levels of Vimentin and E-Cadherin in HLRCC patients obtained from Ooi et al25. b, Immunohistochemistry staining of Vimentin and E-Cadherin (left), and TET1 and TET2 (right) in HLRCC patients obtained as in Fig. 4a. Bar = 100 µm. The insert in the left panel indicate a 3X digital magnification, Bar = 50 µm. c, Gene set enrichment analysis and EMT enrichment score from RNA-seq data of papillary renal cell carcinoma (KIRP) obtained by Linehan et al26. d, Volcano plot of MIRNA expression in KIRP. e, Kaplan-Meier curve of KIRP patients separated according to FH expression. f, Vimentin and E-Cadherin expression in FH-mutant KIRP compared to normal renal tissue. g, Frequency of mutations in FH and TET1, TET2 and TET3 in KIRP analysed using NCBO BioPortal. Only cancers with mutations in the indicated genes are shown. h, Kaplan-Meier curve of FH-wild type and FH-mutant KIRP. i, Expression levels of FH, Vimentin, and E-Cadherin in clear cell renal cell carcinoma (KIRC) obtained from TCGA dataset27. j, Volcano plot of miRNA expression in KIRC. j, Kaplan-Meier curve of KIRC patients separated according to FH expression.
Supplementary Material
Supplementary Information is available in the online version of the paper.
Acknowledgements
This work was supported by the Medical Research Council (UK). SF was supported by Herchel Smith Research Studentship, KF by a MRC Career Development Award. We thank UOB Tumor Cell Line Repository and Dr. W. Linehan, National Cancer Institute, Bethesda, MD, USA for UOK262 cell lines. We thank Emily Clemente and the staff at the Head of Cambridge Genomic Services for miRNA profiling, the CRUK Cambridge Institute Genomics, especially Dr. James Hadfield, and the CRUK Cambridge Institute BioInformatics, especially Dr. Chandra Sekhar Reddy Chilamakuri, Core Facilities for RNA-seq sample processing and analysis. We also wish to thank Dr. Carla Martins and Dr. Andrea Rasola for critical reading of the manuscript.
Footnotes
Author Contributions M.S. and C.F. conceived the study. M.S. performed and analysed all the experiments on cell lines with the help of A.V.D.; S.A.; and S.J.T.; and prepared the figures. E.Go. performed the bioinformatics analyses with the supervision on J.S-R.. I.T.J. helped M.S. with the invasion assays and generation of constructs for miRNA and Fh1-GFP expression. V.Z. performed and analysed ChIP-PCR assays. A.S.C. performed and analysed all the metabolomics analyses with the help of E.G.. M.T. performed the work on human samples with input from P.H.M. A.W.; V.G.; P.H.M.; and E.M. provided the HLRCC samples. V.R and P.C. performed the proteomics analyses. H.Y. and B.H. supervised and performed the 3C experiments. S.C. and E.G provided Sdhb-deficient cells and generated the gene expression profile of these cells. S.F. and K.F. performed cell motility assays. C.F. directed the research, prepared the figures and wrote the paper, with assistance from all other authors.
Author Information Reprints and permissions information is available at www.nature.com/reprints. RNA-seq data are deposited at Gene Expression Omnibus (http://www.ncbi.nlm.nih.gov/geo/, accession number GSE77542) and gene expression data of Sdhb-deficient cells are deposited at Array Express (www.ebi.ac.uk/arrayexpress, accession number A-AFFY-130).
The authors declare no competing financial interests.
References
- 1.Tomlinson IP, Alam NA, Rowan AJ, Barclay E, Jaeger EE, Kelsell D, Leigh I, Gorman P, Lamlum H, Rahman S, et al. Germline mutations in FH predispose to dominantly inherited uterine fibroids, skin leiomyomata and papillary renal cell cancer. Nat Genet. 2002;30:406–410. doi: 10.1038/ng849. [DOI] [PubMed] [Google Scholar]
- 2.Schmidt LS, Linehan WM. Hereditary leiomyomatosis and renal cell carcinoma. Int J Nephrol Renovasc Dis. 2014;7:253–260. doi: 10.2147/IJNRD.S42097. [DOI] [PMC free article] [PubMed] [Google Scholar]
- 3.Yang M, Soga T, Pollard PJ, Adam J. The emerging role of fumarate as an oncometabolite. Front Oncol. 2012;2:85. doi: 10.3389/fonc.2012.00085. [DOI] [PMC free article] [PubMed] [Google Scholar]
- 4.Laukka T, Mariani CJ, Ihantola T, Cao JZ, Hokkanen J, Kaelin WG, Jr, Godley LA, Koivunen P. Fumarate and Succinate Regulate Expression of Hypoxia-Inducible Genes via TET Enzymes. J Biol Chem. 2015 doi: 10.1074/jbc.M115.688762. [DOI] [PMC free article] [PubMed] [Google Scholar]
- 5.Xiao M, Yang H, Xu W, Ma S, Lin H, Zhu H, Liu L, Liu Y, Yang C, Xu Y, et al. Inhibition of alpha-KG-dependent histone and DNA demethylases by fumarate and succinate that are accumulated in mutations of FH and SDH tumor suppressors. Genes Dev. 2012;26:1326–1338. doi: 10.1101/gad.191056.112. [DOI] [PMC free article] [PubMed] [Google Scholar]
- 6.Craene BD, Berx G. Regulatory networks defining EMT during cancer initiation and progression. Nat Rev Cancer. 2013;13:97–110. doi: 10.1038/nrc3447. [DOI] [PubMed] [Google Scholar]
- 7.Frezza C, Zheng L, Folger O, Rajagopalan KN, MacKenzie ED, Jerby L, Micaroni M, Chaneton B, Adam J, Hedley A, et al. Haem oxygenase is synthetically lethal with the tumour suppressor fumarate hydratase. Nature. 2011;477:225–228. doi: 10.1038/nature10363. [DOI] [PubMed] [Google Scholar]
- 8.Subramanian A, Tamayo P, Mootha VK, Mukherjee S, Ebert BL, Gillette MA, Paulovich A, Pomeroy SL, Golub TR, Lander ES, et al. Gene set enrichment analysis: a knowledge-based approach for interpreting genome-wide expression profiles. Proc Natl Acad Sci U S A. 2005;102:15545–15550. doi: 10.1073/pnas.0506580102. [DOI] [PMC free article] [PubMed] [Google Scholar]
- 9.Puisieux A, Brabletz T, Caramel J. Oncogenic roles of EMT-inducing transcription factors. Nat Cell Biol. 2014;16:488–494. doi: 10.1038/ncb2976. [DOI] [PubMed] [Google Scholar]
- 10.Yang M-H, Wu M-Z, Chiou S-H, Chen P-M, Chang S-Y, Liu C-J, Teng S-C, Wu K-J. Direct regulation of TWIST by HIF-1[alpha] promotes metastasis. Nat Cell Biol. 2008;10:295–305. doi: 10.1038/ncb1691. [DOI] [PubMed] [Google Scholar]
- 11.Isaacs JS, Jung YJ, Mole DR, Lee S, Torres-Cabala C, Chung YL, Merino M, Trepel J, Zbar B, Toro J, et al. HIF overexpression correlates with biallelic loss of fumarate hydratase in renal cancer: novel role of fumarate in regulation of HIF stability. Cancer Cell. 2005;8:143–153. doi: 10.1016/j.ccr.2005.06.017. [DOI] [PubMed] [Google Scholar]
- 12.Bertout JA, Patel SA, Simon MC. The impact of O2 availability on human cancer. Nat Rev Cancer. 2008;8:967–975. doi: 10.1038/nrc2540. [DOI] [PMC free article] [PubMed] [Google Scholar]
- 13.Davalos V, Moutinho C, Villanueva A, Boque R, Silva P, Carneiro F, Esteller M. Dynamic epigenetic regulation of the microRNA-200 family mediates epithelial and mesenchymal transitions in human tumorigenesis. Oncogene. 2012;31:2062–2074. doi: 10.1038/onc.2011.383. [DOI] [PMC free article] [PubMed] [Google Scholar]
- 14.Song SJ, Poliseno L, Song MS, Ala U, Webster K, Ng C, Beringer G, Brikbak NJ, Yuan X, Cantley LC, et al. MicroRNA-antagonism regulates breast cancer stemness and metastasis via TET-family-dependent chromatin remodeling. Cell. 2013;154:311–324. doi: 10.1016/j.cell.2013.06.026. [DOI] [PMC free article] [PubMed] [Google Scholar]
- 15.Hu X, Zhang L, Mao S-Q, Li Z, Chen J, Zhang R-R, Wu H-P, Gao J, Guo F, Liu W, et al. Tet and TDG Mediate DNA Demethylation Essential for Mesenchymal-to-Epithelial Transition in Somatic Cell Reprogramming. Cell Stem Cell. 2014;14:512–522. doi: 10.1016/j.stem.2014.01.001. [DOI] [PubMed] [Google Scholar]
- 16.Heinemann B, Nielsen JM, Hudlebusch HR, Lees MJ, Larsen DV, Boesen T, Labelle M, Gerlach L-O, Birk P, Helin K. Inhibition of demethylases by GSK-J1/J4. Nature. 2014;514:E1–E2. doi: 10.1038/nature13688. [DOI] [PubMed] [Google Scholar]
- 17.Karolchik D, Barber GP, Casper J, Clawson H, Cline MS, Diekhans M, Dreszer TR, Fujita PA, Guruvadoo L, Haeussler M, et al. The UCSC Genome Browser database: 2014 update. Nucleic Acids Research. 2014;42:D764–D770. doi: 10.1093/nar/gkt1168. [DOI] [PMC free article] [PubMed] [Google Scholar]
- 18.Hagege H, Klous P, Braem C, Splinter E, Dekker J, Cathala G, de Laat W, Forne T. Quantitative analysis of chromosome conformation capture assays (3C-qPCR) Nature protocols. 2007;2:1722–1733. doi: 10.1038/nprot.2007.243. [DOI] [PubMed] [Google Scholar]
- 19.MacKenzie ED, Selak MA, Tennant DA, Payne LJ, Crosby S, Frederiksen CM, Watson DG, Gottlieb E. Cell-permeating alpha-ketoglutarate derivatives alleviate pseudohypoxia in succinate dehydrogenase-deficient cells. Mol Cell Biol. 2007;27:3282–3289. doi: 10.1128/MCB.01927-06. [DOI] [PMC free article] [PubMed] [Google Scholar]
- 20.Zheng L, Cardaci S, Jerby L, MacKenzie ED, Sciacovelli M, Johnson TI, Gaude E, King A, Leach JD, Edrada-Ebel R, et al. Fumarate induces redox-dependent senescence by modifying glutathione metabolism. Nat Commun. 2015;6:6001. doi: 10.1038/ncomms7001. [DOI] [PMC free article] [PubMed] [Google Scholar]
- 21.Sullivan LB, Martinez-Garcia E, Nguyen H, Mullen AR, Dufour E, Sudarshan S, Licht JD, Deberardinis RJ, Chandel NS. The proto-oncometabolite fumarate binds glutathione to amplify ROS-dependent signaling. Mol Cell. 2013;51:236–248. doi: 10.1016/j.molcel.2013.05.003. [DOI] [PMC free article] [PubMed] [Google Scholar]
- 22.Buchmaier BS, Bibi A, Müller GA, Dihazi GH, Eltoweissy M, Kruegel J, Dihazi H. Renal Cells Express Different Forms of Vimentin: The Independent Expression Alteration of these Forms is Important in Cell Resistance to Osmotic Stress and Apoptosis. PLoS One. 2013;8:e68301. doi: 10.1371/journal.pone.0068301. [DOI] [PMC free article] [PubMed] [Google Scholar]
- 23.Cardaci S, Zheng L, MacKay G, van den Broek NJ, MacKenzie ED, Nixon C, Stevenson D, Tumanov S, Bulusu V, Kamphorst JJ, et al. Pyruvate carboxylation enables growth of SDH-deficient cells by supporting aspartate biosynthesis. Nat Cell Biol. 2015;17:1317–1326. doi: 10.1038/ncb3233. [DOI] [PMC free article] [PubMed] [Google Scholar]
- 24.Letouze E, Martinelli C, Loriot C, Burnichon N, Abermil N, Ottolenghi C, Janin M, Menara M, Nguyen AT, Benit P, et al. SDH mutations establish a hypermethylator phenotype in paraganglioma. Cancer Cell. 2013;23:739–752. doi: 10.1016/j.ccr.2013.04.018. [DOI] [PubMed] [Google Scholar]
- 25.Ooi A, Wong JC, Petillo D, Roossien D, Perrier-Trudova V, Whitten D, Min BW, Tan MH, Zhang Z, Yang XJ, et al. An antioxidant response phenotype shared between hereditary and sporadic type 2 papillary renal cell carcinoma. Cancer Cell. 2011;20:511–523. doi: 10.1016/j.ccr.2011.08.024. [DOI] [PubMed] [Google Scholar]
- 26.Linehan WM, Spellman PT, Ricketts CJ, Creighton CJ, Fei SS, Davis C, Wheeler DA, Murray BA, Schmidt L, Vocke CD, et al. Comprehensive Molecular Characterization of Papillary Renal-Cell Carcinoma. N Engl J Med. 2015 doi: 10.1056/NEJMoa1505917. [DOI] [PMC free article] [PubMed] [Google Scholar]
- 27.The Cancer Genome Atlas Research, N. Comprehensive molecular characterization of clear cell renal cell carcinoma. Nature. 2013;499:43–49. doi: 10.1038/nature12222. [DOI] [PMC free article] [PubMed] [Google Scholar]
- 28.Fang Y, Wei J, Cao J, Zhao H, Liao B, Qiu S, Wang D, Luo J, Chen W. Protein Expression of ZEB2 in Renal Cell Carcinoma and Its Prognostic Significance in Patient Survival. PLoS One. 2013;8:e62558. doi: 10.1371/journal.pone.0062558. [DOI] [PMC free article] [PubMed] [Google Scholar]
- 29.Fieuw A, Kumps C, Schramm A, Pattyn F, Menten B, Antonacci F, Sudmant P, Schulte JH, Van Roy N, Vergult S, et al. Identification of a novel recurrent 1q42.2-1qter deletion in high risk MYCN single copy 11q deleted neuroblastomas. International Journal of Cancer. 2012;130:2599–2606. doi: 10.1002/ijc.26317. [DOI] [PubMed] [Google Scholar]
- 30.Ashrafian H, O'Flaherty L, Adam J, Steeples V, Chung YL, East P, Vanharanta S, Lehtonen H, Nye E, Hatipoglu E, et al. Expression profiling in progressive stages of fumarate-hydratase deficiency: the contribution of metabolic changes to tumorigenesis. Cancer Res. 2010;70:9153–9165. doi: 10.1158/0008-5472.CAN-10-1949. [DOI] [PubMed] [Google Scholar]
- 31.Li LC, Dahiya R. MethPrimer: designing primers for methylation PCRs. Bioinformatics. 2002;18:1427–1431. doi: 10.1093/bioinformatics/18.11.1427. [DOI] [PubMed] [Google Scholar]
- 32.Piccinini F, Kiss A, Horvath P. CellTracker (not only) for dummies. Bioinformatics. 2015 doi: 10.1093/bioinformatics/btv686. [DOI] [PubMed] [Google Scholar]
- 33.Schmidt D, Wilson MD, Spyrou C, Brown GD, Hadfield J, Odom DT. ChIP-seq: using high-throughput sequencing to discover protein-DNA interactions. Methods. 2009;48:240–248. doi: 10.1016/j.ymeth.2009.03.001. [DOI] [PMC free article] [PubMed] [Google Scholar]
- 34.Rajeeve V, Vendrell I, Wilkes E, Torbett N, Cutillas PR. Cross-species proteomics reveals specific modulation of signaling in cancer and stromal cells by phosphoinositide 3-kinase (PI3K) inhibitors. Mol Cell Proteomics. 2014;13:1457–1470. doi: 10.1074/mcp.M113.035204. [DOI] [PMC free article] [PubMed] [Google Scholar]
- 35.Casado P, Rodriguez-Prados JC, Cosulich SC, Guichard S, Vanhaesebroeck B, Joel S, Cutillas PR. Kinase-substrate enrichment analysis provides insights into the heterogeneity of signaling pathway activation in leukemia cells. Sci Signal. 2013;6 doi: 10.1126/scisignal.2003573. [DOI] [PubMed] [Google Scholar]
- 36.Casado P, Cutillas PR. A self-validating quantitative mass spectrometry method for assessing the accuracy of high-content phosphoproteomic experiments. Mol Cell Proteomics. 2011;10 doi: 10.1074/mcp.M110.003079. M110 003079. [DOI] [PMC free article] [PubMed] [Google Scholar]
- 37.Cutillas PR, Vanhaesebroeck B. Quantitative profile of five murine core proteomes using label-free functional proteomics. Mol Cell Proteomics. 2007;6:1560–1573. doi: 10.1074/mcp.M700037-MCP200. [DOI] [PubMed] [Google Scholar]
- 38.Ritchie ME, Phipson B, Wu D, Hu Y, Law CW, Shi W, Smyth GK. limma powers differential expression analyses for RNA-sequencing and microarray studies. Nucleic Acids Res. 2015 doi: 10.1093/nar/gkv007. [DOI] [PMC free article] [PubMed] [Google Scholar]
- 39.Taube JH, Herschkowitz JI, Komurov K, Zhou AY, Gupta S, Yang J, Hartwell K, Onder TT, Gupta PB, Evans KW, et al. Core epithelial-to-mesenchymal transition interactome gene-expression signature is associated with claudin-low and metaplastic breast cancer subtypes. Proc Natl Acad Sci U S A. 2010;107:15449–15454. doi: 10.1073/pnas.1004900107. [DOI] [PMC free article] [PubMed] [Google Scholar]
- 40.Law CW, Chen Y, Shi W, Smyth GK. voom: Precision weights unlock linear model analysis tools for RNA-seq read counts. Genome Biol. 2014;15:R29. doi: 10.1186/gb-2014-15-2-r29. [DOI] [PMC free article] [PubMed] [Google Scholar]
Associated Data
This section collects any data citations, data availability statements, or supplementary materials included in this article.


