Abstract
Three-dimensional substrates with high surface-to-volume ratios and subsequently large protein binding capacities are of interest for advanced immunosorbent assays utilizing integrated microfluidics and nanosensing elements. A library of bioactive and antifouling electrospun nanofiber substrates, which are composed of high-molecular-weight poly(oxanorbornene) derivatives, is described. Specifically, a set of copolymers are synthesized from three 7-oxanorbornene monomers to create a set of water insoluble copolymers with both biotin (bioactive) and triethylene glycol (TEG) (antifouling) functionality. Porous three-dimensional nanofiber meshes are electrospun from these copolymers with the ability to specifically bind streptavidin while minimizing the nonspecific binding of other proteins. Fluorescently labeled streptavidin is used to quantify the streptavidin binding capacity of each mesh type through confocal microscopy. A simplified enzyme-linked immunosorbent assay (ELISA) is presented to assess the protein binding capabilities and detection limits of these nanofiber meshes under both static conditions (26 h) and flow conditions (1 h) for a model target protein (i.e., mouse IgG) using a horseradish peroxidase (HRP) colorimetric assay. Bioactive and antifouling nanofiber meshes outperform traditional streptavidin-coated polystyrene plates under flow, validating their use in future advanced immunosorbent assays and their compatibility with microfluidic-based biosensors.
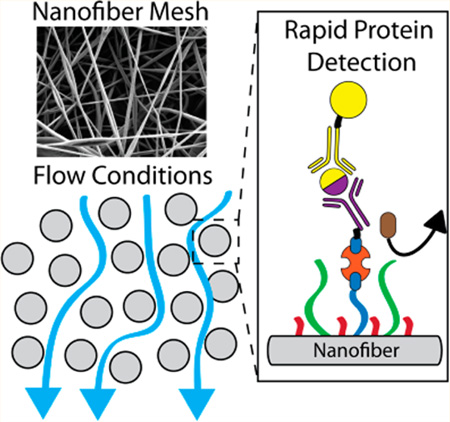
Graphical Abstract
Polymers play a key role in many molecular diagnostic and biosensor device configurations, and today, sensing an environmental or medical analyte of interest represents a $12 billion global industry.1–6 Traditional materials such as polystyrene plates are widely used to capture target molecules onto a surface for detection through a variety of methods including enzyme-linked immunosorbent assays (ELISAs), fluorescence-based techniques, or electrochemical readouts.7 Although these polymeric surfaces are widely used and successful, future advances must coincide with the reduction in the overall sample volume, the incorporation of nanoscale sensing elements, the enhancement of the capture efficiency of these surfaces, and the integration of these surfaces into platforms that enable facile sample preparation and measurement. For example, methods that produce nanofibers, nanowires, and nanoparticles capitalize on the large surface-to-volume ratios to enhance the sensitivity of various bioassays by increasing the number of available target binding sites.3,8–10 However, nontrivial limitations are often encountered, including ease of handling, mechanical integrity, and integration with nanosensing elements, such as a solid-state nanopore sensor.3,11,12 Recently, we reported the assembly of a nanofiber mesh layer atop a silicon nitride nanopore for regulating the translocation speed of DNA through the nanopore and for discriminating between DNA of different molecular weights.11 These results illustrated that the nanofiber mesh can be engineered to enhance the sensing capabilities of the nanopore, without blocking it or directly modifying its interior surfaces. Therefore, these results provide the impetus for further study of more sophisticated nanofiber mesh coatings prepared using an electrospinning technique and specifically, for designing nanofiber mesh coatings that possess functional groups for molecular recognition, thus expanding the potential bioassay capability of nanopores.
Electrospinning is a highly flexible technique to fabricate nonwoven porous polymeric nanofiber meshes with high surface-to-volume ratios from a variety of different polymer types.2,3,13 This technique involves the use of a syringe pump to continuously flow a viscous polymer solution through a spinneret that is charged with a high voltage (typically >5 kV). High-molecular-weight polymers are often needed to provide sufficient chain entanglement for this process to form fibers rather than nano- or microparticles.14,15 Therefore, synthetic procedures that give high-molecular-weight polymers and that are tolerant to the use of monomers possessing different functional groups are of significant interest. Moreover, this technique can be used to coat sensitive biosensors, such as nanopores, in an orthogonal fashion providing an additional dimension to biosensor development as the nanofiber mesh does not alter the chemical or physical properties of the nanopore (hence having minimal or no impact on its sensing ability) but does imbibe additional functionality to the biosensor.
With regard to the use of a nanofiber mesh in a bioassay—such as enzyme-linked immunosorbent assay (ELISA) or protein purification—there are several notable reports. Systems relying on nonspecific protein adsorption to polycarbonate electrospun mats or doping of biotin or enzymes within polylactic acid, porous silica, or polyvinylpyrrolidone fibers exhibit improvements over traditional polystyrene surfaces.16–19 However, systems relying on covalent or strong noncovalent linkages (e.g., biotin and avidin or streptavidin; Kd ≈ 10−14 to 10−15 M)20,21 are more robust and, in general, outperform their weaker noncovalent counterparts.22,23 For example Senecal et al. covalently coupled avidin to a prefabricated polyamine and polyurethane copolymer electrospun mesh as well as a carboxylated polyvinyl chloride electrospun mesh to detect SEB toxins using a modified sandwich ELISA detecting down to ~1 ng/mL through a postelectrospinning modification.24 Lu et al. covalently coupled biotin to the polymer backbone at the monomer level through a biotin modified lysine monomer in a PEG–PLA-PLL copolymer prior to electrospinning to create covalently bound biotinylated meshes for protein immobilization applications. These meshes possessed a high streptavidin binding capacity and could subsequently immobilize ~500 ug of biotinylated antibody and ~250 ug of antigen per gram of mesh.22
From a design perspective, tunable properties at the monomer level are attractive when coupled with a versatile polymerization strategy, such as ring opening metathesis polymerization (ROMP) using Grubbs catalysts and a chemically diverse library of cyclic olefins.25 Due to advances in living ROMP catalysts, many different oxanorbornene monomers can be polymerized or copolymerized to afford poly-(oxanorbornene)s (PONB)s with differing pendent functional groups and block architectures.25,26 For example Zoha et al. reported a series of block copolymers compatible with acetylene click chemistry (<100 kDa) and Sankaran et al. created polymeric micelles from triblock copolymers containing oligoethylene glycol, biotin, and electrochemiluminescent moieties. Wathier et al. explored the synthesis and use of ROMP polymerized polyanionic PONB polymers with extremely high molecular weights (2500 to 3700 kg/mol) and low PDIs (1.2–1.4) as lubricants when dissolved in aqueous solutions.27,28 As these results highlight, ROMP enables access to polymers of controlled molecular weights with low polydispersity indices and of differing architecture (e.g., block copolymers), while being tolerant to a wide range of monomer types.25,29–31 Although many poly(oxanorbornene)s are described in the literature, few are of high molecular weight (>200 kg/mol),27,28,32 and to the best of our knowledge, none have been used to produce electrospun nanofiber meshes.
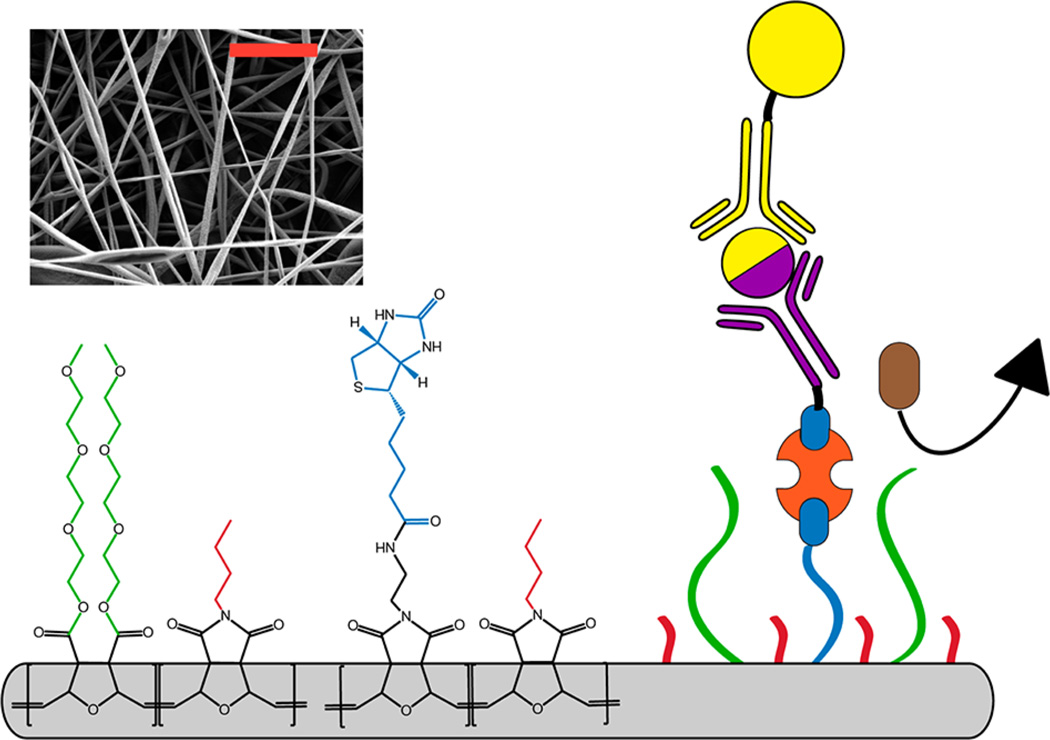
As a first step toward an integrated nanofiber mesh coated biosensor (nanopore, nanowire, etc.), it is critical that we identify a family of polymers for fabricating bioactive and antifouling nanofiber meshes, and demonstrate the performance of these coatings in a bioassay, such as an ELISA (Figure 1). Herein, we describe the following: (1) the synthesis of a family of large molecular weight poly(oxanorbornene) copolymers from three monomers: one possessing a butyl side chain, a second possessing a biotin functionality, and a third possessing triethylene glycol side chains; (2) the characterization of the resulting meshes; (3) the optimization of the electrospining parameters; and (4) the performance of the resulting nanofiber mesh in an ELISA assay under static and flow conditions.
Figure 1.
Schematic diagram of a tunable nanofiber mesh (NFM) composed of polymer blends of poly(oxanorbornene) derivatives with tailored properties for an enzyme-linked immunosorbent assay: (red) water insoluble butyl side chains; (blue) bioactive side chains via biotin (blue) to streptavidin (orange) to biotinylated antibody (purple) bridges enabling the detection of a target molecule (yellow/purple) using an enzyme-linked antibody (yellow) reporter; (green) antifouling side chains using triethylene glycol units to prevent nonspecific protein binding (brown). (Inset) Scanning electron microscopy image of a poly(oxanorbornene) nanofiber mesh. (scale bar = 5 µm).
EXPERIMENTAL SECTION
General Procedures and Methods
All chemicals were purchased from Sigma-Aldrich and used without further purification, unless otherwise noted. exo-7-Oxabicyclo[2.2.1]-hept-5-ene-2,3-dicarboxylic anhydride was purchased from Alfa Aesar. Solvents used during synthesis were dried and distilled under nitrogen atmosphere prior to use (Purification of Common Laboratory Chemicals, ISBN: 978-1-85617-567-8). All reactions were performed in water-free conditions under nitrogen. All NMR spectra were recorded on Varian Unity Plus 400 MHz and Varian Mercury 500 MHz spectrometers. Chemical shifts are reported as δ, parts per million, relative to the signal of residual CHCl3 in CDCl3 at 7.26 and 77.0 ppm. Data are presented as follows: multiplicity (s = singlet, d = doublet, t = triplet, q = quartet, m = multiplet, br = broad), coupling constant (J/Hz) and integration.
Characterization Methods
Methods for gel permeation chromatography (GPC), mass spectrometry, and differential scanning calorimetry (DSC) can be found in the Supporting Information.
Monomer and Polymer Synthesis
Detailed accounts of the synthesis of monomers M1, M2, and M2, intermediates I1 and I2, and polymers P1, P2, and P3 are described in detail in the Supporting Information
Electrospinning
A custom-built electrospinner was used to spin polymeric meshes using a high voltage source, rotating/translating grounded drum, and a syringe pump used to control the flow rate of the polymer solutions flowing through the charged needle tip. Voltages ranging from 0 to 20 kV were possible as well as tip to collector distances ranging from 0 to 24 cm. All electrospun meshes were produced at either 3 or 6 mL/h flow rates using 20 gauge blunt tipped needles. The remaining spinning parameters are outlined in the Supporting Information Table S2 for each polymer blend tested.
Confocal Microscopy
The surface available biotin content of each the electrospun meshes was quantified using different concentrations of fluorescein isothiocyanate labeled streptavidin (FITC-streptavidin) using a Leica DMI6000 B confocal microscope equipped with a Nipkow (CSU-X1) spinning disk (Yokogawa) and a Hamamatsu ImagEM EMCCD camera imaging through a 10× objective. The samples were excited using a Coherent Sapphire laser at 488 nm, and fluorescent images were captured using a Chroma ET bandpass 525/50 filter to capture the 529 nm wavelength emission from the FITC-streptavidin. An automated stage controlled via a μManager plugin for ImageJ (Version 1.45, NIH)33 was used to capture a montage of images and a custom Matlab script was used to create a single image of the entire mesh composed of many 10× images stitched together. ImageJ was used to manually segment each mesh as well as an internal blank space within each image to establish the average background fluorescence for each image.
Static Enzyme-Linked Immunosorbent Assay (ELISA)
A generic ELISA assay was performed on the electrospun mesh substrates and a streptavidin coated 96-well plate (Pierce, cat. no. 15125) through the sequential addition of the following solutions (each 100 µL): (1) 500 nM streptavidin (Sigma, S3762) (18 h); (2) 3.125 nM antimouse IgG from goat (abcam, ab6788) (2 h); (3) varying concentrations of mouse IgG (abcam, ab37355) ranging from 0 to 250 pM (0 to 32 ng/mL) (2 h); (4) 2 nM antimouse IgG functionalized with the enzyme horseradish peroxidase (HRP) (abcam, ab6789) (2 h); (5) a solution of 3,3′,5,5′-tetramethylbenzidine (TMB) (abcam, ab171522); and (6) a 450 nm stop solution for TMB substrates (abcam, ab171529). Between each step, the meshes were washed with 200 µL of 1× Tris-buffered saline solution containing 0.05% Tween-20. A blocking buffer consisting of phosphate-buffered saline (PBS) and 0.1% bovine serum albumin (BSA) was used as the solvent for each solution to minimize nonspecific binding events. After step 6, 175 µL of the colorimetric readout was placed into a 96 well plate and a Beckman Coulter AD 340 plate reader was used to measure the absorbance of each solution at 450 nm. The detection limit of each condition was defined as the lowest concentration that had a signal-to-noise ratio of 2 and was statistically different from the absorbance value at 0 pM for each mesh (Student’s t test). The signal-to-noise ratio (S/N) was calculated by generating a linear regression of each average absorbance value (n = 4) and dividing each point along the regression by the absorbance at 0 pM for each mesh.
ELISA under Flow
The same steps were performed as in the static ELISA except each binding event only lasted for 10 min instead of 18 h for the streptavidin binding event and 2 h for the antibody binding events. The streptavidin coated plates were placed on an orbital shaker during each step. The NFMs were placed into an Avanti Mini-Extruder (Avanti, cat. no. 610000), and each antibody-binding step was performed using the same order, concentration, and volume as in the static ELISA protocol, except the solution was pushed through the mesh back-and-forth at approximately 1 Hz for 10 min. The total assay time was approximately 1 h.
RESULTS AND DISCUSSION
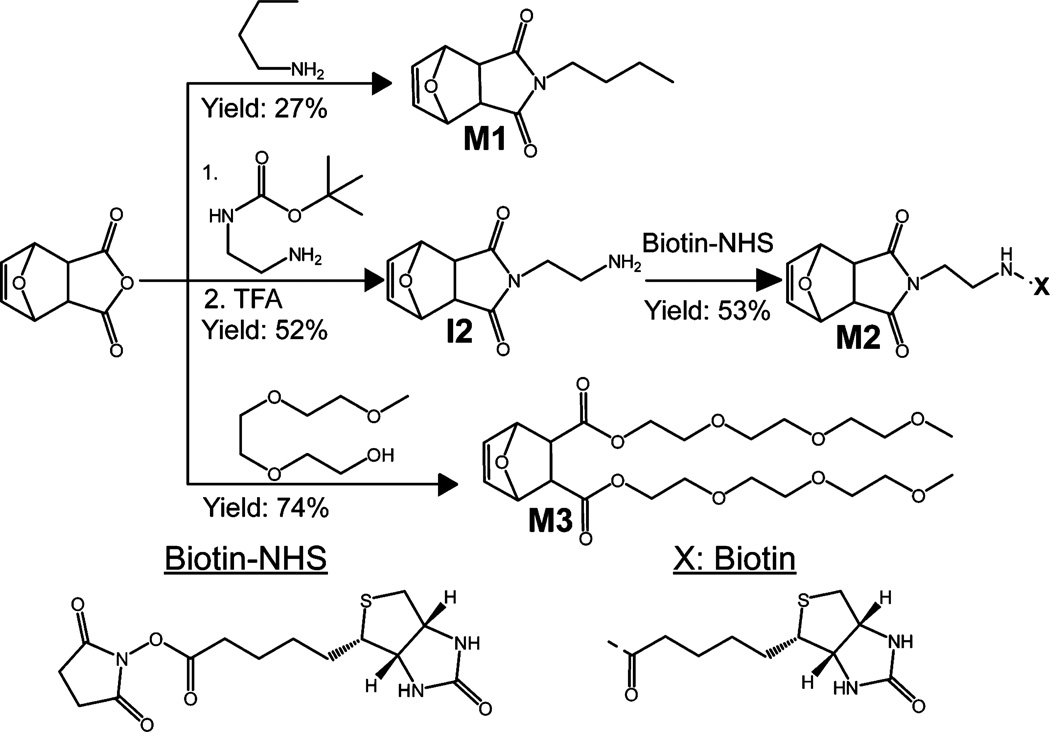
Advanced, orthogonally tunable biosensor coatings are important for expanding the functionality of devices like solid-state nanopores. For example, electrospun nanofiber meshes (NFMs) are ideal for coating atop sensitive biosensors as “smart filters” without altering the inherent properties of the sensor since they are porous and have a high surface-to-volume ratio.11 The interplay between mesh solubility, bioactivity, and antifouling properties are key to the success of NFMs as enhanced biosensor surfaces (Figure 1). As such, we propose polymeric NFMs designed from the monomer level to encompass these traits using three 7-oxanorbornene monomers: (1) a dicarboxiimide butyl (monomer 1 (M1)); (2) a dicarboxiimide biotin (monomer 2 (M2)); and (3) a dicarboxy triethylene glycol (monomer 3 (M3)) providing tunable hydrophobicity, bioactivity, and antifouling properties, respectively, when polymerized into a set of high-molecular-weight polymers and copolymers (Figure 2 and Figure 3).
Figure 2.
Synthesis of 7-oxanorbornene derivatives with hydrophobic (M1), bioactive (M2), and antifouling (M3) functionality (see Supporting Information for details).
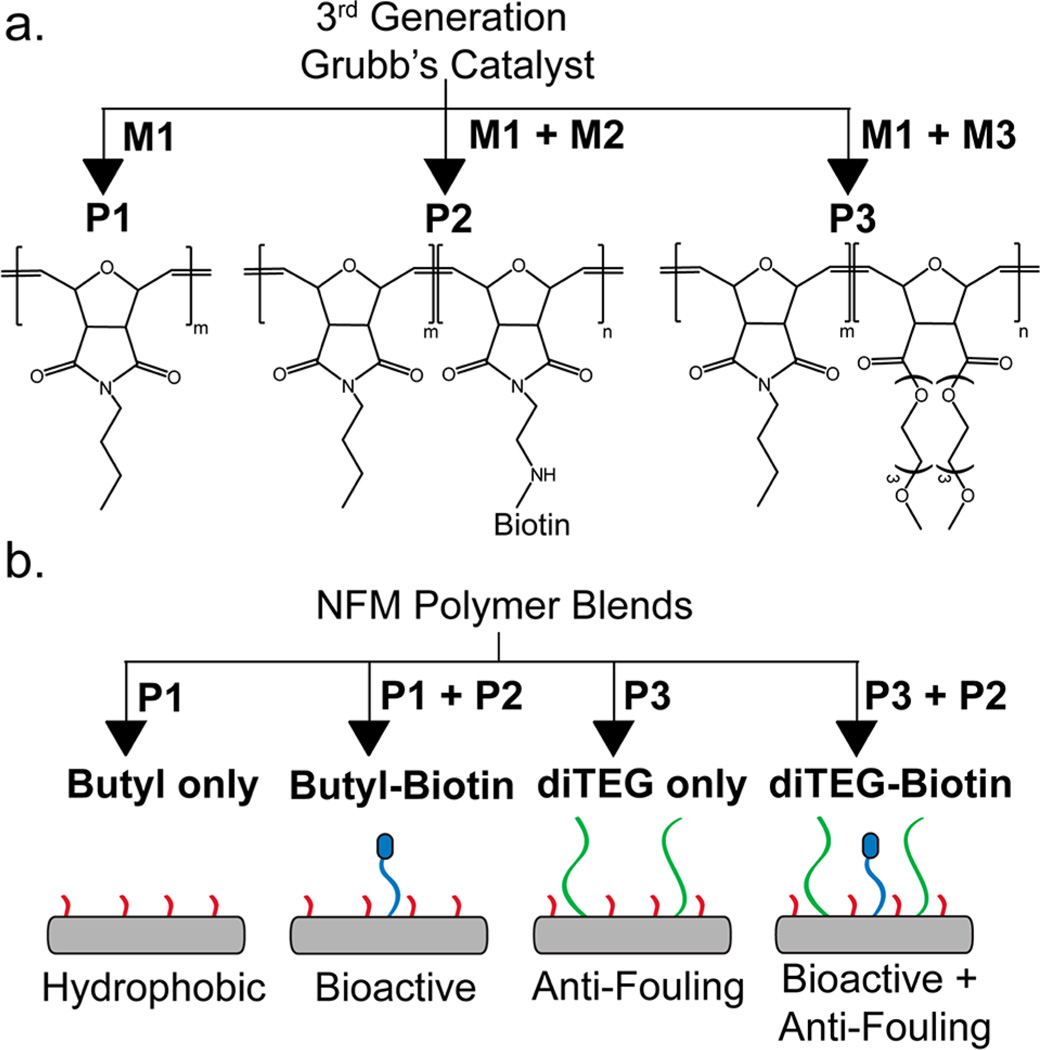
Figure 3.
(a) Polymer synthesis using a 3rd generation Grubbs catalyst and various combination of monomer M1, M2, and M3 to create polymers P1, P2, P3. P1 is composed entirely of M1, P2 has a bioactive biotin side chain and is composed of M1 and M2, and P3 has antifouling triethylene glycol side chains and is composed of M1 and M3. (b) Schematic diagram of electrospinning solutions for the Butyl only (P1), Butyl-Biotin (P1 + P2), diTEG only (P3), and diTEG-Biotin (P3 + P2) NFMs.
Each 7-oxanorbornene monomer was synthesized from 7-oxanorbornene dicarboxylic exoanhydride (Alfa Aesar). Monomers M1 and M3 were synthesized according to a previously published protocols.30,34 The synthetic route to M2 begins by adding a boc-protected ethylene diamine to the 7-oxanorbornene dicarboxylic anhydride starting material to afford intermediate 1 (I1), which was deprotected using trifluoroacetic acid (TFA) producing intermediate 2 (I2).35 The free amine of I2 was reacted with an NHS-functionalized biotin36 to give the biotinylated 7-oxanorbornene dicarboxiimide M2 (Figure 2). These three monomers provide the building blocks for high-molecular-weight copolymers with tunable hydrophobicity, bioactivity, and antifouling properties.
The fast initiation third generation Grubbs catalyst (Sigma, CAS: 900169-53-1) was used to perform a ring opening metathesis polymerization (ROMP) of the monomers into high-molecular-weight (~500 kg/mol), low-polydispersityindex (PDI < 1.5) polymers and copolymers (Figure 3a, Figure S17 and Figure S18).25,31 Polymer 1 (P1), polymerized from only M1, had a molecular weight of 735 kg/mol with a PDI of 1.16. On the basis of the ease of this initial polymerization, M1 was chosen to be the major component of the biotinylated copolymers due to its facile synthesis, high degree of polymerization, and water insolubility. In addition, only relatively small quantities of biotinylated monomer must be incorporated into the copolymer backbone to include an excess of biotin for bioassay applications where micro-, nano-, or picograms of biomolecules are being captured and detected. An 8:2 ratio of M1 and M2 was copolymerized to produce polymer 2 (P2) with a final monomer ratio of ~13:2 (25 mg biotin per gram of mesh) and a molecular weight of 598 kg/ mol with a PDI of 1.44. When the triethylene-glycol-containing monomer, monomer 3 (M3), was polymerized into a homopolymer it became insoluble in organic and aqueous solvents before the polymerization completed and formed organogels when placed in organic solvents. To correct for this solubility issue, a series of copolymer blends with M1 and M3 (i.e., polymer 3 (P3)) were polymerized with the following monomer ratios (M1: M3): 9:1, 8:2, 7:3, 1:1, and 3:7. The molecular weights, PDIs, monomer ratios, and GPC data as well as the effect of the M1:M3 monomer ratio on the water solubility are summarized in Figures S17 and S19 and Table S1. Each copolymer had a molecular weight range of ~500–1000 kg/mol with the exception of the 3:7 ratio which produced a bimodal distribution with molecular weights (Mn) of 1430 kg/mol and 680 kg/mol. Increasing the M3 content from 10 to 30% resulted in increasing swelling. At 50% M3 content, the polymer dissolved within 2 h (Figure S19).
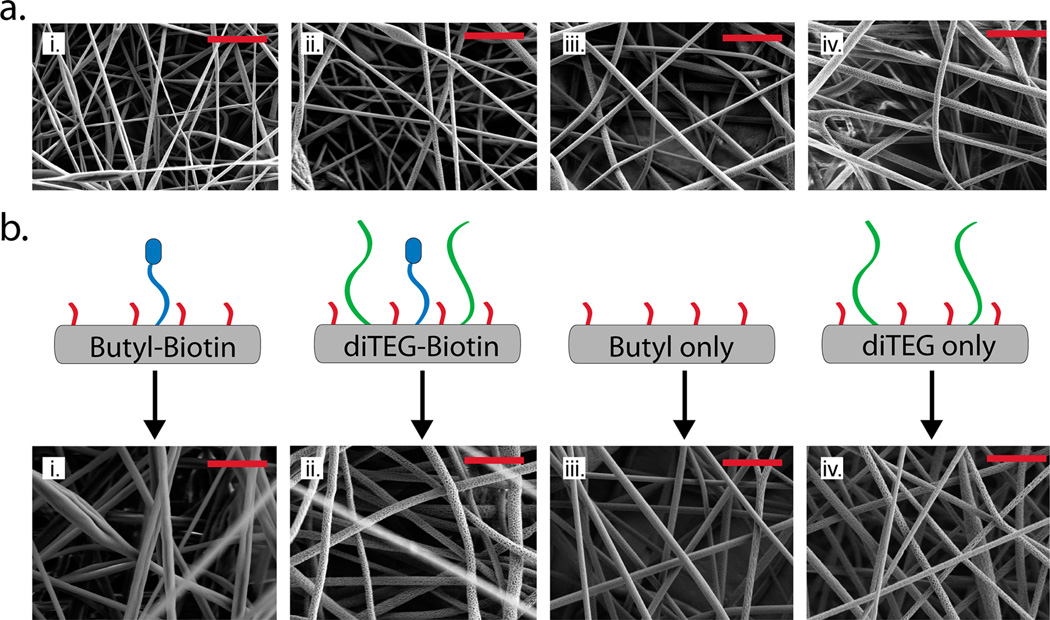
After synthesizing the high-molecular-weight polymers, a library of electrospun meshes were generated using P1 alone (Butyl only NFMs) to identify the key electrospinning parameters (voltage, working distance, polymer concentration, solvent system, or flow rate) to control fiber diameter (Figure 3b). Figure 4a illustrates a subset of this library demonstrating the effects of increased polymer concentration (2.5% to 4.5%) and flow rate (3 mL/h to 6 mL/h) on fiber diameter when using a 7:1 chloroform:methanol solvent system. In general, with increasing polymer concentration and flow rate or decreasing distance from the needle tip to the collector, there was an increase in the average fiber diameter for each NFM. The voltage was tuned to produce a stable Taylor cone for each polymer concentration, flow rate, and collecting distance. To produce bioactive fibers, we electrospun copolymer blends of P1 and P2 (Butyl-Biotin NFMs) at a polymer ratio of 8:2 creating NFMs with covalently bound and accessible biotin on the fiber surface, which enables the linkage of other biotinylated molecules through a streptavidin bridge (Figure 3b).
Figure 4.
(a) Representative electrospinning parameter optimization for the PONB-Butyl polymers varying fiber diameter: (i) 340 ± 112 nm, (ii) 395 ± 113 nm, (iii) 531 ± 108 nm, (iv) 739 ± 149 nm by altering the polymer concentration and flow rate at a 9 cm working distance: (i) 2.5%, 3 mL/h, (ii) 3.5%, 3 mL/h, (iii) 4.5%, 3 mL/h, (iv) 4.5%, 6 mL/h. (b) Optimized nanofiber meshes with approximately the same fiber diameters: (i) Butyl-Biotin mesh 694 ± 159 nm, (ii) diTEG-Biotin mesh 709 ± 240 nm, (iii) Butyl only mesh 640 ± 138 nm, (iv) diTEG only mesh 652 ± 130 nm (one-way ANOVA, p = 0.534 between the four NFM types, n = 20 fibers per mesh type) (scale bars = 5 µm).
A library of antifouling NFMs was created from each version of P3 with the different monomer ratios (M1:M3-9:1, 8:2, 7:3, 1:1, 3:7). Polymer solutions made from the 9:1, 8:2, and 7:3 P3 copolymers all produced NFMs; however, the copolymers with M1:M3 ratios of 1:1 and 3:7 failed to produce uniform NFMs when spun from 7:1 chloroform:methanol solutions (Figure S20). When 30% of the polymer backbone consisted of M3, the NFMs swell when placed in aqueous solutions (Figure S21) likely due to the enhanced hydrophilicity and water solubility (Figure S19) associated with the greater M3 content. Therefore, to optimize the amount of “anti-fouling” triethylene glycol present in the NFM, the copolymer with an 8:2 monomer ratio (M1:M3) was chosen for further study (diTEG only NFMs). In addition, a set of antifouling and bioactive NFMs were created by blending P2 (8:2 M1:M2 monomer ratio) and P3 (8:2 M1:M3 monomer ratio) at an 8:2 polymer ratio (P3:P2) to produce NFMs containing both biotin and triethylene glycol (diTEG-Biotin NFMs) (Figure 3b). The diTEG-Biotin meshes were designed to specifically bind streptavidin bridges and subsequently other biotinylated molecules but avoid nonspecifically binding other macromolecules due to the triethylene glycol containing monomers in the copolymer backbone; however, the diTEG only meshes were designed to prevent protein adsorption in general. The electrospinning parameters for each copolymer blend were optimized to produce ~700 nm in diameter fibers (Figure 4b), and each biotinylated mesh was composed of the same amount of P2 but with varied concentrations of P1 or P3 to achieve consistent mesh morphologies across each mesh type.
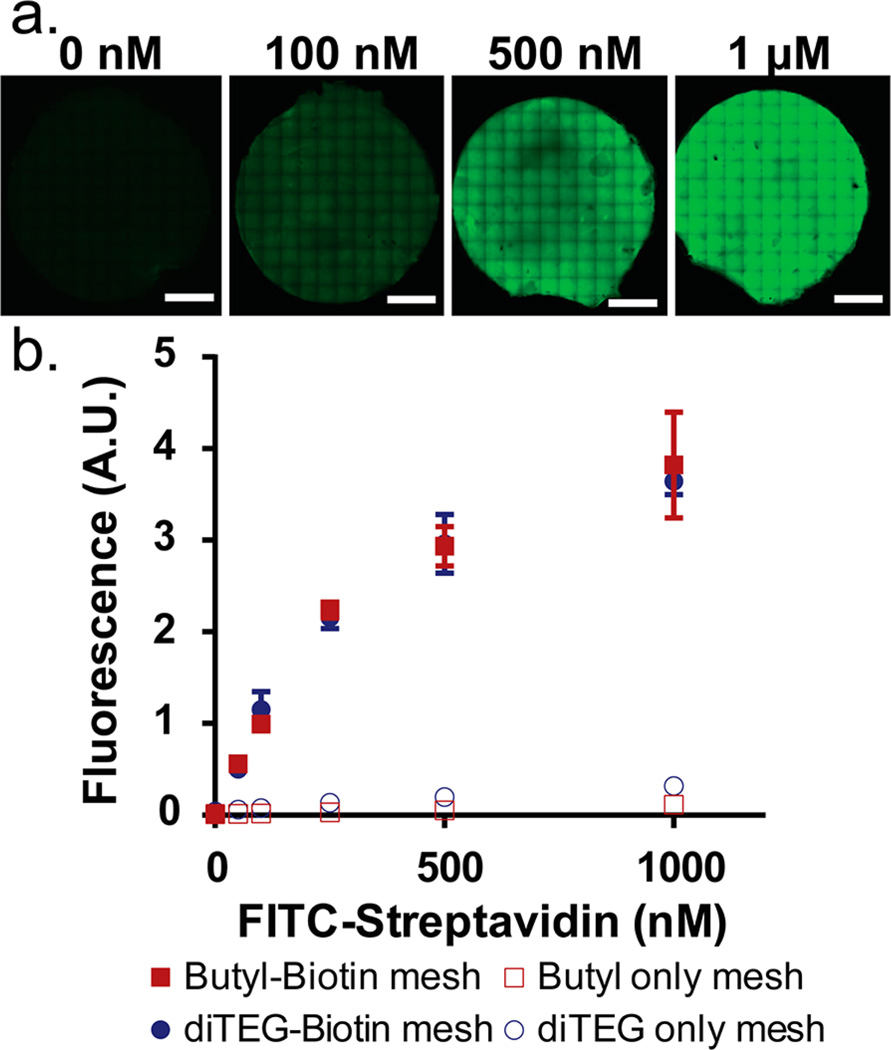
The streptavidin binding capacity of the Butyl only, Butyl-Biotin, diTEG only, and diTEG-Biotin NFMs were analyzed by applying varying concentrations of fluorescently labeled streptavidin (FITC-streptavidin) and imaging each mesh using a confocal microscope. An automated stage was used to generate large mosaic images composed of many 10× magnification images stitched together to create a high-resolution image for each mesh surface (~4 mm in diameter) at each FITC-streptavidin concentration (n = 3). A representative example of these images for the Butyl-Biotin meshes is shown in Figure 5a. As the FITC-streptavidin concentration increases from 0 nM to 1 µM, the fluorescence intensity increases across the entire mesh surface (Figure 5a). The average pixel intensity was calculated for each mesh and plotted against FITC-streptavidin concentration (Figure 5b). The biotinylated meshes showed a substantial increase in fluorescence signal, even from the lowest FITC-streptavidin concentration (50 nM), compared to meshes without any biotin content (p < 0.01). Furthermore, the specific interaction between the biotinylated fibers and the streptavidin molecules was not inhibited by the TEGylated fibers as the Butyl-Biotin (solid red squares) and diTEG-Biotin (solid blue circles) meshes, exhibited equivalent streptavidin binding capacities at each FITC-streptavidin concentration. Theoretically, the biotin content per mesh should be approximately 1 mM (within the 100 µL volume tested) allowing for a very large excess of biotin per streptavidin added. Due to limitations in FITC-streptavidin concentration (stock solution: 18 µM), the maximum concentration tested was 1 µM which began to show a plateau of fluorescence signal due to the detector saturating rather than saturating the streptavidin binding capacity of the mesh. More importantly, the nonspecific binding of FITC-streptavidin to the Butyl only (open red squares) or diTEG only (open blue circles) meshes was minimal indicating the fluorescence signal in the biontinylated meshes is due to the strong interaction between streptavidin and biotin (Kd ≈ 10−14 M).20,21
Figure 5.
(a) Confocal microscopy mosaic images of Butyl-Biotin meshes exposed to 0 nM, 50 nM, 100 nM, 250 nM, 500 nM, and 1 µM FITC-Streptavidin (scale bar = 1 mm). (b) Quantitative pixel analysis of the confocal images for the Butyl-Biotin, diTEG-Biotin, Butyl only, and diTEG only meshes measuring the average pixel intensity for each mosaic image. (n = 3 meshes, avg ± SD).
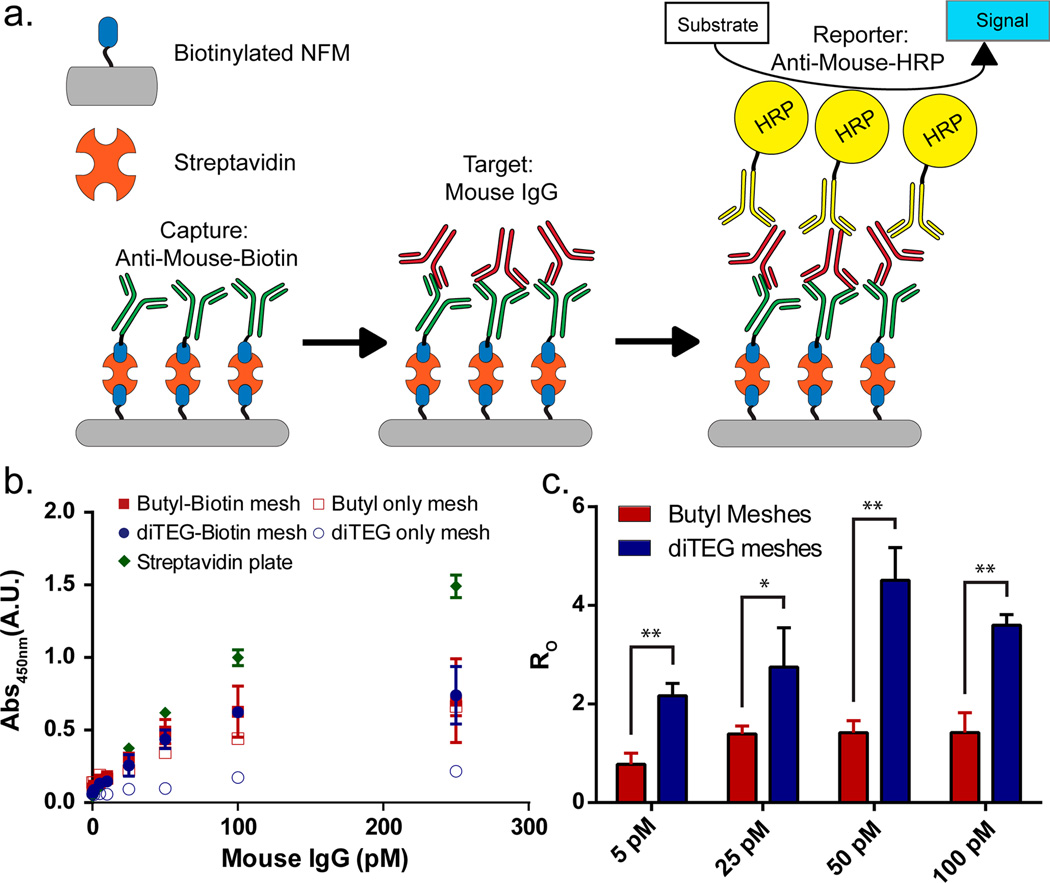
To explore the utility of an antifouling and bioactive NFM, we performed an ELISA assay using streptavidin to couple biotinylated antimouse capture antibodies (from a goat) onto the NFM surface to detect a generic mouse IgG. This assay was chosen to mimic but simplify a sandwich ELISA performed on a streptavidin-coated microwell plate. Typically, a target molecule is detected by first binding the molecule to a biotinylated capture antibody (e.g., from a goat) on the streptavidin-coated ELISA substrate. Then a second antibody (e.g., from a mouse) specific to the target is added, and finally, the molecule is detected by adding enzyme-linked secondary antibodies specific for all mouse IgG in the system. The assay performed on the NFM substrates is illustrated in Figure 6a where the mouse IgG was the target molecule being captured and detected by secondary antimouse antibodies from a goat using a colorimetric HRP assay, which produced a yellow signal when exposed to a 3,3′,5,5′-tetramethylbenzidine (TMB) solution.
Figure 6.
(a) Schematic diagram of the enzyme-linked immunosorbent assay (ELISA) performed on the PONB nanofiber meshes using streptavidin bridges to connect the biotinylated surface to a biotinylated antimouse IgG. A generic mouse IgG was used as the target molecule, and an antimouse IgG conjugated to a horseradish peroxidase (HRP) was used as a colorimetric reporter when exposed to the substrate (3,3′,5,5′-tetramethylbenzidine (TMB)). (b) Absorbance measurements (at 450 nm) of the TMB solution after exposure to the meshes. Butyl-Biotin, diTEG-Biotin, Butyl only, diTEG only meshes and a streptavidin-coated plate control (Thermo Scientific) were analyzed at mouse IgG concentrations ranging from 0 pM to 250 pM with detection limits of 11.5, 7.5, 40.1, 56.0, and 0.9 pM, respectively (detection limit: S/N ≥ 2 and p < 0.05). (c) The specific vs nonspecific binding ratio (R0) was determined by comparing the Butyl-Biotin to the Butyl only meshes and the diTEG-Biotin to the diTEG only meshes. (* p < 0.05, ** p < 0.001) (n = 4, avg ± SD).
As the concentration of mouse IgG increased from 0 to 250 pM, the colorimetric signal produced an absorption increase at 450 nm indicating more mouse IgG was captured onto the mesh (Figure 6b). There was no difference in signal between the Butyl only and Butyl-Biotin meshes at any of the concentrations tested, indicating a high degree of nonspecific binding on the Butyl only mesh. However, there was a statistically significant difference (p < 0.05, n = 4) between the antifouling diTEG only and diTEG-Biotin meshes from 1 to 250 pM and no difference at 0 pM mouse IgG. The detection limits, as defined by the concentration at which the absorbance signal is greater than twice the 0 pM signal and is statistically different from 0 pM, for each mesh were 11.5, 7.5, 40.1, and 56.0 pM for the Butyl-Biotin, diTEG-Biotin, Butyl only, and diTEG only, respectively. The ratio of the specific to nonspecific (RO) binding was calculated at several concentrations by dividing the absorbance for the bioactive (biotin containing) meshes by the absorbance for the nonbioactive meshes for the Butyl (red) and diTEG (blue) meshes (Figure 6c). Due to the high degree of nonspecific binding for the Butyl meshes, the ratio is approximately equal to 1 for every concentration; however, the antifouling properties of the diTEG meshes reduce this nonspecific binding producing much higher ratios. Therefore, the bioactive and antifouling diTEG-Biotin mesh performed the best with the lowest detection limit and highest specific to nonspecific binding ratios at each concentration of mouse IgG tested.
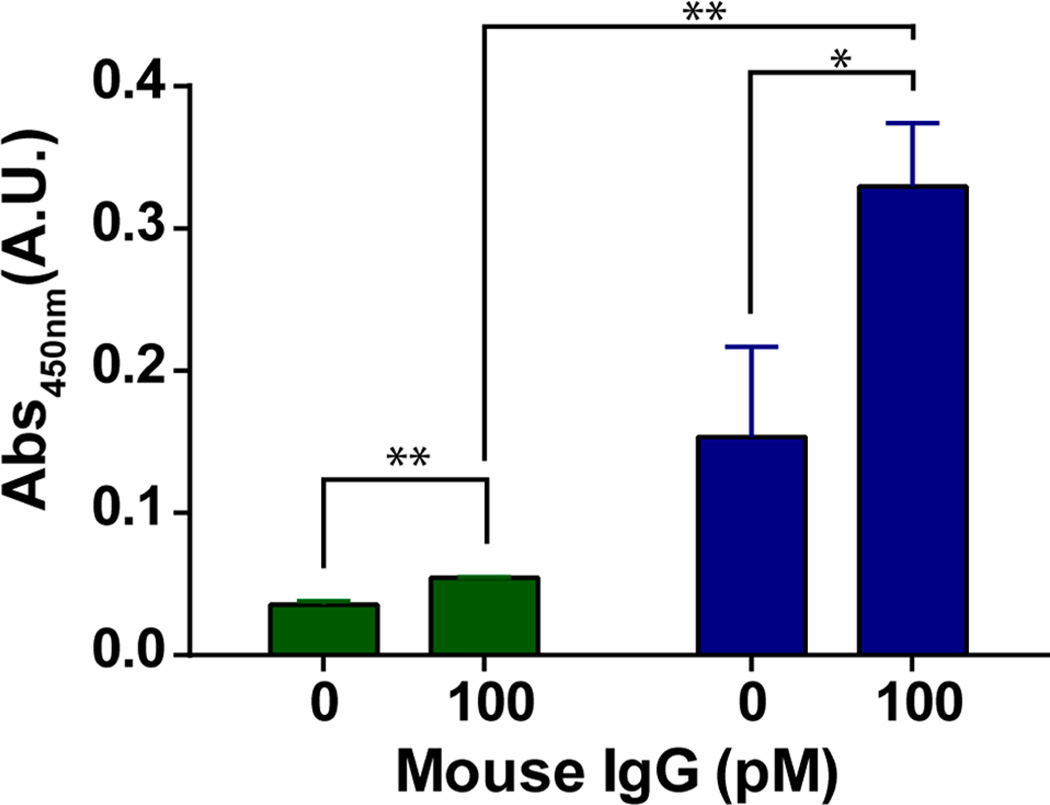
When compared to a traditional streptavidin coated polystyrene 96-well plate, the bioactive and antifouling meshes only provide an equivalent absorbance signal up to approximately 50 pM and fail to achieve the same detection limit of approximately 0.9 pM. At higher concentrations, the binding capacity of the NFMs becomes a factor even when the meshes are incubated with a 500 nM streptavidin solution for 18 h (Figure 6b). This indicates that the entire mesh surface area is not being utilized under the traditional, relatively static (orbital shaker), ELISA conditions. However, an advantage to using a porous three-dimensional substrate compared to a traditional two-dimensoinal surface is the ability to flow solutions through the material, improving the mixing within the mesh during each step. Figure 7 illustrates the advantages of flowing the assay components through a mesh compared to using an orbital shaker for the streptavidin coated plate ELISA. Each sample was only exposed to the streptavidin, capture IgG, mouse IgG, and HRP-IgG solutions for 10 min each rather than an 18 h streptavidin exposure and 2 h capture IgG, mouse IgG, and HRP-IgG exposures in Figure 6 for a static assay. As a result, the streptavidin-coated plate shows a substantial reduction in absorbance when detecting 0 pM vs 100 pM mouse IgG and only a 1.5× increase in signal. Under flow conditions, the diTEG-Biotin NFMs exhibit a significantly larger difference between the 0 pM and 100 pM signals than the streptavidin coated plates and show a statistically different (p < 0.05) 2.2× increase in signal indicating a detection limit of less than 100 pM for this rapid NFM ELISA and greater than 100 pM for the rapid traditional ELISA.
Figure 7.
Comparison of a standard static streptavidin coated plate (green) ELISA on an orbital shaker to a diTEG-Biotin mesh (blue) ELISA under flow conditions for 10 min per binding event with a total assay time of 1 h (* p < 0.05, ** p < 0.01) (n = 3 meshes, avg ± SD).
CONCLUSION
A bioactive and antifouling NFM is reported with functionality built in at the monomer level which shows enhanced selective binding capacity under flow compared to traditional 96-well plates. Three 7-oxanorbornene derivatives incorporating: (1) a butyl side chain for water insolubility; (2) bioactivity (via biotin–streptavidin bridges); and (3) antifouling properties are reported and polymerized into a set of high-molecular-weight polyoxanorbornene copolymers. Electrospinning solutions of these polymer mixtures results in the formation of ~700 nm in diameter NFMs with high surface-to-volume ratios and varying degrees of bioactivity and antifouling properties. Applying fluorescently labeled streptavidin to each mesh for 18 h enables the quantification of the streptavidin binding capacity for each NFM which is shown to be greater than 1 µM. The bioactive and antifouling properties of the NFMs are quantified using a simplified ELISA designed to detect varying concentrations of mouse IgG through a colorimetric assay. Under static conditions, the detection limit of the bioactive and antifouling diTEG-Biotin NFM is 7.5 pM for the slow, 26 h, ELISA compared to 0.9 pM for a 2D streptavidin coated 96-well plate. However, under flow for 1 h, the 3D, porous NFM produces a substantially higher colorimetric signal and a lower detection limit than the 2D, solid, streptavidin-coated plate due to the high surface-to-volume ratio and superior mixing under flow conditions through the NFM. These types of “smart filters” will play a vital role in advancing diagnostic applications where rapidly identifying a key threshold concentration of a target molecule is important.
Supplementary Material
Acknowledgments
This work was supported in part by the NIH (R21 EB017377 MWG/AM, T32 EB006359 JH, and the Center for Future Technologies in Cancer Care (CFTCC U54 EB015403) at Boston University). The authors gratefully acknowledge the Boston University Chemistry Department Chemical Instrumentation Center for access to NMR and Mass spectrometry equipment. In addition, we are grateful for the National Science Foundation for purchase of the Waters high-resolution mass spectrometer (CHE 0443618) used in this work and Dr. Norman Lee for operating the mass spectrometer.
Footnotes
ASSOCIATED CONTENT
Supporting Information
- Experimental procedures, synthesis, characterization, and supporting figures (PDF)
The authors declare no competing financial interest.
REFERENCES
- 1.Wang Z-G, Wan L-S, Liu Z-M, et al. J. Mol. Catal. B: Enzym. 2009;56:189. [Google Scholar]
- 2.Matlock-Colangelo L, Baeumner AJ. Lab Chip. 2012;12:2612. doi: 10.1039/c2lc21240d. [DOI] [PubMed] [Google Scholar]
- 3.Matlock-Colangelo L, Baeumner AJ. Annu. Rev. Anal. Chem. 2014;7:23. doi: 10.1146/annurev-anchem-071213-020035. [DOI] [PubMed] [Google Scholar]
- 4.Scampicchio M, Bulbarello A, Arecchi A, et al. Electroanalysis. 2012;24:719. [Google Scholar]
- 5.Biosensors Market by Application (Point of Care, Home Diagnostics, Research Labs, Biodefense, Environmental Monitoring, Food Industry), Product (Wearable, Non-Wearable), Technology (Electrochemical, Piezoelectric, Optical) & Geography - Analysis & Forecast to 2020. Markets and Markets. 2015 [Google Scholar]
- 6.Biosensors Market Analysis By Application (Medical applications, Food Toxicity Detection, Industrial Process Control, Agriculture, Environment) By Technology (Thermal Biosensors, Electrochemical Biosensors, Piezoelectric Biosensors, Optical Biosensors) By End-use (Home Healthcare Diagnostics, Point of Care Testing, Food Industry, Research Laboratories) And Segment Forecasts To 2020. Grand View Research: Market Research & Consulting. 2015 [Google Scholar]
- 7.Goryacheva IY, Saeger SD, Eremin SA, et al. Food Addit. Contam. 2007;24:1169. doi: 10.1080/02652030701557179. [DOI] [PubMed] [Google Scholar]
- 8.Lee I, Luo X, Huang J, et al. Biosensors. 2012;2:205. doi: 10.3390/bios2020205. [DOI] [PMC free article] [PubMed] [Google Scholar]
- 9.Wang J. Biosens. Bioelectron. 2006;21:1887. doi: 10.1016/j.bios.2005.10.027. [DOI] [PubMed] [Google Scholar]
- 10.Zhou F, Wang M, Yuan L, et al. Analyst. 2012;137:1779. doi: 10.1039/c2an16257a. [DOI] [PubMed] [Google Scholar]
- 11.Squires AH, Hersey JS, Grinstaff MW, et al. J. Am. Chem. Soc. 2013;135:16304. doi: 10.1021/ja408685x. [DOI] [PMC free article] [PubMed] [Google Scholar]
- 12.Wanunu M, Sutin J, McNally B, et al. Biophys. J. 2008;95:4716. doi: 10.1529/biophysj.108.140475. [DOI] [PMC free article] [PubMed] [Google Scholar]
- 13.Sun B, Long Y, Zhang H, et al. Prog. Polym. Sci. 2014;39:862. [Google Scholar]
- 14.Formhals A. 1,975,504. U.S. Patent. 1934 Oct 2;
- 15.Reneker DH, Chun I. Nanotechnology. 1996;7:216. [Google Scholar]
- 16.Yang D, Niu X, Liu Y, et al. Adv. Mater. 2008;20:4770. [Google Scholar]
- 17.Li D, Frey MW, Vynias D, et al. Polymer. 2007;48:6340. [Google Scholar]
- 18.Sawicka K, Gouma P, Simon S. Sens. Actuators, B. 2005;108:585. [Google Scholar]
- 19.Patel AC, Li S, Yuan J-M, et al. Nano Lett. 2006;6:1042. doi: 10.1021/nl0604560. [DOI] [PubMed] [Google Scholar]
- 20.Green N, Avidin L. Biochem. J. 1963;89:585. doi: 10.1042/bj0890585. [DOI] [PMC free article] [PubMed] [Google Scholar]
- 21.Green NM. Adv. Protein Chem. 1975;29:85. doi: 10.1016/s0065-3233(08)60411-8. [DOI] [PubMed] [Google Scholar]
- 22.Lu T, Chen X, Shi Q, et al. Acta Biomater. 2008;4:1770. doi: 10.1016/j.actbio.2008.05.006. [DOI] [PubMed] [Google Scholar]
- 23.Black FE, Hartshorne M, Davies MC, et al. Langmuir. 1999;15:3157. [Google Scholar]
- 24.Senecal A, Magnone J, Marek P, et al. React. Funct. Polym. 2008;68:1429. [Google Scholar]
- 25.Bielawski CW, Grubbs RH. Prog. Polym. Sci. 2007;32:1. [Google Scholar]
- 26.Sutthasupa S, Shiotsuki M, Sanda F. Polym. J. (Tokyo Jpn.) 2010;42:905. [Google Scholar]
- 27.Wathier M, Lakin BA, Bansal PN, et al. J. Am. Chem. Soc. 2013;135:4930. doi: 10.1021/ja400695h. [DOI] [PubMed] [Google Scholar]
- 28.Wathier M, Stoddart SS, Sheehy MJ, et al. J. Am. Chem. Soc. 2010;132:15887. doi: 10.1021/ja106488h. [DOI] [PubMed] [Google Scholar]
- 29.Al-Badri ZM, Tew GN. Macromolecules. 2008;41:4173. [Google Scholar]
- 30.Sankaran N, Rys AZ, Nassif R, et al. Macromolecules. 2010;43:5530. [Google Scholar]
- 31.Sanford MS, Love JA, Grubbs RH. Organometallics. 2001;20:5314. [Google Scholar]
- 32.Lienkamp K, Kins CF, Alfred SF, et al. J. Polym. Sci., Part A: Polym. Chem. 2009;47:1266. [Google Scholar]
- 33.Schneider CA, Rasband WS, Eliceiri KW. Nat. Methods. 2012;9:671. doi: 10.1038/nmeth.2089. [DOI] [PMC free article] [PubMed] [Google Scholar]
- 34.van Hensbergen JA, Burford RP, Lowe AB. J. Polym. Sci., Part A: Polym. Chem. 2013;51:487. [Google Scholar]
- 35.Richter M, Chakrabarti A, Ruttekolk IR, et al. Chem. - Eur. J. 2012;18:16708. doi: 10.1002/chem.201202276. [DOI] [PubMed] [Google Scholar]
- 36.Baschieri A, Muzzioli S, Fiorini V, et al. Organometallics. 2014;33:6154. [Google Scholar]
Associated Data
This section collects any data citations, data availability statements, or supplementary materials included in this article.


