

Abstract
We developed a merged younger-older adult template of the fornix and demonstrated its utility for studies of aging and preclinical Alzheimer's disease (AD). In Experiment 1, probabilistic tractography was used to reconstruct the fornix in younger and older adults and successful streamlines were then averaged to create a merged template in standard space. The new template includes the majority of the fornix from the hippocampal formation to the subcallosal region and the thalamus/hypothalamus. In Experiment 2, the merged template was validated as an appropriate measure for studies of aging, with comparisons against manual tracing measures indicating identical spatial coverage in younger and older adult groups. In Experiment 3, the merged template was found to outperform age-specific templates in measures of sensitivity and specificity computed on diffusion tensor imaging data of an independent participant cohort. In Experiment 4, relevance to preclinical AD was demonstrated via associations between fractional anisotropy within the new fornix template and cerebrospinal fluid markers of AD pathology (Aβ42 and the t-tau/Aβ42 ratio) in a third independent cohort of cognitively normal older adults. Our new template provides an appropriate measure for use in future studies seeking to characterize microstructural alterations in the fornix associated with aging and preclinical AD.
Keywords: Fornix, Diffusion tensor imaging, Aging, Aβ amyloid, Tau
Highlights
-
•
A new merged, younger-older DTI template of the fornix was developed.
-
•
Template anatomical validity, sensitivity and specificity were demonstrated.
-
•
Template metrics correlate with Alzheimer's pathology.
-
•
The new fornix template is an appropriate tool for aging and Alzheimer's research.
1. Introduction
The fornix is a key associative tract of the limbic system, interconnecting the hippocampal formation with subcortical structures in the basal forebrain and diencephalon. The fornix forms a core portion of the Papez circuit, described in 1937 (Papez, 1937), and its course has been extensively studied in animal tracer experiments (Daitz and Powell, 1954, Aggleton and Brown, 1999). Anatomically, the fornix is an arched, C-shaped structure divided into four bilateral sections. Left and right fornices connect with their ipsilateral hippocampal formation as the fimbria, sweep toward the midline as the crura, arch dorsally under the corpus callosum as the body, and curve ventrally as the columns. The postcommissural columns principally connect the hippocampal formation with the thalamus and hypothalamic nuclei (Aggleton, 2012). The precommissural columns principally connect the hippocampal formation with deep septal nuclei (Poletti and Creswell, 1977).
The advent of diffusion tensor imaging (DTI) (Basser et al., 1994, Le Bihan et al., 2001) has allowed for in vivo study of the fornix in aging and age-related neurodegenerative conditions. A body of DTI studies have shown that microstructural properties of the fornix are negatively affected by aging (Lebel et al., 2012, Michielse et al., 2010, Salat et al., 2005, Sullivan et al., 2010). Additional, more pronounced, declines in fornix microstructure have been reported in Alzheimer's disease (AD) and amnestic mild cognitive impairment (aMCI) (Bozzali, 2002, Kantarci et al., 2001, Rose et al., 2006).
More recent findings suggest that measures of fornix microstructure may be useful in detecting early/preclinical AD stages (Nowrangi and Rosenberg, 2015). First, there is evidence of altered WM microstructure in the fornix in cognitively normal older adults at high AD-risk compared to their low risk peers (Gold et al., 2010, Gold et al., 2012, Nierenberg et al., 2005, Persson et al., 2006, Ringman et al., 2007). Second, poorer WM microstructure in the fornix is associated with more AD pathology (as reflected by in vivo measures) in cognitively normal older adults (Gold et al., 2014, Molinuevo et al., 2014).
The increasing interest in understanding age- and disease-related alterations in fornix microstructure calls for a standardized template to allow for direct comparison of results across studies. An important feature of a template intended for comparisons between groups with morphological differences is that it be representative of the ‘average’ anatomy of these groups. At present, most fornix templates were developed solely on younger adult samples (Lawes et al., 2008, Thiebaut de Schotten et al., 2011, Wassermann et al., 2010). Limitations associated with the use of younger-only templates in studies of aging are well known and have motivated calls for the use of merged younger-older or study-specific reference data which can improve registration, better control for volumetric differences and thus improve measurement accuracy (Ashburner and Friston, 2000, Good et al., 2001, Smith et al., 2006, Thompson et al., 2001).
At present, DTI studies of aging focusing on specific tracts such as the fornix can use custom regions of interest (ROIs, e.g. Ringman et al., 2007, Gold et al., 2014), computationally intensive labeling algorithms (Jin et al., 2014, Jin et al., 2015), or voxel-wise analyses (Gold et al., 2010, Lebel et al., 2012, Salat et al., 2005). While valuable, these methods are not relevant to the goal of creating a standardized template that can be used across studies for the purpose of comparison of results. Currently, the most widely used fornix template is that developed as part of the ICBM-DTI-81 white-matter labels atlas (Mori et al., 2008). The ICBM-DTI-81 white-matter labels atlas was created by hand segmentation of an average DTI map from 81 adults ranging from young to middle-aged (range 18–59 years old, Mean = 39 years old). Though highly useful, the ICBM-DTI-81 white-matter labels templates include only small discontinuous sections of the fornix and include non-fornix fibers from the stria terminalis.
Here we sought to develop a single, continuous DTI template of the fornix appropriate for future studies seeking to characterize WM microstructure alterations associated with aging and preclinical AD. Four experiments were conducted. In Experiment 1, a merged younger-older adult template of the fornix was developed. Probabilistic tractography was used as the fornix follows a complex, spiral trajectory that lacks clear anatomical boundaries in most sections. In Experiment 2, the new template was validated against manual tracings of the fornix body. In Experiment 3, the merged younger-older fornix template was qualitatively and quantitatively compared to age-specific fornix templates in a new participant cohort. In Experiment 4, potential associations between fractional anisotropy (FA) in the new merged fornix template and cerebrospinal fluid (CSF) measures of AD pathology were explored.
2. Methods
2.1. General methods
Methods common to all studies are reported first, followed by a description of experiment-specific procedures.
2.1.1. Participants
A total of 221 adults between the ages of 18–92 years old participated. All participants provided written informed consent in a manner approved by the University of Kentucky Medical Institutional Review Board and were financially compensated for their time. Exclusion criteria were a major head injury, stroke, a neurological or psychiatric disorder, high blood pressure, diabetes, claustrophobia, pacemakers, the use of psychotropic drugs, or presence of metal fragments and/or metallic implants contraindicated for MRI. All participants were recruited as part of multiple fMRI studies that had inclusion criteria that individuals have normal or corrected-to-normal vision and not be color-blind.
Three distinct participant samples were involved in the present study. Data from sample 1 (55 younger adults aged 25–40 years old, 65 older adults aged 57–83 years old) was used for template generation and anatomic validation (Experiments 1 and 2). Data from sample 2 (29 younger adults aged 18–34 years old, 30 older adults aged 61–77 years old) was used for comparison of the merged and age-specific templates in a new cohort (Experiment 3). Data from sample 3 (42 older adults aged 65–92 years old) was used for assessing relationships between the merged and age-specific templates with CSF markers of AD pathology (Experiment 4). Final characteristics of each sample are provided in the experiment-specific sections below.
2.1.2. DTI acquisition and processing
All imaging data were collected on a 3 T Siemens Trio TIM scanner at the University of Kentucky Magnetic Resonance Imaging and Spectroscopy Center. FMRIB's Diffusion Toolbox (FDT) v3.0 was used for all DTI processing. Raw images underwent eddy current correction, brain extraction, and motion correction using a 12-parameter affine transformation to the b0 images. DTIFIT was used to compute a tensor model and eigenvalues (λ1, λ2, λ3) within each voxel, which were then used to calculate FA images. Each participant's FA image was co-registered to the FMRIB58 FA 1 mm standard space template using tract-based spatial statistics [TBSS (Smith et al., 2006)], as described in detail in our previous work (Johnson et al., 2012). Briefly, non-linear voxel-wise registration was used to transform FA images into MNI space, where they were averaged to generate a mean FA image. The mean FA image was subsequently used to create a common white matter (WM) tract skeleton. The skeleton was thresholded at FA > 0.2 in order to minimize partial volume effects after warping across all participants. Finally, each participant's FA image was projected onto the FA skeleton to account for residual misalignments between participants after initial registration. TBSS_fill was used for visualization purposes of DTI data.
2.2. Experiment 1: creation of a combined younger-older fornix template using probabilistic tractography
The purpose of Experiment 1 was to develop a fornix template on a combined sample of younger and older adults. Probabilistic tractography was first used to reconstruct a fornix pathway for each individual participant on a voxel-to-voxel basis. Individual participants' tractography-derived fornix masks were then registered into standard space and merged to create a group template reflecting the average anatomical features of younger and older adults.
2.2.1. Participants
DTI data from 120 participants (sample 1) were initially screened for use in the creation of a fornix template. Inclusion criteria were the availability of: (1) DTI and T1-weighted images collected on the same scanner and head coil, using the same MRI sequence, and (2) cognitive test results (for the purpose of between-group matching). Some of the participants included in the present DTI experiment also took part in functional magnetic resonance imaging (fMRI) experiments requiring decisions about colored stimuli, the results of which have been reported elsewhere (Hakun et al., 2015a, Hakun et al., 2015b, Zhu et al., 2015).
From the original pool of 120 participants, 10 were excluded for motion or other artifacts and 15 participants were excluded for insufficient coverage of the fornix (i.e. data did not include the entire hippocampal seed mask used in tractography). Intelligence was estimated using the Cattell Culture Fair Intelligence Test (Cattell and Baggaley, 1960), and digit spans were measured using the digits forward (DF) and backward (DB) subtests of the Wechsler Memory Scale (WMS III, Wechsler, 1997).
2.2.2. MRI acquisition
DT imaging used a double spin-echo echo-planar imaging (EPI) sequence [repetition time (TR) = 6900 ms, echo time (TE) = 105 ms, flip angle = 90°, field of view (FOV) = 224 mm2, in-plane resolution = 1.75 × 1.75 mm voxels, 40 contiguous 3-mm-thick axial slices] with 36 non-collinear encoding directions (b = 1000s/mm2) plus 5 images without diffusion weighting (b = 0 s/mm2, b0). T1-weighted imaging used a 3-dimensional magnetization prepared rapid acquisition with gradient echo (MPRAGE) sequence [TR = 1690 ms, TE = 2.65 ms, flip angle = 12°, 1-mm isotropic voxels].
2.2.3. Probabilistic tractography procedures
Probabilistic tractography followed a similar procedure used in our previous work (Brown et al., 2015, Johnson et al., 2012). First, Bayesian Estimation of Diffusion Parameters Obtained using Sampling Techniques [BEDPOSTX, (Behrens et al., 2003)] was run using a 2-fiber model to determine a probabilistic diffusion model in each voxel. PROBTRACKX2 (Behrens et al., 2007) was then run in seed mask mode using modified Euler streamlining with 5000 samples generated from each voxel in the seed mask, a curvature threshold of 0.2 (approximately ± 80°), a step length of 0.5 mm with maximum of 2000 steps, and a fiber volume threshold of 0.01. Prior to tractography, masks to be used as seeds and waypoints were transformed from FMRIB58 FA 1 mm standard space to each participant's diffusion space using the inverse of the non-linear warp from each participant's FA image to FMRIB58 FA 1 mm space (described in Section 2.1.2).
Separate tractography analyses were conducted for the left and right fornices, using ipsilateral hippocampi as seed regions. The hippocampal seed regions were based on masks from the Harvard-Oxford Subcortical Atlas, which were thresholded at 50 in order to minimize the chances of inclusion of non-hippocampal structures. Each tractography analysis also used the ipsilateral ICBM-DTI-81 white-matter labels fornix ‘crus/stria terminalis’ and ‘fornix body’ template masks as the waypoints using the AND condition. All other white matter tracts in the ICBM-DTI-81 white-matter labels atlas (other than those used as waypoints) were used as an exclusion mask. Successful streamlines were those originating in a voxel in the hippocampal seed and passing through a voxel in both the crus and body waypoint masks without passing through a voxel in the exclusion mask.
2.2.4. Generation of a younger-older adult group fornix template
Individual probabilistic tractography results (i.e. proportion of successful streamlines) were combined to form a merged younger-older adult group template, following a series of steps illustrated in Fig. 1. First, a waytotal-normalized proportion image was generated by dividing the proportion image by the total number of successful tracts generated (the waytotal) to account for differences in “trackability” between each participant's diffusion data. Next, each participant's waytotal-normalized proportion image was transformed to FMRIB58 FA 1 mm space using the non-linear warp from each participant's FA image to FMRIB58 FA 1 mm space (described in Section 2.1.2). A group mean image was calculated by averaging all participants' waytotal-normalized proportion maps with a threshold set to include the top 20% of voxels to create group templates of the left and right fornices. Additional thresholds were also tested but yielded poorer qualitative and quantitative results. Detailed analyses of additional thresholds are provided in Supplementary Material. The left and right fornix masks were then binarized and conjoined, resulting in a single tractography-derived fornix mask.
Fig. 1.

Pipeline for generating group fornix template. The processing pipeline was used to generate a group template from individual tractography results (proportion of successful streamlines). Steps above the dashed line occur in each participant's native space, whereas steps below the dashed line occur in FMRIB58 FA 1 mm standard space after non-linear warping. Thresholding was performed to include the top 20% of voxels, which resulted in a continuous structure without extraneous voxels. All steps are performed on the left and right fornix results (from the left and right hippocampal seeds, respectively) separately until combined in the final step following binarization.
2.3. Experiment 2: anatomic validation of the merged fornix template
The goal of Experiment 2 was to investigate the anatomic validity of the merged younger-older fornix template by comparing it to manual tracings of the fornix body. The percent volume shared between the manually traced fornix body and the merged younger-older fornix template was measured in a subset of younger and older adults from sample 1. The body of the fornix was used for the anatomical validation experiment as it is the only portion of the fornix with clearly delineated anatomical boundaries.
2.3.1. Participants
The datasets of ten younger (mean age = 33.3 ± 2.9 years) and ten older (mean age = 65.7 ± 5.2 years) adults were randomly selected from sample 1 for manual tracing experiments.
2.3.2. Manual tracing of the fornix body
An individual rater with experience in manual tracing (AA-M) outlined the fornix body on the T1-weighted structural images of 10 younger and 10 older participants. The rater was blinded to the age and sex of individual participants and to the tractography-derived mask. Prior to tracing, the MPRAGE images were 3D-aligned to correct for head rotation, skull-stripped using BET (Smith, 2002), and inhomogeneity-corrected using FAST (Zhang et al., 2001). Tracing was performed on sagittal slices within FSLView using a magnified frame. The magnified window spanned the dorsal aspect of the corpus callosum to the ventral border of the midbrain and from the rostral aspect of the genu to the caudal aspect of the splenium. The fornix was traced on consecutive sagittal slices starting with the midline and moving laterally in each direction. When completing the manual tracings, the body of the fornix was identified using the anterior commissure as the rostral boundary, the corpus callosum as the caudal boundary, the thalamus as the ventral boundary, and the lateral ventricles as the dorsal boundary. The same rater carried out repeated tracings to measure intra-rater reliability using intra-class correlation.
2.3.3. Registration of manual tracings to standard space
FNIRT was used to register each individual's high-resolution T1 image to the MNI152 T1 1 mm standard template using non-linear registration with a 10 mm warp resolution after an initial linear affine registration (Andersson et al., 2010). The resulting transformation matrix parameters were then applied to the manually traced fornix body mask to warp from native space to MNI152 T1 1 mm standard space.
2.3.4. Overlap of the tractography-derived fornix template with manual tracing
A mean image of participants' individual manually traced (MT) fornix masks was made for the purpose of visualizing relative overlap with the merged template. Quantitative overlap was then assessed using each individual's MT fornix mask. Specifically, the percentage of volume shared by the merged template with each individual's MT fornix was computed. The volume of each individual's MT fornix was first computed with FSLStats. Each individual's MT fornix was then masked by the merged fornix template to include only those voxels that were contained by the template. Percent overlap was then computed by dividing the volume of each individual's MT fornix masked by the fornix template by the volume of the unmasked MT template. The percent overlap in younger and older adults was compared using independent samples t-tests.
2.4. Experiment 3: comparison of merged fornix template with age-specific fornix templates
The goal of Experiment 3 was to compare the merged fornix template with age-specific templates using qualitative and quantitative measures. Age-specific (younger-only and older-only) fornix templates were generated using the same tractography methods described in Experiment 1 (see Section 2.2.4). Qualitative differences were explored by visualizing anatomical differences between the merged fornix template and the age-specific templates. Quantitative differences were explored via between-template comparisons of sensitivity and specificity of fornix measurement. Additional between-template comparisons of FA values were also conducted.
2.4.1. Generation of age-specific fornix templates
Age-specific fornix templates were created by averaging the waytotal-normalized proportion images of younger adults (younger-only template) and older adults (older-only template) from sample 1. Both templates were thresholded to include the top 20% of voxels, and then left and right fornix masks were binarized and conjoined. The merged younger-older and unmerged, age-specific templates were then visually compared.
2.4.2. Participants
DTI data from an independent participant cohort (sample 2) of 29 younger (mean age = 24.1 ± 3.9 years, M:F = 12:17) and 30 older adults (mean age = 66.4 ± 3.3 years, M:F = 15:15) were used. The data for this experiment originated from a separate experiment conducted by one of this study's co-authors (NFJ).
2.4.3. MRI acquisition
DTI scans were collected using a 32-channel head coil and a double-spin echo EPI sequence [TR = 8000 ms, TE = 96 ms, flip angle = 90°, FOV = 224 mm2, in-plane resolution = 2 × 2 mm voxels, 52 contiguous 2-mm-thick axial slices] with 64 non-collinear encoding directions (b = 1000s/mm2) plus 7 images without diffusion weighting (b = 0 s/mm2, b0).
2.4.4. Quantitative comparison of merged and age-specific fornix templates
The mean FA skeleton of the new cohort was first created using TBSS (described in Section 2.1.2). Template-specific (merged, younger-only and older-only) ROIs were then applied to the mean skeleton of the new cohort to form overall group-level fornix ROIs. Group-level ROIs generated on the mean skeleton represent the ‘average center-of-tract’ across the participant cohort. Thus, each of the three group-level ROIs/templates was applied to each participant's individual FA skeleton using TBSS_deproject. This resulted in individual-level ROI masks for each participant, for each group-level ROI/template. The total number of non-zero voxels within each participant's individual-level ROI mask located both within and outside of each corresponding group-level ROI/template was computed using FSLStats.
The total number of voxels within the template in each person was divided by the number of voxels in the group template as a measure of sensitivity (or correct identifications). The total number of voxels outside the template in each person was divided by the total number of voxels (both inside and outside the group template) in each person as a measure of specificity. Percentages for sensitivity (% correct) and 1-specificity (% false) were converted to their corresponding Z-scores, and then d′ was calculated by subtracting ZCorrect − ZFalse. Finally, FA values for each participant/group-level ROI were extracted using fslmeants.
Repeated-measures ANOVAs were used to determine the between-subject effect of age group and within-subject effect of fornix template (merged, younger-only, or older-only) on d′ and FA values separately. For each analysis, the group × template interaction was also tested. Planned comparisons were performed to test differences between each mask within each group and differences between groups within each mask. These comparisons were corrected for multiple comparisons using Bonferroni correction within each family of tests (p < 0.05/6 = 0.0083 for differences between masks within each group, and p < 0.05/3 = 0.016 for differences between groups within each mask).
2.5. Experiment 4: association with biomarkers of AD pathology
The purpose of Experiment 4 was to assess relationships between WM microstructure (FA) in the merged younger-older fornix template and biomarkers of preclinical AD (CSF protein levels).
2.5.1. Participants
Participants (sample 3) were recruited from the Alzheimer's Disease Center in the University of Kentucky's Sanders-Brown Center on Aging (SBCoA). Participants at the SBCoA undergo annual cognitive and clinical assessments, with cognitive normality determined via expert clinical diagnosis. The details concerning this participant cohort have been described extensively elsewhere (Schmitt et al., 2012). Sample 3 consisted of a total of 42 participants who underwent imaging and had available CSF data. None of the participants in this sample were part of samples 1 or 2. Two participants were excluded due to motion during MRI scanning or other artifacts and 6 were excluded due to incomplete coverage of the fornix.
2.5.2. MRI acquisition
DTI scans were collected using a 32-channel head coil and a double-spin echo EPI sequence [TR = 8000 ms, TE = 96 ms, flip angle = 90°, FOV = 224 mm2, in-plane resolution = 2 × 2 mm voxels, 52 contiguous 2-mm-thick axial slices] with 64 non-collinear encoding directions (b = 1000s/mm2) plus 7 images without diffusion weighting (b = 0 s/mm2, b0).
2.5.3. CSF collection and analysis
Participants underwent lumbar CSF sampling on the same day as scanning and within 8 months of neuropsychological testing (mean gap = 2.46 ± 2.01 months). CSF was collected in the morning after fasting since midnight, using a 20-gauge needle, 15 mL sterile polypropylene collection tubes, and maintained in single-use 0.5 mL aliquots in polypropylene tubes stored in a − 80 °C freezer. One set of CSF samples was shipped on dry ice from the University of Kentucky to the Alzheimer's Disease Neuroimaging Initiative (ADNI) Biomarker Core laboratory at the University of Pennsylvania Medical Center. CSF levels of Aβ1–42, t-tau, and p-tau181 were measured using the multiplex xMAP Luminex Platform (Luminex Corp, Austin, TX) with Innogenetics (INNO-BIA, AlzBio3; Ghent, Belgium) immunoassay kit as previously described (Shaw et al., 2009). Samples were kept frozen at all times and were thawed just before testing.
2.5.4. Statistical analyses of diffusivity measures and CSF markers
CSF biomarker values were log-transformed before statistical analyses due to their skewed distribution. Partial correlation analyses were performed between FA in the merged and age-specific fornix templates and CSF markers (Aβ42, t-tau, p-tau181, t-tau/Aβ42, and p-tau181/Aβ42). Partial correlations were then performed between CSF markers and global FA, assessed as the FA average across 20 major tracts in the ICBM-DTI-81 white-matter labels atlas, to test for specificity of relationships to the fornix. In addition, voxel-wise analyses were performed within the skeletonized younger-older fornix template to localize CSF-FA relationships to specific regions of the fornix. Threshold-free cluster enhancement was used to correct for multiple comparisons with a corrected p < 0.05 considered significant. Age and sex were covariates in each of these CSF-FA analyses. Supplementary group analyses were also run based upon CSF cutoffs (see Supplementary material).
3. Results
3.1. Experiment 1: creation of a combined younger-older fornix template
The final group (participant sample 1; Table 1) consisted of 49 younger (ages 25–40, mean = 32.5 ± 4.04 years) and 46 older adults (ages 60–77, mean = 65.3 ± 4.55 years). The groups did not differ in male/female ratio (χ2 = 0.56, p = 0.46), years of education (t = 0.911, p = 0.37), age-scaled IQ (t = − 1.71, p = 0.09), DF (t = 1.69, p = 0.09), or age-scaled DB (t = − 0.23, p = 0.82).
Table 1.
Demographics and neurocognitive test performance in Sample 1.
| Younger | Older | |
|---|---|---|
| N = 95 | n = 49 | n = 46 |
| Age | 32.5 ± 4.0 | 65.3 ± 4.6 |
| M:F | 25:24 | 26:20 |
| Education | 16.9 ± 3.0 | 16.4 ± 2.7 |
| IQ | 122.0 ± 18.347 | 128.5 ± 18.4 |
| DF | 11.1 ± 2.145 | 10.4 ± 2.1 |
| DB | 10.2 ± 2.945 | 10.3 ± 2.2 |
IQ, Cattell Culture Fair Intelligence Test; DF, digit span forward; DB, digit span backward; values listed are mean ± SD. Values for IQ and DB are age-scaled scores. If score values were missing, the number of participants used in the computation is shown as a subscript.
The older group had lower mean numbers of successful (and proportion of successful) streamlines than the younger group, although considerable inter-individual variability was observed in each group (Table 2). As each individual's image was weighted by the number of successful streamlines before the group template was generated, tractography data from each individual (regardless of age or sex) was entered with the same weight.
Table 2.
Tractography results from Experiment 1.
| Younger |
Older |
|||||
|---|---|---|---|---|---|---|
| Female (n = 25) | Male (n = 24) |
All (n = 49) |
Female (n = 26) |
Male (n = 20) |
All (n = 46) |
|
| Successful streamlines | 46,927 (8723) |
46,324 (8640) |
46,632 (6077) |
23,994 (6008) |
34,739 (7969) |
28,666 (4860) |
| Proportion successful | 0.0109 (0.0012) |
0.0095 (0.0018) |
0.0103 (0.009) |
0.0052 (0.0012) |
0.0065 (0.0014) |
0.006 (0.009) |
Mean values are provided with standard error in parentheses
The new merged template (Fig. 2; in red) represents a continuous mask of the fornix from the hippocampal formation to the thalamus/hypothalamus (postcommissural fornix) and to the subcallosal and septal regions (precommissural fornix). The ICBM-DTI-81 white-matter labels masks (crus/stria terminalis and body) used as waypoints are also shown in Fig. 2 (in blue). As can be seen in Fig. 2, the combined younger-older template encompasses WM regions captured by the two ICBM-DTI-81 white-matter labels masks, other than the stria terminalis (which is not part of the fornix). In addition, the new fornix template captures additional sections of the body, crus/fimbria and columns not covered by the ICBM-DTI-81 white-matter labels fornix masks.
Fig. 2.

Visual comparison of the merged younger-older fornix template and ICBM-DTI-81 fornix/stria terminalis template. A–B: Tractography-derived fornix mask (red) and ICBM-DTI-81 fornix body and crus/stria terminalis masks (blue) from rostrolateral view (A) and caudodorsal view (B). The tractography-derived template provides extensive coverage of the fornix (including portions of the crus and body and major portions of the columns) C–F: Overlay of templates on high-resolution T1 MNI152 1mm3 images to aid anatomical localization. C: Sagittal view of the tractography-derived fornix template (red) with transparency increased to show overlap with the fornix in the underlying structural T1 image and with the ICBM templates (blue). D: Coronal view (MNI y = − 1) of the tractography-derived post-commissural fornix (red) terminating in the hypothalamus. E: Coronal view (MNI y = 6) of the tractography-derived pre-commissural fornix (red) terminating in the caudal portion of the septal forebrain. F: Sagittal view (MNI x = − 5) of the tractography-derived left fornix (red) highlighting the body of the fornix and post-commissural columns.
3.2. Experiment 2: anatomic validation of the merged fornix template
Intra-rater reliability between manual tracings of the fornix body was high (r = 0.96, p < 0.001). Fig. 3a–b shows the significant spatial overlap between the MT fornix body (yellow) and the merged younger-older fornix template (red). The MT fornix includes the (perpendicularly oriented fibers of the) hippocampal commissure, which are excluded from the merged younger-older fornix template. Results of an independent samples t-test (Fig. 3c) found no age-group difference in spatial overlap of the merged fornix template and MT fornix (t = 0.18, df = 18, p = 0.86).
Fig. 3.
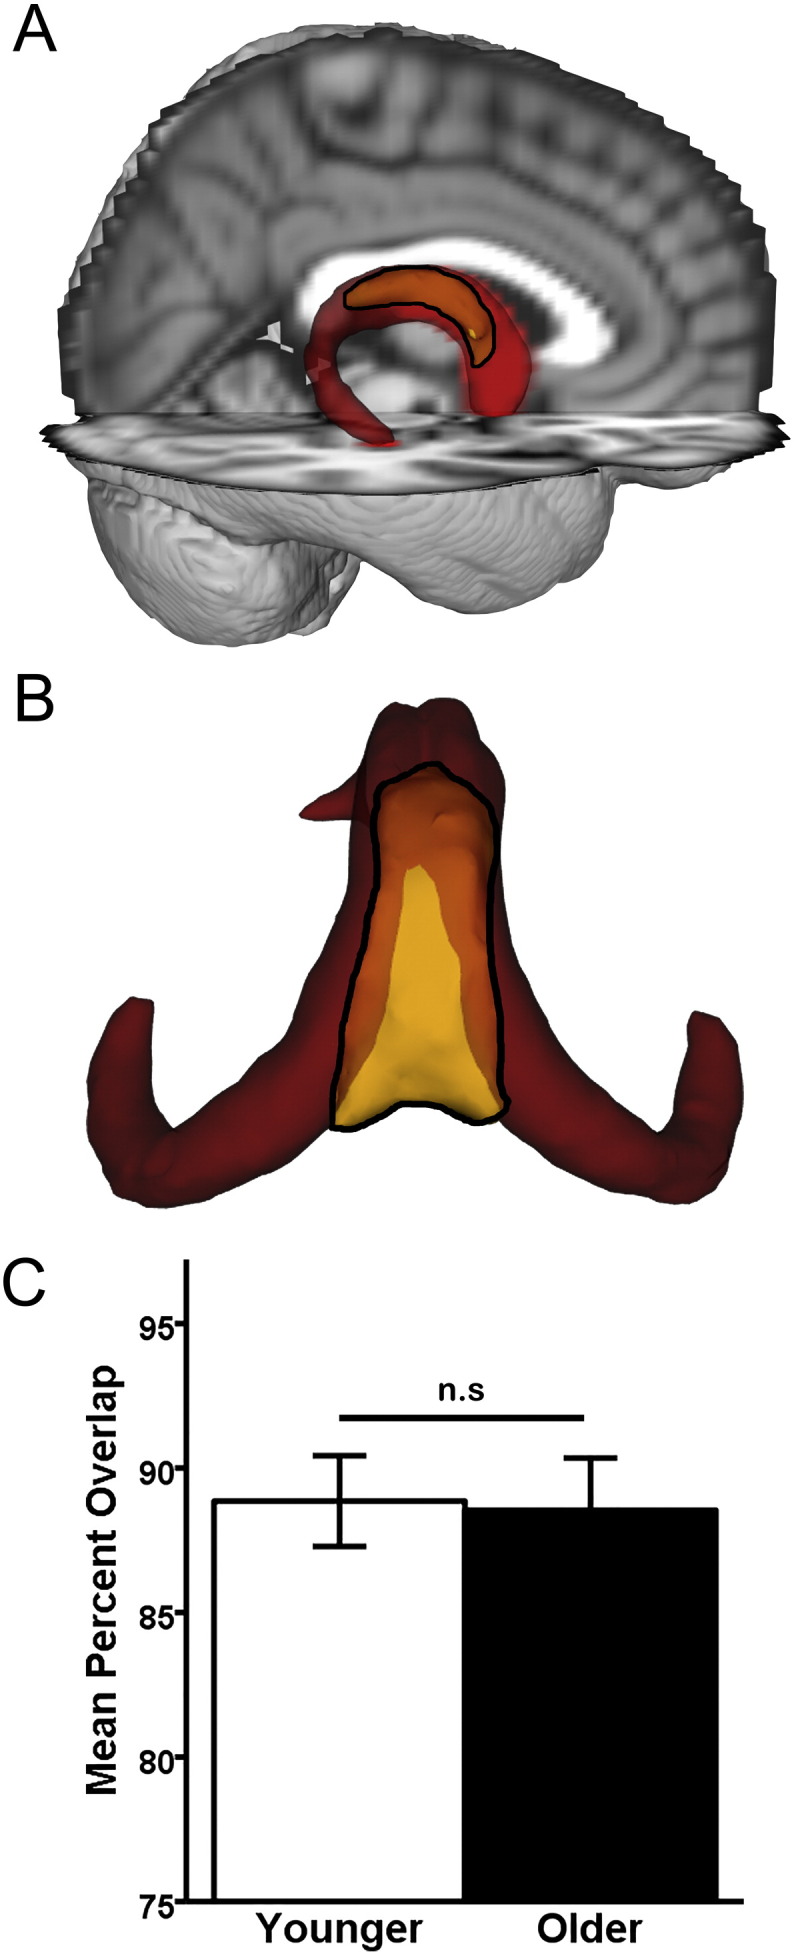
Anatomic validation results. A–B: Qualitative results. The younger-older template (red) and the manually-traced (MT) fornix (yellow with black outline). Opaque yellow within the black outline indicates overlap with the merged younger-older template, while brighter yellow within the black outline are unique to the MT fornix body. A: Visual comparison reveals extensive overlap between the merged younger-older template and the MT fornix body, overlaid on the MNI152 T1 1 mm brain for anatomic reference. B: Caudo-dorsal view of the merged younger-older template and MT fornix body reveals that the main area unique to the MT fornix is in the dorsomedial section (bright yellow), which primarily consists of hippocampal commissural fibers running perpendicular to the fornix body/crus. The more lateral and rostral aspect of the fornix body (opaque yellow) overlap with the merged fornix template. C: Quantitative results. An independent samples t-test revealed that the merged younger-older template provides identical coverage in younger and older adults (p = 0.89). Error bars are ± 1 S.E.M. n.s.: p > 0.05.
3.3. Experiment 3: comparison of merged fornix template with age-specific fornix templates
3.3.1. Qualitative comparison
Visualization of the merged, younger-only, and older-only templates on a T-1 weighted image (Fig. 4a–c) shows that the merged template (red in A) approximates average features of the older-only (blue in B) and younger-only (green in C) templates. As can be seen, the merged template is larger than the older-only template and smaller than the younger-only template, with the difference in spatial extent being most pronounced in the columns. Additionally, the curvatures of crus in the younger-only and older-only templates appear slightly different, and the merged younger-older template appears as a balanced/smoothed version of the two.
Fig. 4.

Comparing merged and age-specific fornix templates. A–C: Qualitative results. Visual comparison reveals that the merged template (A) reflects the average features of the older-only template (B) and younger-only template (C). D & E: Quantitative results. Results of pairwise comparisons performed after separate 2 × 3 repeated-measures ANOVA with age-group as the between-subjects effect and template (merged, older-only, or younger-only) as the within-subject effect. Error bars are ± 1 S.E.M.; *p-value significant after Bonferroni correction (p < 0.0083 for D, F, H; p < 0.016 for E, G, I). D: Differences in d′ between templates. E: Differences in FA values in the fornix between templates.
3.3.2. Quantitative comparison
A repeated-measures ANOVA with d′ as the dependent variable (Fig. 4d) found significant main effects of group (F1,57 = 6.64, p = 0.013) and template (F2,114 = 118, p < 0.001), as well as a group × template interaction (F2,114 = 12.28, p < 0.001). Planned comparisons indicated that the younger-only template had a higher d′ in younger adults than in older adults (t = 4.30, df = 57, p < 0.001). There were no group differences in d′ between younger and older adults for the merged template (p = 0.35), while the older-only template had a higher d′ in younger adults than older adults that was not significant after correction for multiple comparisons (t = 2.24, df = 57, p = 0.029).
In addition, the merged template had a higher d′ than the younger-only template and older-only template within both younger and older adults (t ≥ 6.23, p < 0.001). Interestingly, lower d′ in the younger-only template was due low specificity (specificity = 85.5% ± 4.2) compared to the merged template (specificity = 90% ± 3.5), while the lower d′ in the older-only template was due to low sensitivity (sensitivity = 78.5% ± 3.4) compared to the merged template (sensitivity = 86.3% ± 3.9). The younger-only template had a higher d′ than the older-only template within younger adults (t = 2.05, df = 28, p = 0.05), while the older-only template had a higher d′ than the younger-only template in older adults (t = − 2.07, df = 29, p = 0.048), although neither difference was significant after correction for multiple comparisons. The differences were driven by low sensitivity of the older-only template in younger adults (sensitivity = 79.2% ± 3.8) and low specificity of the younger-only template in older adults (specificity = 84% ± 4.6).
A repeated-measures ANOVA with FA as the dependent variable (Fig. 4e) found significant main effects of group (F1,57 = 59.75, p < 0.001) and template (F2,114 = 8.62, p < 0.001), as well as a significant group × template interaction (F2,114 = 63.19, p < 0.001). Planned comparisons indicated higher FA values in younger than older adults in the merged (t = 7.72, df = 57, p < 0.001), younger-only (t = 8.28, df = 57, p < 0.001), and older-only (t = 6.91, df = 57, p < 0.001) templates. Further, FA values in the younger-only template were higher than those in the merged template (t = 5.39, df = 28, p < 0.001) and older-only template (t = 8.03, df = 28, p < 0.001) in younger adults, but were lower than those in the merged template (t = − 5.62, df = 29, p < 0.001) and older-only template (t = − 3.77, df = 29, p < 0.001) in older adults. FA values in the merged template were significantly higher than those in the older-only template in younger adults (t = 9.59, df = 28, p < 0.001), and there was a trend toward higher FA values in the older-only template than the merged template in older adults (t = − 1.87, df = 29, p = 0.07).
3.4. Experiment 4: association with biomarkers of AD pathology
Sample 3 consisted of 34 older adults (ages 65–92, mean = 76.2 ± 6.82 years) (Table 3).
Table 3.
Demographics and neuropsychological test performance for Sample 3.
| Mean ± SD | |
|---|---|
| Age | 76.2 ± 6.8 |
| M:F | 13:21 |
| Education | 16.6 ± 2.532 |
| MMSE | 29.4 ± 0.831 |
| Logical Memory-Imm | 16.1 ± 3.431 |
| Logical Memory-Del | 15.9 ± 3.231 |
| Animal fluency | 20.6 ± 5.531 |
| Trails A | 34.9 ± 16.231 |
| Trails B | 85.5 ± 43.531 |
| Digit symbol | 47.5 ± 11.331 |
MMSE, Mini-Mental State Exam; Logical Memory-Imm/-Del, Immediate and Delayed recall from Wechsler Memory Scale Revised (Story A only); Trails A/B, Trail Making Tests Part A and B; Digit Symbol from Wechsler Adult Intelligence Scale-Revised; All neuropsychological test scores are raw scores. If score values were missing, the number of participants used in the computation is shown as a subscript.
3.4.1. Relationships between fornix templates and CSF markers
FA in the merged younger-older template was positively associated with Aβ42 (r = 0.43, df = 30, p = 0.015) and negatively associated with the t-tau/Aβ42 ratio (r = − 0.46, df = 30, p = 0.008) after controlling for age and sex (Fig. 5a–b). No other CSF markers correlated with FA in the merged younger-older fornix template (p > 0.15). Considering the age-specific templates, the only relationship to approach significance was between FA in the older-only template and the t-tau/Aβ42 ratio (r = − 0.32, df = 30, p = 0.07). None of the other relationships between FA in the older-only or younger-only templates and CSF markers approached significance (all p's > 0.18). Finally, there was no relationship between global FA (across 20 major tracts in the ICBM-DTI-81 white-matter labels atlas) and Aβ42 (r = 0.13, df = 30, p = 0.45) or any other CSF marker (p > 0.63).
Fig. 5.
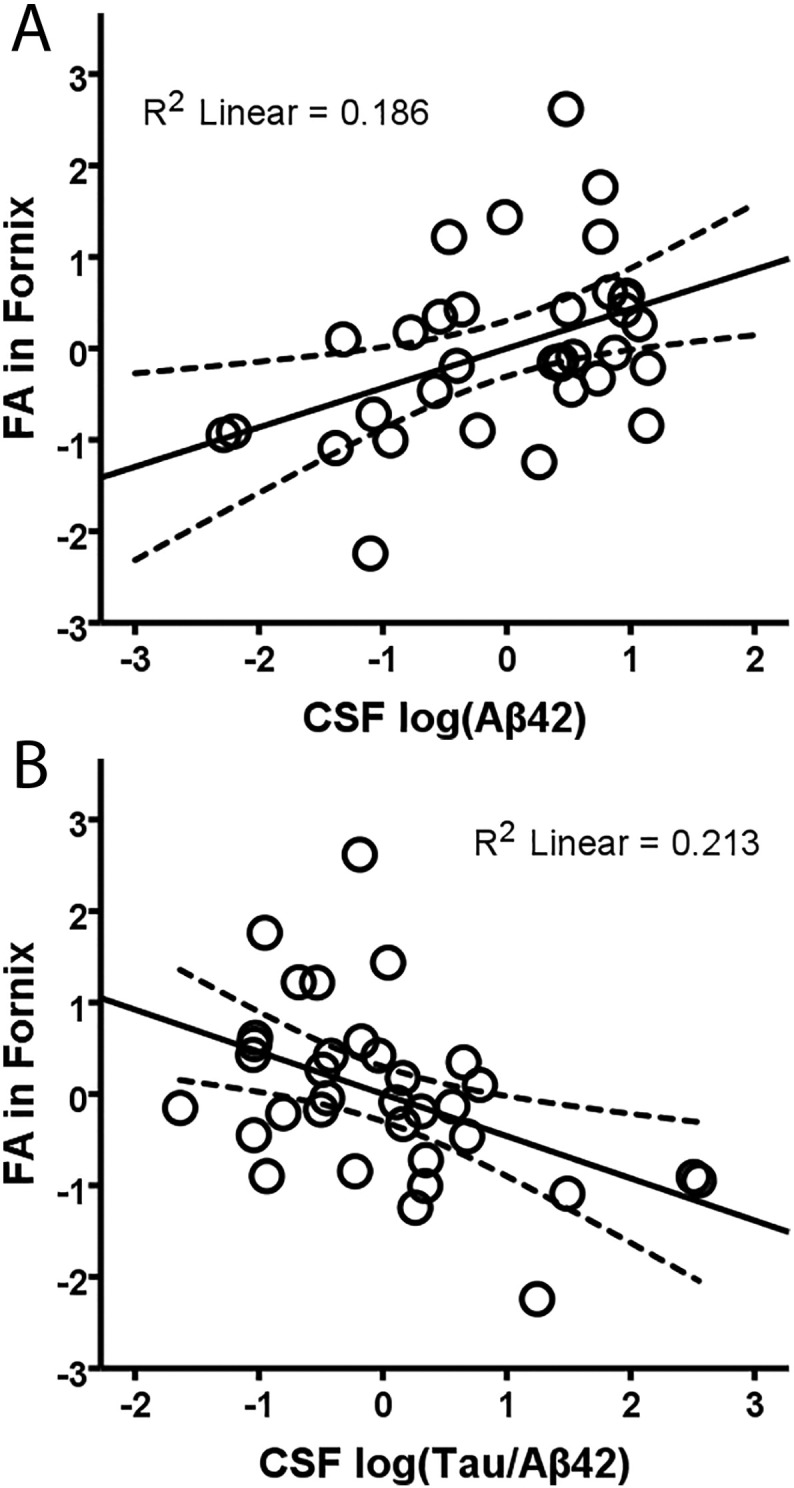
Relationship between CSF proteins and FA in the merged younger-older fornix template. Regression of FA in the merged younger-older template against CSF Aβ42 (A), and t-tau/Aβ42 ratio (B) when controlling for the effects of age and sex. Significant relationships show that lower FA (worse white matter microstructure) in the fornix is associated with worse AD-related pathology markers. R2 linear values are for the linear best fit (solid line), and dashed lines indicate the 95% confidence interval for the mean response.
3.4.2. Voxelwise-CSF relationships in the new fornix template
Voxelwise analyses focused on merged template, as this was the only template showing significant association with CSF markers. Correlations between FA and each of the CSF biomarkers were observed in widespread portions of the fornix body and portions of the fornix crus and columns. Specifically, positive correlations were observed between Aβ42 and FA (Fig. 6a) and negative correlations between FA and t-tau/Aβ42 ratio (Fig. 6b). There were no significant voxels in which higher FA was associated with greater pathology (either lower Aβ42 or higher t-tau/ Aβ42).
Fig. 6.

Voxel-wise relationships between FA in the merged fornix template and CSF markers. Separate analyses were performed to examine the relationships between FA and Aβ42 (A) and Tau/Aβ42 (B). Voxels with significant positive correlations are shown in green (A) and those with significant negative correlations are shown in blue (B). Threshold-free cluster enhancement was performed and voxels with p < 0.05 were considered significant. TBSS-fill was used for visualization.
4. Discussion
A merged younger-older adult DTI template of the fornix was developed and shown to accommodate anatomical variability associated with human aging. The new template provides continuous coverage of the fornix from the hippocampal formation to the subcallosal region and to hypothalamus. The merged template showed identical spatial coverage of the fornix body in younger and older age groups and outperformed age-specific templates in measures of sensitivity and specificity computed on DTI data of an independent participant cohort. Relevance to preclinical AD was shown via associations of lower FA in the merged fornix template with higher AD pathology (based on CSF measures of Aβ42 and the t-tau/Aβ42 ratio) in cognitively normal older adults. Our new template is an appropriate measure for future studies seeking to characterize microstructural properties of the fornix associated with aging, preclinical AD and cognitive/brain reserve.
The coverage of our new fornix template and the ICBM-DTI-81 white-matter labels templates are shown in Fig. 2. The new template encompasses WM regions captured by the ICBM-DTI-81 template, other than the stria terminalis (which is a developmentally related tract but not part of the fornix). In addition, the new fornix template captures additional sections of the body, crus/fimbria and columns not covered by the ICBM-DTI-81 fornix templates. More subtle differences between templates can also be seen. For example, the crus/fimbria portion of the new template extends slightly more ventrally than the ICBM-DTI-81 crus/stria terminalis template. This may be due in part to our use of tractography. Inclusion of the ventral portion of the crus/fimbria at the subicular region would be challenging with visual tracing as this region lacks the clear anatomical boundary present at other regions of hippocampal formation (the inferior horn of the lateral ventricle). However, subtle differences in coverage should not be strongly interpreted as they may relate to non-linear registration of the templates to FMRIB58_FA standard space employed here. The ICBM-DTI-81 white-matter labels templates were created via linear registration to the ICBM-152 anatomical template and thus may not register optimally to the FMRIB58_FA template employed by TBSS.
Anatomical validity of the merged template was demonstrated via comparison with manual tracing of the fornix body. Importantly, the merged template was found to provide identical coverage of the fornix body in younger and older adults (86% in each group), validating it as an appropriate measure of age-related WM microstructure comparisons. The deviation from 100% coverage in the new template relates mainly to exclusion of the hippocampal commissure. Fibers of the hippocampal commissure connecting the left and right hippocampal formations are oriented perpendicularly to adjacent fibers of the fornix body, and are necessarily excluded from probabilistic tractography approaches due to curvature threshold violation (Behrens et al., 2003, Behrens et al., 2007). Investigators with a special interest in this portion of the fornix may consider manual tracing of the hippocampal commissure in conjunction with the use of the merged fornix template.
Differences between the age-specific templates and the merged template were explored in Experiment 3. As can be seen in Fig. 4, the older-only template is smaller than the younger-only template. The smaller size of the older-only template is likely the result of multiple age-related changes including axonal loss/rarefaction, demyelination and atrophy (Roher et al., 2002, Xu et al., 2001). The size difference between the group-specific templates is most apparent in the region of the columns, but also evident in the body. By incorporating the average features of younger and older adults, the merged template is intended to reduce biases that can occur in studies making age group comparisons that use age-specific (typically younger-only) templates, which disproportionally alters data of only one group (typically older adults) during registration.
The reduction in measurement bias of the merged fornix template was quantified via between-template comparison of d′ measures computed on DTI data from an independent participant cohort. Results indicated that the merged template had superior d′ than both age-specific templates, with higher specificity than the younger template and higher sensitivity than the older-only template. Overall, the younger-only template was found to be the most biased measure, showing the largest age-group difference in d′. The older-only template was slightly less biased than the younger-only template, although it did show a trend-level effect of higher d′ in younger compared to older adults. In addition, the older-only template had lower sensitivity than either of the other templates, consistent with its reduced coverage of the body and columns sections of the fornix.
In contrast to the age-specific templates, the merged template showed no differences in d′ between younger and older adult groups, validating it as an unbiased measure for age group comparisons. A reduction in bias associated with use of the merged fornix template compared to age-specific templates was also seen via FA estimates from DTI data of the independent participant cohort. Once again, the younger-only template was the most biased measure, returning FA values that were higher than those of the other two templates for younger adults and lower than those of the other two templates for older adults. The older-only template was slightly less biased, but still returned FA values significantly lower than the merged template in younger adults. The merged template returned FA estimates intermediate to those of the age-specific templates, reducing the systematic bias of age-specific templates. These results are consistent with previous reports detailing the benefits of merged templates when making age-group comparisons (Ashburner and Friston, 2000, Good et al., 2001, Smith et al., 2006).
In Experiment 4, clinical utility of the merged template was explored by testing potential associations with measures of AD pathology in a new cohort of cognitively normal older adults. Results indicated that measures of AD pathology (lower levels of CSF Aβ42 and higher levels of t-tau/Aβ42) were associated with lower FA in the merged fornix template. In contrast, CSF markers were not correlated with FA in either of the two age-specific templates. Our findings linking Aβ amyloid pathology with poorer fornix WM microstructure are consistent with several recent results (Gold et al., 2014, Molinuevo et al., 2014), and serve to further link lower FA in the fornix with higher CSF t-tau/Aβ ratios. In addition, subsequent voxelwise results indicated that AD pathological markers were associated with lower WM FA in widespread portions of the fornix body, as well as in portions of the crus and columns—sections of the fornix that are uniquely captured by the merged younger-older template. Inclusion of crus/columns sections in templates of the fornix are thus likely to be of clinical relevance for biomarker studies.
It should be noted that the columns of our fornix template appear as a unified bundle (Fig. 2; panel A), as they predominantly reflect postcommissural paths (panel D). However, inclusion of small portions of precommissural paths reaching caudal septal region are also evident when our template is overlaid on coronal slices (Fig. 2; panel E). The majority of the precommissural fornix adopts a steep rostral curvature. Reconstruction of the more rostral precommissural fornix using a single hippocampal seed approach adopted here would require a very lenient tractography curvature threshold (which would risk likely inclusion of non-fornix fibers). Though different functions of the post- and pre-commissural fornices have not been firmly established, they remain possible given known anatomic connections and physiological differences. Whereas both precommissural and postcommissural portions of the columns carry glutamatergic efferent projections from pyramidal neurons of the hippocampus and subiculum, the precommissural fornix also carries cholinergic and GABA-ergic afferents to the hippocampal formation from medial septal nuclei (Meibach and Siegel, 1977, Aggleton and Brown, 1999).
The current study has limitations. Although probabilistic tractography was successful in reconstructing the majority of the fornix, the technique necessarily omits anatomically-related crossing fibers. Thus, the new younger-older adult template does not include the commissure of the fornix, which connects the left and right hippocampal formations. Additionally, the new template did not include middle-aged adults (i.e. in the 40–60 age range). The lack of difference between anatomic coverage between younger and older adults, however, would indicate that the absence of individuals in this age range may have had negligible effects on our results. Finally, longitudinal studies will be necessary to better assess potentially directional relationships between accumulating AD pathology and alterations in fornix WM microstructure.
In summary, we developed and validated a standardized DTI template of the fornix for use in studies of aging and preclinical AD. The new fornix template is simple to use within the TBSS pipeline and registers accurately to both younger and older participant cohorts, which allows for standardized, reproducible measurement of fornix microstructure across age groups. We plan to make our template freely available to other investigators. Future longitudinal work using the younger-older template developed here should provide greater understanding about the timing, extent and specific location of white matter microstructural declines in the fornix associated with AD pathological processes.
Acknowledgements
This study was supported by the National Institute on Aging and National Center for Advancing Translational Sciences of the National Institutes of Health (grant numbers RO1AG033036, P30AG028383, P01AG030128, TL1TR000115). In addition, JQT is supported by P30AG10124 and U01AG24904, and LMS is supported by U01AG24904. The content is solely the responsibility of the authors and does not necessarily represent the official views of these granting agencies. The authors thank Beverly Meacham for conducting some of the MRI scans.
Footnotes
Supplementary data to this article can be found online at http://dx.doi.org/10.1016/j.nicl.2016.11.024.
Appendix A. Supplementary data
Supplementary material
References
- Aggleton J.P. Multiple anatomical systems embedded within the primate medial temporal lobe: implications for hippocampal function. Neurosci. Biobehav. Rev. 2012;36:1579–1596. doi: 10.1016/j.neubiorev.2011.09.005. [DOI] [PubMed] [Google Scholar]
- Aggleton J.P., Brown M.W. Episodic memory, amnesia, and the hippocampal–anterior thalamic axis. Behav. Brain Sci. 1999;22:425–444. [PubMed] [Google Scholar]
- Andersson J., Jenkinson M., Smith S. FRMIB Technical Report. 2010. Non-linear registration, aka spatial normalisation. [Google Scholar]
- Ashburner J., Friston K.J. Voxel-based morphometry–the methods. NeuroImage. 2000;11:805–821. doi: 10.1006/nimg.2000.0582. [DOI] [PubMed] [Google Scholar]
- Basser P.J., Mattiello J., LeBihan D. MR diffusion tensor spectroscopy and imaging. Biophys. J. 1994;66:259–267. doi: 10.1016/S0006-3495(94)80775-1. [DOI] [PMC free article] [PubMed] [Google Scholar]
- Behrens T.E.J., Woolrich M.W., Jenkinson M., Johansen-Berg H., Nunes R.G., Clare S., Matthews P.M., Brady J.M., Smith S.M. Characterization and propagation of uncertainty in diffusion-weighted MR imaging. Magn. Reson. Med. 2003;50:1077–1088. doi: 10.1002/mrm.10609. [DOI] [PubMed] [Google Scholar]
- Behrens T.E.J., Berg H.J., Jbabdi S., Rushworth M.F.S., Woolrich M.W. Probabilistic diffusion tractography with multiple fibre orientations: what can we gain? NeuroImage. 2007;34:144–155. doi: 10.1016/j.neuroimage.2006.09.018. [DOI] [PMC free article] [PubMed] [Google Scholar]
- Bozzali M. White matter damage in Alzheimer's disease assessed in vivo using diffusion tensor magnetic resonance imaging. J. Neurol. Neurosurg. Psychiatry. 2002;72:742–746. doi: 10.1136/jnnp.72.6.742. [DOI] [PMC free article] [PubMed] [Google Scholar]
- Brown C.a., Hakun J.G., Zhu Z., Johnson N.F., Gold B.T. White matter microstructure contributes to age-related declines in task-induced deactivation of the default mode network. Front. Aging Neurosci. 2015;7 doi: 10.3389/fnagi.2015.00194. [DOI] [PMC free article] [PubMed] [Google Scholar]
- Cattell R.B., Baggaley A.R. The salient variable similarity index for factor matching. Br. J. Stat. Psychol. 1960;13:33–46. [Google Scholar]
- Daitz H.M., Powell T.P. Studies of the connexions of the fornix system. J. Neurol. Neurosurg. Psychiatry. 1954;17:75–82. doi: 10.1136/jnnp.17.1.75. [DOI] [PMC free article] [PubMed] [Google Scholar]
- Gold B.T., Powell D.K., Andersen A.H., Smith C.D. Alterations in multiple measures of white matter integrity in normal women at high risk for Alzheimer's disease. NeuroImage. 2010;52:1487–1494. doi: 10.1016/j.neuroimage.2010.05.036. [DOI] [PMC free article] [PubMed] [Google Scholar]
- Gold B.T., Johnson N.F., Powell D.K., Smith C.D. White matter integrity and vulnerability to Alzheimer's disease: preliminary findings and future directions. Biochim. Biophys. Acta. 2012;1822:416–422. doi: 10.1016/j.bbadis.2011.07.009. [DOI] [PMC free article] [PubMed] [Google Scholar]
- Gold B.T., Zhu Z., Brown C.A., Andersen A.H., LaDu M.J., Tai L., Jicha G.A., Kryscio R.J., Estus S., Nelson P.T., Scheff S.W., Abner E., Schmitt F.A., Van Eldik L.J., Smith C.D. White matter integrity is associated with cerebrospinal fluid markers of Alzheimer's disease in normal adults. Neurobiol. Aging. 2014;35:2263–2271. doi: 10.1016/j.neurobiolaging.2014.04.030. [DOI] [PMC free article] [PubMed] [Google Scholar]
- Good C.D., Johnsrude I., Ashburner J., Henson R.N., Friston K.J., Frackowiak R.S. Cerebral asymmetry and the effects of sex and handedness on brain structure: a voxel-based morphometric analysis of 465 normal adult human brains. NeuroImage. 2001;14:685–700. doi: 10.1006/nimg.2001.0857. [DOI] [PubMed] [Google Scholar]
- Hakun J.G., Zhu Z., Brown C.A., Johnson N.F., Gold B.T. Longitudinal alterations to brain function, structure, and cognitive performance in healthy older adults: a fMRI-DTI study. Neuropsychologia. 2015;71:225–235. doi: 10.1016/j.neuropsychologia.2015.04.008. [DOI] [PMC free article] [PubMed] [Google Scholar]
- Hakun J.G., Zhu Z., Johnson N.F., Gold B.T. Evidence for reduced efficiency and successful compensation in older adults during task switching. Cortex. 2015;64:352–362. doi: 10.1016/j.cortex.2014.12.006. [DOI] [PMC free article] [PubMed] [Google Scholar]
- Jin Y., Shi Y., Zhan L., Gutman B.A., de Zubicaray G.I., McMahon K.L., Wright M.J., Toga A.W., Thompson P.M. Automatic clustering of white matter fibers in brain diffusion MRI with an application to genetics. NeuroImage. 2014;100:75–90. doi: 10.1016/j.neuroimage.2014.04.048. [DOI] [PMC free article] [PubMed] [Google Scholar]
- Jin Y., Shi Y., Zhan L., Thompson P.M., Alzheimer's Disease Neuroimaging Initiative (ADNI) Automated multi-atlas labeling of the fornix and its integrity in Alzheimer's disease. Proc. IEEE Int. Symp. Biomed. Imaging. 2015;2015:140–143. doi: 10.1109/ISBI.2015.7163835. [DOI] [PMC free article] [PubMed] [Google Scholar]
- Johnson N.F., Kim C., Clasey J.L., Bailey A., Gold B.T. Cardiorespiratory fitness is positively correlated with cerebral white matter integrity in healthy seniors. NeuroImage. 2012;59:1514–1523. doi: 10.1016/j.neuroimage.2011.08.032. [DOI] [PMC free article] [PubMed] [Google Scholar]
- Kantarci K., Jack C.R., Xu Y.C., Campeau N.G., O'Brien P.C., Smith G.E., Ivnik R.J., Boeve B.F., Kokmen E., Tangalos E.G., Petersen R.C. Mild cognitive impairment and Alzheimer disease: regional diffusivity of water. Radiology. 2001;219:101–107. doi: 10.1148/radiology.219.1.r01ap14101. [DOI] [PMC free article] [PubMed] [Google Scholar]
- Lawes I.N.C., Barrick T.R., Murugam V., Spierings N., Evans D.R., Song M., Clark C.A. Atlas-based segmentation of white matter tracts of the human brain using diffusion tensor tractography and comparison with classical dissection. NeuroImage. 2008;39:62–79. doi: 10.1016/j.neuroimage.2007.06.041. [DOI] [PubMed] [Google Scholar]
- Le Bihan D., Mangin J.F., Poupon C., Clark C.A., Pappata S., Molko N., Chabriat H. Diffusion tensor imaging: concepts and applications. J. Magn. Reson. Imaging. 2001;13:534–546. doi: 10.1002/jmri.1076. [DOI] [PubMed] [Google Scholar]
- Lebel C., Gee M., Camicioli R., Wieler M., Martin W., Beaulieu C. Diffusion tensor imaging of white matter tract evolution over the lifespan. NeuroImage. 2012;60:340–352. doi: 10.1016/j.neuroimage.2011.11.094. [DOI] [PubMed] [Google Scholar]
- Meibach R.C., Siegel A. Efferent connections of the septal area in the rat: an analysis utilizing retrograde and anterograde transport methods. Brain Res. 1977;119:1–20. doi: 10.1016/0006-8993(77)90088-9. [DOI] [PubMed] [Google Scholar]
- Michielse S., Coupland N., Camicioli R., Carter R., Seres P., Sabino J., Malykhin N. Selective effects of aging on brain white matter microstructure: a diffusion tensor imaging tractography study. NeuroImage. 2010;52:1190–1201. doi: 10.1016/j.neuroimage.2010.05.019. [DOI] [PubMed] [Google Scholar]
- Molinuevo J.L., Ripolles P., Simó M., Lladó A., Olives J., Balasa M., Antonell A., Rodriguez-Fornells A., Rami L. White matter changes in preclinical Alzheimer's disease: a magnetic resonance imaging-diffusion tensor imaging study on cognitively normal older people with positive amyloid β protein 42 levels. Neurobiol. Aging. 2014 doi: 10.1016/j.neurobiolaging.2014.05.027. [DOI] [PubMed] [Google Scholar]
- Mori S., Oishi K., Jiang H., Jiang L., Li X., Akhter K., Hua K., Faria A.V., Mahmood A., Woods R., Toga A.W., Pike G.B., Neto P.R., Evans A., Zhang J., Huang H., Miller M.I., van Zijl P., Mazziotta J. Stereotaxic white matter atlas based on diffusion tensor imaging in an ICBM template. NeuroImage. 2008;40:570–582. doi: 10.1016/j.neuroimage.2007.12.035. [DOI] [PMC free article] [PubMed] [Google Scholar]
- Nierenberg J., Pomara N., Hoptman M.J., Sidtis J.J., Ardekani B.A., Lim K.O. Abnormal white matter integrity in healthy apolipoprotein E epsilon4 carriers. NeuroReport. 2005;16:1369–1372. doi: 10.1097/01.wnr.0000174058.49521.16. [DOI] [PubMed] [Google Scholar]
- Nowrangi M.A., Rosenberg P.B. The fornix in mild cognitive impairment and Alzheimer's disease. Front. Aging Neurosci. 2015;7(1) doi: 10.3389/fnagi.2015.00001. [DOI] [PMC free article] [PubMed] [Google Scholar]
- Papez J.W. A proposed mechanism of emotion. Arch. Neurol. Psychiatr. 1937;38:725. [Google Scholar]
- Persson J., Lind J., Larsson A., Ingvar M., Cruts M., Van Broeckhoven C., Adolfsson R., Nilsson L.-G., Nyberg L. Altered brain white matter integrity in healthy carriers of the APOE epsilon4 allele: a risk for AD? Neurology. 2006;66:1029–1033. doi: 10.1212/01.wnl.0000204180.25361.48. [DOI] [PubMed] [Google Scholar]
- Poletti C.E., Creswell G. Fornix system efferent projections in the squirrel monkey: an experimental degeneration study. J. Comp. Neurol. 1977;175:101–128. doi: 10.1002/cne.901750107. [DOI] [PubMed] [Google Scholar]
- Ringman J.M., O'Neill J., Geschwind D., Medina L., Apostolova L.G., Rodriguez Y., Schaffer B., Varpetian A., Tseng B., Ortiz F., Fitten J., Cummings J.L., Bartzokis G. Diffusion tensor imaging in preclinical and presymptomatic carriers of familial Alzheimer's disease mutations. Brain. 2007;130:1767–1776. doi: 10.1093/brain/awm102. [DOI] [PubMed] [Google Scholar]
- Roher A.E., Weiss N., Kokjohn T.A., Kuo Y.-M., Kalback W., Anthony J., Watson D., Luehrs D.C., Sue L., Walker D., Emmerling M., Goux W., Beach T. Increased A beta peptides and reduced cholesterol and myelin proteins characterize white matter degeneration in Alzheimer's disease. Biochemistry. 2002;41:11080–11090. doi: 10.1021/bi026173d. [DOI] [PubMed] [Google Scholar]
- Rose S.E., McMahon K.L., Janke A.L., O'Dowd B., de Zubicaray G., Strudwick M.W., Chalk J.B. Diffusion indices on magnetic resonance imaging and neuropsychological performance in amnestic mild cognitive impairment. J. Neurol. Neurosurg. Psychiatry. 2006;77:1122–1128. doi: 10.1136/jnnp.2005.074336. [DOI] [PMC free article] [PubMed] [Google Scholar]
- Salat D.H., Tuch D.S., Greve D.N., van der Kouwe A.J.W., Hevelone N.D., Zaleta A.K., Rosen B.R., Fischl B., Corkin S., Rosas H.D., Dale A.M. Age-related alterations in white matter microstructure measured by diffusion tensor imaging. Neurobiol. Aging. 2005;26:1215–1227. doi: 10.1016/j.neurobiolaging.2004.09.017. [DOI] [PubMed] [Google Scholar]
- Schmitt F.A., Nelson P.T., Abner E., Scheff S., Jicha G.A., Smith C., Cooper G., Mendiondo M., Danner D.D., Van Eldik L.J., Caban-Holt A., Lovell M.A., Kryscio R.J. University of Kentucky Sanders-Brown healthy brain aging volunteers: donor characteristics, procedures and neuropathology. Curr. Alzheimer Res. 2012;9:724–733. doi: 10.2174/156720512801322591. [DOI] [PMC free article] [PubMed] [Google Scholar]
- Shaw L.M., Vanderstichele H., Knapik-Czajka M., Clark C.M., Aisen P.S., Petersen R.C., Blennow K., Soares H., Simon A., Lewczuk P., Dean R., Siemers E., Potter W., Lee V.M.-Y., Trojanowski J.Q. Cerebrospinal fluid biomarker signature in Alzheimer's disease neuroimaging initiative subjects. Ann. Neurol. 2009;65:403–413. doi: 10.1002/ana.21610. [DOI] [PMC free article] [PubMed] [Google Scholar]
- Smith S.M. Fast robust automated brain extraction. Hum. Brain Mapp. 2002;17:143–155. doi: 10.1002/hbm.10062. [DOI] [PMC free article] [PubMed] [Google Scholar]
- Smith S.M., Jenkinson M., Johansen-Berg H., Rueckert D., Nichols T.E., Mackay C.E., Watkins K.E., Ciccarelli O., Cader M.Z., Matthews P.M., Behrens T.E.J. Tract-based spatial statistics: voxelwise analysis of multi-subject diffusion data. NeuroImage. 2006;31:1487–1505. doi: 10.1016/j.neuroimage.2006.02.024. [DOI] [PubMed] [Google Scholar]
- Sullivan E.V., Rohlfing T., Pfefferbaum A. Quantitative fiber tracking of lateral and interhemispheric white matter systems in normal aging: relations to timed performance. Neurobiol. Aging. 2010;31:464–481. doi: 10.1016/j.neurobiolaging.2008.04.007. [DOI] [PMC free article] [PubMed] [Google Scholar]
- Thiebaut de Schotten M., Ffytche D.H., Bizzi A., Dell'Acqua F., Allin M., Walshe M., Murray R., Williams S.C., Murphy D.G.M., Catani M. Atlasing location, asymmetry and inter-subject variability of white matter tracts in the human brain with MR diffusion tractography. NeuroImage. 2011;54:49–59. doi: 10.1016/j.neuroimage.2010.07.055. [DOI] [PubMed] [Google Scholar]
- Thompson P.M., Mega M.S., Woods R.P., Zoumalan C.I., Lindshield C.J., Blanton R.E., Moussai J., Holmes C.J., Cummings J.L., Toga A.W. Cortical change in Alzheimer's disease detected with a disease-specific population-based brain atlas. Cereb. Cortex. 2001;11:1–16. doi: 10.1093/cercor/11.1.1. [DOI] [PubMed] [Google Scholar]
- Wassermann D., Bloy L., Kanterakis E., Verma R., Deriche R. Unsupervised white matter fiber clustering and tract probability map generation: applications of a Gaussian process framework for white matter fibers. NeuroImage. 2010;51:228–241. doi: 10.1016/j.neuroimage.2010.01.004. [DOI] [PMC free article] [PubMed] [Google Scholar]
- Wechsler D. Psychological Corporation; 1997. Wechsler Memory Scale (WMS-III) [Google Scholar]
- Xu J., Chen S., Ahmed S.H., Chen H., Ku G., Goldberg M.P., Hsu C.Y. Amyloid-beta peptides are cytotoxic to oligodendrocytes. J. Neurosci. 2001;21:RC118. doi: 10.1523/JNEUROSCI.21-01-j0001.2001. [DOI] [PMC free article] [PubMed] [Google Scholar]
- Zhang Y., Brady M., Smith S. Segmentation of brain MR images through a hidden Markov random field model and the expectation-maximization algorithm. IEEE Trans. Med. Imaging. 2001;20:45–57. doi: 10.1109/42.906424. [DOI] [PubMed] [Google Scholar]
- Zhu Z., Johnson N.F., Kim C., Gold B.T. Reduced frontal cortex efficiency is associated with lower white matter integrity in aging. Cereb. Cortex. 2015;25:138–146. doi: 10.1093/cercor/bht212. [DOI] [PMC free article] [PubMed] [Google Scholar]
Associated Data
This section collects any data citations, data availability statements, or supplementary materials included in this article.
Supplementary Materials
Supplementary material