

Abstract
The large number of compounds that need to be tested for developmental neurotoxicity drives the need to establish in vitro models to evaluate specific neurotoxic endpoints. We used neural stem cells derived from rat neuroepithelium on embryonic day 14 to evaluate the impact of diverse toxicants on their ability to differentiate into glia and neurons: a glucocorticoid (dexamethasone), organophosphate insecticides (chlorpyrifos, diazinon, parathion), insecticides targeting the GABAA receptor (dieldrin, fipronil), heavy metals (Ni2+, Ag+), nicotine and tobacco smoke extract. We found three broad groupings of effects. One diverse set of compounds, dexamethasone, the organophosphate pesticides, Ni2+ and nicotine, suppressed expression of the glial phenotype while having little or no effect on the neuronal phenotype. The second pattern was restricted to the pesticides acting on GABAA receptors. These compounds promoted the glial phenotype and suppressed the neuronal phenotype. Notably, the actions of compounds eliciting either of these differentiation patterns were clearly unrelated to deficits in cell numbers: dexamethasone, dieldrin and fipronil all reduced cell numbers, whereas organophosphates and Ni2+ had no effect. The third pattern, shared by Ag+ and tobacco smoke extract, clearly delineated cytotoxicity, characterized major cell loss with suppression of differentiation into both glial and neuronal phenotypes; but here again, there was some selectivity in that glia were suppressed more than neurons. Our results, from this survey with diverse compounds, point to convergence of neurotoxicant effects on a specific “decision node” that controls the emergence of neurons and glia from neural stem cells.
Keywords: Dexamethasone, Insecticides, Neural stem cells, Metals, Nicotine, Tobacco Smoke
1. INTRODUCTION
The explosive rise in the incidence of neurodevelopmental disorders, termed a “silent pandemic,” is due in large measure to the widespread increase in environmental exposures to neurotoxic chemicals (Grandjean and Landrigan 2006, 2014). There are tens of thousands of chemicals in common industrial use, of which up to 25% are estimated to be neurotoxic (Boyes 2001). However, few have been sufficiently tested for developmental neurotoxicity. It is not feasible to assess the potential of this huge number of compounds to disrupt nervous system development using classical in vivo approaches, reinforcing the need to develop higher-throughput in vitro systems to facilitate such evaluations. Currently, the most common endpoints studied for in vitro models typically relate to factors leading to deficits in the number of neurons: antimitotic activity, apoptosis and cytotoxicity (Bagchi et al., 1995; Culbreth et al., 2012; Druwe et al., 2015; Slotkin et al., 2007; Slotkin and Seidler 2012). These outcomes readily lend themselves to high-throughput screening (Druwe et al., 2015). However, progress must be made to model more complex cellular processes than simple survival and proliferation. There are more subtle effects of neurotoxicants that are likely to be important at lower exposures that are not cytotoxic. As one prominent example, neuronotypic PC12 cells can be used to evaluate adverse effects on neurite extension (Radio et al., 2008; Song et al., 1998) and differentiation into specific neurotransmitter phenotypes (Jameson et al., 2006b; Slotkin 2005; Slotkin et al., 2007). For this reason, different cell types are needed in order to model the impact of chemicals on the various processes that control neural cell development (Coecke et al., 2007; Costa 1998; van Thriel et al., 2012).
Our earlier work with the PC12 model showed how many of the adverse effects of organophosphate pesticides on brain development in vivo are exerted directly on neurodifferentiation at the cellular level, leading to impaired neurite formation and diversion of differentiation away from the acetylcholine phenotype and toward the dopamine phenotype (Jameson et al., 2006b; Slotkin 2005; Slotkin et al., 2007). Additionally, we found that there are common endpoints for otherwise unrelated neurotoxicants, potentially explaining why diverse compounds can produce similar neurodevelopmental outcomes. In addition to the organophosphates, these included glucocorticoids (dexamethasone), insecticides targeting the GABAA receptor (dieldrin, fipronil), heavy metals (divalent nickel, monovalent silver), nicotine and tobacco smoke extract (TSE); all were antimitotic in undifferentiated PC12 cells and diverted the neurotransmitter phenotype in differentiating cells (Jameson et al., 2006a; Lassiter et al., 2009; Slotkin et al., 2007, 2014). These studies indicated that, rather than just classifying toxicants by chemical class (e.g. organophosphates), or by a single mechanism of systemic toxicity (e.g. acetylcholinesterase inhibition), it may be useful to group the toxicants by their common downstream effects on complex cellular processes (“mode of action”).
Nevertheless, there are two distinct limitations of the PC12 model: it is a transformed cell line, and it is already committed to a neuronal phenotype. Accordingly, the current study addresses the issue of whether the ability of diverse neurotoxicants to redirect neurodifferentiation extends to earlier stages of development, at the point where neural stem cells (NSCs) have the choice to become neurons or glia, and whether such diversion occurs in non-transformed cells. We used NSCs derived from rat neuroepithelium on embryonic day 14, a stage in brain development where the phenotypic derivation of neurons and glia is first determined (Dotan et al., 2010; Rodier 1988), and focused on the ability of otherwise unrelated neurotoxicants to alter differentiation fate. Most studies of developmental neurotoxicity focus on neurons, but glia are also a target for toxicant effects (Aschner 2000; Aschner et al., 1999; Garcia et al., 2005). Glia provide critical nutritional, structural and homeostatic support that are essential to architectural modeling of the brain and to the establishment and maintenance of synaptic function (Aschner et al., 1999); glia provide antioxidant activity that protects neurons from toxicants (Sagara et al., 1993), a potentially important factor in protection from organophosphates (Garcia et al., 2001; Pizzurro et al., 2014) or glucocorticoids (Chou 1998). For neurotoxicity in the adult, effects on the glia/neuron ratio can be used as an index of neurotoxicity (O’Callaghan 1983, 1988). Our studies were modeled on our previous work with PC12 cells, encompassing the same diverse classes of neurotoxicants, focusing on their ability to alter differentiation fate in embryonic NSCs, and specifically distinguishing whether diversion of phenotype is independent of the ability of the agents to affect cell numbers.
2. MATERIALS AND METHODS
2.1. Cell cultures and treatments
Primary neural stem cells (passage zero) were isolated from rat cortical neuroepithelium on embryonic day 14 and were shipped frozen in DMEM/F-12 medium with N2 supplement (see Materials, below) and 10% dimethylsulfoxide (DMSO). Cells were thawed and plated at 35,000 cells/cm2 on 12 mm coverslips pre-coated with poly-L-ornithine, contained in 24-well culture plates. The culture medium consisted of DMEM/F-12, GlutaMAX™ with N2 Supplement, 20 ng/ml human fibroblast growth factor and 20 ng/ml epidermal growth factor. Cultures were maintained in a humidified incubator at 37° C with 5% CO2. Twenty four hours later, the medium was changed to initiate spontaneous differentiation by eliminating the two growth factors, with the addition of 200 μM ascorbic acid and the test compounds. Due to the limited water solubility of chlorpyrifos, diazinon, parathion, dieldrin, fipronil and TSE, they were dissolved in DMSO to achieve a final vehicle concentration in the medium of 0.05%, or in the case of the high TSE concentration (see Results), 0.2%. We performed preliminary studies with those concentrations of DMSO and found no statistically significant changes in any of the parameters, although the higher DMSO concentration tended (0.05 < p< 0.1) to decrease the percentage of cells differentiating into neurons (data not shown); likewise, although we did not use it in the ensuing studies, we evaluated 0.1% methanol as an alternative vehicle for lipophilic substances, and found no adverse effects. For experiments with agents dissolved in DMSO, the vehicle was also added to the controls at the appropriate concentration. Exposures were conducted for a period of 3 or 6 days as indicated; after 3 days, half the medium was replaced, including the indicated treatment agents.
At the end of the exposure period, the medium was removed and the coverslips washed with Dulbecco’s phosphate-buffered saline, fixed with 4% paraformaldehyde and washed three times with Dulbecco’s phosphate-buffered saline containing additional Ca2+ and Mg2+ (see Materials, below). Cells were permeabilized for 30 min in phosphate buffered saline containing 0.2% Triton X-100, washed three times with phosphate buffered saline (without Triton), followed by a 30 min incubation in BlockAid™ solution. Cells expressing a neuronal or astroglial phenotype were identified by immunocytochemistry according to manufacturers’ instructions, using microtubule-associated protein 2 (MAP2) for neurons and glial fibrillary acidic protein (GFAP) for astroglia. After permeabilization, the coverslips were incubated for 1 h at room temperature using rabbit anti-MAP2 (1:200) and rat anti-GFAP (1:20) in BlockAid™. Coverslips were rinsed four times with phosphate-buffered saline and then incubated for 1 h at room temperature with the appropriate fluor-conjugated secondary antibodies (donkey anti-rabbit IgG Alexa Fluor 647 and goat anti-rat IgG Alexa Fluor 555) diluted 1:400 in BlockAid™. After an additional five rinses with phosphate buffered saline, coverslips were incubated for 5 min with 300 nM DAPI nucleic acid stain to label individual cells. Coverslips were rinsed three times with phosphate buffered saline and mounted onto glass slides using ProLong Diamond Antifade mountant. Images of 3 to 4 fields/slide (each field = 3.22 × 105 μm2) were captured using a Zeiss Axio Imager widefield fluorescence microscope with 200× magnification and quantified for total cells (DAPI-positive stain for nuclei); across the multiple fields in a given culture, thousands of cells were counted. Each cell was then examined to see if it expressed a neuronal phenotype (MAP2-positive) or a glial phenotype (GFAP-positive). A cell was counted as positive only when the stain for a given phenotype coincided with a DAPI-stained nucleus. Values were averaged across the fields to render a single value for each culture. Representative images are shown in Figure 1. We did not evaluate the third potential differentiation phenotype, oligodendrocytes, because they represent a much smaller proportion than neurons or glia when NSCs are derived at this early stage of embryonic brain development (Dotan et al., 2010).
Figure 1.
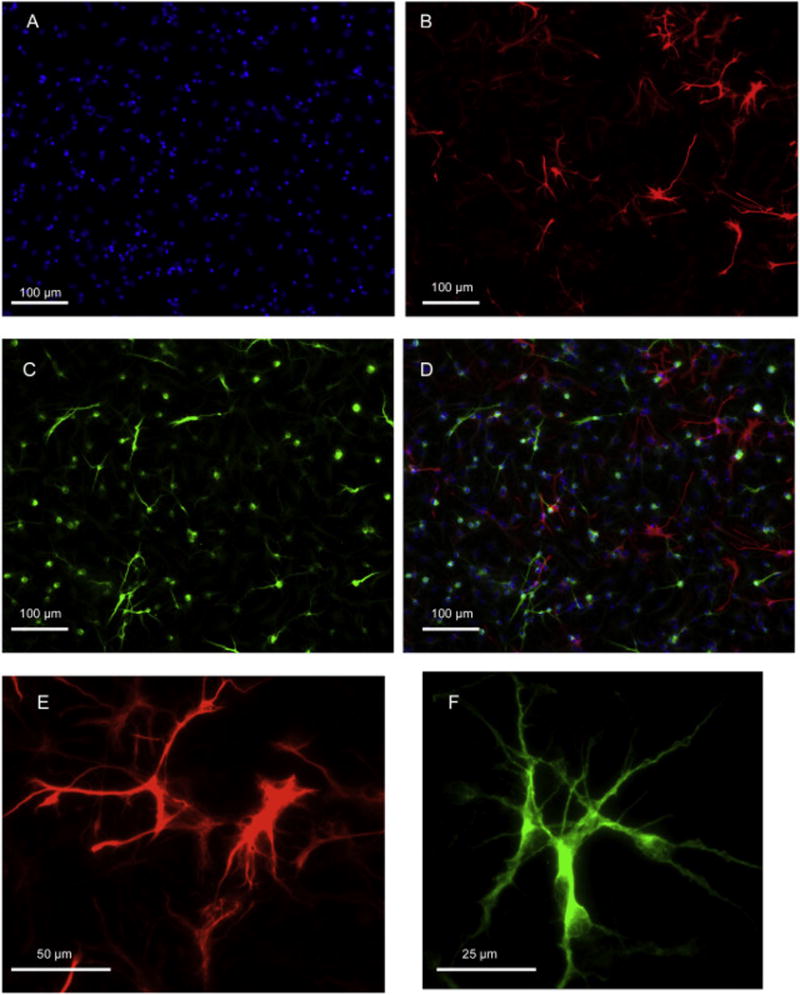
Representative 200× photomicrographs of NSCs after 6 days of differentiation, false-colored: DAPI=blue, GFAP=red, MAP2=green. (A) DAPI stain for nuclei; (B) GFAP stain for astroglia; (C) MAP2 stain for neurons. (D) Superimposition of all three images. (E) Astrocytes at greater magnification; (F) neuron at greater magnification.
2.2 Data analysis
Each study was performed using multiple batches of cells, with several independent cultures for each treatment in each batch; each batch of cells comprised a separately prepared, frozen and thawed aliquot. Results are presented as mean ± SE, with treatment comparisons carried out by analysis of variance (ANOVA) followed by Fisher’s Protected Least Significant Difference Test for post-hoc comparisons of individual treatments. The initial comparisons included the factor of cell batch, and in each case, we found that the treatment effects for each type of experiment were the same across the different batches of cells, although the absolute values differed from batch to batch. Accordingly, we normalized the results across batches prior to combining them for presentation. Significance for all tests was assumed at p < 0.05 (two-tailed).
2.3 Materials
Primary rat embryonic neural stem cells, N2 supplement and human fibroblast growth factor were purchased from MTI-GlobalStem (Gaithersburg, MD). DMEM/F-12, GlutaMAX™, Dulbecco’s phosphate-buffered saline, Dulbecco’s phosphate-buffered saline with Ca2+ and Mg2+, BlockAid™ blocking solution, rat anti-GFAP, donkey anti-rabbit IgG Alexa Fluor 647, goat anti-rat IgG Alexa Fluor 555, DAPI nucleic acid stain and ProLong Diamond Antifade mountant were acquired from Thermo Fisher Scientific (Waltham, MA). Rabbit anti-MAP2 was purchased from EMD Millipore Headquarters (Billerica, MA). Chlorpyrifos, parathion, diazinon, dieldrin and fipronil were obtained from Chem Service Inc. (West Chester, PA).
TSE was prepared by Arista Laboratories (Richmond, VA); Kentucky Reference cigarettes (KY3R4F) were smoked on a Rotary Smoke Machine under ISO conditions (International Organization for Standardization, Geneva, Switzerland). The smoke condensate was collected on 92 mm filter pads, which were then extracted by shaking for 20 min with DMSO, to obtain a solution of approximately 20 mg of condensate per ml. Condensate aliquots were stored in amber vials at −80°C until used. Two cigarettes were smoked to produce each ml of extract and the final product contained 0.8 mg/ml (5 mM) nicotine.
All other chemicals were purchased from Sigma-Aldrich (St. Louis, MO).
3. RESULTS
Over the course from the first day in culture to 3 days in culture, NSCs showed an increase in cell numbers of approximately three-fold (data not shown), and them from 3 to 6 days, there was a smaller increase (Figure 2A); across multiple batches of cells, the overall increase between days 1 and 6 ranged from 7–9-fold. Likewise, there was an increase in the degree of differentiation with time (Figure 2B). The latter change was associated with increases in both the glial (Figure 2C) and neuronal (Figure 2D) phenotype, although the percentage of neurons was much higher than that of glia (note different y-axis scales for Figures 2C and 2D). Treatment with dexamethasone elicited a concentration-dependent reduction in cell numbers (Figure 2A) but no change in the percentage of cells that were differentiated (Figure 2B). However, dexamethasone specifically impaired emergence of the glial phenotype (Figure 2C) whereas the neuronal phenotype was entirely spared (Figure 2D); the fact that overall differentiation was not significantly reduced reflected the small proportion of differentiated cells expressing the glial phenotype, so that the impact on total differentiation of even a 40% reduction in glia was offset by small (nonsignificant) increases in the neuronal phenotype. Thus, the glia/neuron ratio was robustly decreased by dexamethasone (Figure 2E). For the ensuing experiments, we included a group exposed to 10 μM dexamethasone to serve as a positive control, although for concision, this group is not included in the subsequent figures.
Figure 2.
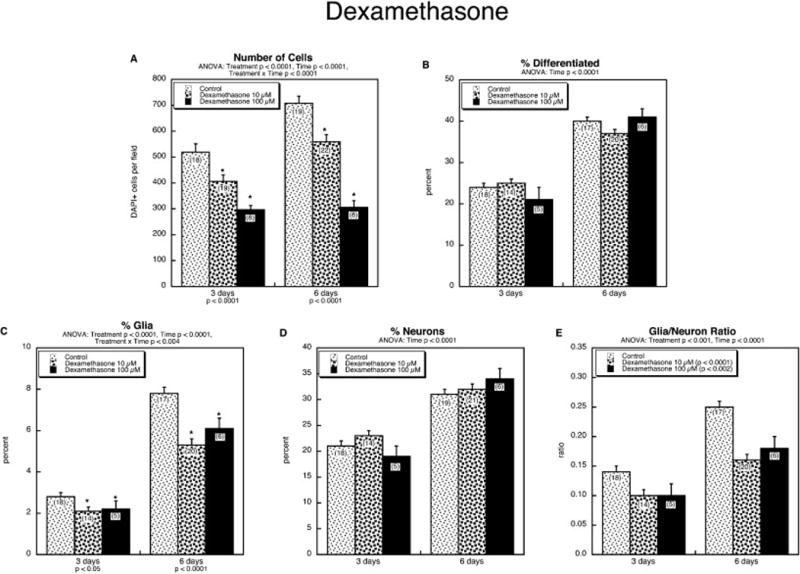
Effects of dexamethasone on NSC differentiation: (A) numbers of cells, (B) percentage of cells showing differentiation into neurons or glia, (C) percentage of glia, (D) percentage of neurons, (E) glia/neuron ratio. Data represent means and standard errors of the number of determinations shown in parentheses. ANOVA appears at the top of each panel. Where there was a treatment × time interaction, lower order tests for each time point are shown at the bottom, and asterisks denote individual values that differ from the corresponding control; in the absence of a significant interaction, only the main treatment effects are indicated, within the legend box.
We next performed a more extensive concentration profile for chlorpyrifos. In contrast to dexamethasone, chlorpyrifos had only minor effects on cell numbers, with no clear concentration-response relationship (Figure 3A). Chlorpyrifos enhanced the percentage of differentiated cells at one of the concentrations (20 μM), but even then, the effect was quite small (Figure 3B). However, like dexamethasone, chlorpyrifos produced a large decrement in differentiation into the glial phenotype (Figure 3C). Its effects on the neuronal phenotype were more complex (Figure 3D): chlorpyrifos evoked a concentration-dependent enhancement up to 20 μM, but the effect receded at a higher concentration. The combination of reduced glial phenotype and enhanced neuronal phenotype resulted in a large decline in the glia/neuron ratio (Figure 3E).
Figure 3.
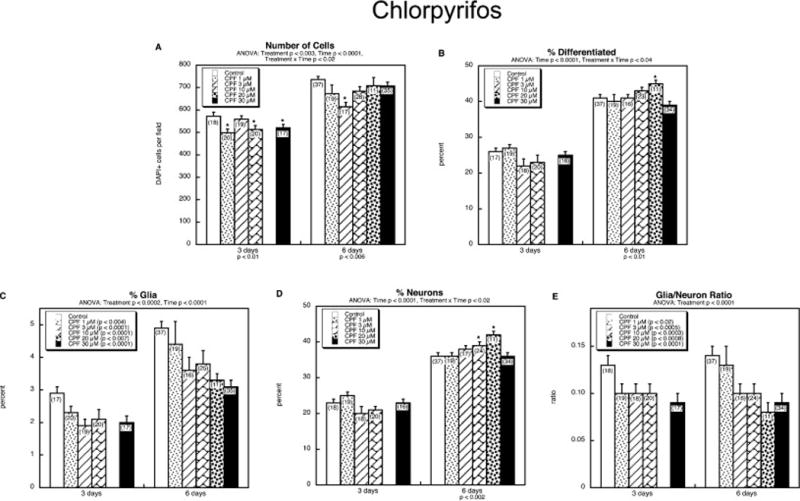
Effects of chlorpyrifos (CPF) on NSC differentiation: (A) numbers of cells, (B) percentage of cells showing differentiation into neurons or glia, (C) percentage of glia, (D) percentage of neurons, (E) glia/neuron ratio. Data represent means and standard errors of the number of determinations shown in parentheses. ANOVA appears at the top of each panel. Where there was a treatment × time interaction, lower order tests for each time point are shown at the bottom, and asterisks denote individual values that differ from the corresponding control; in the absence of a significant interaction, only the main treatment effects are indicated within the legend box.
In light of the results with dexamethasone and chlorpyrifos, the subsequent studies were conducted with 6 days of exposure at a final concentration of 30 μM for each agent, except where otherwise indicated.
We next compared effects of three organophosphate pesticides, chlorpyrifos, diazinon and parathion. None of the three had a significant impact on cell number (Figure 4A) or on the overall percentage of cells showing differentiation (Figure 4B). However, all three had a major impact on differentiation into the glial phenotype, (Figure 4C) without affecting emergence of the neuronal phenotype (Figure 4D). Consequently, there was a significant decline in the glia/neuron ratio (Figure 4E). The effects on the glial phenotype were equivalent among the three different organophosphates.
Figure 4.
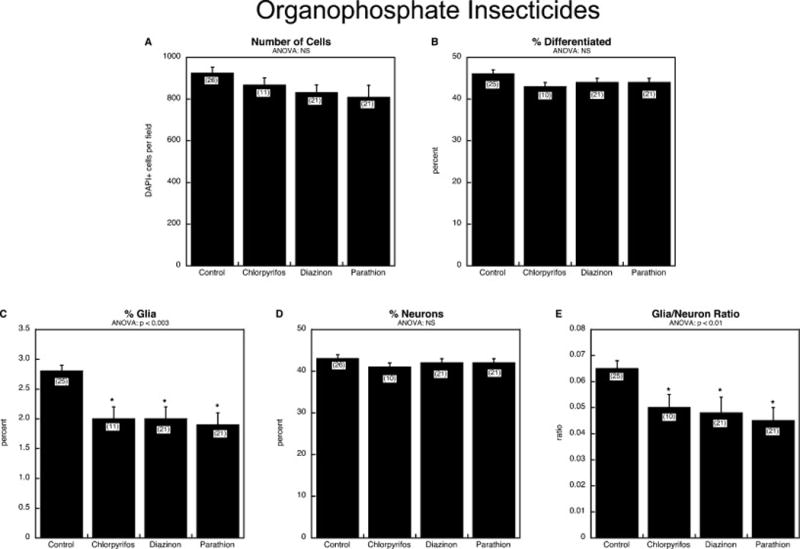
Comparative effects of organophosphate insecticides, chlorpyrifos, diazinon and parathion: (A) numbers of cells, (B) percentage of cells showing differentiation into neurons or glia, (C) percentage of glia, (D) percentage of neurons, (E) glia/neuron ratio. Studies were done with 6 days of exposure to a 30 μM concentration of each agent. Data represent means and standard errors of the number of determinations shown in parentheses. ANOVA appears at the top of each panel and asterisks denote individual values that differ from the corresponding control. Abbreviation: NS, not significant.
In contrast to the organophosphates, insecticides targeting the GABAA receptor had a large impact on cell number (Figure 5A), with a significantly greater effect of dieldrin as compared to fipronil (p < 0.04). The impact of the two compounds on overall differentiation was quite different: dieldrin suppressed differentiation, whereas fipronil did not (Figure 5B). Both dieldrin and fipronil shifted the differentiation phenotype in a direction opposite to that of the organophosphates, promoting emergence of glia (Figure 5C) at the expense of neurons (Figure 5D), and consequently, there was a robust increase in the glia/neuron ratio (Figure 5E). Notwithstanding the similar directions of change for dieldrin and fipronil, they differed in their relative effects toward each phenotype, with fipronil showing greater promotion of the glial phenotype (Figure 5C; p < 0.0001) and dieldrin showing greater suppression of the neuronal phenotype (Figure 5D; p < 0.0001). Indeed, for fipronil, the enhanced emergence of the glial phenotype was so large that the absolute numbers of glial cells were increased 80% over control, despite the overall decline in total cell numbers: control, 103 ± 4 GFAP-positive cells per field; fipronil, 182 ± 19, p < 0.0001.
Figure 5.
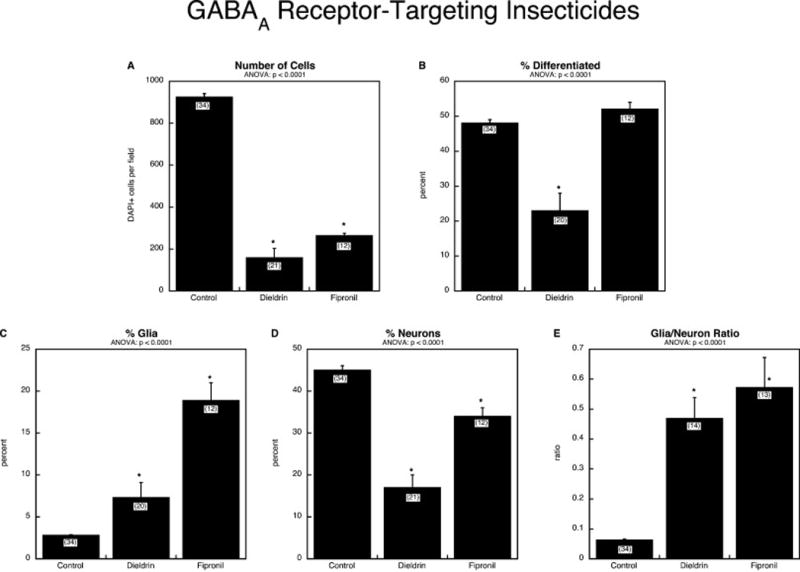
Comparative effects of insecticides targeting the GABAA receptor, dieldrin and fipronil: (A) numbers of cells, (B) percentage of cells showing differentiation into neurons or glia, (C) percentage of glia (note different y-axis scale vs. Panel C of other figures), (D) percentage of neurons, (E) glia/neuron ratio (note different y-axis scale vs. Panel E of other figures). Studies were done with 6 days of exposure to a 30 μM concentration of each agent. Data represent means and standard errors of the number of determinations shown in parentheses. ANOVA appears at the top of each panel and asterisks denote individual values that differ from the corresponding control.
We next compared the effects of two neurotoxic metals, divalent nickel and monovalent silver. Based on our earlier work with PC12 cells, we expected that Ag+ would be cytotoxic but Ni2+ would not (Powers et al., 2010; Slotkin et al., 2007), thus providing a clear contrast between cytotoxicity and the specific targeting of differentiation. Exposure to Ni2+ had no effect on the number of cells, whereas Ag+ elicited a profound decrease (Figure 6A). Nevertheless, Ni2+ had an impact on differentiation, reducing the overall percentage of differentiated cells (Figure 6B), especially so for glia (Figure 6C); neurons were less affected, just at the margin of statistical significance (p < 0.06, Figure 6D), but the reduction in neurons clearly contributed to the significant overall decline in differentiated cells (Figure 6B). The greater effect of Ni2+ on the glial phenotype resulted in a sharp decline in the glia/neuron ratio (Figure 6E). Given its cytotoxicity, it was not surprising that Ag+ exposure reduced almost to zero the overall percentage of cells undergoing differentiation (Figure 6B), as well as differentiation into the glial phenotype (Figure 6C) and neuronal phenotype (Figure 6D), although again, the glia/neuron ratio declined, indicative of greater susceptibility of glia compared to neurons (Figure 6E).
Figure 6.
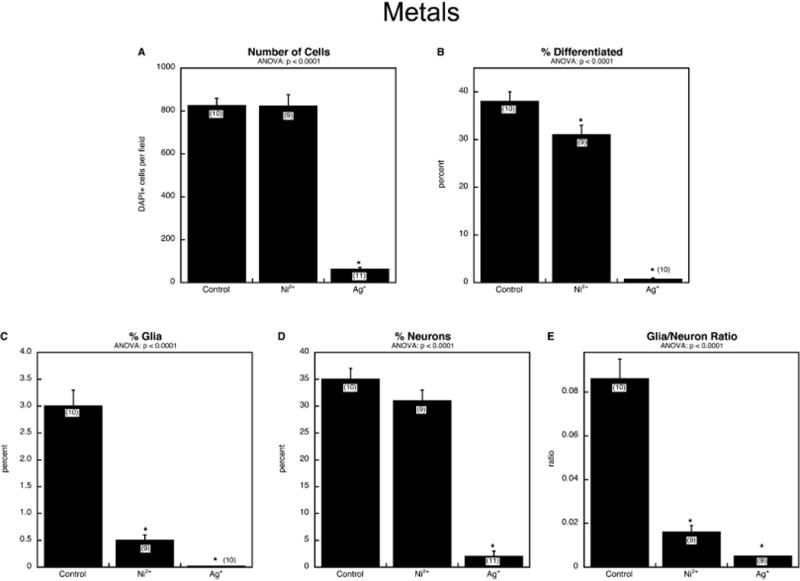
Comparative effects of Ni2+ and Ag+: (A) numbers of cells, (B) percentage of cells showing differentiation into neurons or glia, (C) percentage of glia (note different y-axis scale), (D) percentage of neurons, (E) glia/neuron ratio. Studies were done with 6 days of exposure to a 30 μM concentration of each agent. Data represent means and standard errors of the number of determinations shown in parentheses. ANOVA appears at the top of each panel and asterisks denote individual values that differ from the corresponding control.
Finally, we compared the effects of nicotine to TSE. By itself, nicotine had little effect on cell numbers, even up to a concentration of 100 μM (Figure 7A). In contrast, TSE at an equivalent nicotine concentration of 1 μM evoked a significant reduction, and a ten-fold higher concentration produced massive cell loss. Likewise, nicotine had no discernible effect on the overall percentage of differentiated cells, whereas TSE elicited a concentration-dependent reduction (Figure 7B). However, nicotine was not totally devoid of effect, as it impaired emergence of the glial phenotype at the two highest concentrations (Figure 7C); again, TSE produced a greater effect, with total suppression of the glial phenotype at a concentration equivalent to 10 μM nicotine. For the neuronal phenotype, nicotine was without effect but TSE elicited significant reductions; at the higher TSE concentration, the effect was smaller than for the glial phenotype. As a consequence, the glia/neuron ratio was reduced by nicotine at 30 and 100 μM, and by TSE at a concentration equivalent to 10 μM nicotine (Figure 7E).
Figure 7.
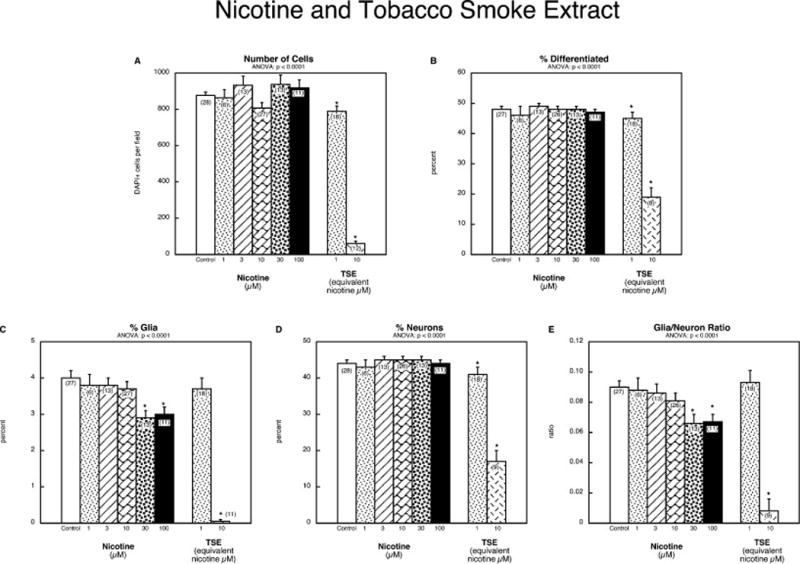
Comparative effects of nicotine and tobacco smoke extract (TSE): (A) numbers of cells, (B) percentage of cells showing differentiation into neurons or glia, (C) percentage of glia, (D) percentage of neurons, (E) glia/neuron ratio. Studies were done with 6 days of exposure to the indicated concentration of each agent. Data represent means and standard errors of the number of determinations shown in parentheses. ANOVA appears at the top of each panel and asterisks denote individual values that differ from the corresponding control.
4. DISCUSSION
Our results point to a common mechanism by which otherwise unrelated developmental neurotoxicants converge on a specific “decision node” in neurodifferentiation, diverting the formation of neurons vs. glia in embryonic NSCs. Notably, these effects display a diversity of outcomes dependent on the neurotoxicant class, thus standing in contradistinction from common endpoints such as cytotoxicity or apoptosis that fail to distinguish among the classes (Culbreth et al., 2012; Druwe et al., 2015). The effects reported here also show major differences from those at a later decision node, the point at which neurotransmitter choice is selected; as modeled in PC12 cells, the various compounds all produce similar patterns, namely a switch from the cholinergic to the dopaminergic phenotype (Jameson et al., 2006a, b; Lassiter et al., 2009; Powers et al., 2010; Slotkin et al., 2007). Furthermore, the effects on NSC differentiation occurred independently of the ability of the compounds to elicit a reduction in cell number or cytotoxicity. Although some agents evoked reductions in cell numbers, there were effects on neuronal vs. glial phenotypes regardless of whether such reductions were present or absent. Indeed, a reduction in the number of cells alone does not necessarily connote cytotoxicity: the compounds are also antimitotic (Jameson et al., 2006a, b; Lassiter et al., 2009; Powers et al., 2010; Slotkin et al., 2007), and as shown by our time course studies, the NSC cultures are acquiring cells through active cell replication even while differentiation proceeds. Since the cell numbers increased 7–9-fold in the control samples over the 6 day treatment period, antimitotic effects could readily account for most of the reductions in cell numbers. In contrast, cytotoxicity can be demonstrated by a specific pattern, which consists of reduced cell numbers and impaired differentiation into both phenotypes, as would be expected from generalized toxic effects. With these criteria, the only agents showing clear cytotoxicity were Ag+ and the higher dose of TSE.
All other treatments fostered differentiation into specific phenotypes regardless of whether cell numbers were reduced. In that regard, the present results reinforce earlier findings with the PC12 model, that likewise showed diversion of differentiation phenotypes at concentrations below the threshold for cytotoxicity (Jameson et al., 2006a, b; Lassiter et al., 2009; Powers et al., 2010; Slotkin et al., 2007).
We found three broad groupings of effects on NSC differentiation. One diverse set of compounds included dexamethasone, the organophosphate pesticides, Ni2+ and nicotine, all of which suppressed expression of the glial phenotype with little or no impairment of the neuronal phenotype; consequently, these all showed a fall in the glia/neuron ratio. The second pattern was restricted to dieldrin and fipronil, the pesticides acting on GABAA receptors. These greatly increased the glia/neuron ratio via selective promotion of the glial phenotype and suppression of the neuronal phenotype. Notably, the actions of compounds eliciting either of these differentiation patterns were clearly unrelated to deficits in cell numbers: dexamethasone, dieldrin and fipronil all reduced the number of cells, whereas the organophosphates and Ni2+ did not. The third pattern, shared by Ag+ and the high concentration of TSE, was one that clearly delineated cytotoxicity: major cell loss with suppression of differentiation into both phenotypes, but here again, there was some selectivity in that glia were suppressed more than neurons, dropping the glia/neuron ratio.
The outcomes for toxicant effects on NSCs vs. PC12 cells (Jameson et al., 2006a, b; Lassiter et al., 2009; Powers et al., 2010; Slotkin et al., 2007) indicate that there are at least two distinct decision nodes in neurodifferentiation, the decision to become neurons or glia, and the choice of neurotransmitter, and that neurotoxicants act differently at the two nodes. But to what extent do the effects on NSCs reflect actions seen in vivo or in other in vitro models of neural cell development? Dexamethasone in vivo inhibits NSC proliferation in the developing brain without producing apoptosis (Ichinohashi et al., 2013), whereas the predominant effect in the adult is cell death (Bhatt et al., 2013); this reinforces the stage-specific nature of toxicant effects. For the organophosphates, our finding of selective suppression of the glial phenotype matches the effects seen in vivo for chlorpyrifos administration to developing rats (Garcia et al., 2005; Roy et al., 2004, 2005), and for gliotypic cells in vitro (Garcia et al., 2001). The near equivalence of all three organophosphate pesticides seen here also holds true for the second decision node (neurotransmitter phenotype) seen in PC12 cells (Slotkin et al., 2007). In embryonic stem cell models that are not yet committed to a neural phenotype, chlorpyrifos and metabolites impair expression of genes involved in general differentiation (Estevan et al., 2013, 2014) as well as subsequent differentiation into neurons (Visan et al. 2012). This does not match what we saw here for organophosphate effects on embryonic NSCs, since we did not find general inhibition of differentiation, but rather saw only a selective suppression of the glial phenotype. The variant findings with stem cells that are not inherently neural thus points out the importance of selecting a cell model that is appropriate to the decision node of interest; in this case, NSCs are clearly closer to the events for neuronal and glial formation in the developing brain than are stem cells that are not specifically neural precursors.
Our findings with TSE and nicotine gave outcomes resembling those seen earlier with the PC12 model in that there was a much greater effect of TSE when compared to an equivalent concentration of nicotine (Slotkin et al. 2014), a relationship also found for their comparative effects with in vivo administration to developing rats (Slotkin et al. 2015). Nevertheless, PC12 cells were far more resistant to cell loss caused by TSE than were the NSCs studied here. Although nicotine effects have been evaluated in a number of stem cell models, studies of other tobacco smoke components are sparse. In human embryonic stem cells (i.e. not specifically a neural precursor), either nicotine or TSE can delay differentiation at exposures that do not cause cytotoxicity or apoptosis, but they differ in their effects on the expression of differentiation-related genes (Liszewski et al. 2012); higher concentrations of nicotine block adhesion and induce apoptosis leading to cell loss (Zdravkovic et al. 2008), effects which were not notable at the concentrations used in our study. Embryonic neural progenitors have nicotinic cholinergic receptors (Atluri et al. 2001; Schneider et al. 2002) but nicotine does not show any marked antiproliferative or apoptotic effects even at concentrations up to 100 μM (Culbreth et al. 2012). In contrast, nicotine does elicit apoptosis in undifferentiated stem cells (Berger et al. 1998), and impairs neurogenesis in the adolescent or adult hippocampus (Bruijnzeel et al. 2011; Cho and Kim 2010). Contrarily, nicotine increases proliferation in induced pluripotent stem cells (Ishizuka et al. 2012)! What are we to make of these diverse, sometimes contradictory outcomes? The key to the type of toxic effect is the nature of the target cell: the neurotoxicant actions depend critically on the type of stem cell and on its differentiation state. If the intent, as in the present study, is to model developmental neurotoxicity at the decision node corresponding to the emergence of neurons and glia, then the definitive choice is embryonic neural stem cells derived directly from the cortical epithelium at the stage where these decisions are being made in vivo. A major difference between the NSC model and a standardized, archival cell line, such as PC12 cells, is that the NSCs are derived from specific embryos with each preparation, and thus are potentially subject to greater batch-to-batch variability. Specifically, as development proceeds, the proportion of NSCs differentiating in neurons falls, whereas the glial component increases (Dotan et al. 2010). Thus, an error of a day or two in the dating of insemination can change the quantitative result of toxicant exposure, as can factors such as embryonic sex or position in the uterine horn. Here, we ensured consistency by including a positive control (dexamethasone) with each batch of cells; a small proportion of batches (<5%) gave outcomes that differed quantitatively (albeit not qualitatively) from the others, and were thus excluded. This would seem to be an important methodologic feature for any future studies of embryonic NSCs.
5. CONCLUSIONS
In conclusion, embryonic NSCs provide a valuable model to evaluate the ability of diverse neurotoxicants to affect a basic and critical event in neurodifferentiation, namely the formation of neurons and glia. Given the wide variety of neurotoxicants that produce imbalances in neurons vs. glia (O’Callaghan 1988, 1993), this is likely to represent a major underlying mechanism common to many neurotoxicants. Effects on the emergence of specific neural phenotypes are distinct from endpoints such as cytotoxicity or apoptosis, outcomes which do not distinguish among different toxicant classes, and that are not specific to neural cells. In future work, it would be useful to design and employ a high-throughput screen to evaluate differentiation into neuronal vs. glial phenotypes. However, as a final caution, the embryonic NSC model, as with almost all cell culture models, evaluates a single decision node, and is inherently incapable of evaluating toxicant effects on higher-order processes involved in brain assembly. As such, this model cannot replace the evaluation of developmental neurotoxicity with intact animals; the field very much remains, “In Vivo Veritas.”
Acknowledgments
Funding: Supported by NIH ES010356, NIH ES022831 and EPA 83543701. EPA support does not signify that the contents reflect the views of the Agency, nor does mention of trade names or commercial products constitute endorsement or recommendation for use.
Abbreviations
- ANOVA
analysis of variance
- DAPI
4′,6-diamidino-2-phenylindole
- DMSO
dimethylsulfoxide
- GFAP
glial fibrillary acidic protein
- MAP2
microtubule-associated protein 2
- NSCs
neural stem cells
- TSE
tobacco smoke extract
Footnotes
Publisher's Disclaimer: This is a PDF file of an unedited manuscript that has been accepted for publication. As a service to our customers we are providing this early version of the manuscript. The manuscript will undergo copyediting, typesetting, and review of the resulting proof before it is published in its final citable form. Please note that during the production process errors may be discovered which could affect the content, and all legal disclaimers that apply to the journal pertain.
Conflict of interest statement
TAS received consultant income in the past three years from Acorda Therapeutics (Ardsley NY), Pardieck Law (Seymour, IN) and Walgreen Co. (Deerfield, IL).
References
- Aschner M. Interactions between pesticides and glia: an unexplored experimental field. Neurotoxicology. 2000;21:175–180. [PubMed] [Google Scholar]
- Aschner M, Allen JW, Kimelberg HK, LoPachin RM, Streit WJ. Glial cells in neurotoxicity development. Annu Rev Pharmacol Toxicol. 1999;39:151–173. doi: 10.1146/annurev.pharmtox.39.1.151. [DOI] [PubMed] [Google Scholar]
- Atluri P, Fleck MW, Shen Q, Mah SJ, Stadfelt D, Barnes W, Goderie SK, Temple S, Schneider AS. Functional nicotinic acetylcholine receptor expression in stem and progenitor cells of the early embryonic mouse cerebral cortex. Dev Biol. 2001;240:143–156. doi: 10.1006/dbio.2001.0453. [DOI] [PubMed] [Google Scholar]
- Bagchi D, Bagchi M, Hassoun EA, Stohs SJ. In vitro and in vivo generation of reactive oxygen species, DNA damage and lactate dehydrogenase leakage by selected pesticides. Toxicology. 1995;104:129–140. doi: 10.1016/0300-483x(95)03156-a. [DOI] [PubMed] [Google Scholar]
- Berger F, Gage FH, Vijayaraghavan S. Nicotinic receptor-induced apoptotic cell death of hippocampal progenitor cells. J Neurosci. 1998;18:6871–6881. doi: 10.1523/JNEUROSCI.18-17-06871.1998. [DOI] [PMC free article] [PubMed] [Google Scholar]
- Bhatt AJ, Feng Y, Wang J, Famuyide M, Hersey K. Dexamethasone induces apoptosis of progenitor cells in the subventricular zone and dentate gyrus of developing rat brain. J Neurosci Res. 2013;91:1191–1202. doi: 10.1002/jnr.23232. [DOI] [PubMed] [Google Scholar]
- Boyes WK. Neurotoxicology and behavior. In: Bingham E, Cohrseen B, Powell CH, editors. Patty’s Toxicology. Fifth. John Wiley & Sons; New York: 2001. pp. 55–121. [Google Scholar]
- Bruijnzeel AW, Bauzo RM, Munikoti V, Rodrick GB, Yamada H, Fornal CA, Ormerod BK, Jacobs BL. Tobacco smoke diminishes neurogenesis and promotes gliogenesis in the dentate gyrus of adolescent rats. Brain Res. 2011;1413:32–42. doi: 10.1016/j.brainres.2011.07.041. [DOI] [PubMed] [Google Scholar]
- Cho KO, Kim SY. Effects of brain insults and pharmacological manipulations on the adult hippocampal neurogenesis. Arch Pharmacal Res. 2010;33:1475–1488. doi: 10.1007/s12272-010-1002-y. [DOI] [PubMed] [Google Scholar]
- Chou YC. Corticosterone exacerbates cyanide-induced cell death in hippocampal cultures: role of astrocytes. Neurochem Intl. 1998;32:219–226. doi: 10.1016/s0197-0186(97)00093-4. [DOI] [PubMed] [Google Scholar]
- Coecke S, Goldberg AM, Allen S, Buzanska L, Calamandrei G, Crofton K, Hareng L, Hartung T, Knaut H, Honegger P, Jacobs M, Lein P, Li A, Mundy W, Owen D, Schneider S, Silbergeld E, Reum T, Trnovec T, Monnet-Tschudi F, Bal-Price A. Workshop report: incorporating in vitro alternative methods for developmental neurotoxicity into international hazard and risk assessment strategies. Environ Health Perspect. 2007;115:924–931. doi: 10.1289/ehp.9427. [DOI] [PMC free article] [PubMed] [Google Scholar]
- Costa LG. Neurotoxicity testing: a discussion of in vitro alternatives. Environ Health Perspect. 1998;106(Suppl. 2):505–510. doi: 10.1289/ehp.98106505. [DOI] [PMC free article] [PubMed] [Google Scholar]
- Culbreth ME, Harrill JA, Freudenrich TM, Mundy WR, Shafer TJ. Comparison of chemical-induced changes in proliferation and apoptosis in human and mouse neuroprogenitor cells. Neurotoxicology. 2012;33:1499–1510. doi: 10.1016/j.neuro.2012.05.012. [DOI] [PubMed] [Google Scholar]
- Dotan S, Goldstein RS, Slotkin TA, Yanai J. An avian model for the reversal of neurobehavioral teratogenicity with neural stem cells. Neurotoxicol Teratol. 2010;32:481–488. doi: 10.1016/j.ntt.2010.02.003. [DOI] [PMC free article] [PubMed] [Google Scholar]
- Druwe I, Freudenrich TM, Wallace K, Shafer TJ, Mundy WR. Sensitivity of neuroprogenitor cells to chemical-induced apoptosis using a multiplexed assay suitable for high-throughput screening. Toxicology. 2015;333:14–24. doi: 10.1016/j.tox.2015.03.011. [DOI] [PubMed] [Google Scholar]
- Estevan C, Fuster E, Del Rio E, Pamies D, Vilanova E, Sogorb MA. Organophosphorus pesticide chlorpyrifos and its metabolites alter the expression of biomarker genes of differentiation in D3 mouse embryonic stem cells in a comparable way to other model neurodevelopmental toxicants. Chem Res Toxicol. 2014;27:1487–1495. doi: 10.1021/tx500051k. [DOI] [PubMed] [Google Scholar]
- Estevan C, Vilanova E, Sogorb MA. Chlorpyrifos and its metabolites alter gene expression at non-cytotoxic concentrations in D3 mouse embryonic stem cells under in vitro differentiation: considerations for embryotoxic risk assessment. Toxicol Lett. 2013;217:14–22. doi: 10.1016/j.toxlet.2012.11.026. [DOI] [PubMed] [Google Scholar]
- Garcia SJ, Seidler FJ, Crumpton TL, Slotkin TA. Does the developmental neurotoxicity of chlorpyrifos involve glial targets? Macromolecule synthesis, adenylyl cyclase signaling, nuclear transcription factors, and formation of reactive oxygen in C6 glioma cells. Brain Res. 2001;891:54–68. doi: 10.1016/s0006-8993(00)03189-9. [DOI] [PubMed] [Google Scholar]
- Garcia SJ, Seidler FJ, Slotkin TA. Developmental neurotoxicity of chlorpyrifos: targeting glial cells. Environ Toxicol Pharmacol. 2005;19:455–461. doi: 10.1016/j.etap.2004.12.007. [DOI] [PubMed] [Google Scholar]
- Grandjean P, Landrigan PJ. Developmental neurotoxicity of industrial chemicals. Lancet. 2006;368:2167–2178. doi: 10.1016/S0140-6736(06)69665-7. [DOI] [PubMed] [Google Scholar]
- Grandjean P, Landrigan PJ. Neurobehavioural effects of developmental toxicity. Lancet Neurol. 2014;13:330–338. doi: 10.1016/S1474-4422(13)70278-3. [DOI] [PMC free article] [PubMed] [Google Scholar]
- Ichinohashi Y, Sato Y, Saito A, Ito M, Watanabe K, Hayakawa M, Nakanishi K, Wakatsuki A, Oohira A. Dexamethasone administration to the neonatal rat results in neurological dysfunction at the juvenile stage even at low doses. Early Human Dev. 2013;89:283–288. doi: 10.1016/j.earlhumdev.2012.10.007. [DOI] [PubMed] [Google Scholar]
- Ishizuka T, Goshima H, Ozawa A, Watanabe Y. Effect of nicotine on the proliferation and differentiation of mouse induced pluripotent stem cells. Curr Med Chem. 2012;19:5164–5169. doi: 10.2174/092986712803530494. [DOI] [PubMed] [Google Scholar]
- Jameson RR, Seidler FJ, Qiao D, Slotkin TA. Adverse neurodevelopmental effects of dexamethasone modeled in PC12 cells: identifying the critical stages and concentration thresholds for the targeting of cell acquisition, differentiation and viability. Neuropsychopharmacology. 2006a;31:1647–1658. doi: 10.1038/sj.npp.1300967. [DOI] [PubMed] [Google Scholar]
- Jameson RR, Seidler FJ, Qiao D, Slotkin TA. Chlorpyrifos affects phenotypic outcomes in a model of mammalian neurodevelopment: critical stages targeting differentiation in PC12 cells. Environ Health Perspect. 2006b;114:667–672. doi: 10.1289/ehp.8750. [DOI] [PMC free article] [PubMed] [Google Scholar]
- Lassiter TL, MacKillop EA, Ryde IT, Seidler FJ, Slotkin TA. Is fipronil safer than chlorpyrifos? Comparative developmental neurotoxicity modeled in PC12 cells. Brain Res Bull. 2009;78:313–322. doi: 10.1016/j.brainresbull.2008.09.020. [DOI] [PMC free article] [PubMed] [Google Scholar]
- Liszewski W, Ritner C, Aurigui J, Wong SSY, Hussain N, Krueger W, Oncken C, Bernstein HS. Developmental effects of tobacco smoke exposure during human embryonic stem cell differentiation are mediated through the transforming growth factor-β superfamily member, Nodal. Differentiation. 2012;83:169–178. doi: 10.1016/j.diff.2011.12.005. [DOI] [PMC free article] [PubMed] [Google Scholar]
- O’Callaghan JP. Nervous-system specific proteins as biochemical indicators of neurotoxicity. Trends Pharmacol Sci. 1983;4:388–390. [Google Scholar]
- O’Callaghan JP. Neurotypic and gliotypic proteins as biochemical markers of neurotoxicity. Neurotoxicol Teratol. 1988;10:445–452. doi: 10.1016/0892-0362(88)90006-2. [DOI] [PubMed] [Google Scholar]
- O’Callaghan JP. Quantitative features of reactive gliosis following toxicant-induced damage of the CNS. Ann NY Acad Sci. 1993;679:195–210. doi: 10.1111/j.1749-6632.1993.tb18299.x. [DOI] [PubMed] [Google Scholar]
- Pizzurro DM, Dao K, Costa LG. Diazinon and diazoxon impair the ability of astrocytes to foster neurite outgrowth in primary hippocampal neurons. Toxicol Appl Pharmacol. 2014;274:372–382. doi: 10.1016/j.taap.2013.11.023. [DOI] [PMC free article] [PubMed] [Google Scholar]
- Powers CM, Wrench N, Ryde IT, Smith AM, Seidler FJ, Slotkin TA. Silver impairs neurodevelopment: studies in PC12 cells. Environ Health Perspect. 2010;118:73–79. doi: 10.1289/ehp.0901149. [DOI] [PMC free article] [PubMed] [Google Scholar]
- Radio NM, Breier JM, Shafer TJ, Mundy WR. Assessment of chemical effects on neurite outgrowth in PC12 cells using high content screening. Toxicol Sci. 2008;105:106–118. doi: 10.1093/toxsci/kfn114. [DOI] [PubMed] [Google Scholar]
- Rodier PM. Structural-functional relationships in experimentally induced brain damage. Prog Brain Res. 1988;73:335–348. doi: 10.1016/S0079-6123(08)60514-2. [DOI] [PubMed] [Google Scholar]
- Roy TS, Seidler FJ, Slotkin TA. Morphologic effects of subtoxic neonatal chlorpyrifos exposure in developing rat brain: regionally-selective alterations in neurons and glia. Dev Brain Res. 2004;148:197–206. doi: 10.1016/j.devbrainres.2003.12.004. [DOI] [PubMed] [Google Scholar]
- Roy TS, Sharma V, Seidler FJ, Slotkin TA. Quantitative morphological assessment reveals neuronal and glial deficits in hippocampus after a brief subtoxic exposure to chlorpyrifos in neonatal rats. Dev Brain Res. 2005;155:71–80. doi: 10.1016/j.devbrainres.2004.12.004. [DOI] [PubMed] [Google Scholar]
- Sagara J, Miura K, Bannai S. Maintenance of neuronal glutathion by glial cells. J Neurochem. 1993;62:1672–1676. doi: 10.1111/j.1471-4159.1993.tb09802.x. [DOI] [PubMed] [Google Scholar]
- Schneider AS, Atluri P, Shen Q, Barnes W, Mah SJ, Stadfelt D, Goderie SK, Temple S, Fleck MW. Functional nicotinic acetylcholine receptor expression on stem and progenitor cells of the early embryonic nervous system. Ann NY Acad Sci. 2002;971:135–138. doi: 10.1111/j.1749-6632.2002.tb04447.x. [DOI] [PubMed] [Google Scholar]
- Slotkin TA. Developmental neurotoxicity of organophosphates: a case study of chlorpyrifos. In: Gupta RC, editor. Toxicity of Organophosphate and Carbamate Pesticides. Elsevier Academic Press; San Diego: 2005. pp. 293–314. [Google Scholar]
- Slotkin TA, Card J, Stadler A, Levin ED, Seidler FJ. Effects of tobacco smoke on PC12 cell neurodifferentiation are distinct from those of nicotine or benzo[a]pyrene. Neurotoxicol Teratol. 2014;43:19–24. doi: 10.1016/j.ntt.2014.03.002. [DOI] [PMC free article] [PubMed] [Google Scholar]
- Slotkin TA, MacKillop EA, Ryde IT, Tate CA, Seidler FJ. Screening for developmental neurotoxicity using PC12 cells: comparisons of organophosphates with a carbamate, an organochlorine and divalent nickel. Environ Health Perspect. 2007;115:93–101. doi: 10.1289/ehp.9527. [DOI] [PMC free article] [PubMed] [Google Scholar]
- Slotkin TA, Seidler FJ. Developmental neurotoxicity of organophosphates targets cell cycle and apoptosis, revealed by transcriptional profiles in vivo and in vitro. Neurotoxicol Teratol. 2012;34:232–241. doi: 10.1016/j.ntt.2011.12.001. [DOI] [PMC free article] [PubMed] [Google Scholar]
- Slotkin TA, Skavicus S, Card J, Stadler A, Levin ED, Seidler FJ. Developmental neurotoxicity of tobacco smoke directed toward cholinergic and serotonergic systems: more than just nicotine. Toxicol Sci. 2015;147:178–189. doi: 10.1093/toxsci/kfv123. [DOI] [PMC free article] [PubMed] [Google Scholar]
- Song X, Violin JD, Seidler FJ, Slotkin TA. Modeling the developmental neurotoxicity of chlorpyrifos in vitro: macromolecule synthesis in PC12 cells. Toxicol Appl Pharmacol. 1998;151:182–191. doi: 10.1006/taap.1998.8424. [DOI] [PubMed] [Google Scholar]
- van Thriel C, Westerink RHS, Beste C, Bale AS, Lein PJ, Leist M. Translating neurobehavioural endpoints of developmental neurotoxicity tests into in vitro assays and readouts. Neurotoxicology. 2012;33:911–924. doi: 10.1016/j.neuro.2011.10.002. [DOI] [PMC free article] [PubMed] [Google Scholar]
- Visan A, Hayess K, Sittner D, Pohl EE, Riebeling C, Slawik B, Gulich K, Oelgeschlager M, Luch A, Seiler AEM. Neural differentiation of mouse embryonic stem cells as a tool to assess developmental neurotoxicity in vitro. Neurotoxicology. 2012;33:1135–1146. doi: 10.1016/j.neuro.2012.06.006. [DOI] [PubMed] [Google Scholar]
- Zdravkovic T, Genbacev O, LaRocque N, McMaster M, Fisher S. Human embryonic stem cells as a model system for studying the effects of smoke exposure on the embryo. Reprod Toxicol. 2008;26:86–93. doi: 10.1016/j.reprotox.2008.07.004. [DOI] [PubMed] [Google Scholar]