Abstract
The molecular mechanism(s) underlying the enhanced self-interactions of mucins possessing the Tn (GalNAcα1-Ser/Thr) or STn (NeuNAcα2-6GalNAcα1-Ser/Thr) cancer markers were investigated using optical tweezers (OT). The mucins examined included modified porcine submaxillary mucin containing the Tn epitope (Tn-PSM), ovine submaxillary mucin with the STn epitope (STn-OSM), and recombinant MUC1 analogs with either the Tn and STn epitope. OT experiments in which the mucins were immobilized onto polystyrene beads revealed identical self-interaction characteristics for all mucins. Identical binding strength and energy landscape characteristics were also observed for synthetic polymers displaying multiple GalNAc decorations. Polystyrene beads without immobilized mucins showed no self-interactions and also no interactions with mucin-decorated polystyrene beads. Taken together, the experimental data suggest that in these molecules, the GalNAc residue mediates interactions independent of the anchoring polymer backbone. Furthermore, GalNAc–GalNAc interactions appear to be responsible for self-interactions of mucins decorated with the STn epitope. Hence, Tn-MUC1 and STn-MUC1 undergo self-interactions mediated by the GalNAc residue in both epitopes, suggesting a possible molecular role in cancer. MUC1 possessing the T (Galβ1-3GalNAcα1-Ser/Thr) or ST antigen (NeuNAcα2-3Galβ1-3GalNAcα1-Ser/Thr) failed to show self-interactions. However, in the case of ST-MUC1, self-interactions were observed after subsequent treatment with neuraminidase and β-galactosidase. This enzymatic treatment is expected to introduce Tn-epitopes and these observations thus further strengthen the conclusion that the observed interactions are mediated by the GalNAc groups.
Keywords: carbohydrate, dynamic force spectroscopy, glycoprotein, optical tweezers, self-interactions, Tn and STn cancer antigens
Introduction
A decade ago, Hakomori introduced the term “glycosynapse” (Hakomori 2002). According to his definition, a glycosynapse is a cell surface microdomain responsible for carbohydrate-dependent cell adhesion coupled with signaling. The concept points to the analogy with an “immunological synapse” controlling adhesion and signaling between immunocytes. Carbohydrates can mediate adhesion either through interactions with proteins, i.e. endogenous lectins, or through complementary carbohydrates expressed at the target cell surface, based on carbohydrate-to-carbohydrate interactions (CCIs). CCIs are characterized by even lower affinity than the carbohydrate–protein interactions while still providing very high specificity. Furthermore, CCIs are often multivalent in character, where several binding units are needed to produce the net binding strength. These characteristics of the CCIs explain why they have been identified as important players in mechanisms responsible for structurally and temporally dynamic processes, such as adaptive immune responses, cell adhesion and recognition (Bovin 1996; van Kooyk and Figdor 2000; Cochran et al. 2001; Rojo et al. 2002; Bucior and Burger 2004; Handa and Hakomori 2012; Lorenz et al. 2012; Kunze et al. 2013). CCIs have also been proposed as a means to target the cell surface for therapeutic applications (Murthy et al. 2015). Despite this well-documented importance of the CCIs for carbohydrate-mediated adhesion, much is still to be discovered related to their underlying molecular mechanisms. The slow progress within this field was recently explained by the difficulties associated with detecting these ultraweak interactions, and it was concluded that a reliable quantitative technique is urgently needed (Lai et al. 2016).
Mucins are large extracellular proteins that are heavily glycosylated with complex oligosaccharides that potentially engage in numerous carbohydrate-mediated interactions. They are a principal constituent of the mucous membranes that line bodily cavities and canals that lead to the outside, e.g., the respiratory, digestive and urogenital tracts. These complex molecules have been extensively studied, and the molecular properties and functional attributes of mucins were recently reviewed (Corfield 2015). The documented functions of the mucosal surfaces include gaseous exchange especially in the respiratory tree, nutrient and cofactor adsorption in the gut, transparency at the ocular surface and general roles such as lubrication and chemical sensing. In addition, the mucosal surfaces have a close and integrated relationship to both innate and adaptive immune systems, and they are considered to be vital and dynamic entities in regular function and interaction of the body with both internal and external environments encountered on a daily basis.
Several types of cancer are known to be accompanied by over-expression of certain aberrantly glycosylated mucins (Taylor-Papadimitriou et al. 1999; Hollingsworth and Swanson 2004; Corfield 2015). More precisely, malignant cells carry truncated glycan side chains (Hanisch 2001; Brockhausen 2006) including the carbohydrate tumor antigens Tn (GalNAc-Ser/Thr), STn (sialyl-Tn; NeuAcα2-6GalNAc-Ser/Thr) and T (Galβ1-3GalNAc-Ser/Thr) (Cazet et al. 2010).
An unusual expression of the Tn epitope is also associated with the human disorder named the Tn syndrome (Ju et al. 2011). Whereas the abnormal glycosylation is believed to be due to changes in topology, function and expression of glycosyltransferases and chaperones (Brockhausen 2006; Ju et al. 2014), the understanding of the biological significance of these truncated glycan side chains is still incomplete. The Tn antigen is known to be recognized by the immune cells and to elicit anti-tumor-antibodies (Wandall et al. 2010; Lakshminarayanan et al. 2012). Increased expressions of Tn, STn and T have been observed for most cancer cells and are believed to mediate an advantage for growth or survival (Brockhausen 2006; Radhakrishnan et al. 2014). Indeed it has been shown that expression of the STn structure increases proliferation and metastatic potential of cancer cells (Brockhausen 2006; Chiricolo et al. 2006; Julien et al. 2006). Studies have also shown that glycosylation beyond the GalNAc protect cancer cells from immune-mediated killing and NK cell-mediated antibody-dependent cellular toxicity (Suzuki et al. 2012; Madsen et al. 2013). However, the mechanisms underlying the proposed facilitated proliferation and metastasis induced by the Tn and STn epitopes are not known. The biological effects are likely to be due to specific interactions between the epitopes and their molecular binding partners. The interest for the Tn epitope is further motivated by it being recognized as a cancer-specific target for immunotherapy and an interesting candidate for the development of diagnostic monoclonal antibodies (Beatson et al. 2010). The Tn epitope has also been considered for use in human vaccines (Heimburg-Molinaro et al. 2011).
The use of new experimental techniques to study glycan-related biological and medical problems is expected to lead to a deeper understanding of glycobiology (Reichardt et al. 2013; Lai et al. 2016). In this article, we demonstrate the suitability of the force probe optical tweezers (OT) for quantitative determination of carbohydrate-mediated interactions. The questions addressed in this study are related to the self-interaction properties previously documented for glycan-modified mucin analogs (Haugstad et al. 2012). We hypothesized that the GalNAc residue plays a role in the self-association of porcine submaxillary mucin containing the Tn epitope (Tn-PSM). However, the possibility that the peptide backbone of the mucin contributes to these interactions could not be ruled out. In this study, the self-binding characteristics of mucins including MUC1 that possess either the Tn or STn epitopes are compared to these observed for synthetic polymers decorated with GalNAc. The results obtained provide insight into the role of the GalNAc residue in the Tn and STn epitopes in the self-association of mucins and other glycoconjugates possessing these cancer markers.
Results
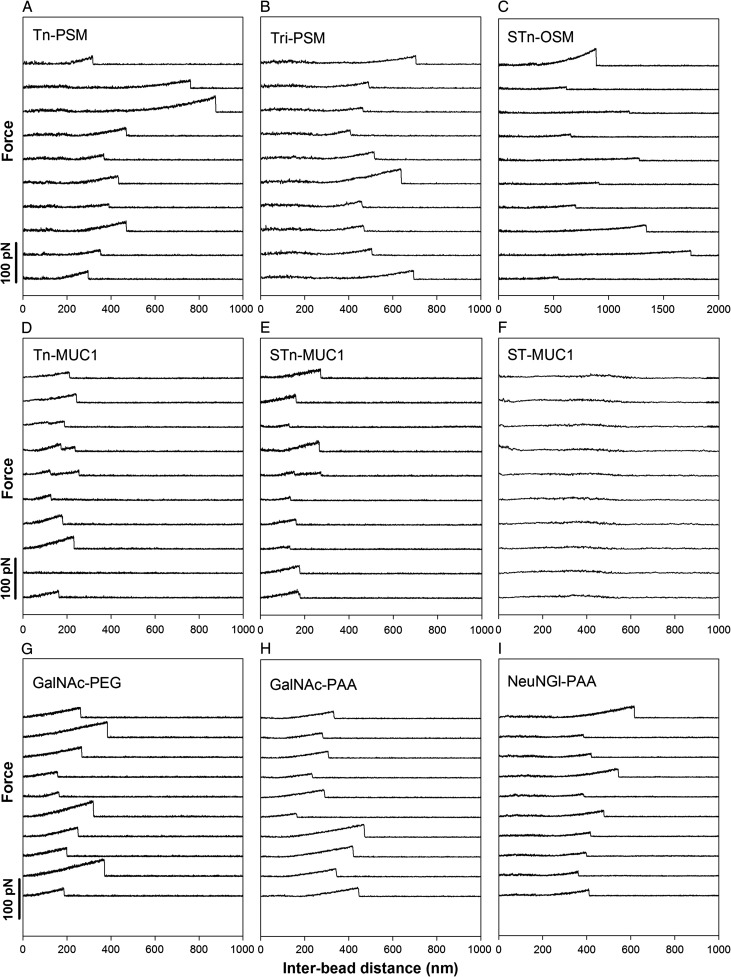
The ability to engage in self-interactions was investigated for chosen mucin structures (Table I) and synthetic mucin analogs using OT-based force spectroscopy (Figure 1). The rupture events observed in the force retraction curves obtained using OT (Figure 2) were interpreted as evidences of interactions between the macromolecules attached to the polystyrene beads. The mucins Tn-PSM, Tri-PSM, ovine submaxillary mucin with the STn epitope (STn-OSM), Tn-MUC1 and STn-MUC1 showed self-interactions (Figure 2A–E), whereas ST-MUC1 did not (Figure 2F). Self-interactions were observed also for polystyrene beads functionalized with GalNAc through a polyethylene glycol (PEG) linker (GalNAc-PEG) as well as for the synthetic polymer polyacrylamide (PAA) functionalized with GalNAc (GalNAc-PAA) or Neu5Gc (Neu5Gc-PAA) (Figure 2G–I).
Table I.
Glycan composition
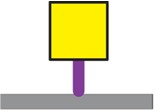
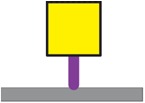
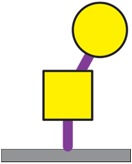
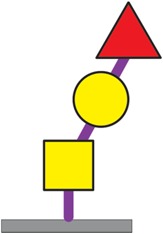
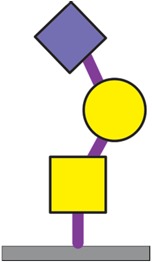
| Sample | Glycan structure | Relative amount | Illustrationa |
|---|---|---|---|
| Tn-PSM | GalNAcα1-Ser/Thr | 100 |
|
| Tri-PSMb | GalNAcα1-Ser/Thr | 28 |
|
| Galβ1-3GalNAcα1-Ser/Thr | 26 |
|
|
| Fucα1-2Galβ1-3GalNAcα1-Ser/Thr | 46 |
|
|
| STn-OSM | NeuNAcα2-6GalNAcα1-Ser/Thr | 100 |
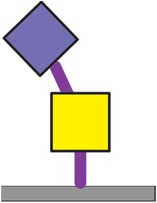
|
| Tn-MUC1 | GalNAcα1-Ser/Thr | 100 |
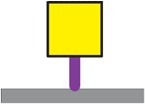
|
| STn-MUC1 | NeuNAcα2-6GalNAcα1-Ser/Thr | 100 |
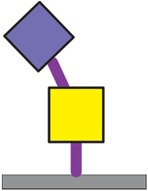
|
| T-MUC1 | Galβ1-3GalNAcα1-Ser/Thr | 100 |
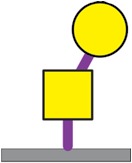
|
| ST-MUC1 | NeuNAcα2-3Galβ1-3GalNAcα1-Ser/Thr | 100 |
|
aSymbols used: 
b~35–50% of these glycan structures will have the Neu5Gc residue attached to the C6 position of the peptide-linked GalNAc residue (Gerken and Jentoft 1987).
Fig. 1.
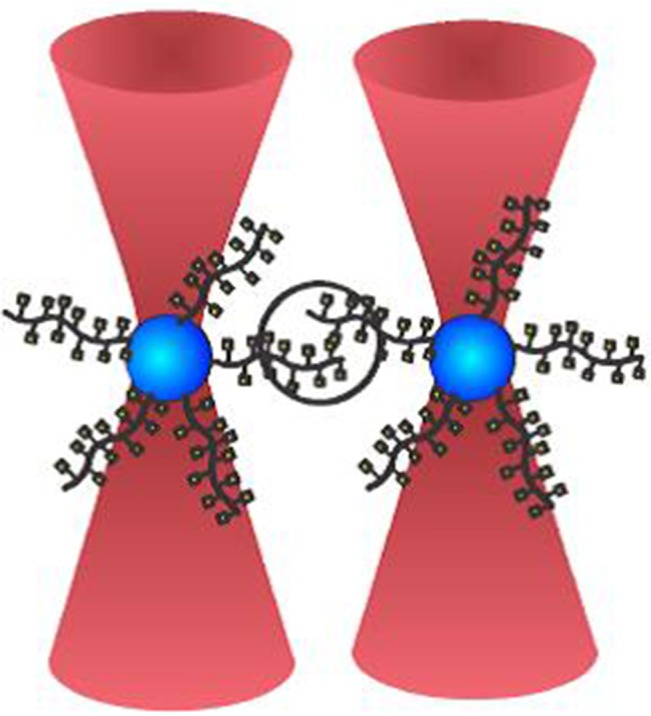
Experimental design: a polystyrene bead functionalized with mucins or mucin analogs is trapped in each of the two optical traps of the dual-beam OT instrument. During the experiment, the two beads are brought into contact, allowing the molecules immobilized onto the bead surfaces to interact, before being separated. Bead displacement speed is defined as the speed by which the two beads are moved apart, and loading rate is the force applied onto the intermolecular bond per unit time during the separation. The graphical illustration depicts a mucin molecule displaying a glycan decoration consisting of only GalNAc groups. The remaining mucin samples studied in this article and their glycosylation patterns are presented in Table I. This figure is available in black and white in print and in color at Glycobiology online.
Fig. 2.
Examples of force–distance curves obtained for (A) Tn-PSM, (B) Tri-PSM, (C) STn-OSM, (D) Tn-MUC1, (E) STn-MUC1, (F) ST-MUC1, (G) GalNAc-PEG, (H) GalNAc-PAA and (I) Neu5Gc-PAA self-interactions. The experiments were performed at room temperature in 100 mM HEPES buffer pH 7.2 containing 1 mM CaCl2 and 1 mM MnCl2. The force curves are considered as typical examples obtained for these macromolecular functionalized polystyrene beads. The force–distance curves obtained for ST-MUC1 (F) did not contain signatures reflecting the rupture of self-interactions. The remaining molecules gave rise to force vs. distance curves that contained signatures of the rupture of self-interaction in a fraction of the curves (D: second curve from bottom is an example of a curve that does not show self-interaction events), the remaining curves in the galleries A–E and G–I are chosen among those displaying unbinding events.
Control measurements of amino- or streptavidin-terminated polystyrene beads revealed no self-interactions between these beads. The use of amino-terminated beads of different diameter, where the size of the bead reflected its surface functionalization, allowed conducting control measurements of mucin-coated amino-terminated polystyrene beads (bead diameter: 2 μm) probed against bare amino-terminated polystyrene beads (bead diameter: 3 μm). In these experiments, no interactions were observed for any of the mucin-derivatized beads with the non-derivatized beads.
The majority of the observed unbinding events were in the force ranging from 4 to 35 pN. Three regions were identified based on the rupture events observed for Tn-PSM, Tri-PSM and STn-OSM (Figure 3). For force loading rates below 0.06 nN/s, the rupture forces were tending to be independent of the loading rate. In the second region, from rf = 0.06–0.4 nN/s a linear rise in rupture forces was observed with increasing logarithm of loading rate. In this interval, the observations or rupture forces were divided in intervals based on the corresponding force loading rates (rf), as indicated by alternating dark and light blue circles (Figure 3). For each of these intervals, the parameters describing the energy landscape for a single-barrier unbinding under constant load were determined (Table II). The most likely rupture force f* determined for each of these intervals increased from 5 to 35 pN (Table II). The parameter xβ# was determined to be 0.38, 0.42 and 0.41 nm for Tn-PSM, Tri-PSM and STn-OSM, respectively. At a force loading rate above 0.4nN/s, a rapid rise in rupture forces was observed.
Fig. 3.
Rupture force vs. force loading rate (rf) for mucin self-interactions determined at a bead displacement speed of 2 µm/s for (A) Tn-PSM, (B) Tri-PSM and (C) STn-OSM. The unbinding events observed at rf > 0.06 nN/s were divided into intervals based on the determined loading rate (alternating dark and light blue circles). For each interval, the most probable rupture force, f* (white squares) was determined. This figure is available in black and white in print and in color at Glycobiology online.
Table II.
Energy landscape parameters determined for Tn-PSM, Tri-PSM and STn-OSM self-interactions
| Sample | rf [pN/s] | f* [pN] | k0 # [s−1] | xβ # [nm] | f*# [pN] | N |
|---|---|---|---|---|---|---|
| Tn-PSM | 69 | 7.2 | 3.8 | 0.38 | 5.7 | 47 |
| 85 | 10.8 | 3.5 | 8.8 | 48 | ||
| 109 | 10.6 | 4.1 | 9.9 | 57 | ||
| 138 | 14.5 | 3.4 | 14.5 | 100 | ||
| 173 | 12.6 | 3.9 | 15.1 | 91 | ||
| 217 | 16.7 | 4.0 | 17.4 | 103 | ||
| 278 | 25.4 | 2.3 | 25.6 | 95 | ||
| 350 | 35.0 | 1.2 | 35.5 | 69 | ||
| Tri-PSM | 69 | 5.6 | 5.0 | 0.42 | 3.3 | 50 |
| 89 | 6.4 | 6.1 | 4.0 | 75 | ||
| 113 | 8.6 | 5.7 | 7.0 | 92 | ||
| 142 | 8.7 | 6.9 | 7.3 | 135 | ||
| 183 | 11.1 | 6.2 | 10.8 | 160 | ||
| 232 | 13.7 | 5.8 | 13.8 | 228 | ||
| 299 | 16.6 | 5.4 | 16.9 | 217 | ||
| 375 | 24.2 | 3.1 | 24.5 | 141 | ||
| 472 | 32.0 | 2.1 | 30.6 | 71 | ||
| STn-OSM | 66 | 6.2 | 4.2 | 0.41 | 4.6 | 69 |
| 81 | 6.7 | 4.6 | 5.7 | 87 | ||
| 98 | 7.9 | 4.8 | 7.2 | 102 | ||
| 118 | 9.2 | 5.0 | 8.7 | 104 | ||
| 144 | 10.9 | 4.7 | 11.2 | 105 | ||
| 174 | 14.8 | 4.0 | 14.8 | 96 | ||
| 210 | 17.1 | 4.0 | 16.6 | 85 | ||
| 258 | 18.6 | 3.8 | 19.0 | 116 | ||
| 312 | 22.1 | 3.3 | 22.4 | 120 | ||
| 379 | 30.3 | 1.7 | 30.6 | 128 |
The role of the GalNAc groups in the observed self-interaction was further investigated by obtaining force–distance curves for surfaces displaying GalNAc-PEG and GalNAc-PAA as well as STn-MUC1 and Neu5Gc-PAA (Figure 2D and E, G–I and Figure 4C–F). In the initial experiments employing GalNAc-PEG and STn-MUC1 functionalized polystyrene beads, relatively high interaction forces were observed (Figure 4F, inset). These high forces were likely to result from a high surface density of the interacting molecules, and concomitant high likelihood for multiple molecular pair interactions. The rupture forces also remained high in beads produced using 5-fold lower concentrations of these mucins or mucin analogs during bead functionalization. A further decreased surface density of the interacting molecules was obtained by introducing non-interacting ST-MUC1 molecules along with interacting GalNAc groups on the bead surfaces during derivatization. The fraction of the ST-MUC1 solution compared to the GalNAc solution was optimized by trial and error in order to obtain data reflecting single molecular pair interactions (Figure 4B and C, F).
Fig. 4.
Distributions of rupture forces observed for self-interactions of (A) Tn-PSM, (B) Tn-MUC1, (C) GalNAc-PEG, (D) GalNAc-PAA, (E) Neu5Gc-PAA and (F) STn-MUC1. For the data presented in B, C and F, the surface density of the interacting molecules was controlled by introducing non-interacting ST-MUC1 molecules in between the interacting GalNAc-PEG or MUC1 molecules. The fraction of the ST-MUC1 solution compared to the GalNAc solution was optimized by trial and error in order to obtain data reflecting single molecular pair interactions. (F): inset: distributions of rupture forces observed for STn-MUC1 self-interactions obtained when using polystyrene beads with a high density of STn-MUC1 molecules. The data are obtained using bead displacement speed in the range 0.5–3 μm/s.
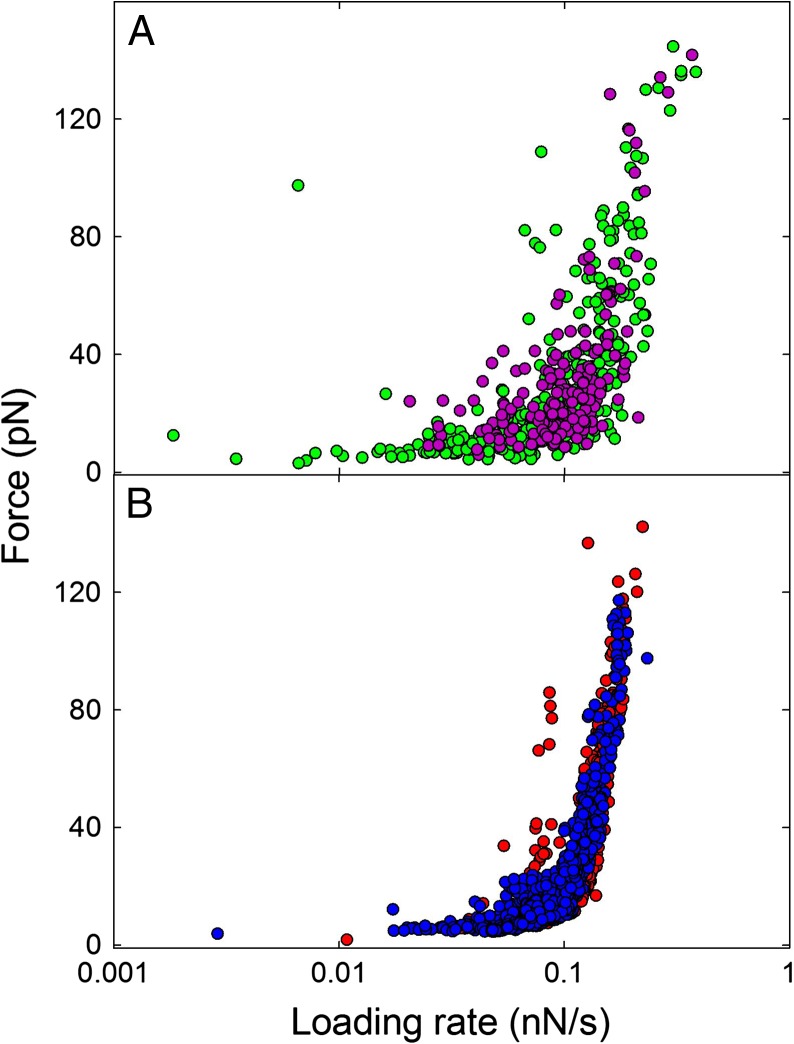
The rupture forces vs. loading rate plot obtained for Tn-MUC1 overlapped with the plot obtained for Tn-PSM (Figure 5A). The GalNAc-PAA or GalNAc-PEG samples also gave rise to similar force vs. loading rate plots, with rupture forces in the range 2–40 pN increasing with loading rate within the first linear regime of f vs. rf. As for the mucin samples (Figure 3) no clear trend was observed for f* for rf below 0.06 nN/s. The data obtained in the intermediate force loading rate interval, i.e. for loading rates in the range 62–111 pN/s, were used to estimate the parameters of the energy landscape. In this interval f* increased with increasing rf from 7.5 to 17.9 pN for GalNAc-PEG and from 7.2 to 17.0 pN for GalNAc-PAA (Table III). Parameter f*# was found increasing from 6.6 to 17.4 pN for GalNAc-PEG and from 6.3 to 17.2 pN for GalNAc-PAA. The parameter xβ# was determined to be 0.37 and 0.41 nm for GalNAc-PEG and GalNAc-PAA, respectively.
Fig. 5.
Unbinding forces vs. loading rate for (A): Tn-PSM (green) and Tn-MUC1 (purple) and (B): GalNAc-PEG (red) and GalNAc-PAA (blue). The bead displacement speed was 1 µm/s. This figure is available in black and white in print and in color at Glycobiology online.
Table III.
Energy landscape parameters determined for the self-interactions of GalNAc-PEG and GalNAc-PAA
| Sample | rf [pN/s] | f* [pN] | k0 # [s−1] | xβ # [nm] | f*# [pN] | N |
|---|---|---|---|---|---|---|
| GalNAc-PEG | 68 | 7.5 | 3.4 | 0.37 | 6.6 | 17 |
| 74 | 8.0 | 3.9 | 6.1 | 51 | ||
| 80 | 8.7 | 3.9 | 6.8 | 37 | ||
| 87 | 10.0 | 3.6 | 6.8 | 39 | ||
| 95 | 11.4 | 3.6 | 9.7 | 46 | ||
| 103 | 13.9 | 2.6 | 14.2 | 88 | ||
| 111 | 17.9 | 2.1 | 17.4 | 131 | ||
| GalNAc-PAA | 62 | 7.2 | 3.3 | 0.41 | 6.3 | 47 |
| 67 | 7.4 | 3.5 | 6.5 | 62 | ||
| 73 | 10.5 | 2.8 | 9.7 | 55 | ||
| 78 | 8.5 | 3.8 | 7.2 | 67 | ||
| 84 | 9.1 | 3.1 | 10.1 | 59 | ||
| 91 | 10.3 | 3.5 | 9.5 | 76 | ||
| 99 | 12.7 | 2.7 | 13.2 | 97 | ||
| 106 | 17.0 | 1.9 | 17.2 | 147 |
In the case of Neu5Gc-PAA and STn-MUC1, the histograms of rupture forces (Figure 4E and F) indicate a higher rupture force in the case of Neu5Gc-PAA, whereas the strength of the STn-MUC1 self-interactions is found to be comparable to that observed for the Tn-PSM, Tn-MUC1, GalNAc-PAA and GalNAc-PEG (Figure 4).
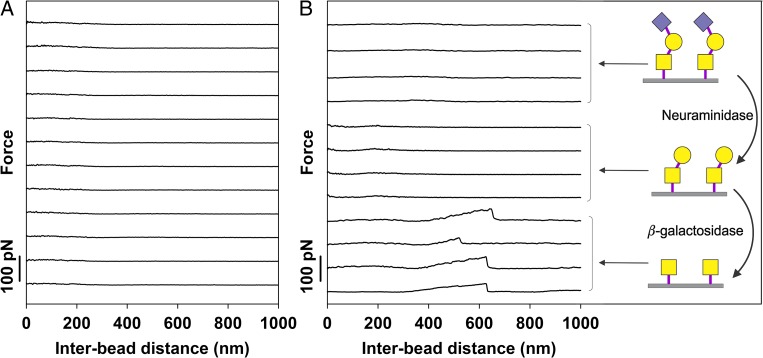
The lack of interactions observed for the ST-MUC1, which carries the NeuNAcα2-6GalNAcα1-Ser/Thr glycan, inspired experiments on T-MUC1, a mucin carrying Galβ1-3GalNAcα1-Ser/Thr glycans. No self-interactions were observed for this mucin (Figure 6A). The carbohydrate decorations of ST-MUC1 can be converted to those of T-MUC1 by treatment with the enzyme neuraminidase. The ability of self-interaction investigated for the ST-MUC1 sample after treatment with neuraminidase confirmed the results obtained for the T-MUC1 sample in the sense that no interaction was observed (Figure 6B, four middle curves). Subsequent treatment with β-galactosidase removes also the galactose from the glycan, thus leaving only the GalNAc unit. After treatment with β-galactosidase, self-interactions were observed (Figure 6B, four lower curves).
Fig. 6.
Examples of force–distance curves obtained for (A) T-MUC1 and (B) ST-MUC1 prior to (four upper curves) and after treatment with neuraminidase (four middle curves) as well as after successive treatment with both neuraminidase and β-galactosidase (four lower curves). The experiments were performed at room temperature in 100 mM HEPES buffer pH 7.2 containing 1 mM CaCl2 and 1 mM MnCl2. The schematic illustrations present the glycan structures on the mucin molecules after each enzymatic treatment. The upper illustration presents the initial glycan structures of ST-MUC1, the middle illustration presents the glycan structures of ST-MUC1 after treatment with neuraminidase (producing a T-MUC1 like mucin), while the bottom illustration shows the glycan structures after subsequent action of neuraminidase and β-galactosidase. The symbols used are defined in Table I. This figure is available in black and white in print and in color at Glycobiology online.
Discussion
Mucin self-interactions
In this study, the self-interactions for a series of mucins and mucin analogs are quantified and compared. The absence of interactions observed in control experiments on non-derivatized beads confirms that the force jumps observed and analyzed in this study are entirely due to the mucins and mucin analogs immobilized to the beads. The mucin self-associations observed for Tn-PSM, Tri-PSM and STn-OSM were characterized by most likely rupture forces increasing from 5.6 to 35 pN for mean force loading rates increasing from 0.06 to 0.4 nN/s (Table II). Since the interaction strength is known to increase with increasing force loading rate (Bell 1978; Evans and Ritchie 1997; Evans 1998), the values obtained are in accordance with the values previously determined for the same interactions using atomic force microscopy (AFM), which for the Tn-PSM and Tri-PSM self-interactions were determined to 34 and 42 pN, respectively, at a rf = 0.65 nN/s (Haugstad et al. 2012).
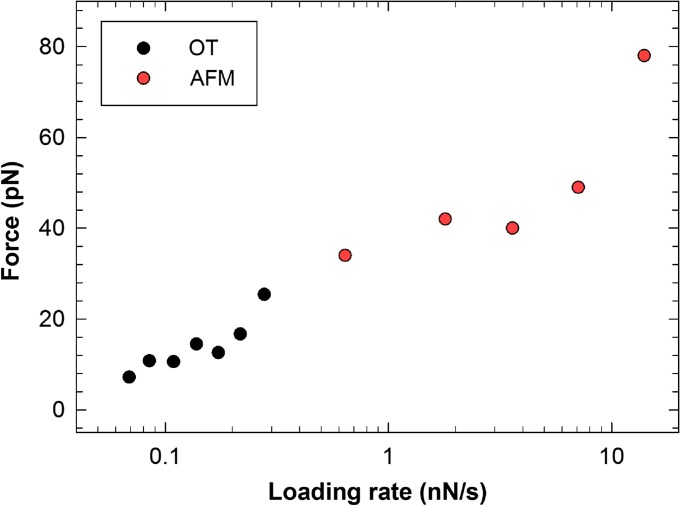
The strengths of the Tn-PSM, Tri-PSM and STn-OSM self-associations are similar, and the values obtained for f* and f*# showed good consistency (Table II) (Bell 1978; Evans and Ritchie 1997; Evans 1998; Haugstad et al. 2012). The values of the reaction length xβ # were determined from the dynamic force spectra to be 0.38 and 0.42 nm for the Tn-PSM and Tri-PSM, respectively, in high agreement with the average xβ previously determined using AFM force spectroscopy (0.37 and 0.40 nm for Tn-PSM and Tri-PSM, respectively) (Haugstad et al. 2012). The alternative approach to determine xβ, based on determination of the slope of the linear regimes observed in the dynamic force spectra, gave for Tn-PSM xβ values of 0.38 nm from the OT data and 0.34 nm from the AFM data (Haugstad et al. 2012). The similarity of the xβ value obtained using AFM and OT can also be expected based on the plot of f* against loading rate obtained for Tn-PSM (Figure 7). This graph reveals that the obtained values of f* show a linear dependence with logarithm of the loading rate, implying that the energy landscape of this interaction is characterized by a single energy barrier, and thus a single xβ. Such consistency between the values obtained by the two different force probes lends high credibility to our model and results.
Fig. 7.
The strength of the Tn-MUC1 self-interactions determined by direct unbinding experiments performed using AFM (red points) and OT (black points). Combining the two techniques gives access to a broader range of loading rates than what can be provided by each of the two techniques separately. This figure is available in black and white in print and in color at Glycobiology online.
Presence of bond rebinding and multiplicity in the force vs. loading rate plots
One of the assumptions in the Bell–Evans formalism is that the rupture of a non-covalent bond under influence of an external force is irreversible (Evans 1998; Friddle et al. 2007; Hane et al. 2014). For force measurements at low loading rates, this is not necessarily correct. In this study, a plateau was observed in the force vs. loading rate plot at loading rates below 0.06 nN/s (Figure 3). These observations lead to the conclusion that in this region rebinding occurs, the assumptions underlying the Bell–Evans formalism are thus not fulfilled and the formalism is, therefore in this study, not applied for this range of loading rates.
The data obtained using loading rates above 0.06 nN/s showed no indications of rebinding and thus formed the basis for the further analysis presented in this article. For these data, a correlation was observed between the density of the potential interaction sites and the probability for interaction as well as its strength. This is interpreted as a consequence of multiplicity in the intermolecular bonds underlying the observed rupture events. The influence of intermolecular bond multiplicity on the appearance of the force vs. distance curves, as well as the histograms displaying the distribution of unbinding strengths, has previously been documented (Sletmoen et al. 2004). In this study, the density of molecules immobilized onto the polystyrene particles was reduced until reaching a lower plateau of the interaction strength. When using these experimental conditions, similar rupture forces were observed for both Tn-PSM, Tn-MUC1, GalNAc-PEG and GalNAc-PAA (Figure 4). The similarity of the rupture forces points to the interpretation that at this condition of low surface density of the interacting molecules, the rupture strength is not influenced by the density of the GalNAc groups, which is consistent with the hypothesis that, at these experimental conditions, only two GalNAc groups contribute to the observed interaction strength.This hypothesis is further strengthened by the similarity of the rupture forces determined for the present system and other carbohydrate-based interactions. The rupture force of sulfated GlcNAc-Fuc self-interactions have been determined using AFM to 30 pN (de Souza et al. 2009) and for Lewis X determinants, such forces were found to equal 20 pN (Tromas et al. 2001). The loading rate range used was not provided in the publications, but the forces are within the same range as we previously determined for the mucin self-interactions using AFM (Haugstad et al. 2012; Haugstad et al. 2015). Furthermore, these studies both include an analysis that allows to identify these rupture forces as the rupture between two and only two interacting entities (Tromas et al. 2001; de Souza et al. 2009). Forces ranging from a few to a few tens of picoNewton in strength, depending on the force loading rate applied, thus seem to be common for self-interactions between a single pair of carbohydrate groups.
GalNAc–GalNAc interactions determine the self-interactions of mucins decorated with the Tn or STn epitopes and not the polypeptide backbone
In order to investigate the structural basis for the observed mucin self-interactions, we performed studies of the self-interaction of the low-molecular weight (MW) GalNAc functionalized synthetic polymers GalNAc-PEG and GalNAc-PAA immobilized on polystyrene beads. The f* values determined for GalNAc-PEG and GalNAc-PAA, ranging from 2 to 40 pN for loading rates from 0.06 to 0.11 nN/s, were comparable to the f* of Tn-PSM (Figure 5, Table II and III). The xβ values estimated from the force spectroscopy analysis of the GalNAc-PEG and GalNAc-PAA self-interactions, being equal to 0.37 and 0.41 nm, respectively, are nearly identical to the value of xβ = 0.38 nm determined for Tn-PSM. The similarity of the behavior of these different samples strongly suggests that the GalNAc side groups on the Tn-PSM are responsible for the self-interaction abilities of this mucin, with very little influence from the protein backbone. This interpretation is strengthened by the observed self-interaction abilities of ST-MUC1 after treatment with the enzymes neuraminidase and β-galactosidase (Figure 6B). In accordance with the results obtained for T-MUC1 (Figure 6A), no self-interaction was obtained upon conversion of glycan side chains to T-antigens, obtained through treatment with neuraminidase. However, after conversion to the Tn-antigen structure, through subsequent treatment with β-galactosidase, clear indications of self-interactions were observed (Figure 6B). These observations are in accordance with the interpretation that the observed self-interactions are due to the presence of GalNAc units, and that substitution of the GalNAc with (1–3) linked Gal may be detrimental for the interaction abilities of the GalNAc.
It is interesting to compare the observations obtained for PAA and PEG samples displaying GalNAc as the carbohydrate decoration, to the observations obtained for the PAA sample displaying the monosaccharide N-Glycolylneuraminic acid (Neu5Gc), a form of sialic acid naturally found in many mammals where the N-acetyl methyl group is replaced by the N-glycoyl (CH2OH) group. Neu5Gc is not synthesized by humans but can be incorporated in human glycoproteins from the diet (Varki 2001; Padler-Karavani et al. 2008). Neu5Gc was used in this study since our model porcine mucins contain Neu5Gc (Table I). The increased rupture forces observed for the Neu5Gc-PAA sample, relative to the GalNAc-PAA sample (Figure 4) indicate that the interaction strength does depend on the identity of the carbohydrate decoration on these samples. Furthermore, it is interesting to notice that despite the larger interaction forces observed for Neu5Gc-PAA relative to GalNAc-PAA, the strength of the self-interactions observed for Tri-PSM is similar to those observed for Tn-PSM (Table II). This may be due to the low (~35–50%) Neu5Gcα2-6 substitutions of the glycans on Tri-PSM (Table I) reducing the contribution of the Neu5Gc groups to the self-interactions observed for this mucin. However, the lack of interactions observed for the ST-MUC1 (Figure 2F), which carries the NeuAcα2-3Galβ1-3GalNAc1-αSer/Thr glycan, suggests that the interaction capacity of the (2–3)-Gal linked sialic acid differs from the (2–6)-GalNAc linked sialic acid. Furthermore, the lack of interaction observed for ST-MUC1 (Figure 2F) indicate that the Gal (1–3) substitution of GalNAc has a detrimental effect on the GalNAc interactions. The lack of self-interactions observed also for the mucin carrying the T-antigen (Figure 6A) is in accordance with this interpretation. Taken together, these results illustrate that not only the identity of the monosaccharides present but also their linkages determine the interaction abilities. This is consistent with the previously published evidence for GalNAc–GalNAc interactions in the Gb4 globosides binding to Gg3 globoside, combined with the lack of self-interactions in Gb4, which illustrate the importance of the linkage geometry for the interaction abilities of these glycans (Hakomori 2004).
Interestingly, STn-MUC1 and STn-OSM behave similar to Tn-PSM, Tn-MUC1, GalNAc-PEG and GalNAc-PAA. This observation is consistent with the notion that the GalNAc part of the STn-MUC1 or STn-OSM samples dominates their interaction abilities. In these mucins, the NeuNAc residues are linked 2,6 to GalNAc thus perhaps leaving the GalNAc less crowded and more accessible. Alternatively, the NeuNAc (or Gc) may be more extended away from the peptide in these structures, and therefore more accessible than when linked 2,3 to the adjacent galactose. Previous carbon-13 nuclear magnetic resonance (NMR) studies on the conformation of the PSM trisaccharide indicate that the substitution of the β-Gal significantly reduces its mobility causing the entire glycan to move as one unit (Gerken and Jentoft 1987).
The ability for monosaccharides to self-interact is not a well-studied topic. However, Zhao and co-workers recently reported the use of fluorescent silica nanoparticles functionalized with carbohydrates in studies of CCIs (Zhao et al. 2012). More precisely, they examined the binding of nanoparticles coated with galactose (Gal), its 3-sulfo derivative (SGal) or glucose to galactolipids and glycolipids that had been immobilized in a multiwell plate. They found the CCIs between the nanoparticles and the glycolipid to be extremely specific for Gal–SGal. The ability for self-interaction of GalNAc observed in this study is thus not a general ability of simple monosaccharides, but depends on certain structural features. Furthermore, the inability of self-interaction of ST-MUC1 and T-MUC1, as documented in this study, indicates that both monosaccharide composition and linkage geometry are essential for the interaction abilities of more complex glycan structures. This is also illustrated by previous studies of the interaction abilities of various carbohydrate epitopes (Hakomori 2004) as well as recent studies of high-mannose type N-linked glycans (Yoon et al. 2013). The latter study revealed that glycans with six mannosyl residues self-interact, but do not interact with N-linked glycans having multiple GlcNAc termini (Yoon et al. 2013).
Biological relevance
MUC1 is over-expressed and aberrantly glycosylated in many adenocarcinomas, and the aberrant O-glycophenotype is crucial for the development and behavior of cancer (Mungul et al. 2004; Picco et al. 2010; Pinho and Reis 2015). The aberrant glycosylation often results in the expression of truncated O-linked glycans such as Tn and STn. Interestingly, although the ST antigen is tumor-associated when carried on MUC1, this trisaccharide is often found on glycoproteins expressed by normal cells within the hematopoietic system (Priatel et al. 2000). Self-interactions of these glycans would therefore be undesirable in vivo and indeed were not observed in our experiments.
Glycan self-interactions are often rather weak, with strengths ranging from a few to a few tens of picoNewton depending on the force loading rate (Table II and Tromas et al. 2001; de Souza et al. 2009). This might in nature make the density of the glycans important to increase the net strength of binding. Insight into the tendency for multiplicity and its consequences on the behavior of the systems requires studies where the density of the molecules is varied and where the surfaces presenting the molecules ideally have a curvature that mimics the relevant biological systems. The aim of the current work was to provide insight related to the identity of the molecular groups essential for the observed mucin self-interactions. Investigations related to their multiplicity in the relevant biological systems are thus not performed but would be interesting and important future investigations. Interestingly, the lack of core 2-based glycans observed in many breast cancers appears to be correlated with an increased density of glycosylation (Muller et al. 1999). Moreover, increased density of Tn and possibly STn may also result from relocation of the polypeptide GalNAcTs that has been observed in some cancer cells (Gill et al. 2013). Thus, our observation of significantly increased interaction forces with increased glycan density (Figure 4F) is highly significant since a high density of glycosylation is often seen in cancer-associated MUC1.
The ability of tumor-specific STn glycans to promote self-interactions in mucins similar to the Tn antigen is important for understanding the possible molecular basis for both Tn- and the STn-cancer markers in mucins that are involved in cancer. The results presented in this article are consistent with the hypothesis that the Tn- and STn-antigens may be drivers (primary or secondary) in certain cancers by aggregating mucin receptors on the surface of cells. Indeed engineered expression of STn on cancer cell lines increases their tumorigenicity (Julien et al. 2001; Ozaki et al. 2012), whereas knocking down the sialyltransferases responsible for STn formation reduces tumor cell growth (Tamura et al. 2016). In addition, these glycans could affect the aggregation and hence activity of other receptors that carry the Tn antigen such as death receptors 4 and 5 that are required for apoptotic signaling in tumor cells (Wagner et al. 2007).
Conclusion
The similarity of the parameters characterizing the GalNAc-PAA, GalNAc-PEG Tn-MUC1 and Tn-PSM self-interactions revealed in this study indicates that the GalNAc group is essential for these interactions, with little or no influence from the polymer backbone. This conclusion is further strengthened by the appearance of self-interactions for the non-interacting mucin ST-MUC1 after treatment with the enzymes neuraminidase and β-galactosidase. The observed ability of STn-OSM as well as STn-MUC1, but not ST-MUC1 and T-MUC1 to engage in self-interactions, with a binding strength similar to that observed for the aforementioned samples, indicate that substitution on some, but not all positions on the GalNAc are non-detrimental for the interaction abilities. The ability of STn to promote self-interactions in mucins similar to the Tn antigen is very important for understanding the possible molecular basis for both Tn- and the STn-cancer markers in mucins that are involved in cancer. Furthermore, the observed ability of polymer bound Neu5Gc to form self-interactions, with interaction strengths higher than these observed for GalNAc polymers and mucins, illustrate that this ability to self-interact is not exclusive to GalNAc but may occur also for other glycans.
Materials and methods
Mucin and mucin analogs
The isolation and purification by reduction and carboxymethylation of the O-glycosylated domain of porcine and ovine submaxillary gland mucins (PSM and OSM) from frozen submaxillary glands were previously reported (Gerken et al. 1997). Tri-PSM was prepared from the O-glycosylated domains of native PSM and its glycan composition was determined by carbon-13 NMR analysis (Gerken and Jentoft 1987). The oligosaccharide compositions are given in Table I. Tn-PSM containing only α-GalNAc residues was prepared from PSM samples by the use of mild trifluoromethane sulfonic acid (Gerken et al. 1992). STn-OSM was prepared from native OSM after carboxymethylation and only contains the disaccharide NeuNAcα2-6GalNAcα1-Ser/Thr (Gerken and Dearborn 1984). The differently glycosylated low-MW human MUC1 samples, Tn-MUC1, STn-MUC1, T-MUC1 and ST-MUC1, consist of the monosaccharide GalNAc, the disaccharides NeuNAcα2-6GalNAc and Galβ1-3GalNAc and the trisaccharide NeuNAcα2-3Galβ1-3GalNAc, respectively. These MUC1-IgG samples were produced using wt and mutant CHO cell expression systems as previously described (Link et al. 2004; Beatson et al. 2015). The MUC1 glycoprotein core has 16 repeats of 20 amino acids, each repeat containing five potential O-linked glycosylation sites, and the average extent of substitution per repeat was measured by mass spectrometry, resulting in Tn-MUC1 = 3.4, STn-MUC1 = 3.8, T-MUC1 = 4.6 and ST-MUC1 = 4.6 (Backstrom et al. 2003; Beatson et al. 2015). α-GalNAc–(O–CH2–CH2–)3–NH2, i.e. GalNAc immobilized through a short PEG linker and in the following referred to as GalNAc-PEG, was obtained from Sussex Research Laboratories (Ottawa, ON, Canada). GalNAc-polyacrylamide, referred to as GalNAc-PAA, and N-glycolylneuraminic acid–polyacrylamide, referred to as Neu5Gc-PAA, were obtained from Lectinity Holding (Moscow, Russia). The saccharides were covalently bound to the PAA backbone (Mw 30 kDa) through –O(CH2)3NH– spacer groups that were coupled to the PAA as side chains. The glycosyl atom of the saccharides was α-linked to the amine groups of the spacer, and the saccharide content of the PAA functionalized polymer was 20 mole percent. The PAA backbone also carried biotin groups (5% mol, distributed throughout the polymer) enabling immobilization onto streptavidin coated surfaces. The spacer-arm for biotin was –(CH2)6–.
Immobilization of mucins or mucin analogs to polystyrene beads
The various mucins or mucin analogs were immobilized to polystyrene beads having surfaces terminated by amino- or carboxylic groups, or functionalized by streptavidin (Spherotech, Lake Forest, IL, USA). The sizes of the beads (given below) were optimal for trapping using the dual-trap OT. Deionized water with resistivity 18 MΩcm (obtained using a MilliQ unit, Millipore) was used for all the experiments.
The PSM or OSM mucins were dissolved in aqueous 50 mM boric acid (pH 5.5) to a final concentration of 0.5 mg/mL. Amino-terminated polystyrene beads with a nominal diameter of 2 µm as well as the water soluble carbodiimide 1-(3-dimethylaminopropyl)-3-ethylcarbodiimide hydrochloride (EDC) were added to the mucin solutions to a final concentration equal to 0.06 w/v and 5 mg/mL, respectively. EDC catalyses the reaction between amino groups on the polystyrene beads and carboxyl groups on the sample molecules. Assuming that all the carboxyl groups present on the mucin molecules have identical reactivity with the amino groups on the beads, reactions involving carboxyl groups on either the peptide backbone or on the sialic acid units may occur. Sialic acid groups that are involved in peptide bond formation will lose their ability to form self-interactions. However, this is not expected to influence on the properties of the remaining accessible sialic acid groups and thus on the interaction events observed. When immobilizing the PSM or OSM mucins, the coupling reaction was allowed to proceed for 35 min before performing centrifugation (10,000 rpm, 5 min) and resuspension of the beads in 100 mM HEPES buffer pH 7.2 containing 1 mM CaCl2 and 1 mM MnCl2. Extending the duration of the coupling reaction from 35 min to overnight was not found to influence on the results. The MUC1 samples were immobilized onto amino-terminated polystyrene beads using the same procedure as for the PSM and OSM mucin samples. The final concentration of MUC1, EDC and polystyrene beads in the reaction mixture was 0.2 mg/mL, 5 mg/mL and 0.06% w/v, respectively. Additionally, beads containing a mixture of a self-interacting mucin (i.e.Tn-MUC1 or STn-MUC1) and a non-interacting mucin (ST-MUC1) were obtained by mixing ST-MUC1 and Tn-MUC1 or STn-MUC1 (during the bead functionalization step). In this reaction mixture, the concentration of ST-MUC1 was 0.09 mg/mL and the concentration of Tn-MUC1 or STn-MUC1 was 0.01 mg/mL. The reaction was allowed to proceed for 1 h before pelleting the beads (10,000 rpm, 5 min) and the beads were resuspended in 100 mM HEPES buffer pH 7.2 containing 1 mM CaCl2 and 1 mM MnCl2.
The enzymatic modification of the glycan structures on ST-MUC1 was obtained by first adding 0.15 units of Clostridium perfringens neuraminidase (Sigma) to a solution containing ST-MUC1 functionalized polystyrene beads, prepared as described above and suspended in 100 μl 0.01 M potassium phosphate buffer, pH 6 containing 0.1 M KCl. The solution was left at 37°C for 1 h before removing the enzyme by five cycles of centrifugation (10,000 rpm, 5 min) and resuspension of the beads in 100 mM HEPES buffer pH 7.2 containing 1 mM CaCl2 and 1 mM MnCl2 after each cycle. The enzymatic modification catalysed by β-galactosidase was obtained by adding 0.004 units of bovine testes β-galactosidase (Sigma) to the ST-MUC1 functionalized neuraminidase treated polystyrene beads. The solution was left at 37°C for 1.5 h before removing the enzyme by five cycles of centrifugation and resuspension of the beads in 100 mM HEPES buffer pH 7.2 containing 1 mM CaCl2 and 1 mM MnCl2.
The biotin groups located along the polymer backbone of the GalNAc or Neu5Gc functionalized PAA samples were utilized for coupling to streptavidin-terminated polystyrene beads. More precisely, GalNAc-PAA and Neu5Gc-PAA were dissolved in boric acid to a concentration equal to 0.2 mg/mL, streptavidin-terminated beads (nominal diameter 3 µm, final concentration of beads = 0.01% w/v) were added and the solution was left for 30 min prior to the removal of unreacted reagents by centrifugation (10,000 rpm, 5 min) and resuspension of the beads in 100 μl 100 mM HEPES buffer pH 7.2 containing 1 mM CaCl2 and 1 mM MnCl2. GalNAc-PEG molecules were dissolved in 50 mM boric acid and were immobilized onto carboxyl-terminated polystyrene beads (nominal diameter 3 µm) using EDC as a catalyst. The final concentration of GalNAc-PEG, polystyrene beads and EDC were 0.05 mg/mL, 0.15% w/v and 5 mg/mL, respectively. In some experimental series, the GalNAc-PEG solution was diluted 1:10 with a solution containing non-interacting ST-MUC1 molecules (200 µg ST-MUC1/mL boric acid) prior to immobilization in order to increase the distance between the interacting GalNAc-PEG molecules. Incubation time was 1 h.
Prior to OT experiments, the solution containing the functionalized polystyrene beads was placed in an ultrasonic bath for 3 min in order to disrupt potential bead aggregates formed due the centrifugation step. Control experiments were performed in order to verify that the force jumps observed in the force vs. distance curves obtained using the OT were not due to unspecific interactions occurring between the polystyrene beads. These control experiments included controlled collisions between polystyrene beads that were not functionalized with mucin molecules as well as between amino-terminated polystyrene particles and mucin-functionalized particles. The experimental conditions used during the control measurements were identical to the ones used when studying self-interactions of mucin- or model compound functionalized beads.
Dynamic force spectroscopy
The dual-beam OT set-up (NanoTracker from JPK Instruments, Berlin, Germany) was equipped with a 3 W-continuous trapping laser characterized by a wavelength of the light equal to 1064 nm and a TEM00 Gaussian beam profile shared equally on two traps. The sample solution was placed in a sample chamber (volume: 12–20 µL) made of a circular and a quadratic cover slide, both thickness number 1, held together by double-sided tape and sealed with nail polish. Prior to assembly of the sample chamber, the glass surfaces were cleaned in ethanol, acetone and ultrasonicated in water for 5 min, followed by immersion in a aqueous solution of 1 mg/mL bovine serum albumin (BSA) for 20 min, rinsed in water and dried. The BSA coating of the glass prevented the functionalized beads from attaching to the glass surfaces of the sample chamber.
For each experimental series, one functionalized polystyrene bead was trapped in each of the two optical traps of the dual-beam OT set-up. The deflection sensitivities and spring constants of the optical traps were determined for each trap independently using the procedure provided in the calibration software for the instrument. The calibration was based on fitting a Lorenzian function to the power spectrum density of the Brownian motion of the polystyrene bead in the optical trap (Berg-Sorensen and Flyvbjerg 2004). The experiments were performed by moving one of the traps while keeping the other static. A displacement distance from 2 to 4 µm and a retraction speed from 0.5 to 4 µm/s were employed. All measurements were conducted at room temperature.
Determination of dissociation forces
The net displacement of the polystyrene beads away from the center of the optical trap was calculated based on information about the spatial coordinates (x, y and z) of each of the two beads. For each net displacement, the corresponding force value was identified based on the spring constant determined for each trap. The corresponding loading rate was determined based on a linear regression of the rate of increase in the force prior to the unbinding event. The interaction forces collected at increasing force loading rates, rf, were analyzed to determine the distance from the bound to the transition state, xβ, and lifetime of the complex according to the Bell–Evans formalism of force spectroscopy (Bell 1978; Evans and Ritchie 1997; Evans 1998). Average values of xβ, in the following referred to as xβ#, were determined by linear regression of the dynamic force spectrum, f* vs. ln(rf) according to Eq. (1).
| (1) |
This analysis was performed for each linear region identified after grouping the data in intervals along the axis of increasing force loading rate. The parameter f* describes the most probable unbinding force in the corresponding intervals. In Eq. (1), , kBT is the thermal energy, and a thermal scale for loading rate, defined as , where is the lifetime of the bound state in the absence of an external force. The numerical procedure used to extract the parameters of the energy landscape follow that previously reported (Haugstad et al. 2015). Parameter f* and the corresponding xβ were determined for each interval of loading rates by fitting the probability density for force-dependent dissociation P(f) to the histogram distributions. The parameter f*# refers to the most probably unbinding force within a loading rate interval as obtained by a constraint fit of P(f) using a constant value of xβ referred to as xβ #.
Funding
This work was supported by the National Institutes of Health, R01CA078834 and U01GM113534 to TAG as well as a project grant from Breast Cancer Now, number 2011NovPR43 to JB.
Conflict of interest statement
None declared.
Abbreviations
AFM, atomic force microscopy; BSA, bovine serum albumin; CCIs, carbohydrate-to-carbohydrate interactions; EDCOT, 1-(3-dimethylaminopropyl)-3-ethylcarbodiimide hydrochloride; MW, molecular weight; NMR, nuclear magnetic resonance; OT, optical tweezers; PEG, polyethylene glycol; Tn-PSM, porcine submaxillary mucin containing the Tn epitope; STn-OSM, ovine submaxillary mucin with the STn epitope
References
- Backstrom M, Link T, Olson FJ, Karlsson H, Graham R, Picco G, Burchell J, Taylor-Papadimitriou J, Noll T, Hansson GC.. 2003. Recombinant MUC1 mucin with a breast cancer-like O-glycosylation produced in large amounts in Chinese-hamster ovary cells. Biochem J. 376:677–686. [DOI] [PMC free article] [PubMed] [Google Scholar]
- Beatson R, Maurstad G, Picco G, Arulappu A, Coleman J, Wandell HH, Clausen H, Mandel U, Taylor-Papadimitriou J, Sletmoen M, et al. . 2015. The breast cancer-associated glycoforms of MUC1, MUC1-Tn and sialyl-Tn, are expressed in COSMC wild-type cells and bind the C-type lectin MGL. Plos One. 10:e0125994. [DOI] [PMC free article] [PubMed] [Google Scholar]
- Beatson RE, Taylor-Papadimitriou J, Burchell JM.. 2010. MUC1 immunotherapy. Immunotherapy. 2:305–327. [DOI] [PubMed] [Google Scholar]
- Bell GI. 1978. Models for specific adhesion of cells to cells. Science. 200:618–627. [DOI] [PubMed] [Google Scholar]
- Berg-Sorensen K, Flyvbjerg H.. 2004. Power spectrum analysis for optical tweezers. Rev Sci Instrum. 75:594–612. [Google Scholar]
- Bovin NV. 1996. Carbohydrate-carbohydrate interactions: A review. Biochemistry-Mosc. 61:694–704. [Google Scholar]
- Brockhausen I. 2006. Mucin-type O-glycans in human colon and breast cancer: Glycodynamics and functions. EMBO Rep. 7:599–604. [DOI] [PMC free article] [PubMed] [Google Scholar]
- Bucior I, Burger MM.. 2004. Carbohydrate-carbohydrate interactions in cell recognition. Curr Opin Struct Biol. 14:631–637. [DOI] [PubMed] [Google Scholar]
- Cazet A, Julien S, Bobowski M, Burchell J, Delannoy P.. 2010. Tumour-associated carbohydrate antigens in breast cancer. Breast Cancer Res. 12:204. [DOI] [PMC free article] [PubMed] [Google Scholar]
- Chiricolo M, Malagolini N, Bonfiglioli S, Dall'Olio F.. 2006. Phenotypic changes induced by expression of beta-galactoside alpha 2,6 sialyltransferase I in the human colon cancer cell line SW948. Glycobiology. 16:146–154. [DOI] [PubMed] [Google Scholar]
- Cochran JR, Cameron TO, Stone JD, Lubetsky JB, Stern LJ.. 2001. Receptor proximity, not intermolecular orientation, is critical for triggering T-cell activation. J Biol Chem. 276:28068–28074. [DOI] [PubMed] [Google Scholar]
- Corfield AP. 2015. Mucins: A biologically relevant glycan barrier in mucosal protection. Biochim Biophys Acta. 1850:236–252. [DOI] [PubMed] [Google Scholar]
- de Souza AC, Ganchev DN, Snel MME, van der Eerden JPJM, Vliegenthart JFG, Kamerling JP.. 2009. Adhesion forces in the self-recognition of oligosaccharide epitopes of the proteoglycan aggregation factor of the marine sponge Microciona prolifera. Glycoconj J. 26:457–465. [DOI] [PubMed] [Google Scholar]
- Evans E. 1998. Energy landscapes of biomolecular adhesion and receptor anchoring at interfaces explored with dynamic force spectroscopy. Faraday Discuss. 111:1–16. [DOI] [PubMed] [Google Scholar]
- Evans E, Ritchie K.. 1997. Dynamic strength of molecular adhesion bonds. Biophys J. 72:1541–1555. [DOI] [PMC free article] [PubMed] [Google Scholar]
- Friddle RW, Sulchek TA, Albrecht H, De Nardo SJ, Noy A.. 2007. Counting and breaking individual biological bonds: Force spectroscopy of tethered ligand-receptor pairs. Curr Nanosci. 3:41–48. [Google Scholar]
- Gerken TA, Dearborn DG.. 1984. C-13 NMR-studies of native and modified ovine submaxillary mucin. Biochemistry. 23:1485–1497. [DOI] [PubMed] [Google Scholar]
- Gerken TA, Gupta R, Jentoft N.. 1992. A novel approach for chemically deglycosylating =-linked glycoproteins – The deglycosylation of cubmaxillary mucin and respiratory mucins. Biochemistry. 31:639–648. [DOI] [PubMed] [Google Scholar]
- Gerken TA, Jentoft N.. 1987. Structure and dynamics of porcine submaxillary mucin as determined by natural abundance C-13 NMR-spectroscopy. Biochemistry. 26:4689–4699. [DOI] [PubMed] [Google Scholar]
- Gerken TA, Owens CL, Pasumarthy M.. 1997. Determination of the site-specific O-glycosylation pattern of the porcine submaxillary mucin tandem repeat glycopeptide – Model proposed for the polypeptide:GalNAc transferase peptide binding site. J Biol Chem. 272:9709–9719. [DOI] [PubMed] [Google Scholar]
- Gill DJ, Keit Min T, Chia J, Wang SC, Steentoft C, Clausen H, Bard-Chapeau EA, Bard FA.. 2013. Initiation of GalNAc-type O-glycosylation in the endoplasmic reticulum promotes cancer cell invasiveness. Proc Natl Acad Sci U S A. 110:E3152–E3161. [DOI] [PMC free article] [PubMed] [Google Scholar]
- Hakomori S. 2002. The glycosynapse. Proc Natl Acad Sci U S A. 99:225–232. [DOI] [PMC free article] [PubMed] [Google Scholar]
- Hakomori S. 2004. Carbohydrate-to-carbohydrate interaction in basic cell biology: A brief overview. Arch Biochem Biophys. 426:173–181. [DOI] [PubMed] [Google Scholar]
- Handa K, Hakomori S-i. 2012. Carbohydrate to carbohydrate interaction in development process and cancer progression. Glycoconj J. 29:627–637. [DOI] [PubMed] [Google Scholar]
- Hane FT, Attwood SJ, Leonenko Z.. 2014. Comparison of three competing dynamic force spectroscopy models to study binding forces of amyloid-beta (1-42). Soft Matter. 10:1924–1930. [DOI] [PubMed] [Google Scholar]
- Hanisch FA. 2001. O-glycosylation of the mucin type. Biol Chem. 382:143–149. [DOI] [PubMed] [Google Scholar]
- Haugstad KE, Gerken TA, Stokke BT, Dam TK, Brewer CF, Sletmoen M.. 2012. Enhanced self-association of mucins possessing the T and Tn carbohydrate cancer antigens at the single-molecule level. Biomacromolecules. 13:1400–1409. [DOI] [PMC free article] [PubMed] [Google Scholar]
- Haugstad KE, Stokke BT, Brewer CF, Gerken TA, Sletmoen M.. 2015. Single molecule study of heterotypic interactions between mucins possessing the Tn cancer antigen. Glycobiology. 25:524–534. [DOI] [PMC free article] [PubMed] [Google Scholar]
- Heimburg-Molinaro J, Lum M, Vijay G, Jain M, Almogren A, Rittenhouse-Olson K.. 2011. Cancer vaccines and carbohydrate epitopes. Vaccine. 29:8802–8826. [DOI] [PMC free article] [PubMed] [Google Scholar]
- Hollingsworth MA, Swanson BJ.. 2004. Mucins in cancer: Protection and control of the cell surface. Nat Rev Cancer. 4:45–60. [DOI] [PubMed] [Google Scholar]
- Ju T, Aryal RP, Kudelka MR, Wang Y, Cummings RD.. 2014. The Cosmc connection to the Tn antigen in cancer. Cancer Biomark. 14:63–81. [DOI] [PMC free article] [PubMed] [Google Scholar]
- Ju TZ, Otto VI, Cummings RD.. 2011. The Tn antigen-structural simplicity and biological complexity. Angew Chem-Int Edit. 50:1770–1791. [DOI] [PMC free article] [PubMed] [Google Scholar]
- Julien S, Adriaenssens E, Ottenberg K, Furlan A, Courtand G, Vercoutter-Edouart AS, Hanisch FG, Delannoy P, Le Bourhis X.. 2006. ST6GalNAc I expression in MDA-MB-231 breast cancer cells greatly modifies their O-glycosylation pattern and enhances their tumourigenicity. Glycobiology. 16:54–64. [DOI] [PubMed] [Google Scholar]
- Julien S, Krzewinski-Recchi MA, Harduin-Lepers A, Gouyer V, Huet G, Le Bourhis X, Delannoy P.. 2001. Expression of Sialyl-Tn antigen in breast cancer cells transfected with the human CMP-Neu5Ac: GalNAc alpha 2,6-sialyltransferase (ST6GalNAc 1) cDNA. Glycoconj J. 18:883–893. [DOI] [PubMed] [Google Scholar]
- Kunze A, Bally M, Hook F, Larson G.. 2013. Equilibrium-fluctuation-analysis of single liposome binding events reveals how cholesterol and Ca2+ modulate glycosphingolipid trans-interactions. Sci Rep. 3:8. [DOI] [PMC free article] [PubMed] [Google Scholar]
- Lai C-H, Huetter J, Hsu C-W, Tanaka H, Varela-Aramburu S, De Cola L, Lepenies B, Seeberger PH.. 2016. Analysis of carbohydrate-carbohydrate interactions using sugar-functionalized silicon nanoparticles for cell imaging. Nano Lett. 16:807–811. [DOI] [PubMed] [Google Scholar]
- Lakshminarayanan V, Thompson P, Wolfert MA, Buskas T, Bradley JM, Pathangey LB, Madsen CS, Cohen PA, Gendler SJ, Boons GJ.. 2012. Immune recognition of tumor-associated mucin MUC1 is achieved by a fully synthetic aberrantly glycosylated MUC1 tripartite vaccine. Proc Natl Acad Sci U S A. 109:261–266. [DOI] [PMC free article] [PubMed] [Google Scholar]
- Link T, Backstrom M, Graham R, Essers R, Zorner K, Gatgens J, Burchell J, Taylor-Papadimitriou J, Hansson GC, Noll T.. 2004. Bioprocess development for the production of a recombinant MUC1 fusion protein expressed by CHO-K1 cells in protein-free medium. J Biotechnol. 110:51–62. [DOI] [PubMed] [Google Scholar]
- Lorenz B, de Cienfuegos LA, Oelkers M, Kriemen E, Brand C, Stephan M, Sunnick E, Yuksel D, Kalsani V, Kumar K, et al. . 2012. Model system for cell adhesion mediated by weak carbohydrate-carbohydrate interactions. J Am Chem Soc. 134:3326–3329. [DOI] [PMC free article] [PubMed] [Google Scholar]
- Madsen CB, Lavrsen K, Steentoft C, Vester-Christensen MB, Clausen H, Wandall HH, Pedersen AE.. 2013. Glycan elongation beyond the mucin associated Tn antigen protects tumor cells from immune-mediated killing. Plos One. 8:e72413. [DOI] [PMC free article] [PubMed] [Google Scholar]
- Muller S, Alving K, Peter-Katalinic J, Zachara N, Gooley AA, Hanisch FG.. 1999. High density O-glycosylation on tandem repeat peptide from secretory MUC1 of T47D breast cancer cells. J Biol Chem. 274:18165–18172. [DOI] [PubMed] [Google Scholar]
- Mungul A, Cooper L, Brockhausen I, Ryder K, Mandel U, Clausen H, Rughetti A, Miles DW, Taylor-Papadimitriou J, Burchell JM.. 2004. Sialylated core 1 based O-linked glycans enhance the growth rate of mammary carcinoma cells in MUC1 transgenic mice. Int J Oncol. 25:937–943. [PubMed] [Google Scholar]
- Murthy RV, Bavireddi H, Gade M, Kikkeri R.. 2015. Exploiting the lactose-GM(3) interaction for drug delivery. ChemMedChem. 10:792–796. [DOI] [PubMed] [Google Scholar]
- Ozaki H, Matsuzaki H, Ando H, Kaji H, Nakanishi H, Ikehara Y, Narimatsu H.. 2012. Enhancement of metastatic ability by ectopic expression of ST6GalNAcI on a gastric cancer cell line in a mouse model. Clin Exp Metastasis 29:229–238. [DOI] [PMC free article] [PubMed] [Google Scholar]
- Padler-Karavani V, Yu H, Cao H, Chokhawala H, Karp F, Varki N, Chen X, Varki A.. 2008. Diversity in specificity, abundance, and composition of anti-Neu5Gc antibodies in normal humans: Potential implications for disease. Glycobiology. 18:818–830. [DOI] [PMC free article] [PubMed] [Google Scholar]
- Picco G, Julien S, Brockhausen I, Beatson R, Antonopoulos A, Haslam S, Mandel U, Dell A, Pinder S, Taylor-Papadimitriou J, et al. . 2010. Over-expression of ST3Gal-I promotes mammary tumorigenesis. Glycobiology. 20:1241–1250. [DOI] [PMC free article] [PubMed] [Google Scholar]
- Pinho SS, Reis CA.. 2015. Glycosylation in cancer: Mechanisms and clinical implications. Nat Rev Cancer. 15:540–555. [DOI] [PubMed] [Google Scholar]
- Priatel JJ, Chui D, Hiraoka N, Simmons CJT, Richardson KB, Page DM, Fukuda M, Varki NM, Marth JD.. 2000. The ST3Gal-I sialyltransferase controls CD8(+) T lymphocyte homeostasis by modulating O-glycan biosynthesis. Immunity. 12:273–283. [DOI] [PubMed] [Google Scholar]
- Radhakrishnan P, Dabelsteen S, Madsen FB, Francavilla C, Kopp KL, Steentoft C, Vakhrushev SY, Olsen JV, Hansen L, Bennett EP, et al. . 2014. Immature truncated O-glycophenotype of cancer directly induces oncogenic features. Proc Natl Acad Sci U S A. 111:E4066–E4075. [DOI] [PMC free article] [PubMed] [Google Scholar]
- Reichardt NC, Martin-Lomas M, Penades S.. 2013. Glyconanotechnology. Chem Soc Rev. 42:4358–4376. [DOI] [PubMed] [Google Scholar]
- Rojo J, Morales JC, Penades S.. 2002. Carbohydrate-carbohydrate interactions in biological and model systems. Host-Guest Chemistry. 218:45–92. [Google Scholar]
- Sletmoen M, Skjak-Braek G, Stokke BT.. 2004. Single-molecular pair unbinding studies of mannuronan C-5 epimerase AlgE4 and its polymer substrate. Biomacromolecules. 5:1288–1295. [DOI] [PubMed] [Google Scholar]
- Suzuki Y, Sutoh M, Hatakeyama S, Mori K, Yamamoto H, Koie T, Saitoh H, Yamaya K, Funyu T, Habuchi T, et al. . 2012. MUC1 carrying core 2 O-glycans functions as a molecular shield against NK cell attack, promoting bladder tumor metastasis. Int J Oncol. 40:1831–1838. [DOI] [PMC free article] [PubMed] [Google Scholar]
- Tamura F, Sato Y, Hirakawa M, Yoshida M, Ono M, Osuga T, Okagawa Y, Uemura N, Arihara Y, Murase K, et al. . 2016. RNAi-mediated gene silencing of ST6GalNAc I suppresses the metastatic potential in gastric cancer cells. Gastric Cancer. 19:85–97. [DOI] [PubMed] [Google Scholar]
- Taylor-Papadimitriou J, Burchell J, Miles DW, Dalziel M.. 1999. MUC1 and cancer. Biochim Biophys Acta-Mol Basis Dis. 1455:301–313. [DOI] [PubMed] [Google Scholar]
- Tromas C, Rojo J, de la Fuente JM, Barrientos AG, Garcia R, Penades S.. 2001. Adhesion forces between Lewis(x) determinant antigens as measured by atomic force microscopy. Angew Chem-Int Edit. 40:3052–3055. [DOI] [PubMed] [Google Scholar]
- van Kooyk Y, Figdor CG.. 2000. Avidity regulation of integrins: The driving force in leukocyte adhesion. Curr Opin Cell Biol. 12:542–547. [DOI] [PubMed] [Google Scholar]
- Varki A. 2001. Loss of N-glycolylneuraminic acid in humans: Mechanisms, consequences, and implications for hominid evolution. Am J Phys Anthropol. Suppl 33:54–69. [DOI] [PMC free article] [PubMed] [Google Scholar]
- Wagner KW, Punnoose EA, Januario T, Lawrence DA, Pitti RM, Lancaster K, Lee D, von Goetz M, Yee SF, Totpal K, et al. . 2007. Death-receptor O-glycosylation controls tumor-cell sensitivity to the proapoptotic ligand Apo2L/TRAIL. Nat Med. 13:1070–1077. [DOI] [PubMed] [Google Scholar]
- Wandall HH, Blixt O, Tarp MA, Pedersen JW, Bennett EP, Mandel U, Ragupathi G, Livingston PO, Hollingsworth MA, Taylor-Papadimitriou J, et al. . 2010. Cancer biomarkers defined by autoantibody signatures to aberrant O-glycopeptide epitopes. Cancer Res. 70:1306–1313. [DOI] [PMC free article] [PubMed] [Google Scholar]
- Yoon SJ, Utkina N, Sadilek M, Yagi H, Kato K, Hakomori S.. 2013. Self-recognition of high-mannose type glycans mediating adhesion of embryonal fibroblasts. Glycoconj J. 30:485–496. [DOI] [PubMed] [Google Scholar]
- Zhao JS, Liu YF, Park HJ, Boggs JM, Basu A.. 2012. Carbohydrate-coated fluorescent silica nanoparticles as probes for the galactose/3-sulfogalactose carbohydrate-carbohydrate interaction using model systems and cellular binding studies. Bioconjug Chem. 23:1166–1173. [DOI] [PubMed] [Google Scholar]


