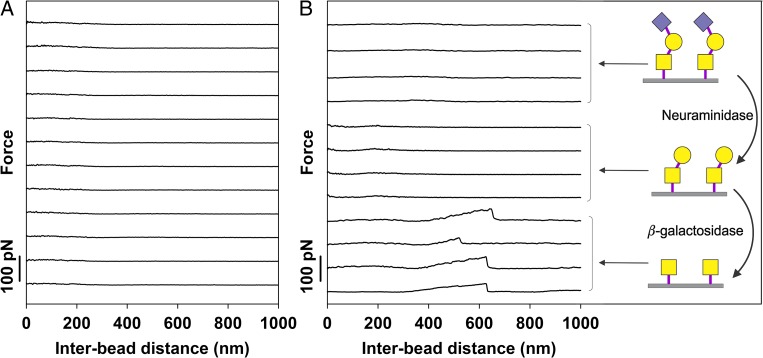
Fig. 6.
Examples of force–distance curves obtained for (A) T-MUC1 and (B) ST-MUC1 prior to (four upper curves) and after treatment with neuraminidase (four middle curves) as well as after successive treatment with both neuraminidase and β-galactosidase (four lower curves). The experiments were performed at room temperature in 100 mM HEPES buffer pH 7.2 containing 1 mM CaCl2 and 1 mM MnCl2. The schematic illustrations present the glycan structures on the mucin molecules after each enzymatic treatment. The upper illustration presents the initial glycan structures of ST-MUC1, the middle illustration presents the glycan structures of ST-MUC1 after treatment with neuraminidase (producing a T-MUC1 like mucin), while the bottom illustration shows the glycan structures after subsequent action of neuraminidase and β-galactosidase. The symbols used are defined in Table I. This figure is available in black and white in print and in color at Glycobiology online.

