

ABSTRACT
Hepatoblastoma (HB) is the most common liver tumor of childhood, usually occurring in children under the age of 3 y. The prognosis of patients presenting with distant metastasis, vascular invasion and advanced tumor stages remains poor and children that do survive often face severe late effects from the aggressive chemotherapy regimen. To identify potential new therapeutics for high risk HB we used a 1,000-gene expression signature as input for a Connectivity Map (CMap) analysis, which predicted histone deacetylase (HDAC) inhibitors as a promising therapy option. Subsequent expression analysis of primary HB and HB cell lines revealed a general overexpression of HDAC1 and HDAC2, which has been suggested to be predictive for the efficacy of HDAC inhibition. Accordingly, treatment of HB cells with the HDAC inhibitors SAHA and MC1568 resulted in a potent reduction of cell viability, induction of apoptosis, reactivation of epigenetically suppressed tumor suppressor genes, and the reversion of the 16-gene HB classifier toward the more favorable expression signature. Most importantly, the combination of HDAC inhibitors and cisplatin – a major chemotherapeutic agent of HB treatment - revealed a strong synergistic effect, even at significantly reduced doses of cisplatin. Our findings suggest that HDAC inhibitors skew HB cells toward a more favorable prognostic phenotype through changes in gene expression, thus indicating a targeted molecular mechanism that seems to enhance the anti-proliferative effects of conventional chemotherapy. Thus, adding HDAC inhibitors to the treatment regimen of high risk HB could potentially improve outcomes and reduce severe late effects.
KEYWORDS: Cisplatin, connectivity map, HDAC inhibitor, hepatoblastoma, SAHA, therapy
Introduction
Hepatoblastoma (HB) is the most common liver tumor of childhood, usually occurring in children under the age of 3 y.1 Over the last decades tremendous improvement has been made in the stratification and treatment of this highly malignant tumor. Nonetheless, patients that present with metastases, vascular invasion or vast tumor extension are still facing a poor outcome with overall survival rates of only 60%.2,3 The SIOPEL 4 protocol, which was designed to treat those high risk patients, utilizes a very aggressive regimen of chemotherapy resulting in severe long term side effects in surviving children.4,5 Those late effects include cardiomyopathy, congestive heart failure and development of second cancers from high doses of doxorubicin as well as permanent hearing impairment and kidney damage from platin derivatives.6-8 New targeted treatment options hold the potential not only to improve outcome in high risk patients, but to help minimize late effects. Therefore, the identification of potentially druggable targets in HB remains critical.
Besides clinical parameters, gene expression signatures have shown great value in the stratification of HB.9 A 16-gene HB classifier is able to discriminate between 2 subclasses of tumors and was equally effective in predicting prognosis compared to clinical and histological tumor staging. The C1 subclass is associated with an early tumor stage and a favorable patient outcome, whereas the C2 subclass is tied to advanced tumor stage, metastases, vascular invasion and poor prognosis.9
Gene expression profiles that correlate with specific phenotypic features of a disease are also used in the identification of potential new treatment options utilizing biomedical software called the Connectivity Map (CMap).10,11 CMap is able to link gene expression patterns associated with a distinct phenotype or disease to corresponding patterns derived from drug-treated cancer cell lines. This in silico approach has already been successfully used to identify new potential therapeutics for a variety of cancers.12-14
Over the last few years it became clear that epigenetic chromatin modifiers, such as histone deacetylases (HDACs), play a crucial role in the development of various malignancies by aberrantly silencing tumor suppressor genes.15 HDACs catalyze the removal of acetyl groups from lysine residues on core histones. This leads to a more compact chromatin structure, making it less accessible to specific transcription factors and general transcription machinery as well as altering gene expression toward cancer initiation and progression.16 HDAC inhibition (HDACi) has shown great promise as a treatment option of tumor entities, in which those epigenetic regulators are overexpressed or deregulated.16
By using CMap 10 and publically available gene expression data 9 we identified HDAC inhibitors as one promising molecule class for future therapeutic intervention of high risk HB. We show that HDACs are overexpressed in HB primary tumors and cell lines and that HDACi is able to reduce cell viability and induce apoptosis in HB cells. Furthermore, we demonstrate that HDACi also leads to re-expression of HB-specific tumor suppressor genes and attenuation of the adverse C2 subclass 16-gene expression in HB cells. Finally, we reveal novel therapeutic synergies between cisplatin and HDAC inhibitors, which increase the efficacy of the treatment and lead to a substantial dose reduction of cisplatin. These findings suggest that HDACi is a potential new therapy option for high risk HB.
Results
Connectivity map identifies HDAC inhibitors as potential treatment option of high risk HB
To identify new treatment options for high risk HB we used the Connectivity Map (CMap), a bioinformatic tool that shows functional connections between drugs and gene expression signatures of diseases.10 We built an expression signature from existing data derived from 13 primary HB.9 The signature contained 1,000 genes that best discriminated the high risk-related C2 subtype from the standard risk-related C1 subtype of HB (Suppl. Table 1). C2 tumors within this cluster were associated with poor survival, distant metastasis, vascular invasion, and advanced PRETEXT stages (Fig. 1A). We then used the discriminating signature as an input query for CMap and specifically looked for compounds with negative correlation scores, indicating potential therapeutic value for high risk patients. Out of 1,309 compounds represented by CMap, 2 known inhibitors of PI3K/AKT signaling that have already shown therapeutic effects in HB,17,18 namely LY-294002 and sirolimus, were highly ranked in the CMap screen (Table 1), thereby underscoring the capability of Cmap in identifying relevant drugs. More interestingly, 2 known HDAC inhibitors were within the top matches for the C2 signature (Table 1), namely vorinostat (SAHA) and trichostatin A (TSA). When we plotted the individual correlation scores of the C2 signature for all instances comprising SAHA treatments (12 in CMap) and TSA treatments (182 in CMap), we found them predominantly to be negative (Fig. 1B). This data suggests that HDAC inhibitors can reverse the C2 signature and might therefore constitute a suitable new treatment option of high risk HB.
Figure 1.
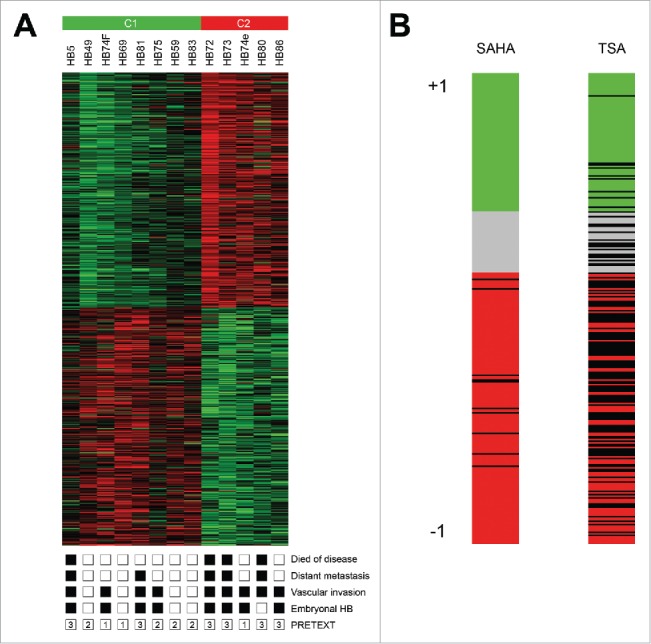
(A) Hierarchical clustering of the 1,000 best discriminating genes between the standard risk C1 and the high risk C2 HB subclasses. Important clinicopathological characteristics are depicted below. A detailed list of the genes can be found in Suppl. Table 1. (B) Bar graphs represent the Connectivity Score data for vorinostat (SAHA) and trichostatin A (TSA). The black horizontal lines represent each instance performed with the respective compound. Instances in the red area indicate negative correlation scores and instances in the green area positive ones. No correlation can be detected for instances in the gray area.
Table 1.
Results of Connectivity Map analysis.
| Rank | CMap name | mean | n | enrichment | P-value | Percent |
|---|---|---|---|---|---|---|
| 1 | vorinostat | −0.541 | 12 | −0.475 | 0.005 | 100 |
| 2 | thioridazine | −0.492 | 20 | −0.434 | <0.001 | 90 |
| 3 | prochlorperazine | −0.489 | 16 | −0.374 | 0.017 | 87 |
| 4 | chlorpromazine | −0.474 | 19 | −0.343 | 0.017 | 84 |
| 5 | trifluoperazine | −0.473 | 16 | −0.420 | 0.005 | 75 |
| 6 | α-estradiol | −0.452 | 16 | −0.330 | 0.047 | 81 |
| 7 | trichostatin A | −0.426 | 182 | −0.286 | <0.001 | 85 |
| 8 | fluphenazine | −0.426 | 18 | −0.322 | 0.039 | 83 |
| 9 | tretinoin | −0.396 | 22 | −0.303 | 0.027 | 81 |
| 10 | 15-delta prostaglandin J2 | −0.372 | 15 | −0.401 | 0.011 | 66 |
| 11 | LY-294002 | −0.371 | 61 | −0.260 | <0.001 | 72 |
| 12 | tanespimycin | −0.358 | 62 | −0.212 | 0.007 | 72 |
| 13 | sirolimus | −0.311 | 44 | −0.242 | 0.010 | 70 |
HDACs are overexpressed in HB
As high expression levels of HDACs have been suggested as a positive predictor for the efficacy of HDAC inhibition (HDACi) as a treatment option,19 we determined the expression levels of class I (HDAC1, HDAC2 and HDAC3) and class IIa HDACs (HDAC4, HDAC5 and HDAC7) in 30 primary HB, 5 liver tumor cell lines and 10 non-tumor liver samples. We found that HDAC1, HDAC2 and HDAC4 are generally overexpressed in primary HB compared to normal liver expression, with HDAC1 and HDAC2 being also overexpressed in HB cell lines (Fig. 2A). Interestingly, we found tumors exhibiting the high risk C2 signature to be significantly correlated with high expression levels of HDAC 1 and 2 (Fig. 2B). These findings suggest that HB exhibit a strong overexpression of several HDACs, especially of class I that are known to be associated with higher tumor grades, aggressive phenotypes and poor prognosis in other solid tumors.20,21
Figure 2.

(A) HDAC expression levels of normal liver, primary HB and liver tumor cell lines (CL). Expression of class I and class IIa HDACs were measured by qRT-PCR and normalized to the expression of the house-keeping gene TBP. Statistical significance was calculated for differences between normal liver tissue and tumors and tumor cell lines using t-test. (B) HDAC expression levels of primary HB after their stratification as standard (C1) or high risk HB (C2) according to the 16-gene HB classifier. Statistical significance was calculated for differences between C1 and C2 tumors using t-test.
HDACi inhibits growth and induces apoptosis in HB cells
To investigate the effect of HDACi on HB cells, we evaluated the impact of 2 HDAC inhibitors as a monotherapy on the viability of various liver tumor cell lines and fibroblasts as a control, namely SAHA, a pan inhibitor that is able to block the activity of all HDAC subclasses and MC1568, a subclass inhibitor that blocks only class IIa HDACs. Treatment with SAHA resulted in a potent reduction of cell viability in a dose dependent manner (Fig. 3A). Monotherapy of HB cells with MC1568 affected cell viability only at its highest concentration (10µM). Although expression levels of HDAC4 (class IIa) are high in the primary tumors, they are surprisingly low in the cell lines (Fig. 2A), which might explain the ineffectiveness of class IIa inhibition in vitro. Both HDAC inhibitors showed little or no effect on the non-cancerous fibroblasts, suggesting a selective effect of HDACi on liver tumor cells through inhibition of class I HDAC activity.
Figure 3.

(A) Cell viability of HB cell lines and fibroblasts as evaluated by MTT assay after 48 h treatment with indicated concentrations of MC1568 and SAHA. Values represent means ± standard deviation of 3 independent experiments performed in duplicates. (B) Cell cycle distribution (left panel) and apoptosis (right panel) of liver tumor cell lines were analyzed by flow cytometry 48 h after treatment with vehicle (DMSO), 10µM of MC1568 and 1µM (HUH6, HepT1 and HepG2) or 2µM of SAHA (HUH7). (C) Western blot analysis for cleaved PARP in indicated HB cell lines after 48 h of treatment with DMSO, MC1568 and SAHA (concentrations as in B). (D) Expression levels of the tumor suppressor genes SFRP1, HHIP, and IGFBP3 in liver tumor cell lines after HDACi. Expression levels were measured after 48 h of treatment by qRT-PCR and normalized to the expression of the house-keeping gene TBP. Indicated are fold changes to the individual DMSO control.
In order to see how HDAC inhibitors convey their anti-proliferative effects in liver tumor cells we conducted cell cycle and apoptosis analyses. Cells showed only minimal changes in cell cycle progression when treated with either SAHA or MC1568 (Fig. 3B). Interestingly, SAHA treated cells showed a strong induction of apoptosis (Fig. 3B). MC1568 did also induce apoptosis, but to a much lower extent (Fig. 3B). Additional protein analysis unveiled high levels of cleaved PARP after cells underwent HDACi, furthering the assumption that HDAC inhibitors convey their anti-proliferative capabilities rather through induction of apoptosis than cell cycle arrest (Fig. 3C).
Given the fact that the overexpression of HDACs in tumors has been identified as a key factor of aberrant epigenetic tumor suppressor silencing,22 we examined the expression levels of genes epigenetically silenced in HB 23-25 after treatment with HDAC inhibitors. We found hedgehog-interacting protein (HHIP), secreted frizzeled-related protein 1 (SFRP1) and insulin-like growth factor-binding protein 3 (IGFBP3) to be strongly re-expressed upon HDACi in most cell lines (Fig. 3D), thereby suggesting that the pro-apoptotic effect of HDAC therapy is functionally linked to restored tumor suppressor expression.
HDACi is able to change the unfavorable gene expression signature in HB cells
The results of the CMap analysis suggest that HDAC inhibitors can potentially reverse the unfavorable C2 expression signature toward the prognostic more favorable C1 signature, virtually turning a high risk HB into a standard risk HB with a better response to therapy and a better outcome. In order to validate the prognostic value of this system for our cohort of 30 primary tumors, we first tested for correlations between HB-subclass (C1/C2) and clinicopathological characteristics. We found that tumors of the C2 subclass were in fact significantly associated with poor survival (Fig. 4A), metastasis, vascular invasion, advanced SIOPEL stage and the unfavorable embryonal histotype (Table 2). As high expression of the genes RPL10A, E2F5, NLE1, BUB1, DLG7, IGSF1, AFP and DUSP9 is characteristic of high risk C2 subclass tumors,9 we analyzed various liver tumor cell lines that initially show the adverse C2 expression profile after treatment with HDAC inhibitors. In line with the CMap data, we found a strong decrease in expression of most of those genes upon treatment, suggesting a shift from the high risk C2 signature (associated with high expression of the indicated genes) to the standard risk C1 signature (associated with low expression levels of the indicated genes) (Fig. 4B).
Figure 4.

(A) Overall survival was calculated as time from diagnosis to death of the disease and is plotted for 30 HB patients. Statistical significance was calculated using the Mantel-Cox test. (B) Cell lines expressing the adverse C2 signature were treated with 10µM of MC1568, 1µM (HUH6, HepT1 and HepG2) and 2µM (HUH7) of SAHA, or vehicle (DMSO). Graphs show decreased expression levels in percent of 8 high risk C2 signature genes of the indicated genes upon 48 h of treatment with the indicated HDAC inhibitors.
Table 2.
Association between C1/C2 classification and clinicopathological features of HB.
| Factors | No. of tumors | C1 | C2 | P-value |
|---|---|---|---|---|
| Sex | 0.715 | |||
| Male | 15 | 7 | 8 | |
| Female | 15 | 8 | 7 | |
| Age at diagnosis (months) | 0.232 | |||
| <36 | 21 | 12 | 9 | |
| >36 | 9 | 3 | 6 | |
| Histological type | 0.003 | |||
| Fetal | 23 | 15 | 8 | |
| Embryonal | 7 | 0 | 7 | |
| Stage (PRETEXT) | 0.068 | |||
| 1–3 | 24 | 14 | 10 | |
| 4 | 6 | 1 | 5 | |
| SIOPEL risk group | 0.001 | |||
| Standard risk | 15 | 12 | 3 | |
| High risk | 15 | 3 | 12 | |
| Outcome | 0.013 | |||
| Alive | 22 | 14 | 8 | |
| Dead | 8 | 1 | 7 | |
| Metastasis | 0.003 | |||
| No | 16 | 12 | 4 | |
| Yes | 14 | 3 | 11 | |
| Vascular invasion | 0.031 | |||
| No | 23 | 14 | 9 | |
| Yes | 7 | 1 | 6 | |
| Multifocality | 0.409 | |||
| No | 22 | 12 | 10 | |
| Yes | 8 | 3 | 5 |
Combination of HDACi and cisplatin show strong synergies
Recent studies suggest that HDAC overexpression is responsible for chemoresistance in solid tumors 19,26 and that HDAC inhibitors can sensitize those tumors to conventional chemotherapy, especially to cisplatin.27,28 As a proof of concept, we combined each HDAC inhibitor and cisplatin at various concentrations and compared the effects on cell viability with those of a combination of doxorubicin and cisplatin, which constitutes the SIOPEL4 regimen.5 When we analyzed the viability data of the combinational therapy and compared them to the monotherapy data of each individual compound by using the CompuSyn software, which is able to identify synergies between 2 compounds, we found synergistic effects between the HDAC inhibitors and cisplatin in all cell lines and at most concentrations (Fig. 5A). Notably, only few synergies were detected between doxorubicin and cisplatin.
Figure 5.
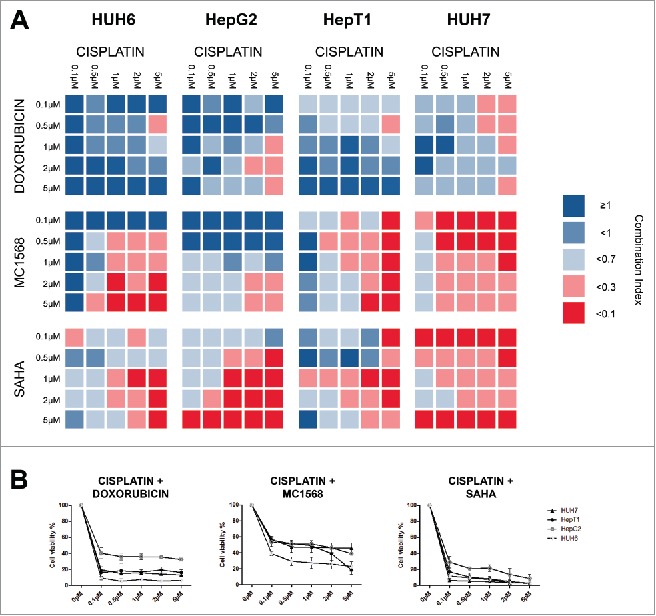
(A) Cell lines were treated with the indicated concentrations of cisplatin combined with various concentration of either doxorubicin, MC1568 or SAHA. Cell viability was measured after 48 h and combination indices (CI) were calculated from 2 independent experiments performed in duplets. CI < 0.1 = very strong synergism, CI < 0.3 = strong synergism, CI < 0.7 = synergism, CI <1 = slight synergism, CI ≥ 1 no synergism. (B) Cell lines were treated with the indicated concentrations of cisplatin combined with 5µM of either doxorubicin, MC1568 or SAHA. Cell viability was measured after 48 h from 2 independent experiments performed in duplets.
When we looked at cell viability we found that combinations of cisplatin and SAHA were equally effective compared to combinations of cisplatin and doxorubicin (data not shown). We found the strongest synergies between 5µM cisplatin and various concentrations of SAHA. Combinations at this particular concentration appear to be slightly superior to the combination of cisplatin and doxorubicin at equal concentrations in regard to cell viability (Fig. 5B). While MC1568 and cisplatin combinations also showed a considerable effect on cell viability, it did not achieve the effect of cisplatin and doxorubicin combinations at any concentration.
Discussion
Since standard risk HB patients can achieve good outcomes with already existing therapy regimens,2 we focused our research on the discovery of new treatment options for high risk patients, whose outcome still remains poor with the current treatment strategies.3,5 Using CMap, we identified HDAC inhibitors as potential new drugs for the treatment of high risk HB. Interestingly, previous studies have already shown anti-proliferative effects of HDACi in vitro 29-31 and in preclinical mouse models of hepatocellular carcinoma (HCC),32 the most common liver tumor in adults with a considerably poor outcome. Consequently, the pan HDAC inhibitor belinostat has recently been tested in a clinical phase I/II trial for patients with unresectable HCC, which resulted in disease stabilization with a tolerable toxicity profile.33 Moreover, as phase I clinical trials have already demonstrated the safe use of SAHA in pediatric populations,34,35 based on earlier preclinical in vitro studies using SAHA with doses similar to the ones in our experiments,36-38 it could be emphasized that these doses are clinically achievable and tolerable. Thus, our findings are in line with studies in HCC and support the concept of HDACi as a promising treatment strategy for liver malignancies, both in the adult and pediatric population.
Our systematic expression analysis of a large set of primary HB and liver tumor cell lines revealed that HDACs are generally upregulated compared to normal liver tissue. Overexpression of HDAC2 has been suggested as a positive predictive marker for the response of solid tumors to treatment with HDAC inhibitors.19,39,40 Treatment of liver tumor cells with HDAC inhibitors seem to support this theory, given the fact that the cell lines with high HDAC2 expression (HUH6 and HUH7) were most responsive to HDACi, whereas cell lines with normal HDAC2 expression (HepG2 and HepT1) responded poorly to the monotherapy regimen. However, if HDAC2 has the potential to be used as a biomarker for predicting clinical responses to HDACIs, as shown for HR23B in adult HCC,33 has to be confirmed in future studies.
The changes induced by HDACi in the gene expression of HB cells that initially showed the adverse C2 signature not only underlines the predictive power of the CMap by partially reversing this signature, but also suggests a specific benefit of HDACi for patients with high-risk HB. Since our analysis showed a strong association between the C2 signature of primary tumors and clinicopathological features, such as poor survival, metastasis, vascular invasion and advanced tumor stage, a HDACi induced change in gene expression toward the more favorable C1 signature could potentially lead to a better outcome and an enhanced response to treatment.
Late effects of chemotherapy constitute an increasing problem, given the tremendous progress that has been made in achieving better long-term survival rates for children with cancer. Doxorubicin, the chemotherapeutic currently used to escalate the therapy of high-risk HB, is among the agents with the most severe late effects such as cardiomyopathy, congestive heart failure and development of secondary malignancies.4,8 Our data suggest that doxorubicin can possibly be replaced with the HDAC inhibitor SAHA as the escalating agent for the high risk HB group in addition to the cisplatin backbone, without compromising the efficacy of the treatment. Furthermore, HDAC inhibitors, especially SAHA, have shown great promise in overcoming chemoresistance in solid tumors. Studies provide evidence that HDACi can sensitize tumor cells for chemotherapeutics, especially cisplatin.26,27 The strong synergies we found between SAHA and cisplatin hold the potential to reduce cisplatin concentrations, which would further diminish the late effects caused by this agent, namely permanent hearing impairment and kidney damage.4,6,7
While further studies are warranted to reveal whether HDACi also represents a successful treatment option in vivo, which could be preclinically tested in genetic or patient-derived xenograft mouse models, our data suggest a direct benefit of HDACi for children with high-risk HB through a more targeted approach. This could potentially open up new therapeutic opportunities for future clinical studies in which substituting conventional chemotherapeutic agents with HDACi could reduce detrimental long-term side effects in patients.
Patients and methods
Connectivity map analysis
Expression profiling data from 13 primary HB with defined histological and clinical annotations (Suppl. Table 3) were obtained from ArrayExpress (http://www.ebi.ac.uk/microarray-as/ae/) under the accession numbers E-MEXP-1851.9 After using this data to identify the most differentially expressed genes between previously defined standard risk tumors (C1) and high risk tumors (C2), we built a gene expression profile containing the 1,000 best discriminating genes between these 2 subclasses (Suppl. Table 1). We entered this signature into the latest dataset of CMap (Build 02) and compared it to more than 7,000 so-called instances, which are defined by expression profiles of human cancer cell lines treated with 1,309 therapeutic compounds at different concentrations (http://www.broadinstitute.org/cmap). Each instance was assigned a connectivity score from −1 to 1, representing the relative association of the respective instance with the specific query. A positive connectivity score indicates that a drug is able to induce the input signature in human cell lines. Conversely, a negative connectivity score indicates that a drug is able to reverse the input signature. Since we used the high risk C2 signature as input, we looked for negative connectivity scores, which indicate potential therapeutic value. After rank-ordering all instances, the connectivity score of various instances of the same compound were averaged and filtered by the number of instances (n >10) and P-value (<0 .05).
Patients and materials
A total of 30 liver tumor specimens were obtained from pediatric patients undergoing surgical resection in our department. Matching normal liver was available from 10 patients. Written informed consent was obtained from each patient, and the study protocol was approved by the Committee of Ethics of the Ludwig-Maximilians-University of Munich. We used the 4 human HB cell lines HepT1, HepT3 (both provided by Dr. T. Pietsch), HepG2 (ATCC, Manassas, VA, USA), and HUH6 (Japanese Collection of Research Bioresources, Osaka, Japan), the hepatocellular carcinoma cell line HUH7 (kindly provided by Dr. Enrico de Toni), as well as human fibroblasts, which were obtained from a skin biopsy of a healthy male volunteer. Cells were grown at 37°C in RPMI medium containing 10% FCS, 1% antibiotics and glutamine supplement.
Real-time reverse transcription polymerase chain reaction
RNA extraction and purification, cDNA synthesis, PCR amplifications and quantization of gene expression were performed as described before 25 using the primer pairs outlined in Suppl. Table 2. Amplification of the house-keeping gene TATA-Box-binding-Protein (TBP) was performed to standardize the amount of sample RNA.
Proliferation assays and detection of synergy
Cell proliferation was assessed using 1-(4,5-dimethylthiazol-2-yl)-3,5-diphenylformazan (MTT) assays. Cells were seeded at a density of 10,000 cells per well into 96 well plates (NUNC, Langenselbold, Germany). After overnight attachment, cells were treated for 48 hours with various concentrations of suberoylanilide hydroxamic acid (SAHA, Sigma-Aldrich, Steinheim, Germany), MC1568 (Selleck Chemicals, Munich, Germany), cisplatin (Selleck Chemicals), doxorubicin (Selleck Chemicals), DMSO (Sigma-Aldrich) or various combinations of those compounds. To assess cell viability, the optical density was measured at a wavelength of 595 nm after the addition of MTT using the GENios multi scanner microplate reader (TECAN, Männedorf, Switzerland). Synergy testing of the combined treatment was analyzed using the CompuSyn software (http://www.combosyn.com/), which utilizes the Chou-Talalay method.41 The calculated combination index (CI) was used as a quantitative measure of the degree of interaction between 2 drugs. CI = 1 indicates additivity, CI > 1 indicates antagonism, and CI < 1 indicates synergism.
Apoptosis and cell cycle analysis
Cells were seeded in 6 well plates and after 24 hours, exposed to DMSO, SAHA or MC1568 at various concentrations for 48 hours. Fixation and permeabilization of cells were performed by dropwise addition of 70% ethanol while vortexing and incubation at −20°C for at least 2 hours. Permeabilized cells were washed with PBS and DNA was stained using 0.02 mg/ml propidium iodide (Sigma-Aldrich) and 0.2 mg/ml RNaseA (Qiagen, Hilden, Germany) in PBS/0.1%Triton X-100 (Sigma-Aldrich) for 30 minutes at room temperature in the dark. Cell cycle was analyzed via BD-LSRFORTESSA flow cytometer (BD Biosciences, San Jose, CA, USA) and using Flowing software 2.5.1 (http://www.flowingsoftware.com/).
Western blot
Cells were seeded at a density of 1 × 10⁶ per 10 cm cell culture dish. After overnight attachment cells were treated for 48 hours with SAHA, MC1568 or DMSO at various concentrations. After treatment non-adherent cells and adherent cells were pooled together in ice-cold lysis buffer (0.5% Triton-X100, 1 mM orthosodiumvanadate, cOmplete Mini protease inhibitor (Roche Diagnostics, Penzberg, Germany)). Protein lysates were incubated on ice for 20 minutes under occasional vortexing. After centrifugation for 30 minutes at 4°C protein lysates without cell debries were stored at 4°C until use. The protein concentration was determined by the Bio-Rad Protein Assay (München, Germany). Proteins (20 µg) were loaded on a 4–12% BIS TRIS NuPage Gel (Novex by Life Technologies, Carlsbad, CA, USA) separated under reducing conditions and transferred to nitrocellulose blotting membrane (GE Healthcare Life Sciences, Freiburg, Germany). Thereafter, membranes were blocked with PBS/0.1% Tween20 and 5% non-fat dry milk for 2 hours at room temperature. First, antibodies rabbit anti-human poly(ADP-ribose) polymerase (PARP) (1:1,000) or rabbit anti-human β-actin (1:2,500) (all from Cell Signaling Technology, Leiden, Netherlands) were added over night at 4°C. For detection, membranes were incubated for 1 hour at room temperature with horseradish peroxidase-conjugated polyclonal goat anti-rabbit immunoglobulin secondary antibody (Dako, Glostrup, Denmark) and signals were captured using the enhanced Western blotting reagent detection system (GE Healtcare, Buckinghamshire, UK).
Statistical analyses
Data were expressed as means + standard deviation (SD) and statistically subjected to Student's unpaired t-test. Kaplan-Meier estimates of specific survival time in the various groups were compared using the log-rank Mantel-Cox test. A level of P < 0.05 was considered to be significant, P < 0.01 highly significant.
Supplementary Material
Disclosure of potential conflicts of interest
No potential conflicts of interest were disclosed.
Funding
This work was supported by grants of the Bettina Bräu foundation, Munich, Germany and the Gänseblümchen-Voerde foundation, Voerde, Germany (to R.K.). We are grateful to Fatemeh Promoli for technical assistance.
References
- 1.Czauderna P, Lopez-Terrada D, Hiyama E, Haberle B, Malogolowkin MH, Meyers RL. Hepatoblastoma state of the art: pathology, genetics, risk stratification, and chemotherapy. Curr Opin Pediatr 2014; 26:19-28; PMID:24322718; http://dx.doi.org/ 10.1097/MOP.0000000000000046 [DOI] [PubMed] [Google Scholar]
- 2.Perilongo G, Maibach R, Shafford E, Brugieres L, Brock P, Morland B, de Camargo B, Zsiros J, Roebuck D, Zimmermann A, et al.. Cisplatin versus cisplatin plus doxorubicin for standard-risk hepatoblastoma. N Engl J Med 2009; 361:1662-70; PMID:19846851; http://dx.doi.org/ 10.1056/NEJMoa0810613 [DOI] [PubMed] [Google Scholar]
- 3.Zsiros J, Maibach R, Shafford E, Brugieres L, Brock P, Czauderna P, Roebuck D, Childs M, Zimmermann A, Laithier V, et al.. Successful treatment of childhood high-risk hepatoblastoma with dose-intensive multiagent chemotherapy and surgery: final results of the SIOPEL-3HR study. J Clin Oncol 2010; 28:2584-90; PMID:20406943; http://dx.doi.org/ 10.1200/JCO.2009.22.4857 [DOI] [PubMed] [Google Scholar]
- 4.Sivaprakasam P, Gupta AA, Greenberg ML, Capra M, Nathan PC. Survival and long-term outcomes in children with hepatoblastoma treated with continuous infusion of cisplatin and doxorubicin. J Pediatr Hematol Oncol 2011; 33:e226-30; PMID:21792028; http://dx.doi.org/ 10.1097/MPH.0b013e31821f0eaf [DOI] [PubMed] [Google Scholar]
- 5.Zsiros J, Brugieres L, Brock P, Roebuck D, Maibach R, Zimmermann A, Childs M, Pariente D, Laithier V, Otte JB, et al.. Dose-dense cisplatin-based chemotherapy and surgery for children with high-risk hepatoblastoma (SIOPEL-4): a prospective, single-arm, feasibility study. Lancet Oncol 2013; 14:834-42; PMID:23831416; http://dx.doi.org/ 10.1016/S1470-2045(13)70272-9 [DOI] [PMC free article] [PubMed] [Google Scholar]
- 6.Grewal S, Merchant T, Reymond R, McInerney M, Hodge C, Shearer P. Auditory late effects of childhood cancer therapy: a report from the children's oncology group. Pediatrics 2010; 125:e938-50; PMID:20194279; http://dx.doi.org/ 10.1542/peds.2009-1597 [DOI] [PMC free article] [PubMed] [Google Scholar]
- 7.Knijnenburg SL, Mulder RL, Schouten-Van Meeteren AY, Bokenkamp A, Blufpand H, van Dulmen-den Broeder E, Veening MA, Kremer LC, Jaspers MW. Early and late renal adverse effects after potentially nephrotoxic treatment for childhood cancer. Cochrane Database Syst Rev 2013; 10:CD008944; PMID:24101439; http://dx.doi.org/ 10.1002/14651858.CD008944.pub2 [DOI] [PubMed] [Google Scholar]
- 8.Lipshultz SE, Sambatakos P, Maguire M, Karnik R, Ross SW, Franco VI, Miller TL. Cardiotoxicity and cardioprotection in childhood cancer. Acta Haematol 2014; 132:391-9; PMID:25228565; http://dx.doi.org/ 10.1159/000360238 [DOI] [PubMed] [Google Scholar]
- 9.Cairo S, Armengol C, De Reynies A, Wei Y, Thomas E, Renard CA, Goga A, Balakrishnan A, Semeraro M, Gresh L, et al.. Hepatic stem-like phenotype and interplay of Wnt/β-catenin and Myc signaling in aggressive childhood liver cancer. Cancer Cell 2008; 14:471-84; PMID:19061838; http://dx.doi.org/ 10.1016/j.ccr.2008.11.002 [DOI] [PubMed] [Google Scholar]
- 10.Lamb J. The Connectivity Map: a new tool for biomedical research. Nat Rev Cancer 2007; 7:54-60; PMID:17186018; http://dx.doi.org/ 10.1038/nrc2044 [DOI] [PubMed] [Google Scholar]
- 11.Qu XA, Rajpal DK. Applications of connectivity map in drug discovery and development. Drug Discov Today 2012; 17:1289-98; PMID:22889966; http://dx.doi.org/ 10.1016/j.drudis.2012.07.017 [DOI] [PubMed] [Google Scholar]
- 12.Claerhout S, Lim JY, Choi W, Park YY, Kim K, Kim SB, Lee JS, Mills GB, Cho JY. Gene expression signature analysis identifies vorinostat as a candidate therapy for gastric cancer. PLoS One 2011; 6:e24662; PMID:21931799; http://dx.doi.org/ 10.1371/journal.pone.0024662 [DOI] [PMC free article] [PubMed] [Google Scholar]
- 13.Hieronymus H, Lamb J, Ross KN, Peng XP, Clement C, Rodina A, Nieto M, Du J, Stegmaier K, Raj SM, et al.. Gene expression signature-based chemical genomic prediction identifies a novel class of HSP90 pathway modulators. Cancer Cell 2006; 10:321-30; PMID:17010675; http://dx.doi.org/ 10.1016/j.ccr.2006.09.005 [DOI] [PubMed] [Google Scholar]
- 14.Wei G, Twomey D, Lamb J, Schlis K, Agarwal J, Stam RW, Opferman JT, Sallan SE, den Boer ML, Pieters R, et al.. Gene expression-based chemical genomics identifies rapamycin as a modulator of MCL1 and glucocorticoid resistance. Cancer Cell 2006; 10:331-42; PMID:17010674; http://dx.doi.org/ 10.1016/j.ccr.2006.09.006 [DOI] [PubMed] [Google Scholar]
- 15.Glozak MA, Seto E. Histone deacetylases and cancer. Oncogene 2007; 26:5420-32; PMID:17694083; http://dx.doi.org/ 10.1038/sj.onc.1210610 [DOI] [PubMed] [Google Scholar]
- 16.Ropero S, Esteller M. The role of histone deacetylases (HDACs) in human cancer. Mol Oncol 2007; 1:19-25; PMID:19383284; http://dx.doi.org/ 10.1016/j.molonc.2007.01.001 [DOI] [PMC free article] [PubMed] [Google Scholar]
- 17.Hartmann W, Kuchler J, Koch A, Friedrichs N, Waha A, Endl E, Czerwitzki J, Metzger D, Steiner S, Wurst P, et al.. Activation of phosphatidylinositol-3′-kinase/AKT signaling is essential in hepatoblastoma survival. Clin Cancer Res 2009; 15:4538-45; PMID:19584164; http://dx.doi.org/ 10.1158/1078-0432.CCR-08-2878 [DOI] [PubMed] [Google Scholar]
- 18.Wagner F, Henningsen B, Lederer C, Eichenmüller M, Gödeke J, Müller-Höcker J, von Schweinitz D, Kappler R. Rapamycin blocks hepatoblastoma growth in vitro and in vivo implicating new treatment options in high-risk patients. Eur J Cancer 2012; 48:2442-50; PMID:22285179; http://dx.doi.org/ 10.1016/j.ejca.2011.12.032 [DOI] [PubMed] [Google Scholar]
- 19.Treppendahl MB, Kristensen LS, Gronbaek K. Predicting response to epigenetic therapy. J Clin Invest 2014; 124:47-55; PMID:24382389; http://dx.doi.org/ 10.1172/JCI69737 [DOI] [PMC free article] [PubMed] [Google Scholar]
- 20.Muller BM, Jana L, Kasajima A, Lehmann A, Prinzler J, Budczies J, Winzer KJ, Dietel M, Weichert W, Denkert C. Differential expression of histone deacetylases HDAC1, 2 and 3 in human breast cancer–overexpression of HDAC2 and HDAC3 is associated with clinicopathological indicators of disease progression. BMC Cancer 2013; 13:215; PMID:23627572; http://dx.doi.org/ 10.1186/1471-2407-13-215 [DOI] [PMC free article] [PubMed] [Google Scholar]
- 21.Poyet C, Jentsch B, Hermanns T, Schweckendiek D, Seifert HH, Schmidtpeter M, Sulser T, Moch H, Wild PJ, Kristiansen G. Expression of histone deacetylases 1, 2 and 3 in urothelial bladder cancer. BMC Clin Pathol 2014; 14:10; PMID:24624923; http://dx.doi.org/ 10.1186/1472-6890-14-10 [DOI] [PMC free article] [PubMed] [Google Scholar]
- 22.Minucci S, Pelicci PG. Histone deacetylase inhibitors and the promise of epigenetic (and more) treatments for cancer. Nat Rev Cancer 2006; 6:38-51; PMID:16397526; http://dx.doi.org/ 10.1038/nrc1779 [DOI] [PubMed] [Google Scholar]
- 23.Tomlinson GE, Kappler R. Genetics and epigenetics of hepatoblastoma. Pediatr Blood Cancer 2012; 59:785-92; PMID:22807084; http://dx.doi.org/ 10.1002/pbc.24213 [DOI] [PubMed] [Google Scholar]
- 24.Regel I, Eichenmüller M, Joppien S, Liebl J, Häberle B, Müller-Höcker J, Vollmar A, von Schweinitz D, Kappler R. IGFBP3 impedes aggressive growth of pediatric liver cancer and is epigenetically silenced in vascular invasive and metastatic tumors. Mol Cancer 2012; 11:9; PMID:22401581; http://dx.doi.org/ 10.1186/1476-4598-11-9 [DOI] [PMC free article] [PubMed] [Google Scholar]
- 25.Eichenmüller M, Gruner I, Hagl B, Häberle B, Müller-Höcker J, von Schweinitz D, Kappler R. Blocking the hedgehog pathway inhibits hepatoblastoma growth. Hepatology 2009; 49:482-90; PMID:19177589; http://dx.doi.org/ 10.1002/hep.22649 [DOI] [PubMed] [Google Scholar]
- 26.Kim MG, Pak JH, Choi WH, Park JY, Nam JH, Kim JH. The relationship between cisplatin resistance and histone deacetylase isoform overexpression in epithelial ovarian cancer cell lines. J Gynecol Oncol 2012; 23:182-9; PMID:22808361; http://dx.doi.org/ 10.3802/jgo.2012.23.3.182 [DOI] [PMC free article] [PubMed] [Google Scholar]
- 27.Rikiishi H, Shinohara F, Sato T, Sato Y, Suzuki M, Echigo S. Chemosensitization of oral squamous cell carcinoma cells to cisplatin by histone deacetylase inhibitor, suberoylanilide hydroxamic acid. Int J Oncol 2007; 30:1181-8; PMID:17390020; http://dx.doi.org/ 10.3892/ijo.30.5.1181 [DOI] [PubMed] [Google Scholar]
- 28.Takada Y, Gillenwater A, Ichikawa H, Aggarwal BB. Suberoylanilide hydroxamic acid potentiates apoptosis, inhibits invasion, and abolishes osteoclastogenesis by suppressing nuclear factor-kappaB activation. J Biol Chem 2006; 281:5612-22; PMID:16377638; http://dx.doi.org/ 10.1074/jbc.M507213200 [DOI] [PubMed] [Google Scholar]
- 29.Armeanu S, Pathil A, Venturelli S, Mascagni P, Weiss TS, Gottlicher M, Gregor M, Lauer UM, Bitzer M. Apoptosis on hepatoma cells but not on primary hepatocytes by histone deacetylase inhibitors valproate and ITF2357. J Hepatol 2005; 42:210-7; PMID:15664246; http://dx.doi.org/ 10.1016/j.jhep.2004.10.020 [DOI] [PubMed] [Google Scholar]
- 30.Herold C, Ganslmayer M, Ocker M, Hermann M, Geerts A, Hahn EG, Schuppan D. The histone-deacetylase inhibitor Trichostatin A blocks proliferation and triggers apoptotic programs in hepatoma cells. J Hepatol 2002; 36:233-40; PMID:11830335; http://dx.doi.org/ 10.1016/S0168-8278(01)00257-4 [DOI] [PubMed] [Google Scholar]
- 31.Fu M, Wan F, Li Z, Zhang F. 4SC-202 activates ASK1-dependent mitochondrial apoptosis pathway to inhibit hepatocellular carcinoma cells. Biochem Biophys Res Commun 2016; 471:267-73; PMID:26773495; http://dx.doi.org/ 10.1016/j.bbrc.2016.01.030 [DOI] [PubMed] [Google Scholar]
- 32.Venturelli S, Armeanu S, Pathil A, Hsieh CJ, Weiss TS, Vonthein R, Wehrmann M, Gregor M, Lauer UM, Bitzer M. Epigenetic combination therapy as a tumor-selective treatment approach for hepatocellular carcinoma. Cancer 2007; 109:2132-41; PMID:17407132; http://dx.doi.org/ 10.1002/cncr.22652 [DOI] [PubMed] [Google Scholar]
- 33.Yeo W, Chung HC, Chan SL, Wang LZ, Lim R, Picus J, Boyer M, Mo FK, Koh J, Rha SY, et al.. Epigenetic therapy using belinostat for patients with unresectable hepatocellular carcinoma: a multicenter phase I/II study with biomarker and pharmacokinetic analysis of tumors from patients in the Mayo Phase II Consortium and the Cancer Therapeutics Research Group. J Clin Oncol 2012; 30:3361-7; PMID:22915658; http://dx.doi.org/ 10.1200/JCO.2011.41.2395 [DOI] [PMC free article] [PubMed] [Google Scholar]
- 34.Fouladi M, Park JR, Stewart CF, Gilbertson RJ, Schaiquevich P, Sun J, Reid JM, Ames MM, Speights R, Ingle AM, et al.. Pediatric phase I trial and pharmacokinetic study of vorinostat: a children's oncology group phase I consortium report. J Clin Oncol 2010; 28:3623-9; PMID:20606092; http://dx.doi.org/ 10.1200/JCO.2009.25.9119 [DOI] [PMC free article] [PubMed] [Google Scholar]
- 35.Hummel TR, Wagner L, Ahern C, Fouladi M, Reid JM, McGovern RM, Ames MM, Gilbertson RJ, Horton T, Ingle AM, et al.. A pediatric phase 1 trial of vorinostat and temozolomide in relapsed or refractory primary brain or spinal cord tumors: a children's oncology group phase 1 consortium study. Pediatr Blood Cancer 2013; 60:1452-7; PMID:23554030; http://dx.doi.org/ 10.1002/pbc.24541 [DOI] [PMC free article] [PubMed] [Google Scholar]
- 36.Furchert SE, Lanvers-Kaminsky C, Juurgens H, Jung M, Loidl A, Fruhwald MC. Inhibitors of histone deacetylases as potential therapeutic tools for high-risk embryonal tumors of the nervous system of childhood. Int J Cancer 2007; 120:1787-94; PMID:17230517; http://dx.doi.org/ 10.1002/ijc.22401 [DOI] [PubMed] [Google Scholar]
- 37.Spiller SE, Ravanpay AC, Hahn AW, Olson JM. Suberoylanilide hydroxamic acid is effective in preclinical studies of medulloblastoma. J Neuro Oncol 2006; 79:259-70; PMID:16645722; http://dx.doi.org/16465382 10.1007/s11060-006-9142-0 [DOI] [PubMed] [Google Scholar]
- 38.Sonnemann J, Kumar KS, Heesch S, Muller C, Hartwig C, Maass M, Bader P, Beck JF. Histone deacetylase inhibitors induce cell death and enhance the susceptibility to ionizing radiation, etoposide, and TRAIL in medulloblastoma cells. Int J Oncol 2006; 28:755-66; PMID:16465382; http://dx.doi.org/ 10.3892/ijo.28.3.755 [DOI] [PubMed] [Google Scholar]
- 39.Munster P, Marchion D, Bicaku E, Lacevic M, Kim J, Centeno B, Daud A, Neuger A, Minton S, Sullivan D. Clinical and biological effects of valproic acid as a histone deacetylase inhibitor on tumor and surrogate tissues: phase I/II trial of valproic acid and epirubicin/FEC. Clin Cancer Res 2009; 15:2488-96; PMID:19318486; http://dx.doi.org/ 10.1158/1078-0432.CCR-08-1930 [DOI] [PubMed] [Google Scholar]
- 40.Munster PN, Marchion D, Thomas S, Egorin M, Minton S, Springett G, Lee JH, Simon G, Chiappori A, Sullivan D, et al.. Phase I trial of vorinostat and doxorubicin in solid tumours: histone deacetylase 2 expression as a predictive marker. Br J Cancer 2009; 101:1044-50; PMID:19738609; http://dx.doi.org/ 10.1038/sj.bjc.6605293 [DOI] [PMC free article] [PubMed] [Google Scholar]
- 41.Chou TC. Drug combination studies and their synergy quantification using the Chou-Talalay method. Cancer Res 2010; 70:440-6; PMID:20068163; http://dx.doi.org/ 10.1158/0008-5472.CAN-09-1947 [DOI] [PubMed] [Google Scholar]
Associated Data
This section collects any data citations, data availability statements, or supplementary materials included in this article.