

ABSTRACT
It is observed that upregulation of DNMT3B enzyme in some cancers, including colon cancer, could lead to silencing of tumor suppressor genes. MiR-339 and miR-766 have been predicted to target 3′UTR of DNMT3B gene. Luciferase reporter assay validated that individual and co-transfection of miR-766 and miR-339 into the HEK293T cell reduced luciferase activity to 26% ± 0.41%, 43% ± 0.42 and 64% ± 0.52%, respectively, compared to the control (P < 0.05). Furthermore, transduction of miR-339 and miR-766 expressing viruses into colon cancer cell lines (SW480 and HCT116) decreased DNMT3B expression (1.5, 3-fold) and (3, 4-fold), respectively. In addition, DNA methylation of some tumor suppressor genes decreased. Expression of these genes such as SFRP1 (2 and 1.6-fold), SFRP2 (0.07 and 4-fold), WIF1 (0.05 and 4-fold), and DKK2 (2 and 4-fold) increased in SW-339 and SW-766 cell lines; besides, expression increments for these genes in HCT-339 and HCT-766 cell lines were (2.8, 4-fold), (0.005, 1.5-fold), (1.7 and 3-fold) and (0.04, 1.7-fold), respectively. Also, while in SW-766, cell proliferation reduced to 2.8% and 21.7% after 24 and 48 hours, respectively, SW-339 showed no reduced proliferation. Meanwhile, HCT-766 and HCT-339 showed (3.5%, 12.8%) and (18.8%, 33.9%) reduced proliferation after 24 and 48 hours, respectively. Finally, targeting DNMT3B by these miRs, decreased methylation of tumor suppressor genes such as SFRP1, SFRP2, WIF1 and DKK2 in the mentioned cell lines, and returned the expression of these tumor suppressor genes which can contribute to lethal effect on colon cancer cells and reducing tumorigenicity of these cells.
KEYWORDS: Colorectal neoplasms, DNA methyltransferase 3B, genes, methylation, microRNAs, tumor suppressor
Abbreviations
- APC
Adenomatous polyposis coli
- SFRP1
Secreted frizzled-related protein 1
- SFRP2
Secreted frizzled-related protein 2
- DKK2
Dickkopf protein 2
- WIF
Wnt inhibitory factor 1
- CIMP
CpG island methylator phenotype
- IFG2
Insulin-Like Growth Factor 2
- CACNA2G1
Calcium Channel, Voltage-Dependent, T Type, Alpha 1G
- CDK2N2A
Cyclin-Dependent Kinase Inhibitor 2A
- NEUROG1
Neurogenin-1
- hMLH1
MutL Homolog 1
Introduction
Colorectal cancer (also known as colon cancer, rectal cancer) is caused by neoplastic transformation of cells in the colon or rectum.1 This disease is produced due to abnormal growth of cells that can invade or spread in other parts of the body.2 Statistics show that in 2014 about 71,830 men and 65,000 women were diagnosed with colon cancer in the United States3 and its 5-year survival rate in the United States is about 65%. Colon cancer is the third most common type of cancer worldwide and includes 10% of all cancers.4 In 2012, 1.4 million new cases and 694 thousand deaths occurred from the disease. In the past 2 decades significant progress is made in understanding the molecular mechanisms of the disease, including the hereditary status that predisposes people to colon cancer.5 Different molecular and biochemical mechanisms involved in pathogenesis of colorectal cancer are also identified. Numerous molecular studies have shown the role of genetic and epigenetic changes in sporadic and hereditary forms of the cancer. A limited number of these changes, like mutations, act on oncogenes or tumor suppressor genes, such as K-RAS, p53, and Adenomatous polyposis coli (APC).6
The most well-known epigenetic changes are alterations in DNA methylation pattern. DNA methylation is responsible for tumorgenesis in cancer and occurs mostly at irregularly distributed CpG (5′-Cytosine-Phosphoguanine) islands upstream of tumor suppressor genes.7 This process is conducted by methyl transferase enzymes including DNMT1, DNMT3A, and DNMT3B. DNMT1 methylates the newly synthesized DNA strands and maintains the maternal methylation pattern through this process. The other 2 enzymes, DNMT3A and DNMT3B, act as de novo methyl transferases and cause stable genome methylation during pre-implantation. Colon cancer, like other types of cancers, has a multi-stage process in which genetic and epigenetic errors accumulate and turn a normal cell into an aggressive or metastatic tumor cell. The modified pattern of DNA methylation can alter the expression of genes associated with cancer.8 Decreased global DNA methylation, seen in the malignancy process, alters genomic stability too. DNA hypermethylation is usually found in the process of malignancy from adenomas to adenocarcinoma.9
Methylation of promoters in several tumor suppressor genes interrupts gene expression through direct inhibition of transcription factor binding.10 Little is known about the consecutive DNA methylation changes occurring in colon cancer. Studies have shown that excessive expression of DNMT3B enzyme causes aberrant de nevo methylation and creates CIMP (CpG island methylator phenotype) in colon cancer.11,12 Experiments on animal models have shown that a significant increase in DNMT3B enzyme level increases Igf2, along with methylation and silencing of tumor suppressor genes, and results in loss of imprinting.13 Previous studies have shown a significant increase in DNMT3B enzyme from the normal epithelium to hyperplastic one and from hyperplastic epithelium to carcinoma.8 This significant finding related to the DNA hypermethylation can be observed in the sub-panel of CIMP, including CACNA1G, NEUROG1, CDKN2A, and hMLH1 genes. Increased amount of DNMT3B mRNA in colon cancer tissues, in comparison with normal tissues, is shown in several studies.14,15 Besides, increased DNMT3B expression is observed in 15% of colon cancers.12 It has also been proved that DNMT3B has an important role in methylation and demethylation of genes in breast and ovarian cancer cell lines.16,17
MicroRNAs are the other side of epigenetics. They are noncoding single-stranded RNA molecules of about 21–23 nucleotide length. These molecules induce their biological effect by connecting their seed region (2–8 nucleotides) to 3′UTR of the target RNA and controlling its expression. A microRNA can target multiple targets or/and one RNA can be modulated by several miRNAs. Post-transcriptional inhibition of microRNA depends on the complementary sequences of 3′UTR of mRNA. Mutations in the 3′UTR of mRNA may interfere with the inhibitory effect of microRNA and, if this mutation occurs in oncogenes, it may neutralize the important mechanism of inhibition in tumor cells.18 Therefore, these molecules can act as one of the factors controlling gene expression.19,20 More than 1500 miRNAs are now identified in humans which are capable of controlling about 30% of the human genome.21 Evidence suggests that microRNA expression patterns are unique for each specified cancer and may be used clinically as a prognostic factor. This role is being investigated in cancers, including colon cancer.22 According to the above-mentioned information, dysregulation of microRNA has an important role in the development of cancers, including colon cancer.23 There are different theories about the epigenetic mechanism controlling DNMT3B expression and miRNA is one of the most important ones.24
In this study, we investigated the effects of miR-766, miR-339, and miR-653, which were predicted for targeting DNMT3B on the expression of DNMT3B enzyme, and the ability of these miRNAs to change the methylation pattern of tumor suppressor genes in 2 colon cancer cell lines (HCT116 and SW480) in comparison with HUVEC. Additionally, upon the introduction of these miRNAs, several secondary phenomena, being influenced by hypomethylation, were tested. These phenomena consist of expression of tumor suppressor genes cell proliferation and cell cycle changes.
Results
DNMT3B was confirmed to be target of miR-339 and miR-766 in luciferase assay
A set of online software was used to analyze and predict miRNAs capable to target the 3′UTR of DNMT3B gene. For this aim, bioinformatics algorithms including Target Scan4.0 (http://www.targetscan.org/), Microcosm (http://www.ebi.ac.uk/enrightsrv/microcosm/htdocs/targets/v5/), PicTar (http://www.pictar.mdcberlin.de/), miRanda(http://www.microrna.org/microrna/searchMirnas.do) and miRWalk (www.umm.uni-heidelberg.de/apps/zmf/mirwalk/) were combined. The predicted miRNAs were chosen based on the rankings and algorithms in each online tool. Many of the tools showed that miR-766, miR-339 and miR-653 have a complementary sequence for 3′-UTR of the DNMT3B gene. The expression of these miRNAs was evaluated in colorectal cancer tissues and it had be confirmed that they are all downregulated in colorectal cancer tissues (under review data). To assess and verify the effect of these miRNAs on target genes, 3′UTR of the DNMT3B gene was cloned downstream of luciferase in psiCHECK™-2 vector. HEK293T cells were co-transfected with psiCHECK-DNMT3B along with pLEX-Jred-tGFP-miR-766, pLEX-Jred-tGFPmiR-339 or pLEX-Jred-tGFP-miR-scrambled plasmids. As shown in Fig. 1, miR-766 and miR-339 reduced the activity of luciferase compared with miR-scrambled. Transfection of miR-766 and miR-339 into the HEK293T cell reduced luciferase activity to 26%± 0.41% and 43% ± 0.42%, respectively, compared with the control (P < 0.05). To investigate the synergistic effect of these miRNAs on target genes, miR-766 and miR-339 were co-transfected. The results showed a significant decrease in luciferase activity (64% ± 0.52%) compared to each individual transfection (p < 0.05). However, there was no effect on the cells with the miR-scrambled. According to the results, DNMT3B can be considered as a new candidate for miR-766 and miR-339, and these miRNAs are capable of regulating DNMT3B gene by binding to the 3′UTR region of their mRNA in colon cancer cell line.
Figure 1.
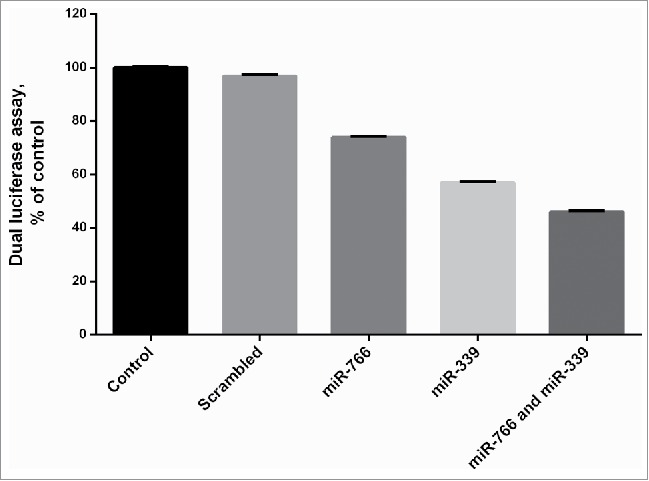
Effect of mir-339 and miR-766 on DNMT3B expression: HEK293T, which was transfected with the Renilla and firefly luciferase expression construct psiCHECK™-2 harboring DNMT3B 3′-UTR and pLEX-JRed-TurboGFP containing miR-339, miR-766 and miR-scrambled. After 24 h, Data represents mean ± SE from 3 independent experiments performed in triplicates vs. the control group (P < 0.05).
While lenti-miR-653 killed all cells after 7 d of transduction, miR-766 and miR-339 were overexpressed in all cell lines after transduction with lenti-miR-766 and lenti-miR-339
Transduction of SW480, HCT116 and HUVEC cells were carried out by lenti-miR-766, lenti-miR-339 and lenti-miR-653. All cells transduced with lenti-miR-653 were killed 7 d after transduction though the killing effect was seen 4 d after transduction.While the cells became granulated and small after transduction with lenti-miR-653, this phenomenon repeated in another round of transduction. MiRNA expression was assessed in cells transduced with lentiviruses. The results showed that the expressions of subject miRNAs in all transduced cell lines were increased. Expression increases of miR-766 in SW-766, and HCT-766 were 1.5-fold in comparison to non-transduced cells while in HUVEC-766, it was increased 2.8-fold compared to non-transduced cells. While the increased expression of miR-339 in SW-339 and HCT-339 was 4 and 5-fold respectively, this level in HUVEC-339 was 14.4-fold in comparison with non-transduced cells. Expression of these miRNAs in HCT-Sc, SW-Sc and HUVEC-SC was not significantly different from that of non-transduced cells (Fig. 2). It was shown that generally the effect of Lenti-miR-339 on increasing the expression of miR-339 was more intense in comparison to the effect of lenti-miR-766 on increasing the expression of miR-766. However the observed increase in the expression of both miRNAs (miR-766 and miR-339) was enough for forthcoming studies.
Figure 2.
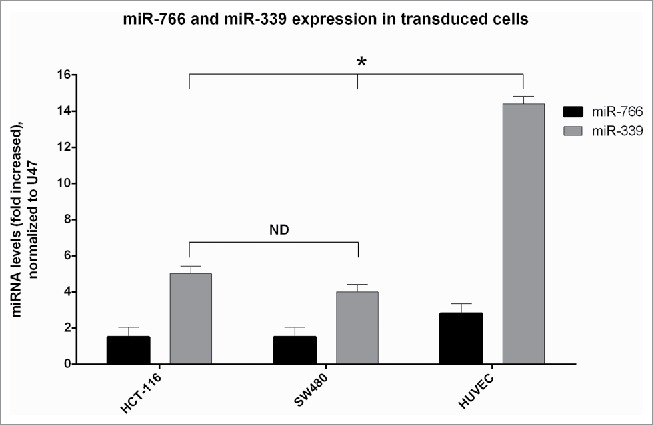
Expression of miR-766 and miR-339 in different cell lines before and after transduction with lenti-miR-766 and lenti-miR-339. The asterisks indicate the groups which were significantly different (p < 0.05) from each other, and the ND indicates not detectable differences between groups.
DNMT3B expression was decreased in SW-766, SW-339, HCT-766, HCT-339, HUVEC-339 and HUVEC-766
To verify whether the overexpression of miR-766 and miR-339 in transduced cell lines reduced the expression of DNMT3B, DNMT3B expression was evaluated by quantitative Real-Time PCR. As it can be seen in Fig. 3, DNMT3B expression was decreased in all cell lines transduced with lenti-miR-766 and lenti-miR-339 significantly (p < 0.05). Decreased expression levels of DNMT3B in the SW-339 and SW-766 were 1.5 and 3-fold while the levels in HCT-339 and HCT-766 were 3 and 4-fold compared to non-transduced cells, respectively. Also, in HUVEC-339 and HUVEC-766 this level was not significantly different from HUVEC and HUVEC-Sc cells. In SW-Sc, HCT-Sc and HUVEC-Sc the levels were 0.04, 0.02 and 0.05 which was not significantly different from that of non-transduced cells. As it can be seen, lenti-miR766 was stronger in downregulating the expression of DNMT3B. Downregulation of DNMT3B gene was seen more profoundly in transduced HCT-116 cell line.
Figure 3.
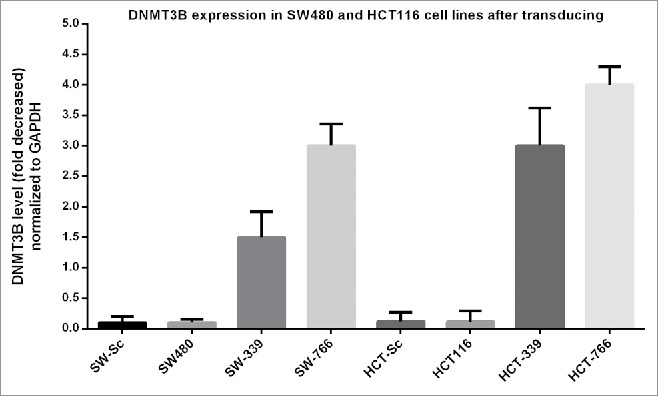
DNMT3B expression: SW480, HCT 116 and HUVEC were transduced with lenti-miR-339, lenti-miR-766 and lenti-miR-scrambled. After 72 hours, DNMT3B expression was analyzed by Real-Time quantitative PCR (P < 0.05).
While methylation level of tumor suppressor genes especially in HCT-766, SW-766 and SW-339 decreased in HUVEC-766 and HUVEC-339, the methylation level of all tumor suppressor genes did not change
In order to study the effect of overexpressed miR-766 and miR-339 on methylation level of some tumor suppressor genes, primers were designed to study the methylation level of some well-known tumor suppressor genes by High-Resolution Melting Curve Analysis. As it can be seen, methylation levels of some tumor suppressor genes such as SFRP1, SFRP2, DKK2 and WIF1 in HCT-766, SW-766 and SW-339 decreased, while in HCT-339 just the methylation level of WIF1 decreased. In HUVEC, the methylation level of tumor suppressor genes did not change from zero level after transduction with lenti-miR-766, lenti-miR-339 or lenti-miR-scrambled (Table 1, Fig. 4).
Table 1.
The effect of miR-339 and miR-766 on the methylation levels of some tumor suppressor genes.
| Cell line/Gene | SFRP1 | SFRP2 | WIF | DKK2 | CDK2N2A | CACNA2 | hMLH1 |
|---|---|---|---|---|---|---|---|
| HCT116 | 25% | 75% | 75% | 75% | 75–100% | 75–100% | 75% |
| HCT-766 | 0% | 0–25% | 0–25% | 0% | 100% | 100% | 75% |
| HCT-339 | 25% | 75% | 25% | 75% | 75–100% | 100% | 75% |
| HCT-scrambled | 25% | 75% | 75% | 75% | 75–100% | 100% | 75% |
| SW480 | 75–100% | 75% | 75–100% | 50–75% | 75–100% | 75–100% | 50% |
| SW-766 | 0% | 0-% | 0–25% | 0% | 100% | 100% | 50% |
| SW-339 | 50% | 50% | 25% | 25% | 100% | 100% | 50% |
| SW-scrambled | 75–100% | 75% | 75–100% | 50–75% | 75–100% | 75–100% | 50% |
| HUVEC | 0% | 0% | 0% | 0% | 0% | 0% | 0% |
| HUVEC -766 | 0% | 0% | 0% | 0% | 0% | 0% | 0% |
| HUVEC-339 | 0% | 0% | 0% | 0% | 0% | 0% | 0% |
| HUVEC-scrambled | 0% | 0% | 0% | 0% | 0% | 0% | 0% |
Note: SW480, HCT116 and HUVEC cells after transduction with miR-339, miR-766 and miR-scrambled were named. After 48 hours, methylation level of tumor suppressor genes promoter was assessed by High Resolution Melting analysis.
Figure 4.
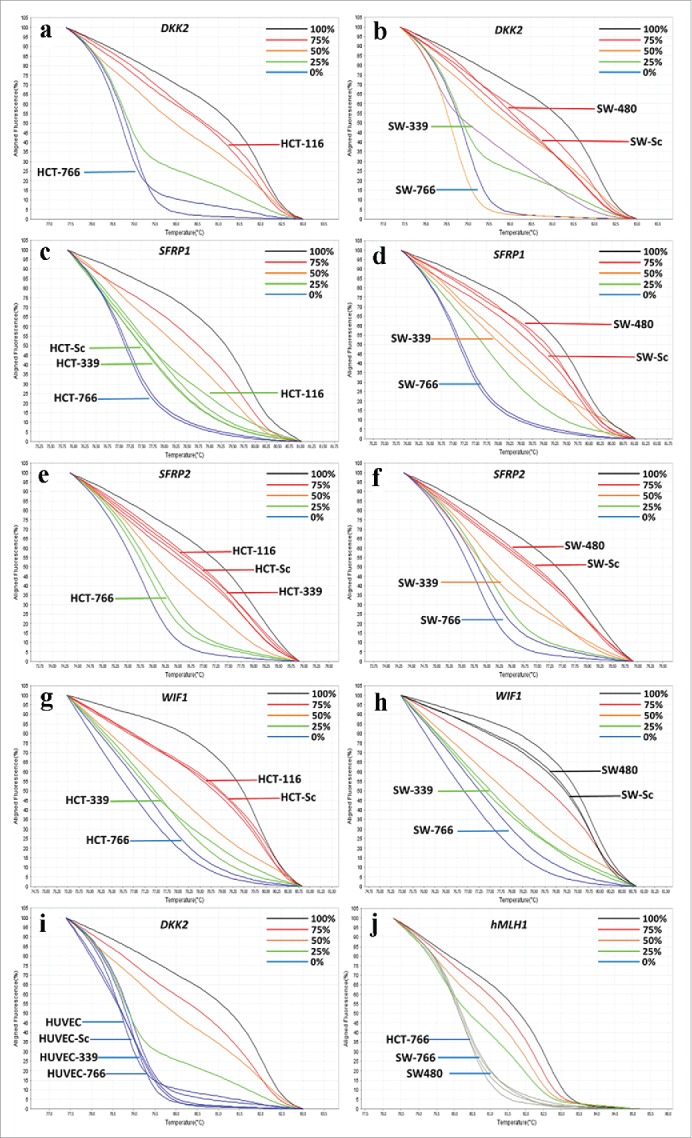
Graphs of some High Resolution Melting curves analysis: Some representative graphs for HRM on SFRP1, SFRP2, WIF1, DKK2, CDK2N2A, CACNA2 and hMLH1 genes beside controls. Controls composed of 0%, 25% 50% 75% and 100% methylated samples. Percentage of methylation in unknown (studied) samples calculated according to the melting curve pattern in comparison with controls. Fig. 3a to j: a) Decreased methylation of DKK2 gene in HCT-766 cell line to 0%. b) Methylation of DKK2 gene in SW-766 and SW-339 cell line, which is shown to be 0% and 25%, respectively. c) No alteration in methylation level of SFRP-1 gene in HCT-339 but decreased methylation in HCT-766 cell line to 0%. d) Decreased methylation of SFRP1 gene in SW-339 and SW-766 cell line, to 50% and 0%, respectively. e) Decreased methylation of SFRP2 gene to 0–25% in HCT-766 and no alteration in methylation level of HCT-339 cell line. f) Decreased methylation of SFRP2 gene to 0% and 50% in SW-766 and SW-339 cell lines, respectively. g) Decreased methylation of WIF1 gene in HCT-766 and HCT-339 cell lines to 0–25% and 25% respectively. h) Decreased methylation of WIF1 gene in SW-766 and SW-339 cell lines to 0–25% and 25%, respectively. i) The methylation level of DKK2 gene in HUVEC-766, HUVEC-339, and HUVEC-Sc and non-transduced cells (all 0%). j) Unchanged methylation level of hMlH1 gene in SW-766, SW-339, SW-Sc and SW480 cell lines.
The methylation levels of some other well-known tumor suppressor genes did not change significantly after transduction with lenti-miR-766 and lenti-miR-339. These genes include CDK2N2A, CACNA2 and hMLH1. Finally, it was shown that all transduced cells, except for HCT-339, had been affected by DNMT3B overexpression and methylation of all namely tumor suppressor genes are not related to DNMT3B.
Reversion of methylations in some tumor suppressor genes by lenti-miR-766 and lenti-miR-339 linked to increased expression
To assess whether increased expression of miR-766 and miR-339 plays a role in regulation of gene expression, we evaluated the levels of these genes using Real Time PCR. While in SW-766 and HCT-766 the expression of SFRP2 increased 4 and 1.5 times respectively in comparison with non-transduced cells, fold change of SFRP2 in HCT-339 and SW-339 was not significantly different. Hence, decreased methylation of this gene in SW-766 and HCT-766 was linked to its overexpression, while in HCT-339 and SW-339 unchanged or slightly changed methylations were not reflected in the expression. Increased levels of SFRP1 were 4 and 1.6 in HCT-766 and SW-766. However, these values in SW-339 and HCT-339 were 2 and 2.8-fold, respectively.
Also, increased levels of WIF1 in comparison with non-transduced cells were 4 and 3-fold in SW-766 and HCT-766 cells, respectively. While fold change in HCT-339 was 1.7, it was not significant in SW-339 cells. Increases in DKK2 gene expression in SW-766 and HCT-766 were 4 and 1.7-fold, respectively. Whereas in SW-339 a 2-fold increased expression of DKK2 was seen, in HCT-339, this gene was not overexpressed significantly. Unaltered expression of this gene in HCT-339 can be justified by unaffected methylation of the gene. Moreover, the expression of CDK2N2A, CACNA2 and hMLH1 genes in SW-339, SW-766, HCT-339 and HCT-766 was not significantly different from SW480 and HCT116, respectively. Additionally, expression of all of these genes in HCT-Sc and SW-Sc was not significantly different from HCT-116 and SW480 respectively. The expression of all these genes in HUVEC-766, HUVEC-339 and HUVEC-Sc did not change significantly in comparison with non-transduced HUVEC. However, according to the results, it can be said that increased expression of miR-766 and miR-339 in SW480 and HCT116 cause decreased expression of its target gene (DNMT3B) and, subsequently, increase the expression of some but not all tumor suppressor genes including SFRP1,SFRP2,DKK2 and WIF1(Fig. 5). The expression level of hMLH1, CDK2N2A and CACNA2 was untouched in all transduced cell lines. Expression was calculated according to 2−ΔΔCt (fold change) formula compared with data of non-transduced cells (P < 0.05).
Figure 5.
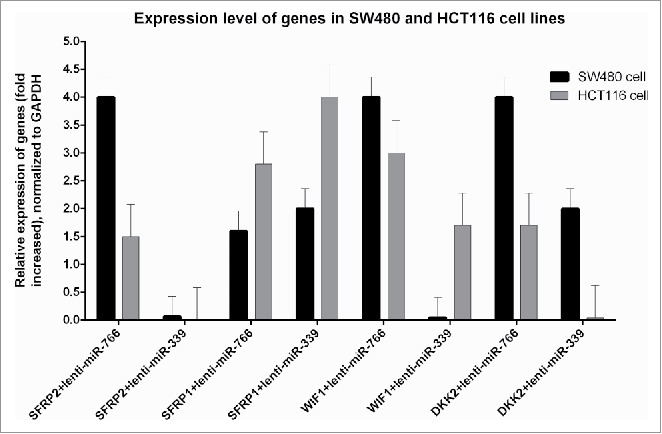
Expression analysis of studied tumor suppressor genes: Expression was calculated according to 2−ΔΔCt (fold change) formula compared to the data of non-transduced cells (P < 0.05). Note: the expression of all genes was not significantly different from non-transduced cells in HUVEC-766, HUVEC-339 and HUVEC-Sc.
Cell proliferation decreased in all transduced cancerous cell lines except SW-339
In order to understand the functional role of miR-766 and miR-339 overexpression in SW480 and HCT116 cell lines, cell proliferation of cells was assessed. As shown in Fig. 6A, 24 and 48 hours after cell passage, cell proliferation in SW-766 decreased to 2.8% ± 0.28 and 21.7% ± 0.39 (mean ± SE) respectively, compared to SW480 and SW-Sc (p <0.05). However, this reduction was not observed in SW-339 cells. Reduced cell proliferation in HCT-339 (in comparison with average proliferation in HCT116 and HCT-Scrambled), 24 and 48 hours after cell passage, were 3.5% ± 0.42% and 33.9% ± 0.43% (mean ± SE), respectively (p < 0.05). These amounts for HCT-766 were 12.8% ± 0.43% and 18.8% ± 0.42% (mean ± SE), 24 and 48 hours after transfection (p < 0.05) (Fig. 6B). As expected, HUVEC-766 and HUVEC-339 proliferation was not changed significantly in comparison with HUVEC and HUVEC-Sc (Fig. 6C).All transduced colon cancer cell lines (except for SW-339) showed decreased proliferation in comparison with non-transduced cells.
Figure 6.
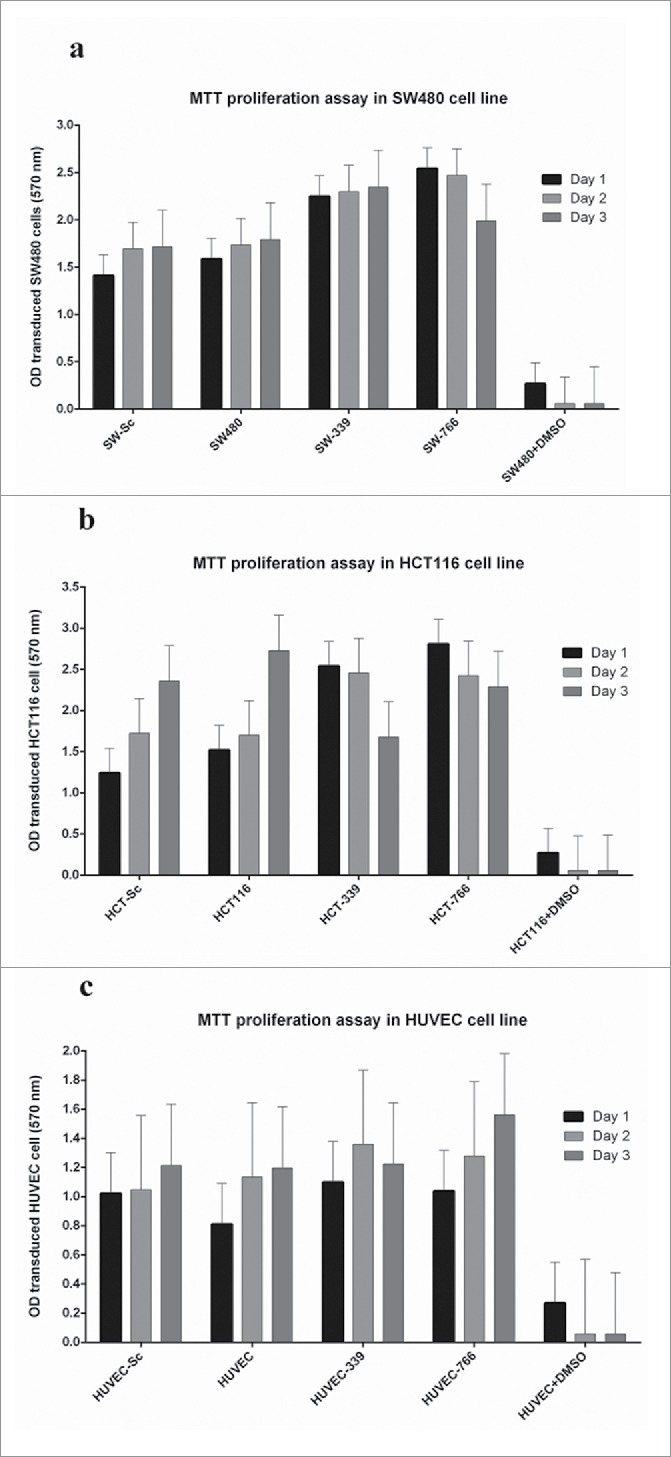
Results of Cell proliferation assays: Cell proliferation was evaluated by MTT proliferation assay 24 and 48 hours after transferring to a 96-well plate.
HCT-116 and SW480 cell lines showed different patterns of cell cycle in response to transduction
After SW480, HCT116 and HUVEC cell lines were transduced by lenti-miR-766, lenti-miR-339 and lenti-miR-scrambled, cell cycle analysis was performed by flowcytometry (CyFlow Partec, Germany). Results showed that, in HCT-766 and HCT-339, the percentage of proliferating cells compared to HCT-116 and HCT-Sc was increased. The percentage of subG1 cells, which is indicative of apoptotic cells in these cells, was less than HCT-116 and HCT-Sc. Proliferating cells in SW480 and SW-Sc cells were higher than SW-766 and SW-339. On the other hand, the percentage of cells in subG1 increased in SW-766 and SW-339. As it can be seen in Table 3, the percentage of cells in G1, S and G2, and even in subG1 phase, was not different between transduced HUVEC, HUVEC-339, HUVEC-766 and HUVEC-Sc (Fig. 7a-h). Finally, transduction of cells with lenti-miR-766 and lenti-miR-339 had different effects on 2 colon cancer cells, while it increased proliferation in HCT-766 and SW-766, in HCT-339 it decreased proliferation. Also, SW480 cells transduced with these miRNAs have greater number of apoptotic cells, while results in HCT-116 were contrary to SW480.
Table 3.
Cell cycle statistics; distribution of cells in different phases of cell cycle after transfection with miR-766, miR-339 and miR-scrambled
| phases | HCT116 | HCT-Sc | HCt-766 | HCT-339 | SW480 | SW-Sc | SW-766 | SW-339 | HUVEC | HUVEC-Sc | HUVEC-766 | HUVEC-339 |
|---|---|---|---|---|---|---|---|---|---|---|---|---|
| G1 | 26.56 | 23.34 | 30.8 | 49 | 47.58 | 49.18 | 42.46 | 39.21 | 29.38 | 30.04 | 33.11 | 34.29 |
| S | 30.07 | 28.89 | 28.63 | 17.09 | 26.77 | 26.7 | 29.48 | 31.43 | 27.99 | 28.14 | 26.1 | 25.65 |
| G2+S | 41.82 | 40.3 | 51.37 | 35.89 | 45.28 | 43.38 | 47.28 | 45.81 | 36.39 | 39.03 | 37.56 | 37.51 |
| G2 | 11.75 | 11.41 | 22.74 | 18.8 | 18.51 | 16.68 | 17.8 | 14.46 | 8.4 | 10.89 | 11.46 | 11.86 |
| sub-G1 | 29.08 | 35.99 | 6.73 | 6.2 | 2.65 | 3.8 | 9.5 | 17.77 | 34.05 | 32.97 | 30.57 | 30.91 |
| super-G2 | 5.16 | 4.07 | 15.9 | 14.4 | 9.92 | 9.2 | 5.09 | 2.51 | 2.66 | 1.73 | 2.86 | 1.54 |
Figure 7.
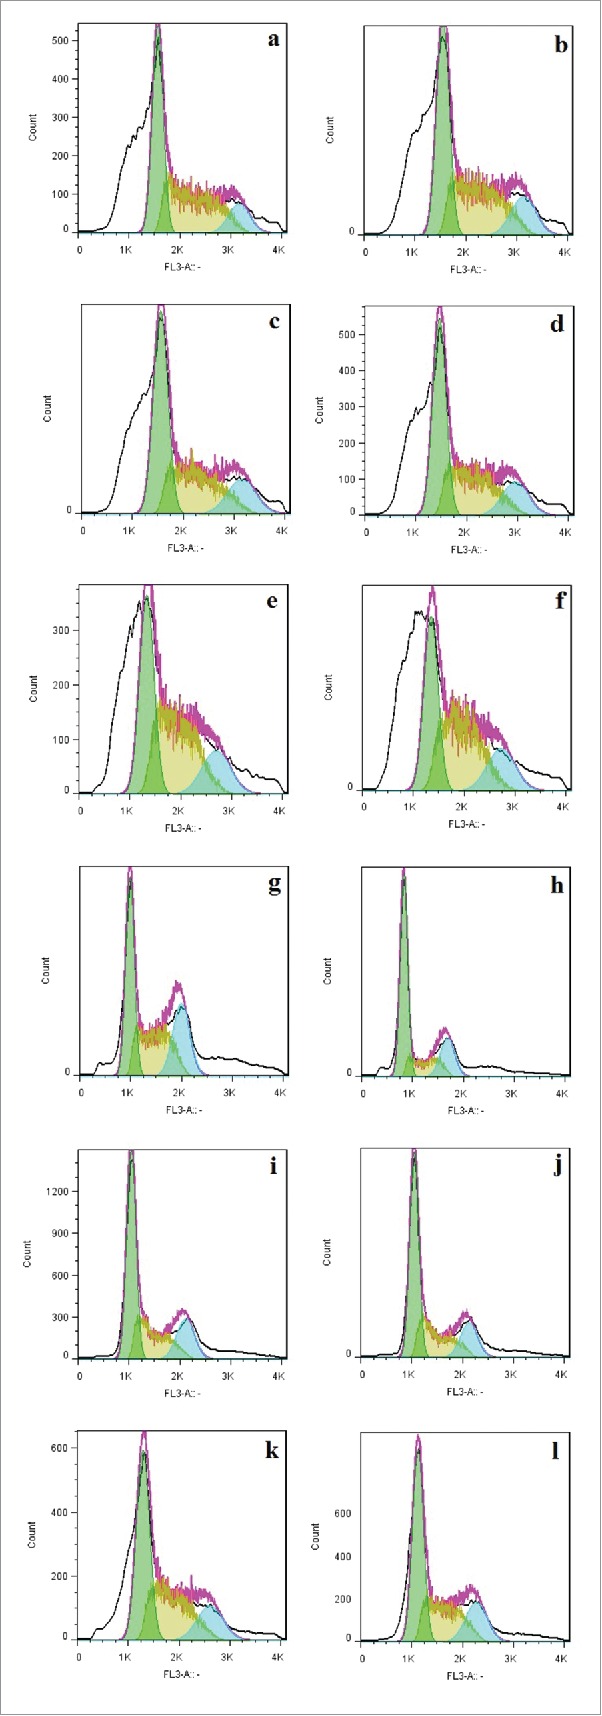
Cell cycle analysis in transduced and non-transduced cells: Green graphs represent the G1, blue graphs represent the s phase and the yellow graphs represent the cells in G2 phase. Transduction with lenti-miR-766(Fig. 7c), lenti-miR-336(Fig. 7d) and lenti-miR-scrambled cells (Fig. 7b) made no changes in the cell cycle compared to non-transduced HUVEC (Fig. 7a). Transduction of HCT116 cells by lenti-miR-766 (Fig. 7g) decreased proliferation of cells compared with HCT116 (Fig. 7e) and HCT-Sc (Fig. 7f). On the other hand, transduction of SW480 cells by lenti-miR766 (Fig. 7k) and lenti-miR-339 (Fig. 7I) decreased G1-phase population compared to SW480 (Fig. 7i) and SW-Sc cells (Fig. 7j).
Discussion
Epigenetic changes in colorectal cancer, particularly methylation of CpG islands in tumor suppressor genes, are more frequent than genetic changes.27 Aberrant methylation, which is thought to be one of the causes of cancer, performed mostly through the induction of transcriptional silencing of tumor suppressor genes.28 Deactivation of tumor suppressor genes by hypermethylation of promoters have been observed in various stages of colon cancer.27 While there are different theories about the mechanism underlying this abnormal methylation in tumor cells, none of them has been proved. One of the proposed mechanisms for aberrant methylation in promoters of tumor suppressor genes is dysregulation of DNMTs family genes such as DNMT3B. Aberrant expression of this gene in tumor cells and cell lines has been proved to be linked with tumorgenesis, while increased DNMT3B expression is observed in several studies.29 The mechanism of hypermethylation in colon cancer is not completely understood. Nowadays, one of the main suggested mechanisms for increased DNMT3B expression is regulatory role of microRNAs, especially defects in post-transcriptional regulation of DNMT3B by regulatory miRNAs.30
There are several studies about the effect of microRNA on DNA methylation through DNMTs expression.31 Earlier studies have shown that some of microRNAs, including miR-29b, are able to directly target DNMT3B and induce hypomethylation and retrieve the initial state of tumor suppressor genes in acute myeloid leukemia and Burkitt's lymphoma.32,33
In the present study, we examined the effects of miR-339 and miR-766 expressing lentiviruses on HCT116 and SW480 colon cancer cell lines, along with HUVEC as a representative of a normal cell. Selection of these microRNAs was based on the prediction of intriguing complementarity to 3′UTR region of DNMT3B gene. This predication was performed by several microRNA online target prediction software including Target Scan, PicTar and miRWalk. In this study, miR-653, which is shown to kill all cells (HCT-116, SW480 and HUVEC), was enrolled as one of the regulators of DNMT3B.
This study shows that miR-766 and miR-339 are capable of specific targeting of DNMT3B and increased levels of these miRNAs effectively resulted in DNMT3B downregulation (Fig. 3). Inhibitory effect of miR-766 and miR-339 on DNMT3B and luciferase assay proved that DNMT3B could be a potential target for miR-339 and miR-766. DNMT3B may be regulated through a variety of miRNAs in different cells. Combinatorial regulatory characteristics of miRNAs were proved by simultaneous targeting of 3′UTR of DNMT3B by these 2 miRNAs. Meanwhile, a particular miRNA may have several target mRNAs, and a specific target might be regulated through different miRNAs.34
Among different DNMTs, DNMT3B has shown to be one of the main causes of methylation of tumor suppressor genes, especially in colon cancer; therefore, dysregulation of DNMT3B may have an important role in tumorigenesis and cancer progression, including colon cancer.13,35
Since in colon cancer decreased expression levels of some miRNAs could be associated with increased expression of DNMT3B and this phenomenon can lead to a significant downregulation of some tumor suppressor genes, we assumed that miR-339 and miR-766 might be capable of controlling DNA methylation changes through targeting DNMT3B in colon cancer cell lines. In this regard transducing the cells with lenti-miR-766 and lenti-miR-339 was done to upregulate these miRNAs in the cells. Although the effect of lenti-miR-339 on upregulation the expression of miR-339 more profound than the effect of lenti-miR-766 on miR-766, the upcoming events which was observed in the transduced cells was generally the same. It was not clear why one lenti-miR like lenti-miR-766 increased expression of miR-766 in a lesser extent but this may be due to the effect of some host cells on degradation of this miRNA which is reflected on higher expression of miR-766 in HUVEC cell line in comparison to HCT-116 and SW480.
In order to study the effect of silencing DNMT3B by miRNA on different tumor suppressor genes, we chose 7 tumor suppressor genes including: SFRP1, SFRP2, DKK2, WIF1, CDK2N2A, CACN2A and hMLH1. These tumor suppressor genes were shown to be regulated by methylation in the previous studies.29,36 However, the level of promoter methylation of these genes in colon cancer cell lines in SW480 and HCT116 was significantly higher than that of HUVEC. Surprisingly, DNMT3B only decreased promoter methylation of SFRP1, SFRP2, DKK2 and WIF1 genes and did not alter the methylation levels of CDK2N2A, CACN2A and hMLH1. Also, in transduced cells with miR-339, and especially miR-766, the expression levels of these 4 genes increased whereas the expression levels of CDK2N2A, CACN2A and hMLH1 did not change. The results showed that DNMT3B can be a major factor in aberrant methylation of CpG islands in SFRP1, SFRP2, WIF1 and DKK2 genes but not in some well-known genes such as hMLH1, CDK2N2A and CACN2A. Additionally, miR-339 and miR-766 are capable of targeting DNMT3B, especially in SW480, while in HCT-116, miR-339 could not modify the expression of DNMT3B. All cancerous cells with altered DNMT3B expression showed reduced promoter methylation status of SFRP1, SFRP2, WIF1 and DKK2 tumor suppressor genes. One of the possible causes for discordant effect of these miRNAs on different tumor suppressor genes is different responses of tumor suppressor genes to different members of DNMTs. For example, while some of these tumor suppressor genes can be methylated by DNMT-1, others are target of DNMT3.36 Regulation of these well-known tumor suppressor genes (hMLH1, CDK2N2A and CACN2A) by other methyl transferases should be validated in future studies. Among tumor suppressor genes, it was shown that WIF1 was the most sensitive one to the effect of DNMT3B since in HCT-339, with no observed downregulation of DNMT3B, the methylation level of WIF1 was downregulated. Although SW480 was also more sensitive to the effect of DNMT3B than HCT-116, suppression of expression in HCT116 was more profound and the reduction of methylation in SW480 was heavier. It was also shown that factors other than methylation may affect expression of some genes like WIF1.
It is observed that miRNAs have a very important role in tumorigenesis. Studies have shown that miRNA expression patterns are different in normal and tumoral tissue or tumor types. One of the features of miRNAs is gene expression regulation; any changes in the value of miRNAs can be closely related to cancer progress through the aberrant silencing of tumor suppressor genes or oncogenes activation.37 Previous studies like Azizi et al. demonstrated that miR-152 and miR-148b are able to reactivate tumor suppressor genes in pancreatic cancer cell lines by suppressing DNA methyltransferase-1 gene.38 In this study, we showed that the introduction of miR-766 and into SW480 and HCT-116 lead to decreased cell proliferation. Introduction of miR-339 into HCT116 leads to the same effect, too. Also, these miRNAs in SW480 decreased the proliferation rate and increased the apoptotic cells. Besides, it was shown that targeting DNMT3B could play a possible role in decreasing some aspects of tumorigenesis of colorectal cancer cells. The most profound effect of inhibiting DNMT3B in colon cancer cells is downregulating methylation of some tumor suppressor genes leading to its re-expression. There are different reports about the role of inhibiting DNMTs in reversing the tumor phenotype of cells.39 Rajendran G. et al. reported that inhibition of DNMT3B function through 5-azacytidine (DNMT-1 and DNMT3B inhibitor) significantly decreases DNMT3B expression and increases the expression of tumor suppressor genes including PTEN and p21 in glioma.40 Our study showed that DNMT3B can be targeted more smartly by miRNAs and, then, these miRNAs can target tumor suppressor genes without inhibiting other DNMTs and without any adverse effect on normal cells.
According to the decreased DNMT3B expression, demethylation and re-expression of tumor suppressor genes including DKK2, SFRP1, SFRP2 and WIF1 in colon cancer cell lines, it can be stated that the observed changes are the results of DNMT3B downregulation after introduction of the miR-339 and miR-766 in colon cancer cell lines. DKK2, SFRP1, SFRP2 and WIF1 genes are the specific antagonists of Wnt signaling pathway, which are inhibitors of the Wnt signaling pathway. According to their role in tumor suppression, it is shown that these genes have become silent due to epigenetic changes during cancer.41 Expectedly, while tumor suppressor genes of the same pathway are downregulated by DNMT3B, other studied tumor suppressor genes like hMLH1 and CDKN2A and CACN2A are not regulated by this DNMTs. Therefore, any epigenetic alteration such as methylation in the promoter of these genes by the enzymes of DNMTs family, including DNMT3B, may lead to phenotypic changes in colon cells and, thereby, cancerous cells. Fabbri et al. reported that miR-29 family regulates DNMT3B in lung cancer.42 Also, Li Y et al. showed that the introduced miR-339-5p inhibits cell migration and invasion in vitro.43
In addition, our study showed that miR-339 and miR-766 can reduce cell proliferation and lead to changes in cell cycle. One of the reasons for the lack of equal effect of microRNAs in various cell lines, is genetic and epigenetic differences which is observed in these cell lines.44,45 Also, miR-766 was stronger in decreasing the methylation level of tumor suppressor genes and re-expression of these genes, in general, which can be related to the stronger effect of this gene on DNMT3B inhibition. Weaker effect of this miRNA in transduced SW480 and transduced HCT-116 cell lines was demonstrated in different ways. While proliferation of SW-339 did not decrease, in HCT-339 the proliferation rate of cells reduced in comparison with non-transduced cell. Vice-versa, while the methylation of most tumor suppressor genes in HCT-339 was unchanged in comparison with HCT-116 and HCT-Sc, in SW-339, the methylation of tumor suppressor genes was affected by inhibition of DNMT3B. Demethylation of tumor suppressor genes was mirrored in re-expression of these genes, except for WIF1 in SW-339 and SFRP1 in HCT-339, which can be linked to weaker effect of this miRNA on DNMT3B, another pathways affected by this miRNA or other regulating factors influencing expression of these genes.
The effect of inhibiting DNMT3B on decreased methylation and increased expression of the above mentioned tumor suppressor genes have different effects on the cell cycle. While the proliferating rate in HCT-339 and HCT-766 increased SW480 cells transduced by these miRNAs showed opposite results. This may be due to genetic and epigenetic differences between these 2 cells especially different levels of Wnt signaling pathway activation.46,47 The main cause of the difference in effects of miRNAs on different cell lines should be validated in future studies. The effect of different DNMTs on different tumor suppressor genes should also be evaluated in future studies. Besides, it is clear that epigenetic pathways play a key role in causing cancer. This study also showed that using miR-339 and miR-766, as one of the new approaches, alone or in combination with other modalities, can be a window of opportunity in the development of smarter therapies for colon cancer. In addition, these findings show that epigenetics, especially methylation, have profound effect on the tumorigenesis and cell cycle process and it should be considered as one of the main players in this regard. Predicting and evaluating the performance of some of these miRNAs, including miR-339 and miR-653, is done for the first time in this study and it could be helpful for future studies.
Materials and methods
Cell culture
SW480 as colon cancer cell line, HEK293T and Human Umbilical Vein Endothelial Cells (HUVEC) as the non-cancerous cell, were provided by National Cell Bank of Iran (Pasteur Institute of Iran). HCT116 was purchased from ATCC (Manassas, VA 20108 USA). SW480, HCT116 and HEK293T cells were cultured at Dulbecco's modified Eagle's medium (DMEM) (Life Technology, 12100046) and HUVEC cells were cultured in 50% DMEM/ 50% Ham's F12 Nutrient Mixture (Sigma-Aldrich.N6658). All mediums were provided with 100 units /ml penicillin, 100 μg/mL of streptomycin and 15% FBS (Sigma-Aldrich 12003C). The cells were maintained at 37°C in 5% CO2 in CO2 incubator (New Brunswick, USA) and were passaged every 48 or 72 hours.
MiRNA prediction
Based on base-pairing with complementary sequences of 3′ untranslated region in the DNMT3B mRNA, analysis was performed using various popular miRNA prediction tools such as DIANA-microT (http://diana.cslab.ece.ntua.gr/), miRanda (www.miranda.com.br/), PicTar (http://pictar.mdc-berlin.de/), TargetScan (www.targetscan.org), mirWalk (http://www.umm.uni-heidelberg.de/apps/zmf/mirwalk/) and miRDB (http://mirdb.org/miRDB/). MicroRNAs were transferred to mirwalk program in order to be selected based on 2 criteria: 1) predicted miRNA targeting sites according to mRNA 2) number of putative miRNA sites on 3′ untranslated region of DNMT3B mRNA which is the target gene. The mature sequences of miRNA were retrieved from the miRBase (the microRNA database Registry at http://www.mirbase.org/).
Cloning of miR-766, miR-339 and miR-653 into pLEX-JRed-TurboGFP
The related sequences of each miRNA were obtained from www.ensembl.org website. About 100 nucleotides downstream and upstream from the 2 ends of miRNAs, containing the pre-miRNA sequence, were selected. The primers were designed for each miRNA by the Gene Runner and Allele ID 6 (PREMIER Biosoft International) software at the standard conditions. The primers were validated by Primer-BLAST using NCBI Nucleotide software (http://blast.ncbi.nlm.nih.gov). The sequences containing the miRNA sequence were amplified using primers in Table 2. DNA was extracted from the tissue samples using DNA extraction kit (CinnaPure-DNA, PR881612, Iran). PCR was performed for genomic parts with a length of about 300 bp for miR-766 and miR-339. PCR was amplified with total volume of 25 μL, 300 ng of genomic DNA, 10 pmol of each primer, 2 mM of MgSo4, 10 mM dNTP (CinnaGen, DN7603C, Iran), and 1.5 units of pfu polymerase enzyme (Thermoscientific, EP0502, USA) under the following conditions: 95°C for 5 minutes and 35 cycles of 95°C for 30 seconds, 62°C for 35 seconds, 72°C for 1 minute, and final extension at 72°C for 10 minutes. According to the protocol and the following conditions, adenine nucleotides were added to the end of the amplified fragments, by Taq polymerase (CinnaGen, PL2201, Iran) treating, to enable them to be cloned in pTZ57R/T vector (Fermentas, K1214). The PCR reaction was performed using forward and reverse primers of M13 in order to check the entry of miRNA sequence vector into pTZ57R/T. Verified pTZ57R/T vectors containing miR-339 and miR-766/miR-653 sequences were digested by NheI / NotI and MluI / NotI enzymes, respectively, in order to insert each miRNA sequence into the pLEX-JRed-TurboGFP vector (OpenBiosystems, OHS4736) after tGFP gene. Finally, they were ligated to new vector of pLEX-JRed-TurboGFP. In order to prevent noise in all the tests, such as Luciferase assay and scrutiny of the micro-RNA performance on target gene (DNMT3B), miR-scrambled was designed which had been linked to the studied genome (Homo sapiens in this study). This scrambled sequence was blasted against all human genome and transcriptome while it was shown that it was not matched to any part of human genome or transcriptme. In fact, this miR-scrambled was used as normalization and negative control in all tests and it can be used for all miRNAs.This microRNA was synthesized and cloned in the pLEX-JRed-TurboGFP vector. The sequence of miR-scramble was as follows: (GATACGGCGTTAGTAAAATTGCTGCGTAGTACTAACTCTTGATTAGTATTCGCGACGAATTTACGAGGTACTAGC).
Table 2.
Primer sequences used for High Resolution Melting and Real-Time quantitative PCR, miRNA expression analysis and amplification of DNMT3B, 3UTR (Bold sequences indicate the endonuclease restriction site).
| Genes | Sequences of primers (5′-3′) |
|---|---|
| miR-653-F(cloning) | GCGGCCGCGGCCACTGAGACATTCATC |
| miR-653-R(cloning) | ACGCGT GTATGTCCGAGGATAACAAG |
| miR-339-F(cloning) | CTAGCTGAGAAGGGGCCACAGGC |
| miR-339-R(cloning) | ACGCGTCACACTGCATCAGAAGACC |
| miR-766-F(cloning) | GCGGCCGCTATACACAGAGGATTGCTTAG |
| miR-766-R(cloning) | ACGCGTCAGGCAACAGATTTC |
| DNMT3B-F(expression) | CGGGATGAACAGGATCTTTGGC |
| DNMT3B-R(expression) | TTCAGAGGGGCGAGGTGTC |
| SFRP1-F (expression) | ACGTCTGCATCGCCATGAC |
| SFRP1-R(expression) | ACAGGGAGGACACACCGTTG |
| SFRP2-F(expression) | CGACATGCTTGAGTGCGACC |
| SFRP2-R(expression) | TACCTTTGGAGCTTCCTCGGTG |
| WIF1-F(expression) | AAAAGCAAATGTAAGTGTTCCAAAGG |
| WIF1-R(expression) | GTTGGGTTCATGGCAGGTTCC |
| DKK2-F(expression) | ACATATAAAAGGGCATGAAGGAGACC |
| DKK2-R(expression) | CCCTGATGGAGCACTGGTTTG |
| CDK2N2A-F(expression) | CGGAAGGTCCCTCAGACATCC |
| CDK2N2A-R(expression) | GGACCTTCGGTGACTGATGATCTAAG |
| CACNA2-F(expression) | GGGGGAGATGCCAACAAGTCC |
| CACNA2-R(expression) | CAGGGACACCAAGGCCAAGC |
| hMLH1-F(expression) | CAAACAAGGAGAGACAGTAGCTGATG |
| hMLH1-R(expression) | TATCAGTTCTCGACTAACAGCATTTCC |
| Genes |
Sequence for primers of HRM analysis |
| SFRP1(methylation) | Forward:TGGTTCGAGATGTTTAAGTGTGATAAG |
| Reverse:AAATAACGCGAATTCTCCTACAACTC | |
| SFRP2(methylation) | Forward:GGATTTCGTTGGTTATGAAGTAGTGTT |
| Reverse:ACGCAACGATCCTTCACCTAC | |
| WIF1(methylation) | Forward: GAATAGTTTTGGTTGAGGGAGTTG |
| Reverse: CCCGCAATACCAACAAACACA | |
| DKK2(methylation) | Forward:GTTTTTTGATTAATTAAGAGGAGAG |
| Reverse:CCGCTTCTCCACCAAAAC | |
| CDK2N2A(methylation) | Forward: GGGGAAGAGGAAAGAGGAAGAAG |
| Reverse: GCCCATTCCCCTCCCAACTA | |
| CACNA2(methylation) | Forward: TGTTGTTTTTGTAGAAATAGTTTTTGTTAGAG |
| Reverse: CGAATCCTCCTAAAACCCCTACC | |
| hMLH1(methylation) | Forward: CGAGGTATTGAGGTGATTGGTTGAA |
| Reverse: CCGTACCAATTCTCAATCATCTCTTTAA |
Production of virus-harboring miRNAs with third generation of lentiviral vectors
In this study, low passage HEK293T cells were used for transfection. They were transferred into the 6-well culture plates after trypsinization. When they reached the desirable confluency (50–60 %), they were transfected, using the calcium phosphate method, according to the following instructions. The cells were replaced 2 to 3 hours before the test using the new medium of DMEM containing 10 % FBS. Third generation lentiviral plasmids (including pMD2G, pLPI, and pLPII, from Addgene) in addition to pLEX-JRed-TurboGFP were mixed in 1.5 ml tubes (5 µg for the PLPII, PLPI plasmids, 3 µg for PMD2G vector, and 8 µg for pLEX-JRed-TurboGFP vector). The volume of the mixture reached to the 422 μL with HEPES buffered water and, then, 16 μL of 1% TE buffer was added and mixed. Afterwards, 62 μL of 2.5 mM calcium chloride was added to the tubes and was mixed well. Five hundred microliter of HBS2X solution was added to the mixture, drop by drop, within 2 minutes by Pasteur pipette. They were mixed until a semi-opaque solution was obtained. Then, it was kept for 20 minutes at room temperature. At the end, the mixture was added to the cells slowly and, then, was distributed on the cells with a slow circular motion. The plates were incubated at 37°C in CO2 incubator and the medium was replaced after 4 hours by fresh medium. In the next day, the cell culture medium was replaced with fresh medium. After 48 hours, viruses were collected from the medium of transfected HEK293T cells and were kept at – 70°C until usage.
Transduction of SW480, HCT116 and HUVEC cell lines by the viruses containing the target miRNAs components
A mixture of viruses containing each miRNA and 4 µg/ml polyberne substance was prepared in order to transduce the cells. Viruses expressing miR-653, miR-766, miR-339 and miR-Scrambled were named lenti-miR-653, lenti-miR-766, lenti-miR-339 and lenti-miR-Sc. MOI for HCT116, SW480 and HUVEC were set to be 5, 10 and 20, respectively. Then, the mixture was added to the cultured cells and was distributed with a slow and rotational movement. The plates were incubated for 4–6 hours at CO2 incubator. Then, the medium was replaced in order to remove toxic polyberne. The cells were again transduced with the viruses containing each target miRNA after 24 hours in order to increase the efficiency of transduction. Each cell line was treated for 3–5 d with the optimized concentration of the antibiotics (HUVEC 0.5µg/ml, HCT116 3µg/ml and SW480 8µg/ml), (Puromycin, P9620, sigma Aldrich). SW480 cell transduced with lenti-miR-653, lent-imiR-766, lenti-miR-339 and lenti-miR-Sc are called SW-766, SW-339, SW-653 and SW-Sc and HCT116 cells transduced with lenti-miR-766, lenti-miR-339, lenti-miR-653 and lenti-miR-Sc are called HCT-766, HCT-339, HCT-653 and HCT-Sc, while HUVEC cells transduced with these miRNAs are called HUVEC-766, HUVEC-339 HUVEC-653 and HUVEC-Sc.
Luciferase assay
The 1450 bp fragment of the 3′-UTR of DNMT3B gene was retrieved from www.genecopoeia.com website and was amplified for luciferase assay. The designed primers for this fragment had additional 5′ends which contained the NotI and SgfI endonuclease enzyme site. These primers sequences were GCG ATC GCA GGA CTA CTT TGC ATG TGA AT and CTC GAG GTA AAC TCT AGG CAT CCG TC. According to the following guidelines, the fragment was amplified from genomic DNA using 200 ng of DNA. The volume of the mixture was reached to the 25 µl with 10 pmol of each primer, 1.5 mM MgSO4, 1 µl dNTP (10 mM), and 1.5 units of pfu polymerase enzyme under the following conditions: 95°C for 3 min; followed by 35 cycles at 95°C for 45 s, 62.5°C for 45 s, 72°C for 1 min, and the final extension at 72°C for 10 minutes. After the treatment with Taq polymerase the PCR product containing 3′UTR of DNMT3B was cloned in the pTZ57R/T vector (Thermoscientific, USA, K1214). The entry of fragment into pTZ57R/T was confirmed by the colony PCR using M13 forward and reverse primers and double digestion with NotI (Thermoscientific, USA, ER0591) and SgfI (Thermoscientific, USA) enzymes and sequencing. Thereafter, the verified pTZ57R/T plasmids, which contained 3′-UTR of target gene, were digested by the corresponding enzyme and the digestion product was carefully cut out from the gel. Eventually, it was ligated to the psiCHECK™-2 (promega, C8021) vector, by ligase enzymes, immediately downstream to the stop codon of Renilla luciferase. This plasmid is named psiCHECK-DNMT3B in the following text. Luciferase was assessed using Dual-Luciferase® Reporter Assay System (promega, E1910). Initially, about 7–10 × 103 of HEK293T cells were cultured in a 96 wells white plate, the day before transfection. In the next day, the pLEX-JRed-TurboGFP vector harboring miRNA targets and psiCHECK™-2 vector harboring 3′UTR of target gene were co-transfected with the following concentrations to HEK293T cell line: 300 ng/μl of each pLEX-JRed-TurboGFP plasmid containing target miRNAs and 400 ng/μl of psiCHECK™-2 vector including 3′-UTR of target gene were mixed. The volume of mixture was reached to 43.5 μl by the HFPES buffered water followed by adding 3 μl of 1% TE buffer. Thereafter, 3.6 μl of 2.5 mM CaCl2 was added to the tubes and mixed well. Finally, 50 μl of HBS2X buffer was added and gently mixed for 2 minutes. The activity of luciferase was evaluated using Dual-Luciferase® Reporter Assay System (Promega) 24 hours after transfection. The multi-well plate luminometer Renilla luciferase activity was normalized to firefly luciferase. The assay according to the Promega instruction was done on HEK293T and the data was extrapolated to other cell lines including colorectal cancer cell lines.
Bisulfite modification and High Resolution Melting curve analysis for DNA methylation
Three days after the transduction of SW480, HCT116 and HUVEC cells with the viruses harboring the desired microRNAs (miR-339, miR-766 and miR-scrambled), the genomic DNA was extracted. Thereafter, 1.5 μg of genomic DNA was converted to bisulfite treated DNA using the protocol of EpiTect Bisulfite Kits (Qiagene, 59104) and stored at −20°C until analysis. During High Resolution Melting curve analysis, 2 μl of eluted DNA was used to besides Control DNAs (HUM Diagnostics Biotechnology, Iran).
Designing primers for methylation and expression analysis
In order to design primers for studying the methylation of SFRP1, SFRP2, DKK2, WIF1, CDK2N2A, CACN2A and hMLH1 genes, the upstream sequences were retrieved from the http://asia.ensembl.org website and NCBI. Primers were designed by help of Methprimer website (www.urogene.org/Methprimer). The meth BLAST website was used for performing the BLAST of primers (http://www.medgen.ugent.be/methBLAST). Quantitative PCR primers were designed by the Allele ID software. GAPDH gene was used as the housekeeping gene. Primer-BLAST was carried out using the BLAST page (http://blast.ncbi.nlm.nih.gov/blast) for each primer pairs for evaluating specificity of each primer (Table 2).
Analysis of gene methylation using HRM
DNA bisulfite sequences were amplified using primers specifically targeting the converted sequences. In order to have controls with different methylation percentages (75%, 50% and 25%) fully methylated DNA (HUM Diagnostics Biotechnology, Iran) controls was diluted with different concentrations of unmethylated DNA (HUM Diagnostics Biotechnology). The standard controls were used for each experimental run. The reaction was performed by using 10 μL of SYBR® Premix Ex Taq™ II (Takara, Japan,), 1.5 μg of bisulfited DNA and 0.5 pmol of each primer in the final volume of 20 μL. The Real-Time PCR reaction and HRM were performed on an ABI (Applied Biosystems® step one plus Real-time PCR). All PCR reactions were carried out using the following conditions. Initial hold at 95°C for 45 s, 45 cycles of 95°C for 20 s, 60°C for 30 s, and the final denaturation step from 60°C to 95°C with a ramp temperature of 0.1°C/s. HRM curve of each bisulfite DNA was analyzed using HRM ABI software. The methylation profile for each sample was analyzed by comparing the fluorescence level at the melting point against this value in control samples.
RNA extraction, Reverse transcription, and quantitative Real-Time PCR
After transduction of the SW480, HCT116 and HUVEC cells with the viruses harboring microRNA (miR-766, miR-339 and miR-scrambled), total RNA was extracted from the cells according to the previously mentioned protocol.25 The absorbance of extracted RNA was measured in 260nm and the 260/280 ratio was calculated in order to determine concentration and quality of RNA. Following RNA extraction, 1.5 μg of each sample was reverse transcribed using Mu-MLV reverse transcriptase according to the previously mentioned protocol (thermo scientific, EP0351). The synthesized cDNA was stored at −20°C until analysis. Real Time PCR reactions of the samples were performed on a mixture consisted of 12.5 μL sybr green Master Mix (Takara, Japan, RR820A), 0.2 mM of each specific primer, and 2 μL of cDNA in final volume of 25µl. The program of Real-Time PCR was as follows: initial denaturation at 95°C for 40 s, followed by 45 cycles of denaturation at 95°C for 30 s 58°C for 30 s, and final extension at 72°C for 35 s. GAPDH was considered as the internal reference gene. Amplification efficiency was assessed by measuring the degree of amplification in a serial dilution in order to investigate the expression of any target mRNA. Five dilution points were measured in triplicate as the standard curve. The PCR efficiency for all genes was between 90 % and 110 %.
MiRNA extraction and quantitative PCR of miRNAs
One ml of TRIZOL (Qiagen, Netherlands) was added to 4 × 10⁴ cells and the reagents in each tube were homogenized for 10 minutes. The homogenized samples was left at room temperature for 15 minutes. Thereafter, 200 µl of bromochloropropane or BCP (sigma-Aldrich, USA) was added to each tube and shook vigorously for 4 minutes. The samples were incubated at room temperature for 3 minutes and centrifuged at 12,000 rpm for 30 minutes at 4°C using Thermo centrifuge (Thermo scientific, USA). The aqueous phase was removed and equal volume of absolute ethanol was added to them to increase miRNA yield. The tubes were kept at – 20°C overnight and, then, centrifuged at 12,000 rpm for 60 minutes at 4°C. The supernatant was discarded completely. The tubes were washed 3 times with 70% ethanol (Merck, Germany). Supernatants were removed and the RNA pellets were dried at room temperature. Eventually RNA pellets were dissolved in 100 µl RNase-free water. The tubes were incubated at 37°C for 15 minutes. RNA quality was studied by measuring the absorbance at 260 and 280 nm using the Nano Drop (IMPLEN, Germany). Extracted microRNAs were kept at-70°C until analysis. Also, cDNA synthesis was performed according to the previously mentioned protocol except using stem loop primer instead of oligo-dT.
Reverse Transcriptase quantitative PCR analysis of miRNAs was performed with a Universal TaqMan probe and reverse primer in addition to a specific forward primer. The qPCR analysis was carried out in Rotor-Gene 6000 (Corbett Research, Australia) with 6.25 µl of 2x probe qPCR Master Mix (Takara, Japan), 2 µl of RNA-specific cDNA, 0.7 µM of each forward and reverse primers and 0.2 µM of TaqMan probe in a final volume of 12.5 µl. Enzyme was activated at the initial step at 95°C for 30 seconds, followed by 45 cycles of 95°C for 15 seconds and 60°C for 45 seconds.
Cell proliferation analysis
Three days after transduction of the SW480, HCT116 and HUVEC cells with the viruses containing the desired microRNA, cell proliferation was performed using 3-(4,5-dimethylthiazole-2-yl)-2, 5-biphenyl tetrazolium bromide (MTT) solution (Sigma, USA, M2128). Briefly, 7–8 × 10³ cells of transduced cells beside non transduced cells were plated in each well of a 96-well microplate. The supernatants of cells after 24, 48 and 72 hours of incubation in CO2 incubator were removed and the insoluble formazan was solved by isopropanol (100 μL). The optical density of each well was measured at a reference wavelength of 570 nm (Biotek, USA). Cell viability was defined relative to non-transduced control cells. All tests were repeated 3 times and average results for each sample were calculated.
Cell cycle analysis
Transduced, SW480, HCT116 and HUVEC cells with the virus-containing miRNAs (miR-766, miR-339 and miR-scrambled) were prepared 72 hours after cell culture for cell cycle analysis. First, the cells were trypsinized and, after washing with PBS, were fixed and also permeable for the color solution according to the previously mentioned protocol.26 Control cells were non transduced cells.
Statistical analysis
Statistical analysis was performed using the mean ± standard error (SE). P value of <0.05 was considered as significant. All tests were repeated at least for 3 times.
Disclosure of potential conflicts of interest
No potential conflicts of interest were disclosed.
Funding
This work was funded by Pasteur Institute of Iran as a Ph.D. Project, Tehran, Iran. Also some parts of the work was supported by Iranian National Science Foundation Grant Number 90001544.
References
- 1.Damnjanovic I, Kocic G, Najman S, Stojanovic S, Stojanovic D, Veljkovic A, Conic I, Langerholc T, Pesic S. Chemopreventive potential of alpha lipoic acid in the treatment of colon and cervix cancer cell lines. Bratisl Lek Listy 2014; 115:611-6; PMID:25573726 [DOI] [PubMed] [Google Scholar]
- 2.Althoff KN, McGinnis KA, Wyatt CM, Freiberg MS, Gilbert C, Oursler KK, Rimland D, Rodriguez-Barradas MC, Dubrow R, Park LS, et al.. Comparison of risk and age at diagnosis of myocardial infarction, end-stage renal disease, and non-AIDS-defining cancer in HIV-infected versus uninfected adults. Clin Infect Dis 2015; 60:627-38; PMID:25362204; http://dx.doi.org/ 10.1093/cid/ciu869 [DOI] [PMC free article] [PubMed] [Google Scholar]
- 3.McGuire S. World Health Organization. Comprehensive implementation plan on maternal, infant, and young child nutrition. Geneva, Switzerland, 2014. Adv Nutr 2015; 6:134-5; PMID:25593153; http://dx.doi.org/ 10.3945/an.114.007781 [DOI] [PMC free article] [PubMed] [Google Scholar]
- 4.Mendis S, Davis S, Norrving B. Organizational update: the world health organization global status report on noncommunicable diseases 2014; one more landmark step in the combat against stroke and vascular disease. Stroke 2015; 46:e121-2; PMID:25873596; http://dx.doi.org/ 10.1161/STROKEAHA.115.008097 [DOI] [PubMed] [Google Scholar]
- 5.Hodgson S. Mechanisms of inherited cancer susceptibility. J Zhejiang Univ Sci B 2008; 9:1-4; PMID:18196605; http://dx.doi.org/ 10.1631/jzus.B073001 [DOI] [PMC free article] [PubMed] [Google Scholar]
- 6.Conlin A, Smith G, Carey FA, Wolf CR, Steele RJ. The prognostic significance of K-ras, p53, and APC mutations in colorectal carcinoma. Gut 2005; 54:1283-6; PMID:15843421; http://dx.doi.org/ 10.1136/gut.2005.066514 [DOI] [PMC free article] [PubMed] [Google Scholar]
- 7.Agrawal A, Murphy RF, Agrawal DK. DNA methylation in breast and colorectal cancers. Mod Pathol 2007; 20:711-21; PMID:17464311; http://dx.doi.org/ 10.1038/modpathol.3800822 [DOI] [PubMed] [Google Scholar]
- 8.Ibrahim AE, Arends MJ, Silva AL, Wyllie AH, Greger L, Ito Y, Vowler SL, Huang TH, Tavaré S, Murrell A, et al.. Sequential DNA methylation changes are associated with DNMT3B overexpression in colorectal neoplastic progression. Gut 2011; 60:499-508; PMID:21068132; http://dx.doi.org/ 10.1136/gut.2010.223602 [DOI] [PubMed] [Google Scholar]
- 9.Bariol C, Suter C, Cheong K, Ku SL, Meagher A, Hawkins N, Ward R. The relationship between hypomethylation and CpG island methylation in colorectal neoplasia. Am J Pathol 2003; 162:1361-71; PMID:12651628; http://dx.doi.org/ 10.1016/S0002-9440(10)63932-6 [DOI] [PMC free article] [PubMed] [Google Scholar]
- 10.Curradi M, Izzo A, Badaracco G, Landsberger N. Molecular mechanisms of gene silencing mediated by DNA methylation. Mol Cell Biol 2002; 22:3157-73; PMID:11940673; http://dx.doi.org/ 10.1128/MCB.22.9.3157-3173.2002 [DOI] [PMC free article] [PubMed] [Google Scholar]
- 11.Kanai Y, Hirohashi S. Alterations of DNA methylation associated with abnormalities of DNA methyltransferases in human cancers during transition from a precancerous to a malignant state. Carcinogenesis 2007; 28:2434-42; PMID:17893234; http://dx.doi.org/ 10.1093/carcin/bgm206 [DOI] [PubMed] [Google Scholar]
- 12.Nosho K, Shima K, Irahara N, Kure S, Baba Y, Kirkner GJ, Chen L, Gokhale S, Hazra A, Spiegelman D, et al.. DNMT3B expression might contribute to CpG island methylator phenotype in colorectal cancer. Clin Cancer Res 2009; 15:3663-71; PMID:19470733; http://dx.doi.org/ 10.1158/1078-0432.CCR-08-2383 [DOI] [PMC free article] [PubMed] [Google Scholar]
- 13.Linhart HG, Lin H, Yamada Y, Moran E, Steine EJ, Gokhale S, Lo G, Cantu E, Ehrich M, He T, et al.. Dnmt3b promotes tumorigenesis in vivo by gene-specific de novo methylation and transcriptional silencing. Genes Dev 2007; 21:3110-22; PMID:18056424; http://dx.doi.org/ 10.1101/gad.1594007 [DOI] [PMC free article] [PubMed] [Google Scholar]
- 14.Robertson KD, Uzvolgyi E, Liang G, Talmadge C, Sumegi J, Gonzales FA, Jones PA. The human DNA methyltransferases (DNMTs) 1, 3a and 3b: coordinate mRNA expression in normal tissues and overexpression in tumors. Nucleic Acids Res 1999; 27:2291-8; PMID:10325416; http://dx.doi.org/ 10.1093/nar/27.11.2291 [DOI] [PMC free article] [PubMed] [Google Scholar]
- 15.Schmidt WM, Sedivy R, Forstner B, Steger GG, Zochbauer-Muller S, Mader RM. Progressive up-regulation of genes encoding DNA methyltransferases in the colorectal adenoma-carcinoma sequence. Mol Carcinog 2007; 46:766-72; PMID:17538945; http://dx.doi.org/ 10.1002/mc.20307 [DOI] [PubMed] [Google Scholar]
- 16.Roll JD, Rivenbark AG, Jones WD, Coleman WB. DNMT3b overexpression contributes to a hypermethylator phenotype in human breast cancer cell lines. Mol Cancer 2008; 7:15; PMID:18221536; http://dx.doi.org/ 10.1186/1476-4598-7-15 [DOI] [PMC free article] [PubMed] [Google Scholar]
- 17.Metivier R, Gallais R, Tiffoche C, Le Peron C, Jurkowska RZ, Carmouche RP, Ibberson D, Barath P, Demay F, Reid G, et al.. Cyclical DNA methylation of a transcriptionally active promoter. Nature 2008; 452:45-50; PMID:18322525; http://dx.doi.org/ 10.1038/nature06544 [DOI] [PubMed] [Google Scholar]
- 18.Landi D, Gemignani F, Naccarati A, Pardini B, Vodicka P, Vodickova L, Novotny J, Försti A, Hemminki K, Canzian F, et al.. Polymorphisms within micro-RNA-binding sites and risk of sporadic colorectal cancer. Carcinogenesis 2008; 29:579-84; PMID:18192692; http://dx.doi.org/ 10.1093/carcin/bgm304 [DOI] [PubMed] [Google Scholar]
- 19.Friedman RC, Farh KK, Burge CB, Bartel DP. Most mammalian mRNAs are conserved targets of microRNAs. Genome Res 2009; 19:92-105; PMID:18955434; http://dx.doi.org/ 10.1101/gr.082701.108 [DOI] [PMC free article] [PubMed] [Google Scholar]
- 20.Krek A, Grun D, Poy MN, Wolf R, Rosenberg L, Epstein EJ, MacMenamin P, da Piedade I, Gunsalus KC, Stoffel M, et al.. Combinatorial microRNA target predictions. Nat Genet 2005; 37:495-500; PMID:15806104; http://dx.doi.org/ 10.1038/ng1536 [DOI] [PubMed] [Google Scholar]
- 21.Freedman JE, Tanriverdi K. Defining miRNA targets: balancing simplicity with complexity. Circulation 2013; 127:2075-7; PMID:23625958; http://dx.doi.org/ 10.1161/CIRCULATIONAHA.113.003058 [DOI] [PMC free article] [PubMed] [Google Scholar]
- 22.Yanaihara N, Caplen N, Bowman E, Seike M, Kumamoto K, Yi M, Stephens RM, Okamoto A, Yokota J, Tanaka T, et al.. Unique microRNA molecular profiles in lung cancer diagnosis and prognosis. Cancer Cell 2006; 9:189-98; PMID:16530703; http://dx.doi.org/ 10.1016/j.ccr.2006.01.025 [DOI] [PubMed] [Google Scholar]
- 23.Lamy P, Andersen CL, Dyrskjot L, Torring N, Orntoft T, Wiuf C. Are microRNAs located in genomic regions associated with cancer? Br J Cancer 2006; 95:1415-8; PMID:17003783; http://dx.doi.org/ 10.1038/sj.bjc.6603381 [DOI] [PMC free article] [PubMed] [Google Scholar]
- 24.Duursma AM, Kedde M, Schrier M, le Sage C, Agami R. miR-148 targets human DNMT3b protein coding region. RNA 2008; 14:872-7; PMID:18367714; http://dx.doi.org/ 10.1261/rna.972008 [DOI] [PMC free article] [PubMed] [Google Scholar]
- 25.Teimoori-Toolabi L, Azadmanesh K, Zeinali S. Selective suicide gene therapy of colon cancer cell lines exploiting fibroblast growth factor 18 promoter. Cancer Biother Radiopharm 2010; 25:105-16; PMID:20187803; http://dx.doi.org/ 10.1089/cbr.2009.0643 [DOI] [PubMed] [Google Scholar]
- 26.Teimoori-Toolabi L, Hashemi S, Azadmanesh K, Eghbalpour F, Safavifar F, Khorramizadeh MR. Silencing the wild-type and mutant K-ras increases the resistance to 5-flurouracil in HCT-116 as a colorectal cancer cell line. Anti-cancer Drugs 2015; 26:187-96; PMID:25325304; http://dx.doi.org/ 10.1097/CAD.0000000000000175 [DOI] [PubMed] [Google Scholar]
- 27.Lao VV, Grady WM. Epigenetics and colorectal cancer. Nat Rev Gastroenterol Hepatol 2011; 8:686-700; PMID:22009203; http://dx.doi.org/ 10.1038/nrgastro.2011.173 [DOI] [PMC free article] [PubMed] [Google Scholar]
- 28.Yun J, Song SH, Park J, Kim HP, Yoon YK, Lee KH, Han SW, Oh DY, Im SA, Bang YJ, et al.. Gene silencing of EREG mediated by DNA methylation and histone modification in human gastric cancers. Lab Invest 2012; 92:1033-44; PMID:22508389; http://dx.doi.org/ 10.1038/labinvest.2012.61 [DOI] [PubMed] [Google Scholar]
- 29.Nosho K, Shima K, Irahara N, Kure S, Baba Y, Kirkner GJ, Chen L, Gokhale S, Hazra A, Spiegelman D, et al.. DNMT3B expression might contribute to CpG island methylator phenotype in colorectal cancer. Clin Cancer Res 2009; 15:3663-71; PMID:19470733; http://dx.doi.org/ 10.1158/1078-0432.CCR-08-2383 [DOI] [PMC free article] [PubMed] [Google Scholar]
- 30.Sandhu R, Rivenbark AG, Coleman WB. Loss of post-transcriptional regulation of DNMT3b by microRNAs: a possible molecular mechanism for the hypermethylation defect observed in a subset of breast cancer cell lines. Int J Oncol 2012; 41:721-32; PMID:22664488; http://dx.doi.org/ 10.3892/ijo.2012.1505 [DOI] [PMC free article] [PubMed] [Google Scholar]
- 31.Fabbri M, Calin GA. Epigenetics and miRNAs in human cancer. Adv Genet 2010; 70:87-99; PMID:20920746; http://dx.doi.org/ 10.1016/B978-0-12-380866-0.60004-6 [DOI] [PubMed] [Google Scholar]
- 32.Garzon R, Liu S, Fabbri M, Liu Z, Heaphy CE, Callegari E, Schwind S, Pang J, Yu J, Muthusamy N, et al.. MicroRNA-29b induces global DNA hypomethylation and tumor suppressor gene reexpression in acute myeloid leukemia by targeting directly DNMT3A and 3B and indirectly DNMT1. Blood 2009; 113:6411-8; PMID:19211935; http://dx.doi.org/ 10.1182/blood-2008-07-170589 [DOI] [PMC free article] [PubMed] [Google Scholar]
- 33.Robaina MC, Mazzoccoli L, Arruda VO, Reis FR, Apa AG, de Rezende LM, Klumb CE. Deregulation of DNMT1, DNMT3B and miR-29s in Burkitt lymphoma suggests novel contribution for disease pathogenesis. Exp Mol Pathol 2015; 98:200-7; PMID:25746661; http://dx.doi.org/ 10.1016/j.yexmp.2015.03.006 [DOI] [PubMed] [Google Scholar]
- 34.Krek A, Grün D, Poy MN, Wolf R, Rosenberg L, Epstein EJ, MacMenamin P, da Piedade I, Gunsalus KC, Stoffel M. Combinatorial microRNA target predictions. Nature genetics 2005; 37:495-500; PMID:15806104; http://dx.doi.org/ 10.1038/ng1536 [DOI] [PubMed] [Google Scholar]
- 35.Hlady RA, Novakova S, Opavska J, Klinkebiel D, Peters SL, Bies J, Hannah J, Iqbal J, Anderson KM, Siebler HM, et al.. Loss of Dnmt3b function upregulates the tumor modifier Ment and accelerates mouse lymphomagenesis. J Clin Invest 2012; 122:163-77; PMID:22133874; http://dx.doi.org/ 10.1172/JCI57292 [DOI] [PMC free article] [PubMed] [Google Scholar]
- 36.Silva AL, Dawson SN, Arends MJ, Guttula K, Hall N, Cameron EA, Huang TH, Brenton JD, Tavaré S, Bienz M, et al.. Boosting Wnt activity during colorectal cancer progression through selective hypermethylation of Wnt signaling antagonists. BMC Cancer 2014; 14:891; PMID:25432628; http://dx.doi.org/ 10.1186/1471-2407-14-891 [DOI] [PMC free article] [PubMed] [Google Scholar]
- 37.Zhang W, Dahlberg JE, Tam W. MicroRNAs in tumorigenesis: a primer. Am J Pathol 2007; 171:728-38; PMID:17724137; http://dx.doi.org/ 10.2353/ajpath.2007.070070 [DOI] [PMC free article] [PubMed] [Google Scholar]
- 38.Azizi M, Teimoori-Toolabi L, Arzanani MK, Azadmanesh K, Fard-Esfahani P, Zeinali S. MicroRNA-148b and microRNA-152 reactivate tumor suppressor genes through suppression of DNA methyltransferase-1 gene in pancreatic cancer cell lines. Cancer Biol Ther 2014; 15:419-27; PMID:24448385; http://dx.doi.org/ 10.4161/cbt.27630 [DOI] [PMC free article] [PubMed] [Google Scholar]
- 39.Hodge DR, Peng B, Pompeia C, Thomas S, Cho E, Clausen PA, Marquez VE, Farrar WL. Epigenetic silencing of manganese superoxide dismutase (SOD-2) in KAS 6/1 human multiple myeloma cells increases cell proliferation. Cancer Biol Ther 2005; 4:585-92; PMID:15908783; http://dx.doi.org/ 10.4161/cbt.4.5.1704 [DOI] [PubMed] [Google Scholar]
- 40.Rajendran G, Shanmuganandam K, Bendre A, Muzumdar D, Goel A, Shiras A. Epigenetic regulation of DNA methyltransferases: DNMT1 and DNMT3B in gliomas. J neuro-oncol 2011; 104:483-94; PMID:21229291; http://dx.doi.org/ 10.1007/s11060-010-0520-2 [DOI] [PubMed] [Google Scholar]
- 41.Taniguchi H, Yamamoto H, Hirata T, Miyamoto N, Oki M, Nosho K, Adachi Y, Endo T, Imai K, Shinomura Y. Frequent epigenetic inactivation of Wnt inhibitory factor-1 in human gastrointestinal cancers. Oncogene 2005; 24:7946-52; PMID:16007117; http://dx.doi.org/ 10.1038/sj.onc.1208910 [DOI] [PubMed] [Google Scholar]
- 42.Fabbri M, Garzon R, Cimmino A, Liu Z, Zanesi N, Callegari E, Liu S, Alder H, Costinean S, Fernandez-Cymering C, et al.. MicroRNA-29 family reverts aberrant methylation in lung cancer by targeting DNA methyltransferases 3A and 3B. Pro Natl Acad Sci U S A 2007; 104:15805-10; PMID:17890317; http://dx.doi.org/ 10.1073/pnas.0707628104 [DOI] [PMC free article] [PubMed] [Google Scholar]
- 43.Li Y, Zhao W, Bao P, Li C, Ma XQ, Chen LA. miR-339-5p inhibits cell migration and invasion and may be associated with the tumor-node-metastasis staging and lymph node metastasis of non-small cell lung cancer. Oncol Lett 2014; 8:719-25; PMID:25009651; http://dx.doi.org/ 10.3892/ol.2014.2165 [DOI] [PMC free article] [PubMed] [Google Scholar]
- 44.Ahmed D, Eide PW, Eilertsen IA, Danielsen SA, Eknaes M, Hektoen M, Lind GE, Lothe RA. Epigenetic and genetic features of 24 colon cancer cell lines. Oncogenesis 2013; 2:e71; PMID:24042735; http://dx.doi.org/ 10.1038/oncsis.2013.35 [DOI] [PMC free article] [PubMed] [Google Scholar]
- 45.Smiraglia DJ, Rush LJ, Fruhwald MC, Dai Z, Held WA, Costello JF, Lang JC, Eng C, Li B, Wright FA, et al.. Excessive CpG island hypermethylation in cancer cell lines versus primary human malignancies. Hum Mol Genet 2001; 10:1413-9; PMID:11440994; http://dx.doi.org/ 10.1093/hmg/10.13.1413 [DOI] [PubMed] [Google Scholar]
- 46.Inui M, Martello G, Piccolo S. MicroRNA control of signal transduction. Nat Rev Mol Cell Biol 2010; 11:252-63; PMID:20216554; http://dx.doi.org/ 10.1038/nrm2868 [DOI] [PubMed] [Google Scholar]
- 47.Bueno MJ, Perez de Castro I, Malumbres M. Control of cell proliferation pathways by microRNAs. Cell Cycle 2008; 7:3143-8; PMID:18843198; http://dx.doi.org/ 10.4161/cc.7.20.6833 [DOI] [PubMed] [Google Scholar]