

Abstract
Study design
Longitudinal design.
Objectives
The study was undertaken to determine the effects of cessation of exercise interventions on body composition and metabolic profiles in men with chronic SCI.
Settings
Clinical trials within a Medical Center.
Methods
Eleven men with motor complete SCI were followed on average over a period of 2.5 years. Six men were involved in two different exercise interventions (functional electrical stimulation cycling versus arm cycling ergometer), 5 days/week for 16 weeks (exercise group), and five men served as a control (control group). Anthropometrics and dual energy X-ray absorptiometry (DXA) were captured to measure changes in lean mass (LM), fat mass (FM), percentage FM before, immediately after exercise, and after a period of 2.5 years. Basal metabolic rate (BMR) and lipid panel were also measured.
Results
Thigh circumference increased by 8.5% following exercise (P = 0.042) and remained 6.4% greater than baseline measurements (P = 0.012). Leg LM increased by 9% following the exercise intervention (P = 0.03) and decreased by 16% in the follow-up visit (P = 0.02). Percentage trunk and total body FM increased by 4.5% (P = 0.008) and 3.5% (P = 0.019) in the follow-up visit, respectively, and whole body LM increased by 8.4% and decreased back by 5.4% following a 2.5 year-period. BMR significantly decreased by 15.5% following the exercise (P = 0.029) interventions.
Conclusion
Exercise training is accompanied with positive changes in body composition as well as compensatory decrease in BMR, that regressed back following 2.5 years of exercise cessation. Participation in an exercise trial is unlikely to confound the measurements of a follow-up trial.
Keywords: Clinical trials, Spinal cord injury, Exercise, Functional electrical stimulation, Arm-crank ergometer, Body composition, Metabolic profile
Randomized clinical trials are considered the gold standard of conducting research studies to test the efficacy of specific interventions on improving health variables in the general population. According to the registry of clinical trials, there are close to 200 thousand studies listed in 190 countries and 41% of these trials are listed in the United States.1 It is well known that the costs of conducting clinical trials are high compared to other research trials.2,3 Therefore, most clinical trials are required to be accurately monitored by providing additional oversight and assigning of data and safety monitoring plans to ensure that investigators are meeting their obligations. In individuals with physical disabilities, successful completion of clinical trials may be challenged by the size of the target population and the interest in participation based on the rationale of the study.3 The issue may be further complicated by the fact that a single site may be involved in more than one clinical trial or in frequent trials addressing similar research questions. Therefore, ensuring that recurrent participation did not confound the outcome variables is a key determinant for successful completion of these trials.
Individuals with spinal cord injury (SCI) represent one of the clinical populations with a heterogeneous disorder and limited size. According to the SCI Facts and Figures, the number of people with SCI who lived in the United States was estimated to be 276,000 in 2014 with approximately 12,500 new cases occurring each year.4 Because of advances in medical interventions, the current prevalence of individuals with complete SCI is only 34%. According to guidelines for the conduct of clinical trials after SCI, the number of those with complete SCI is limited for enrollment in clinical trials because of the possibility of experiencing spontaneous recovery.2 This may challenge conducting sufficient clinical trials for persons with complete SCI.
Interest in studying individuals with complete SCI stemmed from the fact that they are at higher risk, when compared to individuals with incomplete SCI, of developing cardio-metabolic disorders similar to type 2 diabetes mellitus, dyslipidemia and osteoporosis.5–8 The higher prevalence of cardio-metabolic disorders may be partially explained by significant reduction in the level of physical activity, sublesional skeletal muscle atrophy and deterioration in body composition following SCI.7,9–11 Persons with complete SCI suffer dramatic skeletal muscle atrophy, loss in lean mass (LM) and increase in fat mass (FM) compared to matched controls.9–11 A decrease of 30–50% in skeletal muscle cross-sectional area over an 18 week period was noted compared to able-bodied controls.9 In a monozygotic twin model study, the SCI twins had 7% greater FM per unit of body mass index (BMI) and 10 kg lower leg lean mass compared to the healthy twins.12 Another study noted that persons with SCI had 13% greater FM per unit of BMI compared to their matched able-bodied controls.11 Garland et al. reported that approximately 33% of bone mass was lost in the lower extremities within the initial three to four months after injury.13 In a study of monozygotic twins, lower extremity long bone mass continued to decrease in a linear fashion compared with the twin without an SCI.14
Different forms of exercise interventions have been prescribed including arm-cycling ergometer (ACE), circuit resistance training and functional electrical stimulation-lower extremity cycling (FES-LEC) to offset the negative changes in body composition and metabolic profile.15–20,22 These interventions have noted positive outcomes on the aerobic capacity, body composition and metabolic profile following SCI. Submaximal ACE training conducted at 60–65% VO2 peak for 12 weeks resulted in increased high density lipoprotein cholesterol (HDL-C) levels in persons with SCI.15 Another study documented reduction in low-grade inflammatory cytokines and leptin levels following 12 weeks of ACE training.21 Additionally, the effects of using functional electrical stimulation (FES) on body composition changes and metabolic disorders similar to glucose intolerance, insulin resistance and dyslipidemia were recently reviewed.22 The review showed that the effects of FES on LM did not exceed an increase of 10% with limited outcomes on FM following SCI. A 12 week evoked resistance training program increased leg LM, trunk LM and decreased leg FM.20 The study also reported skeletal muscle hypertrophy, decreased intramuscular and visceral adiposity and a modest improvement in the metabolic profile.20 Another study noted increases in leg LM associated with improvements in glucose tolerance and insulin sensitivity following eight weeks of FES-LEC training.19
Randomized clinical trials addressing the effects of exercise on body composition and metabolic profiles after SCI are limited in number because of difficulties in recruitment, small population size, lack of homogenous sample, mixing gender, combining both complete and incomplete SCI and well-established barriers associated with any exercise trials. These factors may contribute negatively to the challenges of conducting these trials. Despite our limited knowledge about the effects of exercise interventions on body composition and metabolic profile following SCI, there is a paucity of evidence on the longitudinal changes of these variables following cessation of an exercise intervention. It is still unclear whether participation in a clinical trial may confound future participation in another trial addressing similar research questions on body composition and metabolism. It is also unclear whether participation may attenuate the decline in both composition and metabolic profile associated with aging. This is considered of paramount significance because the process of premature aging is a characteristic feature in persons with SCI. The purpose of the current work was to investigate whether a two year gap between two clinical exercise trials is a reasonable period to ensure no confounding effects on the outcome variables. We hypothesized that this two-year gap will be sufficient to wash out the effects of exercise interventions on body composition, BMR and lipid profile in persons with SCI. We also hypothesized that participation in exercise interventions will not attenuate the effects of aging on body composition and metabolic profile after cessation of the program.
Method
Eleven men with motor complete SCI (C5–T10; 38 ± 9 years old, 84 ± 14 kg, 1.8 ± 0.07 m and 25.7 ± 4.3 kg/m2) were enrolled in the current study (Fig. 1). Six participants were part of a study that investigated the effects of exercise (ACE vs. FES) on total and regional body composition and metabolic profile in men with SCI (exercise group). The six participants were randomly assigned to either ACE (n=3) or FES (n=3) and they were involved in three overnight stays [pre-training (baseline), 16 weeks post-training (post-exercise) and 2.5 years following cessation of the exercise program (follow-up)] to measure body composition and metabolic profile. The other five participants were part of the study that investigated the effects of SCI on total /regional body composition and metabolic profile in individuals with chronic injury (control group). The control group was only involved in two overnight stays (baseline and follow-up measurements) and was used to control for the effects of aging with SCI. On average two and half years after completion of the initial measurements, the eleven participants were invited to visit the laboratory to participate in another clinical trial investigating the effects of electrical stimulation resistance training on body composition and metabolic assessments (follow-up measurements). The procedure of electrically induced resistance training in persons with SCI was previously published.20,23–25
Figure 1.
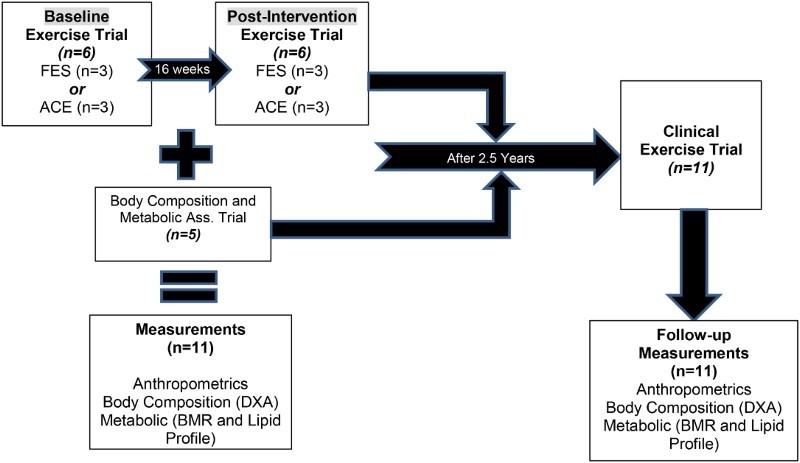
A schematic diagram showing the design of the study including eleven men with motor complete SCI that were followed up after 2.5 years from either participating in 16 week exercise intervention (n=6) or served as a control (n=5) to examine their body composition and metabolic profile.
The study was conducted at the McGuire VA Medical Center in collaboration with the Clinical Research Unit at Virginia Commonwealth University (VCU) Medical Center. All participants were asked to read and sign consent forms that were approved by the local ethics committee. All study procedures were conducted according to the Declaration of Helsinki. Participants were recruited by word of mouth, posted flyers or from the associated SCI clinics at the participating institutions.
Inclusion and exclusion criteria
Eleven men with chronic motor complete SCI (C6–T10; AIS A or B) participated in the current study. Participants were included if they had motor complete SCI (C5–L2; AIS A & B) and greater than one year duration since injury to ensure that acute changes in body composition have been completed by the end of the first year. The age range was 18–50 years old and participants must have been responsive to electrical stimulation eliciting a visible tetanic contraction of the knee extensor muscle group. Participants with motor complete SCI were studied to exclude the inevitable variability of body composition changes that would have been found in individuals with motor incomplete SCI. Participants with pre-existing medical conditions (uncontrolled hypertension, uncontrolled hyperglycemia or a Hemoglobin A1C level greater than 7.0, chronic arterial diseases, recent deep vein thrombosis, uncontrolled autonomic dysreflexia, severe spasticity, fractures, or history of fractures, pressure ulcers greater than Grade II, documented osteoporosis, uncompensated hypothyroidism, renal disease) were excluded from the study.
Interventions for the exercise group for 16 weeks (n=6)
Arm-Crank Ergometer (n=3)
Training was performed at the VA Medical Center SCI Exercise Physiology Laboratory and consisted of exercising the arms on an upper body ergometer (Monark Rehab Trainer 881E, Monark Excercise AB, Vansbro, Sweden). Each session began with a ten-minute warm-up, followed by forty minutes of training exercise, and finished with a ten minute cool down. During the 16-week training period, the workload was adjusted as the participant tolerated from 20 to 40 watts to maintain a peak HR at 75% of their maximum HR. The participant was encouraged to maintain an exercise rate of 50 revolutions per minute. Warm-up and cool down periods consisted of arm cycling without resistance.
Functional electrical stimulation (n=3)
FES cycling was performed on an ERGYS 2 ergometer (Therapeutic Alliances, Fairborn, OH, USA) with bilateral stimulation of the quadriceps, hamstrings, and gluteal muscles. Muscles were stimulated sequentially at 60 Hz with current amplitude (140 mA) necessary to complete 40 minutes of cycling at a cadence of 50 revolutions per minute (RPM) with progressively greater resistance over the course of training. Participants started cycling against no resistance (0/8 kiloponds, kp). However, once the subject was able to cycle without fatigue or dropping of the cadence below 50 RPM, the resistance of the bike was progressed manually to 1/8 kp. Each session included 10 minutes of passive warm-up and cool down, and heart rate was monitored and recorded throughout the training using a Polar RS400 watch. The passive cycling was performed by one of the research investigators to maintain a cadence of 5 RPM less than the target cadence. Fatigue threshold was set at 10 RPM to allow for a longer cycling time despite the fact that muscle fatigue may ensue.
Interventions for the control group (n=5)
Participants in the control group were invited to participate only in two day assessment visits at baseline and following 2.5 years (follow-up) to measure their body composition and metabolic profile without being involved in any exercise intervention. A detailed description of body composition assessment and metabolic profile was previously highlighted and is described below.26,27
Measurements for both groups (n=11)
Participants in both the exercise and the control groups underwent a complete physical examination, including a neurological assessment, and International Standards for Neurological Classification of Spinal Cord Injury (ISNCSCI) examination (One time: 30 to 45 minutes) followed by a resting electrocardiogram (EKG) to rule out possible cardiovascular conditions. Body composition and metabolic profile measurements were conducted over two days, including one overnight stay. After meeting the study inclusion and exclusion criteria, participants were invited to arrive at the laboratory around 1:00 pm to conduct body composition assessments (see below). This was followed by escorting the participant to the Clinical Research Center located at Virginia Commonwealth University for an overnight stay. After an overnight fast for 10–12 hours, each participant underwent basal metabolic rate (BMR) and a fasting blood lipid profile in the morning of the second day (see below). All participants were asked to turn in 3-day dietary recalls at each time point to monitor their caloric intake and macronutrients (data not shown). However, participants did not receive any feedback or recommendations on how to modify their dietary habits.
Body composition assessments
Body composition was assessed for both the exercise (three times; baseline, post-exercise and follow-up) and the non-exercise groups (control; baseline and follow-up) groups (Fig. 1). For the exercise group, the first two visits were performed one week prior to the beginning of the exercise trial (baseline measurements) and one week immediately after termination of the exercise program (post-exercise). For both the exercise and the control groups, body composition assessment was repeated 2.5 years later, in a follow-up visit, in those who remained eligible to participate in an electrically induced resistance training trial and still met the inclusion criteria (follow-up measurements). Body composition assessments involved measuring body mass, height, anthropometrics and dual energy X-ray absorptiometry (DXA).26,27
Body mass and height
Each participant was asked to void his bladder and then to propel onto a wheelchair weighing scale (PW-630U; Tanita)a. After weighing the participant and his wheelchair (kg-1), participants were helped to transfer to an adjustable mat and their wheelchairs were weighed empty (Kg-2). The body mass of each participant was determined by subtracting (2) from (1) (kg). The height of each participant was determined at the left side in the supine position after transferring to the mat and properly aligning the head, trunk and the legs. Two smooth wooden boards were placed at the participant's head and heels and the distance between them corresponded to the height in nearest cm. Every effort was taken to maintain the knees in an extended position. The BMI (Kg/m2) was calculated as the body mass (Kg)/ height2 (m2).26,27
Anthropometrics
Circumferential measurements were performed while participants were seated or in a lying position, while wearing non-restrictive clothes. Participants were asked to take a deep breath and to exhale and measurements were than captured during the expiration phase. Waist (narrowest region below the ribcage), abdominal (widest region at the level of umbilicus) and calf (widest region of the bulk of the calf muscles) circumferences were captured while seated in their wheelchairs. Waist, abdominal, hip (covering both right and left greater trochanters) and thigh (mid-distance between anterior superior iliac spine and superior border of the patella) circumferences were captured in a lying position after transferring to a flat mat. Measurements were reported to the nearest 0.1 cm and repeated until three measures were within 0.5 cm range of one another.
Dual energy X-ray absorptiometry (DXA).
DXA was used to measure body composition in SCI individuals, specifically regional and total fat mass (FM), fat-free mass (FFM; lean mass [LM] and bone mass), bone mineral content (BMC) and density (BMD). The scans were done one week before and three to four days after the end of the 16-week exercise intervention and then repeated at the follow-up measurement. Every effort was taken to mimic the original participants’ positioning on the scanner between the baseline, post-intervention and follow-up measurements. Total body and regional DXA scans were performed using a Lunar Prodigy Advance (Lunar Inc., Madison, WI, USA)b at the VAMC hospital. The scans were performed after lying flat for at least 20 minutes to minimize fluid shift. All scans were performed and analyzed by a trained, certified DXA operator using Lunar software version 10.5. The coefficient of variability of two repeated scans for whole body percentage FM is less than 3%.
Metabolic assessments
Graded exercise test
Maximal graded exercise testing using a Lode arm crank ergometer (Groningen, The Netherlands) was performed before and after the sixteen weeks of exercise only for the exercise group. A TrueMax 2400 computerized metabolic measurement system (ParvoMedics, Salt Lake, UT, USA) was used to determine peak VO2 during the graded exercise tests. The six participants were tested in their own wheelchair. Heart rate and blood pressure were measured using a Polar® HR monitor (automatic) and manual blood pressure (BP) cuff, respectively. The HR monitor was placed on the subject's chest below the xyphoid process. Leg wraps, abdominal binder, and protective gloves were utilized during testing. A warm up period with the initial resistance of 36 watts and a pace of 50 revolutions per minute (RPM) lasted for two minutes. This was followed by subsequent two-minute stages of twelve-watt increments until exhaustion according to American College of Sports Medicine Guidelines for Exercise Testing. Every two minutes, participants were asked to drop their cycling speed (15–25 RPM) to allow manual assessment of the BP for 30 seconds, which was followed by the next stage of incremental increase in power until fatigue. VO2 peak was determined once respiratory exchange ratio (RER) reached a value greater than 1.1 and participant was unable to maintain a cycling speed at a pace of 50 RPM.
Basal metabolic rate (BMR).
After an overnight fast for 10–12 hours, a BMR measurement was performed with indirect calorimeter around 6 am. Participants were kept in a dark room in a supine position for 20 minutes to attain a resting state during which BMR was measured by using a canopy that covers the whole head and portable COSMED K4b2. Basal metabolic rate and respiratory exchange ratio were then recorded.
Lipid profile
Each subject had a fasting lipid profile (HDL-C, LDL-C, total cholesterol, and TG) assessed, with total cholesterol: HDL-C ratios utilized as the criterion variable. A Teflon catheter was inserted into an antecubital vein of one arm or dorsal hand vein for blood sampling and 4 ml/subject was sent for the analysis of Triglycerides, total cholesterol, HDL-C, and LDL-C. After allowing the blood sample to clot for 30 minutes, the blood was centrifuged at 3000 RPM for 10 minutes and the serum transferred for analysis. All samples were sent to the Chemistry Pathology Laboratory for analysis and lipids were determined by standard analyses procedures employed by the Clinical Research Center.26 The plasma concentrations of TG, cholesterol, LDL, HDL-C and glucose concentrations were determined using commercially available colorimetric assays (Sigma, Wako, and Thermo DMA, respectively). LDL-C analysis was performed using the Friedewald equation [LDL= total cholesterol – HDL – (Trig/5)]. The ratio of cholesterol: HDL was then calculated.
Statistical analyses
Repeated measure ANOVA was used to test the effects of exercise interventions on body composition and metabolic profile (n=6) at baseline, post-intervention and follow-up visits. Bonferroni pairwise comparisons were used to determine the level of significance of multiple comparisons in the exercise group. Paired t-tests were used to test for the differences in demographics (age, time since injury [TSI] body mass, height and BMI), body composition (anthropometrics and outcomes of DXA scans) and metabolic profile (BMR and full lipid panel) between the baseline and the follow-up visits in the control group. Because of possible confounding effects of the level of injury on the primary outcome variables at the baseline measurements, analysis of covariance (ANCOVA) was used to test the differences between the exercise and the control groups at the follow-up visit after controlling for variance that may result from the physical characteristics of the participants. All premeasurement values (body composition and metabolic variables) were used as covariates, and interactions were considered. Statistical analyses were performed using SPSS version 21.0 (IBM Corp., Armonk, NY, USA). All values were reported as mean ± SD and statistical significance was set at alpha less than 0.05.
Results
Demographics
The eleven men with motor complete SCI were C6–T10; 38±9 years old, 84±14 kg, 1.8±0.07 m and 25.7±4.3 kg/m2. The physical characteristics according to their assignment (exercise vs. control groups) are listed in Table 1. None of the demographic variables were significantly different at baseline between the exercise and the control groups. At the follow-up visit, the age range was 31–49 years old and TSI range was 1.25–26 years of the eleven participants. The average time difference between baseline and follow-up measurements was 2.5 years for the exercise group and 1.9 years for the control group (Table 1).
Table 1.
Demographics of 11 men (Mean ± SD) with motor complete SCI who participated at baseline (B), post-intervention (P) and follow-up (F) measurements
| Age-B | Age-F | Body Mass-B (kg) | Body Mass - P (kg) | Body Mass -F (kg) | Height –B (m) | Height –P (m) | Height –F (m) | BMI-B (kg/m2) | BMI-P (kg/m2) | BMI-F (kg/m2) | TSI-B (yrs.) | TSI-F (yrs.) | Race/ethnicity | LOI | AIS | |
|---|---|---|---|---|---|---|---|---|---|---|---|---|---|---|---|---|
| Exercise | 47 | 49 | 97.4 | 105 | 106.4 | 1.96 | 1.88 | 1.88 | 25.2 | 27.2 | 30 | 22.2 | 24 | AA | T4 | A |
| 42 | 45 | 87 | 85.5 | 90.3 | 1.81 | 1.81 | 1.85 | 26.6 | 26.2 | 26.5 | 11.3 | 14 | AA | T4 | A | |
| 46 | 48 | 67.4 | 68 | 72.1 | 1.67 | 1.70 | 1.64 | 24 | 24.3 | 26.7 | 26.2 | 28 | W | T4 | A | |
| 29 | 31 | 80 | 92 | 77.9 | 1.79 | 1.78 | 1.77 | 25 | 25.3 | 25 | 3.8 | 7 | W | T5 | A | |
| 34 | 37 | 100.6 | 103 | 106.6 | 1.71 | 1.71 | 1.75 | 34.4 | 35.4 | 34.6 | 13 | 16 | AA | T10 | A | |
| 45 | 48 | 76.5 | 77 | 82.0 | 1.69 | 1.67 | 1.73 | 27 | 27.1 | 27.5 | 3.5 | 6 | AA | T6 | B | |
| Mean ± SD | 40.5 ± 7 | 43 ± 7 | 85 ± 13 | 88.5 ± 14.5 | 89 ± 14.5 | 1.77 ± 0.1 | 1.76 ± 0.08 | 1.77 ± 0.1 | 27 ± 3.7 | 27.6 ± 4 | 28 ± 3.5 | 13.3 ± 9.3 | 15.8 ± 9 | 4AA/2W | T4-T10 | 5A/1B |
| Control | 47 | 49 | 67 | - | 81 | 1.71 | - | 1.74 | 23 | - | 26.8 | 3.4 | 4 | AA | C7 | B |
| 37 | 40 | 68 | - | 71 | 1.83 | - | 1.90 | 20.5 | - | 20 | 11.6 | 14 | AA | C6 | B | |
| 32 | 34 | 84.5 | - | 82 | 1.74 | - | 1.74 | 28.0 | - | 27.3 | 2.15 | 4 | W | T3 | A | |
| 27 | 30 | 93.5 | - | 88 | 1.80 | - | 1.83 | 29 | - | 26.5 | 1.25 | 4 | AA | T6 | A | |
| 33 | 34 | 66 | - | 64 | 1.83 | - | 1.88 | 19.6 | - | 18.0 | 5 | 6 | W | C6 | A | |
| Mean ± SD | 35 ± 7.5 | 37.5 ± 7.5 | 76 ± 12.5 | N/A | 77 ± 10 | 1.78 ± 0.1 | N/A | 1.82 ± 0.1 | 24 ± 4.3 | 23.7 ± 4.4 | 4.7 ± 4 | 6.4 ± 4 | 3AA/2W | C6-T6 | 3A/2B |
B: baseline measurement, P: post-intervention measurement, F: follow-up measurement; BMI: body mass index; TSI: time since injury; LOI: level of injury; AIS: American Spinal Cord Injury Impairment Spinal Scale; AA: African American; W: White; N/A: not applicable.
At the baseline measurements, body mass was greater in the exercise group than the control group (P = 0.0001). There was a non-significant increase (P = 0.19) in the body mass in the exercise group (n=6), but not in the control group (Table 1). Baseline peak VO2 (17±3 ml/kg/min) and HRMAX (168±16 beats/min) were not different (P = 0.3–P = 0.5) from the post-intervention peak VO2 (19±4 ml/kg/min) and HRMAX (163±12 beats/min). Power output increased (P = 0.017) from 98±13 W to 116±13 W following 16 weeks of training.
Anthropometrics
Table 2 demonstrates the anthropometric measurements for both the exercise and the control groups at the baseline, post-intervention and the follow-up visits (Figs. 2a and b). At baseline measurements, none of the anthropometrics variables were different between the exercise and the control groups. After allowing for covariance of the baseline measurements, ANCOVA showed no statistical differences in anthropometrics between the exercise and the control groups at the follow-up measurements. Repeated measure ANOVA showed that mid-thigh circumference increased by 8.5% following exercise (P = 0.042) and remained 6.4% greater than the baseline measurements (P = 0.012) in the exercise group in the follow-up visit, with no changes in the control group.
Table 2.
Anthropometric measurements including seated and supine circumferences at baseline, post-intervention and follow-up visits in men with chronic SCI
| Baseline Measurements |
Post-Intervention Measurements | Follow-Up Measurements |
|||
|---|---|---|---|---|---|
| Exercise group (n=6) | Control group (n=4) | Exercise group (n=6) | Exercise group (n=6) | Control group (n=5) | |
| Waist Circumference-Seated (cm) | 97 ± 8 | 90 ± 6 | 98 ± 7 | 97 ± 11 | 90 ± 7 |
| Waist Circumference-Supine (cm) | 93.5 ± 7 | 90 ± 6 | 94 ± 6 | 94 ± 10 | 90 ± 5 |
| Abdominal Circumference-Seated (cm) | 108 ± 10 | 102.5 ± 5 | 108.5 ± 11 | 110.5 ± 12 | 103 ± 6 |
| Abdominal Circumference-Supine (cm) | 94 ± 7.5 | 93 ± 6.5 | 95.5 ± 9.5 | 96.5 ± 7 | 92.5 ± 7 |
| Hip Circumference (cm) | 100.5 ± 8.5 | 102 ± 8 | 103 ± 11 | 100.5 ± 9 | 98.5 ± 6.5 |
| Thigh Circumference (cm) | 48.5 ± 8 | 52.3 ± 7 | 52.6 ± 10* | 51.6 ± 9* | 52 ± 5.5 |
| Calf Circumference (cm) | 34.7 ± 4 | 33.6 ± 4 | 35 ± 4 | 35 ± 2.5 | 33.6 ± 3 |
| Waist: Hip Ratio | 0.93 ± 0.05 | 0.88 ± 0.03 | 0.92 ± 0.06 | 0.93 ± 0.08 | 0.91 ± 0.05 |
*significant difference from baseline values (P = 0.042; post-intervention vs. baseline) and (P = 0.012; follow-up vs. baseline).
N.B. one of the five men in the control group failed to report for his anthropometrics during the baseline measurements (n=4).
Figure 2.
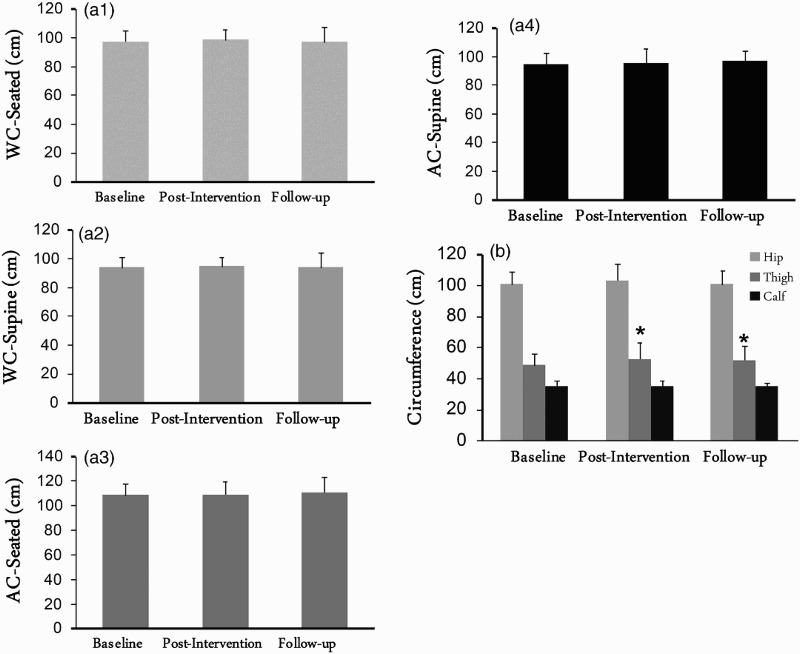
Waist circumferences (WC; a1-2), abdominal circumferences (AC; a3-4) as well as hip, thigh and calf circumferences (b) of 6 men with complete SCI who participated in 16-week exercise intervention and were followed over 2.5 years. *, statistically significant difference in thigh circumference (P < 0.05).
Regional and whole body composition
Table 3 presents the changes in the regional and whole body FM, LM, percentage FM, BMC and BMD in both groups at the baseline, post-intervention and follow-up assessment visits (Figs. 3a–c).
Table 3.
Total and regional body composition assessments at baseline, post-intervention and follow-up visits in men with chronic complete SCI
| Baseline | Post-Intervention |
Follow-up |
||||
|---|---|---|---|---|---|---|
| Measurements | Measurements |
Measurements |
||||
| Exercise group | Control group | Exercise group | Exercise group | Control group | ||
| (n=6) | (n=5) | (n=6) | (n=6) | (n=5) | ||
| Arms | FM (kg) | 2.6 ± 0.8 | 1.9 ± 0.8 | 3.14 ± 1.1 | 3.4 ± 0.9 | 2.15 ± 0.8# |
| LM (kg) | 8.8 ± 1.8 | 5.9 ± 1.8 | 9.2 ± 2 | 8.9 ± 1.3 | 7.7 ± 2.0 | |
| %FM | 22 ± 4 | 22.8 ± 6.5 | 24.3 ± 6.5 | 26.4 ± 5* | 24.5 ± 8.5 | |
| BMC (kg) | 0.5 ± 0.09 | 0.41 ± 0.07 | 0.52 ± 0.12 | 0.52 ± 0.09 | 0.42 ± 0.06 | |
| BMD (g/cm2) | 1.17 ± 0.13 | 1.01 ± 0.15 | 1.16 ± 0.12 | 1.27 ± 0.09 | 1.1 ± 0.17 | |
| Legs | FM (kg) | 9.05 ± 2.8 | 9.3 ± 3.13 | 9.2 ± 3.4 | 8.7 ± 2.8 | 9.3 ± 3.3 |
| LM (kg) | 14.7 ± 4.2* | 14.3 ± 1.8 | 16 ± 4.4* | 13.4 ± 4* | 14.2 ± 1.4 | |
| %FM | 36.7 ± 7 | 37 ± 8.2 | 35 ± 7 | 37.7 ± 6 | 37.5 ± 9.5 | |
| BMC (kg) | 0.9 ± 0.2 | 0.92 ± 0.18 | 0.91 ± 0.2 | 0.88 ± 0.24^ | 0.87 ± 0.18 | |
| BMD (g/cm2) | 1.05 ± 0.14 | 1.11 ± 0.14 | 1.06 ± 0.11 | 1.05 ± 0.15 | 1.08 ± 0.1 | |
| Trunk | FM (kg) | 17.3 ± 4 | 14.5 ± 5.5 | 15.8 ± 3 | 20 ± 4.8* | 15.5 ± 5.1 |
| LM (kg) | 23.5 ± 4 | 21.5 ± 2 | 25 ± 5 | 26 ± 6.4 | 22 ± 2.4 | |
| %FM | 41 ± 6 | 38 ± 9 | 38 ± 4 | 42.5 ± 4.5* | 40 ± 10 | |
| BMC (kg) | 1.15 ± 0.17 | 0.97 ± 0.28 | 1.07 ± 0.2 | 1.2 ± 0.24* | 1 ± 0.2 | |
| BMD (g/cm2) | 1 ± 0.12 | 0.92 ± 0.11 | 1 ± 0.1 | 1.0 ± 0.14 | 0.95 ± 0.13 | |
| Total Body | FM (kg) | 30 ± 6.7 | 26.6 ± 9.5 | 29.7 ± 6.3 | 33.5 ± 6.3 | 28 ± 9.5 |
| LM (kg) | 51.2 ± 10 | 45.7 ± 5.2 | 55.5 ± 10.5 | 52.5 ± 10* | 46 ± 5 | |
| %FM | 35.6 ± 5.3 | 35.6 ± 5 | 34 ± 4.6 | 37.5 ± 4* | 36 ± 9.5 | |
| BMC (kg) | 3.2 ± 0.47 | 2.8 ± 0.5 | 3.1 ± 0.5 | 3.2 ± 0.5* | 2.8 ± 0.4 | |
| BMD (g/cm2) | 1.2 ± 0.12 | 1.13 ± 0.09 | 1.2 ± 0.1 | 1.2 ± 0.11 | 1.15 ± 0.12 | |
FM: fat mass; LM: lean mass; %FM: percentage fat mass; BMC: bone mineral content; BMD: bone mineral density
#, significant difference between exercise and control group in follow-up measurements (P = 0.046) after controlling for baseline measurements
*, significant difference in the follow-up measurements, after conducting pairwise comparisons, compared to either baseline or post-intervention in the exercise group.
^, trend towards significant difference in leg% fat mass in the exercise group (P = 0.08).
Figure 3.
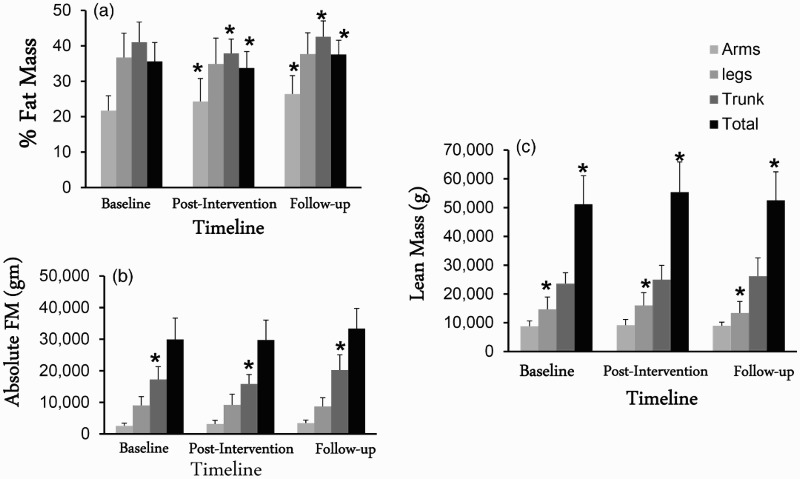
Regional and whole body composition (a, b and C) variables of 6 men with complete SCI who participated in 16 week exercise intervention and were followed over 2.5 years. *, statistically significance difference in regional and whole body composition (P < 0.05).
There were no differences in any of the arm parameters between the exercise and the control group at the baseline measurements. Arm %FM increased significantly (P = 0.025) following both post-intervention and follow-up visits compared to the baseline assessment visit. Pairwise comparisons showed that arm %FM was significantly (P = 0.02) greater at the follow-up visit compared to the baseline assessment visit. There was no difference in any of the other arm variables between the exercise and the control groups at the follow-up visit.
There were no differences in any of the leg parameters between the exercise and the control group at the baseline measurements. There was a trend (P = 0.08) of decreases in %leg FM following 16 weeks of training and then increases following 2.5 years of the cessation of the exercise program. Leg LM increased (P = 0.006) significantly by 9% following 16 weeks of training and then decreased by 16% following 2.5 years at the follow-up visit after cessation of the exercise. Pairwise comparisons showed that leg LM was significantly different between baseline and post-intervention (P = 0.03), with a significant difference between the follow-up and the post-intervention (P = 0.02) visits. There were no changes in the control group.
There were no differences in any of the trunk variables between the exercise and the control group at the baseline assessment visit. In the exercise group, trunk FM (P = 0.034), %FM (P = 0.008) and BMC (P = 0.02) increased significantly at the follow-up visit compared to the post-intervention visit. Only trunk FM significantly increased (P = 0.039) compared to the baseline visit in the exercise group with no changes in the control group. There were no differences in any of the trunk variables between the exercise and the control groups at the follow-up visit.
Parameters of whole body composition including total body %FM, absolute FM, LM, BMC and BMD were not different between the exercise and the control groups at the baseline assessment visit (Table 3). Repeated measure ANOVA showed that whole body LM increased by 8.4% and reverted back by 5.4% following 2.5 years of washout period. Whole body LM significantly decreased at the follow-up visit compared to both the baseline visit (P=0.015) and the post-intervention visit (P = 0.054) in the exercise group, with no changes in the control group. Moreover, whole body %FM (P = 0.019) and BMC (P = 0.027) significantly increased at the follow-up visit compared to the post-intervention visit in the exercise group (Table 3). ANCOVA revealed no significant differences between the exercise and the control groups at the follow-up assessment visit.
Metabolic profile
Table 4 presents the changes in BMR and lipid panel at the baseline, post-intervention and follow-up visits in both the exercise and control groups. BMR (P = 0.029), BMR/ LM (P = 0.026) and BMR/FFM (P = 0.019) decreased significantly following the 16-week intervention at the post-intervention visit (Figs. 4a and b). There was non-significant rebound of BMR, BMR/ LM and BMR/FFM at the follow-up visit. There were no changes in the lipid profile in either the exercise or the control groups following the post-intervention or in the follow-up assessment visits.
Table 4.
Basal metabolic rate (BMR) and full lipid panel at baseline, post-exercise intervention and follow-up visits for in men with chronic complete SCI
| Baseline Visit |
Post-Intervention Visit |
Follow-up Visit |
|||
|---|---|---|---|---|---|
| Exercise group (n=6) | Control group (n=5) | Exercise group (n=6) | Exercise group (n=6) | Control group (n=5) | |
| BMR (Kcal/day) | 1470 ± 173 | 1147 ± 403 | 1242 ± 234* | 1350 ± 218 | 1269 ± 164 |
| BMR / lean mass (kcal/day/kg) | 29.3 ± 4.3 | 24.6 ± 6.4 | 23.4 ± 7 | 27 ± 7 | 27.8 ± 4 |
| BMR/ FFM (kcal/day/kg) | 27.5 ± 4 | 23.2 ± 6 | 22 ± 6.6* | 25 ± 6.7 | 25.5 ± 3.6 |
| BMR / whole body mass (kcal/day/kg) | 17.6 ± 2.7 | 15.2 ± 5.4 | 14.6 ± 4.5 | 15.7 ± 4.3 | 16.6 ± 3.3 |
| Total- cholesterol (TC; mg/dl) | 178 ± 44 | 150 ± 18 | 180 ± 36 | 156 ± 26 | 136 ± 17 |
| HDL-C (mg/dl) | 36 ± 8 | 40 ± 11 | 33 ± 6 | 33 ± 5.3 | 38 ± 5.5 |
| LDL-C (mg/dl) | 115 ± 40 | 92 ± 23 | 115 ± 22 | 96.5 ± 30 | 82 ± 14 |
| TG (mg/dl) | 132 ± 51 | 93 ± 27 | 163 ± 119 | 134 ± 35.5 | 79.6 ± 40 |
| TC: HDL-C ratio | 5.1 ± 1.3 | 4 ± 0.9 | 5.6 ± 1.15 | 4.8 ± 1 | 3.6 ± 0.5 |
BMR: Basal Metabolic Rate; FFM: fat-free mass; TC: Total Cholesterol; HDL-C: high density lipoprotein cholesterol; LDL-C: low density lipoprotein cholesterol; TG: Triglycerides
*1 mg/dl = 1/18 mmol/l
*, significant decrease in BMR (P = 0.029), BMR/lean mass (P = 0.026) and BMR/FFM (P = 0.019) following 16-week exercise intervention compared to the baseline visit.
Figure 4.
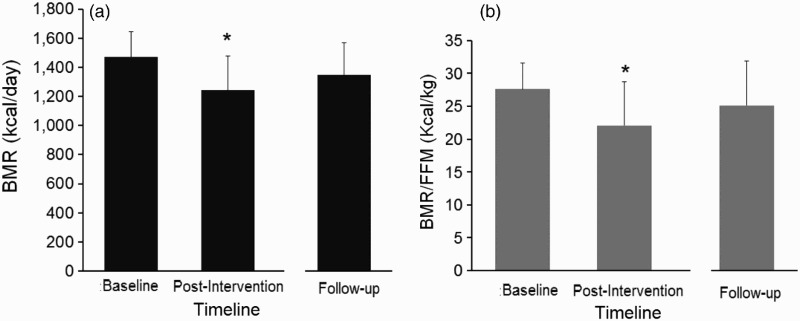
BMR (a) and BMR/FFM (b) of 6 men with complete SCI who participated in 16-week exercise intervention and were followed over 2.5 years. *, statistically significant decrease in BMR and BMR/FFM following 16 weeks of training (P < 0.05).
Discussion
The current study was undertaken to determine whether recurrent participation in multiple clinical trials may influence the outcomes of exercise on body composition or metabolic profile measurements in persons with chronic complete SCI. We were also interested in studying the longitudinal effects following cessation of exercise on body composition and metabolic profile in men with chronic SCI. The main finding of the current study is that following 2.5 years of washout period after participation in an exercise trial, and after controlling for the baseline measurements for body composition and metabolic variables, there were no differences between the exercise and the control groups in any of the studied variables. A 2.5-year gap was likely to washout any effects of previous exercise (FES or ACE) interventions on subsequent trials addressing similar outcome measurements. This was indicated by the lack of any differences in both body composition and metabolic profiles between the exercise and the control group at the follow-up visit. The control group served to control for the effects of aging during the current trial. Moreover, the findings showed that the exercise interventions were effective in increasing leg LM and decreasing percentage FM; both variables reverted back following 2.5 years of cessation of the exercise. Whole body LM increased by 8.4% and decreased back by 5.4% following 2.5 years of cessation of the exercise. The effect of aging was prominent in the regional and whole body %FM in the exercise group but not in the control group. A compensatory strategy was noted in BMR, BMR/lean mass and BMR/FFM during the exercise interventions, which rebounds partially back close to the baseline values in the exercise group.
Clinical trials are considered the gold standard of testing the efficacy of specific interventions on health outcome variables.2,3 However, the cost of conducting a successful clinical trial is expensive and requires large sample sizes with strict adherence to specific inclusion and exclusion criteria. Because of limited access to the SCI population, it is likely to assume that the same person may participate in more than one clinical trial at different time points. Compared to the recommended guidelines for the clinical trials after SCI,2,3 there are no established recommendations or consensus to ensure that frequent participation would not impact similar outcome measurements. The current study addressed the effects of recurrent participation of eleven individuals with motor complete SCI on body composition and metabolic profiles. The interest in studying these outcome variables stemmed from the well-established associations between these variables and several metabolic and cardio-vascular disorders.7 The prevalence of these metabolic disorders and their economic burdens are well reported in this population.28
Several exercise interventions have been previously recommended to offset several of the negative body composition and metabolic profiles following SCI. Recently, the effects of FES interventions on body composition and metabolic variables were summarized.22 The findings indicated that FES can help increasing LM and has modest effects on FM as well as the metabolic profile. In accordance with previous findings, we noted significant improvement in whole body and leg LM following 16 weeks of training. Moreover, established consensus of exercise recommendations for persons with SCI are now available; highlighting the significance of prescribing exercise to this population despite the well-established barriers.29 It is also important to note that we have combined two different exercise interventions together to form the exercise group. We did not attempt to test the differences between FES-cycling and ACE, but rather determined how involvement in an exercise program will likely influence body composition and metabolic profile before participation in another clinical trial. Despite the fact that there were no statistical differences, the baseline measurements were greater for arms, legs, trunk and total body LM in the exercise group compared to the controls. The greater difference in LM could be explained by difference in body mass which exceeded 9 kg between the exercise and the control groups. Three out of the five participants in the control group were individuals with tetraplegia. It is also important to note mid-thigh circumference increased by 8.5% following exercise and remained 6.4% greater compared to the baseline measurements in the exercise group. This finding is in agreement with the increase in leg LM that was noted following training. At the follow-up visit, the mid-thigh circumference may represent an increase in the percentage leg FM with concomitant decrease in the leg LM in the exercise group. Previously, mid-thigh circumference was used to determine the efficacy of two different cadences of FES on muscle size following 6 weeks of training in persons with SCI.30
Leg LM and whole body LM appeared to be greatly responsive to both the training and the detraining periods compared to the LM in the arms and the trunk in the exercise group. This may demonstrate the significance of long-term loading of the sublesional muscles once regaining LM following an exercise intervention. Sublesional skeletal muscle atrophy is well documented in both arms and legs following SCI that may easily exceed 30% of the original size.9,10 In a monozygotic twin study, the SCI twins had a 10 kg lower leg LM compared to their healthy co-twins.12 The authors showed that persons with SCI can easily lose up to 4 kg of LM per every five year period of paralysis.12 In the current study, we demonstrated that 16 weeks of training are likely to increase whole body LM and leg LM by 4.3 kg and 1.3 kg, respectively. This may suggest the effects of SCI on LM over a five year period can be offset in just 16 weeks. It is interesting to note that the gain in LM over 16 weeks was double the gains reported for administering testosterone in hypogonadal men with SCI over a one year period (4.3 kg to 2.7 kg).31
The findings deliver an important message to the SCI community about the efficacy of the current exercise interventions on attenuating the detrimental effects of SCI with aging. However, there was a regression in leg LM by almost 2.6 kg (16%) following 2.5 years of the cessation of exercise, with almost no changes in the control group. This 16% decrease in leg LM is greater than the gain reported (∼8%) in the current study as well as what has been previously reported on the effects of FES training on leg LM (∼10%),19 suggesting that aging with SCI is likely to cause aggressive decrease in sublesional LM after termination of the training program. Bauman et al. noted retention of whole body LM after six months from termination of one year therapy of testosterone administration in hypogonadal men with SCI.31 Therefore, it is possible to suggest that six months may be a reasonable period before the LM regressed back to its baseline values. The findings from the control group may suggest that leg LM reaches its nadir and is unlikely to show further decline after several years of SCI. This may highlight the robust nature of using DXA scans in quantifying regional changes in body composition in longitudinal studies of SCI as well as the significance of considering exercise interventions even at a lower frequency to maintain regional gains in body composition.23 Training once a week can result in increased leg LM in a person with chronic SCI.23
The loss in LM is continuously replaced by infiltration of adipose tissue in subcutaneous and ectopic sites. The burden of regional adiposity on metabolic profile characterized by impaired glucose tolerance and dyslipidemia has been established following SCI.26 It is empirical to note that regional adiposity characterized by increased visceral adiposity, leg and trunk FM has been associated with negative metabolic derangements following SCI.26,32 Moreover, relative increase in leg FM to trunk FM and whole body FM has been associated negatively with the metabolic profile after SCI. The continuous loss in LM and FFM as noted above, overwhelms the energy balance and leads to a significant reduction in BMR. BMR of persons with tetraplegia and paraplegia may range from 1250 to 1400 Kcal/day, respectively. In the current study, we noted significant decline in BMR, BMR/FFM and BMR/lean mass following exercise training. The decline in BMR values rebounded back at the follow-up visit close to the baseline values. It is possible to assume that a strenuous program similar to the one that was used in the current study may have led to compensatory strategies that lead to decline in BMR. We have previously shown that caloric expenditure of FES cycling following 21 weeks of training is 3.98 kcal/min;33 this means that the caloric expenditure during 40 minutes ride is 159 kcal/session and 796 kcal/week. This compensatory decline in BMR may be concomitant to increase energy expenditure during exercise in persons with SCI.
At the baseline measurements, the exercise group had a greater non-significant BMR, TC, TG, TC: HDL-C ration and lower HDL-C than the control group. The greater BMR may be attributed to the greater LM or FFM that was noted in the exercise group. The difference in BMR between both groups was still recognized even after adjusting for LM and FFM, suggesting that other factors similar to the level of injury may have influenced their BMR. The control group has three individuals with tetraplegia that may have likely contributed to the overall lower BMR compared to the exercise group. A possible caveat of conducting a clinical exercise trial is failure to control for caloric intake or providing appropriate dietary recommendations throughout the trial. We have previously shown 21 weeks of FES training did not provide the anticipated outcomes from the exercise intervention, because of failure to control for caloric intake in a person with motor complete SCI.33
Previous research work has clearly documented the positive effects of exercise on lipid profile.33,34 In the current trial, the exercise group had an abnormally higher lipid profile compared to the controls at the baseline and at the follow-up visits. Libin et al. showed that the most important determinant for lipid profile is obesity in persons with SCI.35 Despite the improvement in body composition parameters with exercise, lipid profile did not improve following 16 weeks of training. The negative associations of visceral adiposity on lipid profile were previously established.32,36,37 The results indicated that the exercise group had a non-significant greater WC and abdominal circumferences compared to the control group; which may explain their abnormal lipid profile. Evoked resistance training using electrical stimulation decreased visceral adiposity with concomitant improvement in lipid profile in men with SCI.20 Moreover, engaging in this 16-week intervention may have possibly resulted in increasing caloric intake or percentage macronutrients of fat intake. Persons with SCI consume more fat in their diet compared to the other macro-nutrient components (carbohydrates and proteins). The findings may suggest that other rigorous dietary lifestyle changes need to be adopted to influence lipid profile.
Limitations
There are several limitations that need to be considered in the current study. The data has been collected from three different clinical trials that were conducted by the same laboratory at different time points. Although the same equipment and the same research staff were involved in these three trials, it is likely that sources of error may have been introduced over the course of time by implementing different research questions for each of the trials. A source of error may have resulted from the changes in either the physical or medical status of the participants. We have implemented strict inclusion criteria to ensure that any changes in both the medical or physical status do not influence the outcomes of the current report. Another source of error may result from involvement of different research staff and their level of training in scanning or collecting anthropometric measurements. We have provided sufficient training to our research staff and we limited data collection to primarily two or three research investigators. None of the 11 participants self-reported participating in structured exercise program over the 2.5-year period before they were re-invited to participate in the third clinical trial. During the 2.5-year follow-up period, we did not maintain any contact with the subjects to measure their level of physical activity. Another limitation was failure to capture data earlier than two years (i.e. six months or one year post-cessation of the exercise interventions). Six months following termination of Testosterone replacement therapy for 1 year, persons with motor complete SCI are still maintaining the gain in LM and BMR.31 This may have helped introduce beneficial information about early changes and what may be likely to happen following termination of specific exercise interventions. However, conduction of clinical trials needs various levels of approval that delay data collection. Also, there is a discrepancy in the level of injury between both groups with three persons with tetraplegia in the control group. This may have contributed to the differences noted in body composition and the metabolic profiles at the baseline measurement visit between both groups. Therefore, the current preliminary data may need to be used with caution considering these limitations. Moreover, the current preliminary findings incorporated both cross-sectional (exercise vs. control) and longitudinal (baseline vs. follow-up measurements) designs, which are likely to offset for the aforementioned limitations.
Conclusions
The findings suggested that a 2.5-year gap was a reasonable period to washout any previous effects of exercise on body composition and metabolic profile in men with SCI. The current study delivers an important message concerning the cessation of specific exercise routines and the likelihood to lose any positive changes on both body composition and metabolic profile. Cessation of an exercise intervention results in a reciprocal decline in body composition and metabolic parameters, we may need to recommend continuation of the exercise interventions to ensure long-term compliance and to avoid loss in LM and increasing FM with aging. Therefore, it is highly recommended that following any exercise routine, a period of reduced exercise frequency (i.e. once a week) may need to be encouraged to maintain the gains in body composition and metabolic profiles following SCI. Frequent participation in clinical trials should proceed with caution and with a reasonable gap, especially for trials that are likely to address similar outcome variables.
Disclaimer statements
Funding None.
Conflicts of interest None.
Ethics approval None.
Acknowledgments
We would like to thank Hunter Holmes McGuire Research Institute and Spinal Cord Injury Services and Disorders for providing the environment to conduct clinical human research trials. The project described was supported by VHA RR&D #B3918R, VHA RR&D #B6757R, VHA RR&D# B7867-W and award number UL1RR031990 from the National Center for Advancing Translational Sciences. The content is solely the responsibility of the authors and does not necessarily represent the official views of the Veterans Health Administration, National Center for Research Resources, or the National Institutes of Health.
References
- 1.https://ClinalTrials.gov. Accessed August 31, 2015.
- 2.Fawcett JW, Curt A, Steeves JD, Coleman WP, Tuszynski MH, Lammertse D, et al. Guidelines for the conduct of clinical trials for spinal cord injury as developed by the ICCP panel: spontaneous recovery after spinal cord injury and statistical power needed for therapeutic clinical trials. Spinal Cord 2007;45(3):190–205. doi: 10.1038/sj.sc.3102007 [DOI] [PubMed] [Google Scholar]
- 3.Steeves JD, Lammertse D, Curt A, Fawcett JW, Tuszynski MH, Ditunno JF, et al. Guidelines for the conduct of clinical trials for spinal cord injury (SCI) as developed by the ICCP panel: clinical trial outcome measures. Spinal Cord 2007;45(3):206–21. doi: 10.1038/sj.sc.3102008 [DOI] [PubMed] [Google Scholar]
- 4.Facts and Figures at a Glance, Updated 2015 Available at https://www.nscisc.uab.edu/. (accessed on August 31, 2015).
- 5.Bauman WA, Spungen AM. Disorders of carbohydrate and lipid metabolism in veterans with paraplegia or quadriplegia: a model of premature aging. Metabolism 1994;43(6):749–56. doi: 10.1016/0026-0495(94)90126-0 [DOI] [PubMed] [Google Scholar]
- 6.Bauman WA, Spungen AM. Carbohydrate and lipid metabolism in chronic spinal cord injury. J Spinal Cord Med 2001;24(4):266–77. [DOI] [PubMed] [Google Scholar]
- 7.Bauman WA, Spungen AM. Coronary heart disease in individuals with spinal cord injury: assessment of risk factors. Spinal Cord 2008;46(7):466–76. doi: 10.1038/sj.sc.3102161 [DOI] [PubMed] [Google Scholar]
- 8.Dolbow DR, Gorgey AS, Daniels JA, Adler RA, Moore JR, Gater DR Jr. The effects of spinal cord injury and exercise on bone mass: a literature review. Spinal Cord 2012;50(11):170–1. doi: 10.1038/sc.2011.115 [DOI] [PubMed] [Google Scholar]
- 9.Castro MJ, Apple DF Jr, Hillegass EA, Dudley GA. Influence of complete spinal cord injury on skeletal muscle cross-sectional area within the first 6 months of injury. Eur J Appl Physiol Occup Physiol 1999;80(4):373–8. doi: 10.1007/s004210050606 [DOI] [PubMed] [Google Scholar]
- 10.Gorgey AS, Dudley GA. Skeletal muscle atrophy and increased intramuscular fat after incomplete spinal cord injury. Spinal Cord 2007;45(4):304–9. [DOI] [PubMed] [Google Scholar]
- 11.Spungen AM, Adkins RH, Stewart CA, Wang J, Pierson RN Jr, Waters RL, et al. Factors influencing body composition in persons with spinal cord injury: a cross-sectional study. J Appl Physiol 2003;95(6):2398–407. doi: 10.1152/japplphysiol.00729.2002 [DOI] [PubMed] [Google Scholar]
- 12.Spungen AM, Wang J, Pierson RN Jr, Bauman WA. Soft tissue body composition differences in monozygotic twins discordant for spinal cord injury. J Appl Physiol 2000;88(4):1310–5. [DOI] [PubMed] [Google Scholar]
- 13.Garland DE, Stewart CA, Adkins RH, Hu SS, Rosen C, Liotta FJ, et al. Osteoporosis after spinal cord injury. J Orthop Res 1992;10(3):371–8. doi: 10.1002/jor.1100100309 [DOI] [PubMed] [Google Scholar]
- 14.Bauman WA, Spungen AM, Wang J, Pierson RN Jr, Schwartz E. Continuous loss of bone during chronic immobilization: a monozygotic twin study. Osteoporos Int 1999;10(2):123–7. doi: 10.1007/s001980050206 [DOI] [PubMed] [Google Scholar]
- 15.El-Sayed MS, Younesian A. Lipid profiles are influenced by arm cranking exercise and training in individuals with spinal cord injury. Spinal Cord 2005;43(5):299–305. doi: 10.1038/sj.sc.3101698 [DOI] [PubMed] [Google Scholar]
- 16.Hicks AL, Martin Ginis KA, Pelletier CA, Ditor DS, Foulon B, Wolfe DL. The effects of exercise training on physical capacity, strength, body composition and functional performance among adults with spinal cord injury: a systematic review. Spinal Cord 2011;49(11):1103–27. doi: 10.1038/sc.2011.62 [DOI] [PubMed] [Google Scholar]
- 17.Hicks AL, Martin KA, Ditor DS, Latimer AE, Craven C, Bugaresti J, et al. Long-term exercise in persons with spinal cord injury: effects on strength, arm ergometer performance and psychological well-being. Spinal Cord 2003;41(1):34–43. doi: 10.1038/sj.sc.3101389 [DOI] [PubMed] [Google Scholar]
- 18.Jacobs PL. Effects of Resistance and endurance training in person with paraplegia. Med Sci Sports Exerc 2009;41(5):992–7. doi: 10.1249/MSS.0b013e318191757f [DOI] [PubMed] [Google Scholar]
- 19.Griffin L, Decker MJ, Hwang JY, Wang B, Kitchen K, Ding Z, et al. Functional electrical stimulation cycling improves body composition, metabolic and neural factors in persons with spinal cord injury. J Electromyogr Kinesiol 2009;19(4):614–22. doi: 10.1016/j.jelekin.2008.03.002 [DOI] [PubMed] [Google Scholar]
- 20.Gorgey AS, Mather KJ, Cupp HR, Gater DR. Effects of resistance training on adiposity and metabolism after spinal cord injury. Med Sci Sports Exerc 2012;44(1):165–74. doi: 10.1249/MSS.0b013e31822672aa [DOI] [PubMed] [Google Scholar]
- 21.Rosety-Rodriguez M, Camacho A, Rosety I, Fornieles G, Rosety MA, Diaz AJ, et al. Low-grade systemic inflammation and leptin levels were improved by arm cranking exercise in adults with chronic spinal cord injury. Arch Phys Med Rehabil 2014;95(2):297–302. doi: 10.1016/j.apmr.2013.08.246 [DOI] [PubMed] [Google Scholar]
- 22.Gorgey AS, Dolbow DR, Dolbow JD, Khalil RK, Gater DR. The effects of electrical stimulation on body composition and metabolic profile after spinal cord injury—Part II. J Spinal Cord Med 2015;38(1):23–37. doi: 10.1179/2045772314Y.0000000244 [DOI] [PMC free article] [PubMed] [Google Scholar]
- 23.Gorgey AS, Caudill C, Khalil RE. Effects of once weekly of NMES training on knee extensors fatigue and body composition in a person with spinal cord injury. J Spinal Cord Med 2016;39(1):99–102. doi: 10.1179/2045772314Y.0000000293 [DOI] [PMC free article] [PubMed] [Google Scholar]
- 24.Ryan TE, Brizendine JT, Backus D, McCully KK. Electrically induced resistance training in individuals with motor complete spinal cord injury. Arch Phys Med Rehabil 2013;94(11):2166–73. doi: 10.1016/j.apmr.2013.06.016 [DOI] [PubMed] [Google Scholar]
- 25.Gorgey AS, Dolbow DR, Cifu DX, Gater DR. Neuromuscular electrical stimulation attenuates thigh skeletal muscles atrophy but not trunk muscles after spinal cord injury. J Electromyogr Kinesiol 2013;23(4):977–84. doi: 10.1016/j.jelekin.2013.04.007 [DOI] [PubMed] [Google Scholar]
- 26.Gorgey AS, Gater DR. Regional and relative adiposity patterns in relation to carbohydrate and lipid metabolism in men with spinal cord injury. Appl Physiol Nutr Metab 2011;36(1):107–14. doi: 10.1139/H10-091 [DOI] [PubMed] [Google Scholar]
- 27.Gorgey AS, Caudill C, Sistrun S, Khalil RE, Gill R, Castillo T, et al. Frequency of dietary recalls, nutritional assessment, and body composition assessment in men with chronic spinal cord injury. Arch Phys Med Rehabil 2015;96(9):1646–53. doi: 10.1016/j.apmr.2015.05.013 [DOI] [PubMed] [Google Scholar]
- 28.Bauman WA, Biering-Sørensen F, Krassioukov A. International spinal cord injury endocrine and metabolic basic data set (version 1.2). Spinal Cord 2012;50(7):567. doi: 10.1038/sc.2012.37 [DOI] [PubMed] [Google Scholar]
- 29.Evans N, Wingo B, Sasso E, Hicks A, Gorgey AS, Harness E. Exercise recommendations and considerations for persons with spinal cord injury. Arch Phys Med Rehabil 2015;96(9):1749–50. doi: 10.1016/j.apmr.2015.02.005 [DOI] [PubMed] [Google Scholar]
- 30.Fornusek C, Davis GM, Russold MF. Pilot study of the effect of low-cadence functional electrical stimulation cycling after spinal cord injury on thigh girth and strength. Arch Phys Med Rehabil 2013;94(5):990–3. doi: 10.1016/j.apmr.2012.10.010 [DOI] [PubMed] [Google Scholar]
- 31.Bauman WA, La Fountaine MF, Cirnigliaro CM, Kirshblum SC, Spungen AM. Lean tissue mass and energy expenditure are retained in hypogonadal men with spinal cord injury after discontinuation of testosterone replacement therapy. J Spinal Cord Med 2015;38(1):38–47. doi: 10.1179/2045772314Y.0000000206 [DOI] [PMC free article] [PubMed] [Google Scholar]
- 32.Gorgey AS, Mather KJ, Gater DR. Central adiposity associations to carbohydrate and lipid metabolism in individuals with complete motor spinal cord injury. Metabolism 2011;60(6):843–51. doi: 10.1016/j.metabol.2010.08.002 [DOI] [PubMed] [Google Scholar]
- 33.Gorgey AS, Harnish CR, Daniels JA, Dolbow DR, Keeley A, Moore J, et al. A report of anticipated benefits of functional electrical stimulation after spinal cord injury. J Spinal Cord Med 2012;35(2):107–12. doi: 10.1179/204577212X13309481546619 [DOI] [PMC free article] [PubMed] [Google Scholar]
- 34.Nash MS, Jacobs PL, Mendez AJ, Goldberg RB. Circuit resistance training improves the atherogenic lipid profiles of persons with chronic paraplegia. J Spinal Cord Med 2001;24(1):2–9. [DOI] [PubMed] [Google Scholar]
- 35.Libin A, Tinsley EA, Nash MS, Mendez AJ, Burns P, Elrod M, et al. Cardiometabolic risk clustering in spinal cord injury: results of exploratory factor analysis. Top Spinal Cord Inj Rehabil 2013;19(3):183–94. doi: 10.1310/sci1903-183 [DOI] [PMC free article] [PubMed] [Google Scholar]
- 36.Edwards LA, Bugaresti JM, Buchholz AC. Visceral adipose tissue and the ratio of visceral to subcutaneous adipose tissue are greater in adults with than in those without spinal cord injury, despite matching waist circumferences. Am J Clin Nutr 2008;87(3):600–7. [DOI] [PubMed] [Google Scholar]
- 37.Emmons RR, Garber CE, Cirnigliaro CM, Moyer JM, Kirshblum SC, Galea MD, et al The influence of visceral fat on the postprandial lipemic response in men with paraplegia. J Am Coll Nutr 2010;29(5):476–81. doi: 10.1080/07315724.2010.10719884 [DOI] [PubMed] [Google Scholar]