Significance
This paper introduces the concept of skin-associated lifestyle chemistries found on personal belongings as a form of trace evidence. We propose a mass spectrometry-based approach to illuminate chemical traces recovered from personal objects. Using a chemical composite recovered from a swab of a phone, as a representative personal belonging, we can provide insights into personal lifestyle profile by predicting the kind of beauty product the individual uses, the food he/she eats, the medications he/she takes, or the places he/she has been. Therefore, the chemical interpretation of traces recovered from objects found on a crime scene can help a criminal investigator to learn about the lifestyle of the individual who used or touched these objects.
Keywords: skin, phones, lifestyle chemistries, trace evidence
Abstract
Imagine a scenario where personal belongings such as pens, keys, phones, or handbags are found at an investigative site. It is often valuable to the investigative team that is trying to trace back the belongings to an individual to understand their personal habits, even when DNA evidence is also available. Here, we develop an approach to translate chemistries recovered from personal objects such as phones into a lifestyle sketch of the owner, using mass spectrometry and informatics approaches. Our results show that phones’ chemistries reflect a personalized lifestyle profile. The collective repertoire of molecules found on these objects provides a sketch of the lifestyle of an individual by highlighting the type of hygiene/beauty products the person uses, diet, medical status, and even the location where this person may have been. These findings introduce an additional form of trace evidence from skin-associated lifestyle chemicals found on personal belongings. Such information could help a criminal investigator narrowing down the owner of an object found at a crime scene, such as a suspect or missing person.
Trace evidence analysis plays a major role in forensic science because it reveals connections between people, objects, and places (1, 2). At a crime scene, traces collected from hairs, clothes or carpets fibers, soil, and pieces of glass (3–6) can shed light on events of the crime, and provide information about who was present before and after an unlawful act. Traditionally, both DNA and fingerprints at crime scene are used to identify a suspect with a high degree of certainty. However, both analyses have limitations. DNA analysis is limited because in many cases samples have degraded, contain insufficient amounts of DNA, are samples from which DNA cannot be obtained easily, or are contaminated (3), leading to difficulties in recovering the genomic profile of the suspect (7). Fingerprints collected at a crime scene have proven to be a very powerful approach but have limitations because they can be insufficient for matching to a specific individual if it is only a partial print (8) or overlap with other interfering fingerprints (9), and many materials, such as many fabric types and rough surfaces, are unsuitable for fingerprint analysis. Objects touched by subjects often provide only finger smears without visible fingerprints, rendering fingerprint matching to individuals useless. However, even if good fingerprints or high-quality DNA can be obtained, the person may simply not be in the database against which fingerprints and/or DNA is searched. Consequently, complementary approaches for matching samples either to individuals or to profiles that aid in identification would help an investigative team locate individuals from trace evidence commonly recovered at crime scenes.
In a scenario where personal belongings such as pens, keys, phones, handbags, or other personal objects are found at a crime scene, the chemical interpretation of skin traces recovered from these objects can help understand the individuals’ personal routine. This can be accomplished by revealing information regarding habits, lifestyle, and disease status associated with certain types of medication, thus narrowing the pool of individuals to whom an object may have belonged.
Recent work demonstrates that the external environment influences the chemical composition of the outermost layer of the skin. Our daily routines leave chemicals on skin surface originating from our surroundings and the human habitats to which we are exposed (10–12). Skin-associated chemicals also arise from personal habits including diet, exercise, clothes, medications, and personal care products. Together, these sources represent the vast majority of identifiable chemical entities on the human skin surface (13). Although no approach has been developed yet to capture such lifestyle-derived skin-associated chemicals from objects, the detection of molecular traces from the skin has been used in the past and involves very sensitive techniques. Due to its superb sensitivity (14), mass spectrometry (MS) is a powerful tool widely used for forensic applications (15) by providing either molecular (16–19) or elemental analysis (20–22). Specific sets of known molecules are usually targeted in forensics applications, for example, to identify traces of illicit drugs or explosives (23–26). However, individually targeting molecules for detection is not sufficient to describe the lifestyle of a given person, whereas a complete chemical signature obtained through the chemical analysis of a swab of the personal object might reveal personal habits and enable investigators to develop a composite sketch of a person’s lifestyle.
To test how much we can learn about personal lifestyles through the analysis of chemical traces recovered from personal belongings, we decided to use mobile phones. Phones offer a broad range of uses, in addition to staying in touch with loved ones, games, or connecting to the world through the Internet. They offer self-monitoring applications, including personal health tracking (27–32), environmental exposures (33, 34), and weather monitoring, and therefore we spend a lot of time on our phones. New applications increase the amount of time we spend on our phones (in part because this is an explicit goal of many application developers). Because of their utility, phones are handled frequently and provide ample opportunity to transfer skin molecules by contact.
In this proof-of-principle study, we aimed to (i) take an inventory of the chemistries recovered from phones of individuals and (ii) evaluate the relationships between chemistries that can be found on phones and skin of the owners. The goal of this work is not to identify the person based on the metabolomic signatures. Rather, it aims to determine how much we can learn about the personal lifestyle of the individuals based on skin-associated chemistries detected on their personal objects. We applied untargeted MS-based methods, combined with computational approaches, to take a broad look at the chemicals on hands and phones of 39 individuals. We show that the chemistries detected on phones and hands are distinct and reflect a personalized lifestyle profile that is even detected after 4 mo, and that phones’ molecular patterns match skin molecules detected on the hands of individuals. Lifestyle chemistries originating from hygiene products, beauty products, medications, and diet are detected on phones of individuals, and these traces provide information regarding personal habits and can construct a profile of individual lifestyle. Finally, spatial mapping of lifestyle chemicals on hands and phones correlate the abundance of chemicals detected on different parts of phones with those found on hands. Our results highlight the potential of molecular signatures from personal objects in assisting forensic analysis by providing insights into the personal habits of an individual.
Chemical Patterns Among Phones and Hands of Individuals
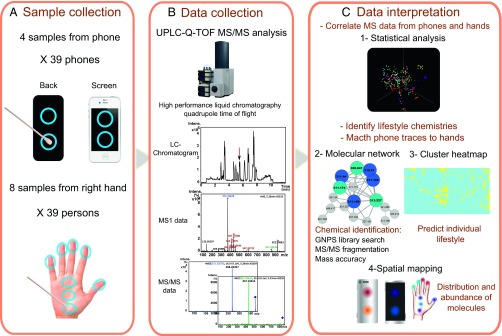
Before we characterized specific molecules that illuminate the lifestyle of individuals, we first compared the chemical signatures of samples from each individual to test whether the chemical patterns recovered from phones match the molecules found on hands of the owners. We also evaluated how time affects such global comparisons. We collected eight samples from each right hand (three samples from the palm and one sample from each finger) and four samples from each phone (two from the screen and two from the back) (Fig. 1A). Additionally, we chemically monitored phones and hands of 10 individuals 4 months after the first sample collection to determine long-term reproducibility and signature stability. A total of 588 metabolomic samples were analyzed using a previously validated ultra-performance liquid chromatography/quadrupole time-of-flight (UPLC-Q-TOF) tandem-mass spectrometry (MS/MS) workflow (13), to detect metabolites present on hands and items (Fig. 1B).
Fig. 1.
Representation of the three-step study workflow. The workflow includes (A) sample collection of four samples from their personal phones and eight samples from each individual’s right hand. (B) The samples are then analyzed using LC-MS/MS to characterize the chemical composition of hands and phones. (C) Data interpretation involves a statistical pipeline to compare and correlate phone and hand samples. Integrative computational methods were used for chemical characterization of hand and phone molecules, spatial mapping to display the localization of molecules, and hierarchical clustering to provide lifestyle information.
We compared the molecular profiles collected from phones and hands of 39 individuals and 10 individuals 4 months later (Fig. 1C). We show that phone and hand samples, separately (Fig. 2 A and B) or combined together (Fig. 2C), from different sites (phone, back and front; hand, palm and fingers) within the same individual are significantly different (P < 0.001) from the samples of the corresponding sites from other individuals, suggesting that phone chemistries are more similar to the hand of the owner than to hands of other individuals.
Fig. 2.
Comparison of molecular profiles between phones and hands of individuals. Bray–Curtis distances over all metabolites were measured from collected LC-MS data to compare (A) phone samples, (B) hand samples separately, and (C) phone and hand samples combined, within the same individual (blue) and between different individuals (red). P values were calculated using 1,000 random permutations.
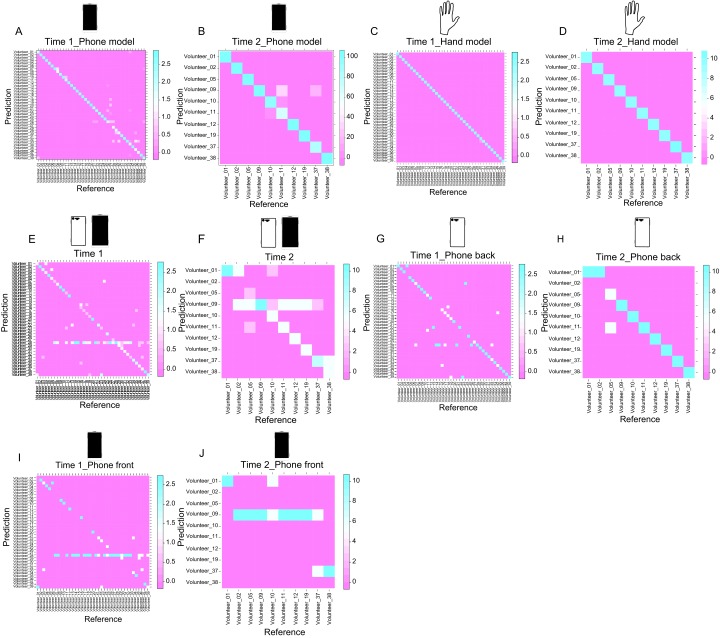
We also observed that phone chemicals collected from 39 individuals (Fig. S1A) and from 10 individuals 4 months later (Fig. S1B) are distinct [time 1: 33-fold better than random guessing (Fig. S1A); time 2: 9.4-fold of the accuracy of random guessing (Fig. S1B); each individual has the same number of samples; thus, the probability of guessing correctly is 1/39]. Similarly, hand metabolomic signatures discriminate each person with accuracies 38.5- and 10-fold of baseline for the first time point and the second time point, respectively (Fig. S1 C and D). These findings suggest that the chemical signatures from hands might reflect a personalized lifestyle that can be transferred to phones.
Fig. S1.
Chemical uniqueness and relationship between phone and hand samples. Random forest classifier was used to predict the chemical uniqueness of (A) phone samples collected from 39 persons on time 1 and (B) phone samples collected 4 mo later (time 2) from 10 individuals. Random forest models were also constructed to predict (C) hands collected on time 1 and (D) time 2. Models generated from hand samples (C) time 1 and (D) time 2 were used to predict, either phone samples together collected on (E) time 1 and (F) time 2, respectively, then distinctly from (G and H) the back of phones and (I and J) the front of phones. Random forest prediction accuracies are as follows: (A) 88%, (B) 94%, (C) 99%, (D) 100%, (E) 51%, (F) 55%, (G) 69%, (H) 85%, (I) 33%, and (J) 25%. Color scale represents the percentage of samples, and the accuracy is calculated as the percentage of all samples that are correctly classified to each individual. The diagonal line represents perfect prediction.
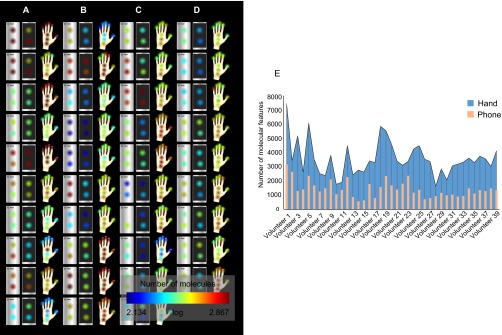
Therefore, we tested whether molecular patterns detected on phones match the chemistries of the corresponding hands. Although phones likely represent a longer-term accumulation of lifestyle chemistries than hands, chemicals recovered from phones (front and back) still match the hands of owners significantly (Fig. 2C and Fig. S1 E and F). Matching hands to samples from the back of the phone appears to be much more accurate [time 1: 69% (Fig. S1G); time 2: 85% (Fig. S1H)] than matching samples from the front of phones [time 1: 33% (Fig. S1I); time 2: 25% (Fig. S1J)], suggesting that molecules from hands transfer better to the back of phones. A significantly higher number of chemicals were detected on the back of phones than on the front (P < 0.0005) (Fig. S2 A–D).
Fig. S2.
Representation of the number of chemical features detected on phones and hands of 39 individuals. (A–D) Number of chemical features in each sample was calculated from LC-MS data using the OpenMS pipeline for features extraction (Dataset S4), and then mapped using 2D models of phone and hand to represent the number of features detected at each site using a color scale (red, highest number of features; blue, lowest number of features). A significantly higher number of chemicals were detected on the back of phones than on the front (P < 0.0005, based on 10,000 random permutations of the number of metabolites per sample). (A) Individuals 1–10, (B) individuals 11–20, (C) individuals 21–30, and (D) individuals 31–39. E represents a correlation graph between the number of features detected on hands and those detected on phones. The number of molecular features detected at each collection site were summed for each hand and phone of every individual.
The correlation between the number of molecules detected on hands and those recovered from phones shows that the transferability and recovery of hand chemistries on phones differs among individuals (Fig. S2E). Factors that could influence transferability include the contact and cleaning frequencies. The composition of the material of the surface in contact with the hands (front, glass, vs. back, plastic) may also affect the results. Mainly, as reported for bacterial communities while this manuscript was being prepared (35), chemicals recovered from the back of phones could come mostly from our hands, whereas those on the front of the phone from the face.
Although further studies are needed to determine the transferability of hands molecules on different surfaces such as plastic, wood, and glass, our results demonstrate that the chemical signatures detected on phones match the chemicals detected from the hand of the owner. Therefore, it may be possible to develop a lifestyle sketch of the person who has touched the objects based on the skin-associated molecules that are detected on phones. Specific chemistries may narrow a list of possibilities in an investigation by revealing the medications that an individual is taking, the food they eat, the clothes they wear, and personal care products they use.
Molecular Networking to Characterize Matched Chemicals Between Phones and Hands of Individuals
Because the results above show that the chemical signatures from phones match the chemistry found on the hands of individuals, we hypothesized that chemical traces of personal belongings can provide sufficient information to gain insights into the lifestyle of an individual such as diet, medical condition, and personal hygiene or personal care, such as the use of specific deodorants, lotions, or shampoo.
We recently demonstrated that molecular networking can be successfully used to organize large-scale MS dataset collected from the human skin surface (13). Molecular networking suggested that we could measure the medications, type of food, and personal care products each individual uses. Molecular networking is a MS visualization approach that matches MS/MS similarities and also uses the relationships between MS/MS spectra to dereplicate MS/MS signatures by matching them to reference MS/MS spectra of known chemicals (36–38). Briefly, molecular networking first uses MScluster algorithm (39) to merge all identical spectra, followed by spectral alignment to compare pairs of related MS/MS spectra via cosine similarity scoring to generate familial groupings, where 1 indicates a perfect match. We recently developed the infrastructure to perform these tasks via a web interface at gnps.ucsd.edu/ProteoSAFe/static/gnps-splash.jsp (40). The resulting network is then exported and visualized in Cytoscape software (41, 42) with nodes connected by edges where each node corresponds to a consensus MS/MS spectra.
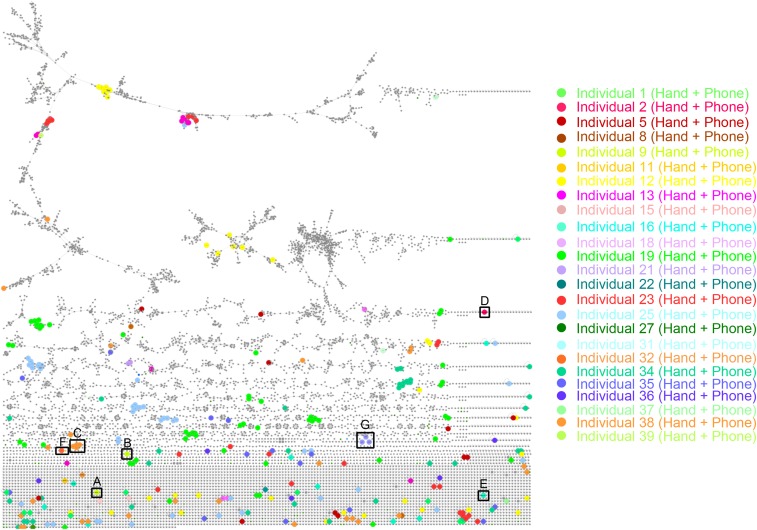
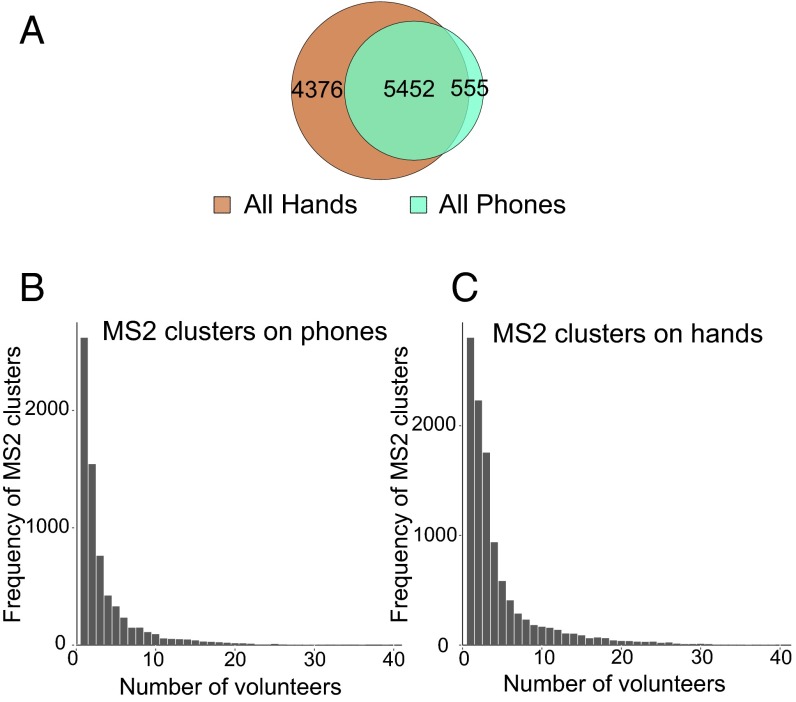
Based on this potential, we used molecular networking to match specific skin-associated traces found on a phone to the hand of the corresponding individual (Fig. 1C). A molecular network was generated from hands and phones of 39 individuals and resulted in 10,383 nodes, where each node represents consensus of at least three identical MS/MS spectra (Fig. S3; gnps.ucsd.edu/ProteoSAFe/status.jsp?task=eea01f9ec9ea44bc80d76de30da67be4, ftp://massive.ucsd.edu/MSV000078993). Based on MS/MS similarities, we first evaluated the number of chemicals shared between hands and phones of individuals. Fifty-three percent of the spectra were shared between hands and phones of all volunteers, highlighting that many skin-associated molecules are found on personal objects (Fig. 3A). Forty-two percent of the nodes were found only on hands, and 5% of nodes are found only on phones.
Fig. S3.
Molecular network to highlight unique chemicals from hand and phone of each person. Molecular network was generated from LC-MS/MS data collected from hands and phones of 39 individuals, using a cosine threshold of 0.65. Networking parameters included the following: precursor m/z tolerance of 1 Da, fragment mass tolerance of 0.5 Da, minimum matched fragments ions 4 (see details in Materials and Methods, Molecular Networking). The network was exported and displayed in Cytoscape and resulted in a total of 10,383 nodes, representing consensus of at least three MS/MS spectra. A color and size (bigger size) coding was used in Cytoscape to highlight the unique nodes that match between a hand and a phone of a same person. Every color is specific to each person represented in this network. Note that only matched MS/MS spectra between hands and phones were represented in this figure; nodes that are specific to hands or phones only were also present, as well as shared nodes between several persons. The molecular network is accessible here: gnps.ucsd.edu/ProteoSAFe/status.jsp?task=eea01f9ec9ea44bc80d76de30da67be4, ftp://massive.ucsd.edu/MSV000078993). A–G represent subnetworks that were enlarged and highlighted in Fig. 4.
Fig. 3.
Representation of number of chemical features detected on phones and hands of 39 individuals. A–C were generated from LC-MS/MS clusters provided by the molecular network represented in Fig. S3, gnps.ucsd.edu/ProteoSAFe/status.jsp?task=eea01f9ec9ea44bc80d76de30da67be4, ftp://massive.ucsd.edu/MSV000078993. (A) Venn diagram representing the number of shared nodes (5,452 out of 10,383; ∼53%) between all hands (brown) and phones (blue), and unique hand (4,376 out of 10,383; ∼42%) and phone nodes (555 out of 10,383; ∼5%). The frequency of molecules found on (B) phones and (C) hands was calculated by counting in how many volunteers each MS/MS cluster from the network was detected (Fig. S3; gnps.ucsd.edu/ProteoSAFe/status.jsp?task=eea01f9ec9ea44bc80d76de30da67be4).
Using the parent ion masses, we evaluated the frequency of ions detected from molecules associated with the phone and hand of each individual. Our results show that, for both phones (Fig. 3B) and hands (Fig. 3C), many chemicals are found only in one or few of the volunteers. Only a few ion signatures are shared among all individuals, suggesting that specific chemistries link the phone and hand of each person.
To gain insights into the lifestyle of each person, we used a color coding in Cytoscape (41) (42) to differentiate nodes that belong to a specific group, leading to further characterization of individual-specific ion signatures (Fig. S3). We annotated molecules with Global Natural Products Social Molecular Networking (GNPS) libraries (gnps.ucsd.edu/ProteoSAFe/static/gnps-splash.jsp) using accurate parent mass and MS/MS fragmentation patterns (gnps.ucsd.edu/ProteoSAFe/result.jsp?task=0671dd76c8334d528f5b4b5ac243e045&view=group_by_compound). Such annotations are in agreement with the level 2 of annotation defined by the 2007 metabolomics standards initiative (43). The annotated compounds lists were then correlated to the information provided by volunteers for this study, regarding the food they consume and the hygiene products and medications they were using.
Unique Chemicals Detected on Both Phones and Hands.
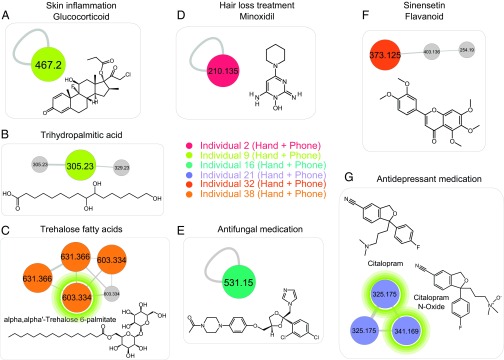
The molecular network highlights the presence of unique chemicals that are specific to each person (Fig. S3). Through annotations, molecular networking reveals a large variety of lifestyle traces of molecules on phones that are also found on hands of individuals (Dataset S1). On the basis of annotated hand-associated chemistries found on phones, we can gain insights into the lifestyle of the individual to whom the phone belonged by matching the annotated molecules to the type of hygiene/beauty products, pesticides/insecticides, plasticizer exposures, diet, and medications (Dataset S1). Some representative examples of unique lifestyle chemicals detected on hand and phone of a specific individual are shown in Fig. 4.
Fig. 4.
Molecular networking to characterize and match lifestyle chemistries from hands and phones of individuals. The full network is shown in Fig. S3 for dataset ftp://massive.ucsd.edu/MSV000078993 and ftp://massive.ucsd.edu/MSV000078832. Each node, representing a minimum of three identical MS/MS spectra, corresponds to a consensus MS/MS spectra. An edge represents the similarity between MS/MS spectra. The network nodes were annotated with colors. Each color represents unique molecular features matched between hand and phone of the same individual. Single nodes represent very unique features found in hand and phone of an individual that do not display structural similarities with any other molecule in the network. Representative lifestyle molecular annotations include molecules from hygiene/beauty products, diet, and medicines such as the following: (A) skin inflammation treatment clobetasol propionate, (B) trihydropalmitic acid, (C) trehalose fatty acids, (D) hair loss treatment minoxidil, (E) antifungal medication ketoconazole, (F) sinensetin flavonoid found in citrus, and (G) antidepressant medication (citalopram) and its metabolite (citalopram N-oxide). Green circles highlight compounds that are associated with the chemical structures shown in the figure.
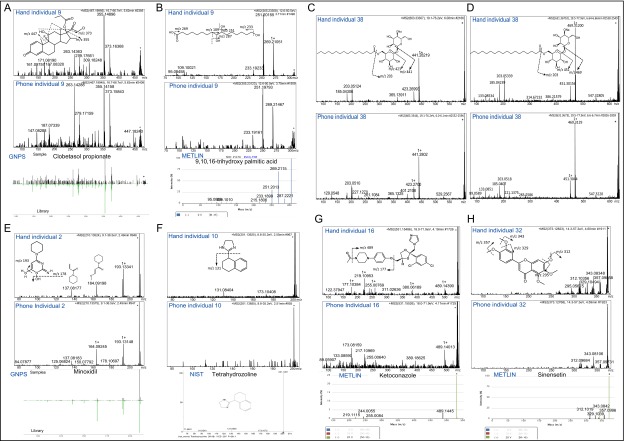
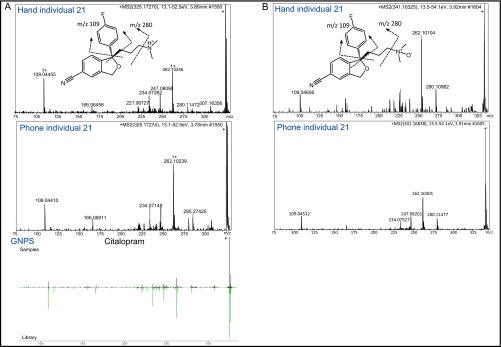
We were able to detect a skin inflammation medication (clobetasol propionate) on both the hand and phone of volunteer 9, as well as a lipid, trihydroxy palmitic acid, used to produce soap and cosmetics (44) (Fig. 4 A and B, and Fig. S4 A and B). A molecular family of the trehalose fatty acids, usually used as pigment dispersant allowing pigments to be blended in various high-end cosmetics (α,α′-trehalose 6-palmitate [M+Na]+ m/z 603.334 and its analog [M+Na]+ m/z 631.366) (45), was found in samples from individual 38 (Fig. 4C and Fig. S4 C and D). A hair regrowth treatment, minoxidil, was used by person 2 (Fig. 4D and Fig. S4E); an active ingredient of eye drops, tetrahydrozoline, was used by individual 10 (Fig. S4F); and an antifungal medication was exclusively detected on person 16 (Fig. 4E and Fig. S4G). Furthermore, molecules likely derived from diet and/or hygiene products were also detected. Among them are sinensetin-type molecules, frequently found in citrus fruits (46) and detected only on the hand and phone of person 32, who is a large consumer of oranges and uses a lot of citrus-based cleaning products (Fig. 4F and Fig. S4H). Oral medications such as an antidepressant citalopram (consumed 20 mg/d) was also detected on the hand and phone of volunteer 21 (Fig. 4G and Fig. S5A). As highlighted by the specific molecular cluster in Fig. 3G, not only was the drug detected in volunteer 21’s samples but also its oxidized metabolite citalopram N-oxide ([M+H]+ m/z 341.169), displaying a mass shift of 15.994 Da and a similar MS/MS fragmentation pattern compared with the drug itself (Fig. 3G and Fig. S5B). Consistent with previous findings, consumed drugs that are detected on hands might originate from sweat secreted on the skin (47, 48) or can be transferred upon contact (25, 49).
Fig. S4.
ESI-Q-TOF MS/MS fragmentation of clobetasol propionate, trihydroxy palmitic acid, trehalose fatty acids, minoxidil, tetrahydrozoline, ketoconazole, and sinensetin. (A) Database match to clobetasol propionate based on GNPS database. ESI-Q-TOF MS/MS of m/z 467.199, retention time (RT) of 5.6 min in hand (Upper) and phone (Middle) and from GNPS database (Lower) of individual 9. Major fragment of 373.16 ion results from the consecutive loss of hydroxyl and chloroacetyl groups, whereas 355.15 fragment results from the loss of fluorine, hydroxyl, and chloroacetyl groups together; similarly, fragments of 375.15 and 357.14 ions resulted from the loss of hydroxyl, propionate groups and fluorine, hydroxyl, and propionate, respectively. Identification is based on MS/MS fragmentation, GNPS database interrogation, and volunteer’s lifestyle. (B) ESI-Q-TOF MS/MS of m/z 305.233, RT of 3.7 min in hand and phone of individual 9, and from METLIN database. Dominant fragment ions m/z 269, m/z 251, and m/z 233 result from the loss of hydroxyl groups. Identification is based on MS/MS fragmentation and METLIN database interrogation. ESI-Q-TOF MS/MS fragmentation of (C) α,α′-trehalose 6-palmitate [M+Na]+ m/z 603.333, RT of 6.0 min and (D) its analog [M+Na]+ m/z 631.367, RT of 6.6 min (delta m/z of 28.034 corresponding to a C2H4) in hand (Upper) and phone (Lower) of volunteer 38. A loss of m/z 162 characteristic of a single sugar moiety was observed in the fragmentation pattern. This induces the release of the fatty acid chain linked to another sugar moiety (m/z 441.282 for C and m/z 469.312 for D). Database match to α,α′-trehalose 6-palmitate (molecule used as pigment dispersant in cosmetics) based on METLIN database. Identification is based on MS/MS fragmentation, METLIN database interrogation, and the lifestyle of volunteer 38, who is a female who uses makeup. ESI-Q-TOF MS/MS fragmentation of (E) minoxidil (hair regrowth treatment) m/z 210.135, RT of 2.5 min in hand (Upper), phone (Middle) of volunteer 2 and in GNPS library (Lower). The cleavage of the primary amine group yields to the dominant fragment ion m/z 193, and the loss of hydroxyl group releases the fragment ion m/z 178. m/z 164.08 fragment resulted from the cleavage of a pyrimidine ring with a consecutive loss of amine and n-oxide groups. (F) Database match to tetrahydrozoline (active ingredient of eye drop) from NIST database. Shown is ESI-Q-TOF MS/MS fragmentation of m/z 201.139, RT of 2.5 min in hand (Upper), phone (Middle) of volunteer 10 and from NIST database (Lower). The loss of imidazole group yield to the fragment ion with m/z 131. Identifications are based on MS/MS fragmentation, GNPS and NIST databases, and validation of using a hair regrowth treatment by volunteer 2 and eye drop by volunteer 10. ESI-Q-TOF MS/MS fragmentation of (G) ketoconazole (antifungal medication) m/z 531.154, RT of 4.2 min in hand (Upper), phone (Middle) of individual 16, and in METLIN database (Lower). Fragment ion with m/z 489.143 results from the loss of acetyl group, and then the cleavage in the ether group releases fragment ion with m/z 177. (H) METLIN database match to Sinensetin (found in citrus). Shown is ESI-Q-TOF MS/MS fragmentation of m/z 373.128, RT of 4.6 min in hand (Upper), phone (Middle) of volunteer 32, and from METLIN database (Lower). Dominant fragmentation products with m/z 357, m/z 343, and m/z 312 correspond to the cleavage of methyl groups, and the further loss of hydroxyl groups yield to fragmentation products m/z 329 and m/z 295. Identification is based on MS/MS fragmentation, METLIN database, and based on the validation of using ketoconazole medication by volunteer 16 and the lifestyle of individual 32, who is a huge consumer of oranges.
Fig. S5.
ESI Q-TOF MS/MS fragmentation of citalopram and its metabolite citalopram N-oxide. (A) ESI-Q-TOF MS/MS fragmentation of (A) citalopram (antidepressant medication) m/z 325.172, RT of 3.8 min in hand (Upper) and phone (Middle) of volunteer 21, and from GNPS database (Lower) and (B) its metabolite citalopram N-oxide m/z 341.163, RT of 3.9 min (delta m/z of 15.990 corresponding to an oxidation) in hand (Upper) and phone (Middle) of volunteer 21. The cleavage between the tertiary amine group results in the m/z 280.109 fragment ion. Fragment ion with m/z 109.044 is a characteristic fragment of the fluorobenzene group, observed in the fragmentation spectra of both (A) citalopram and (B) citalopram N-oxide. Identification is based on MS/MS fragmentation, GNPS database match, and the confirmation of using citalopram oral medication by volunteer 21.
Chemicals Shared Across Phones and Hands of Individuals.
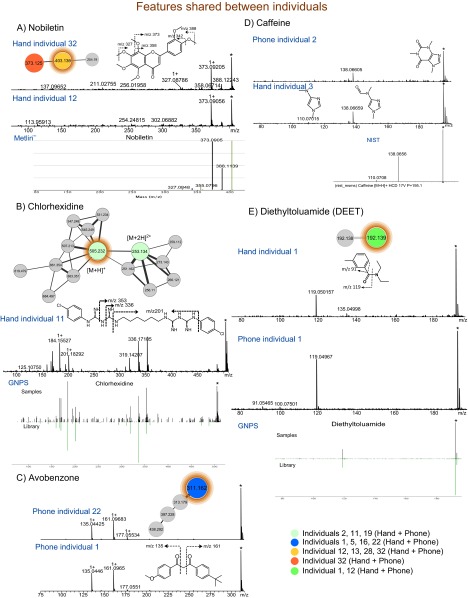
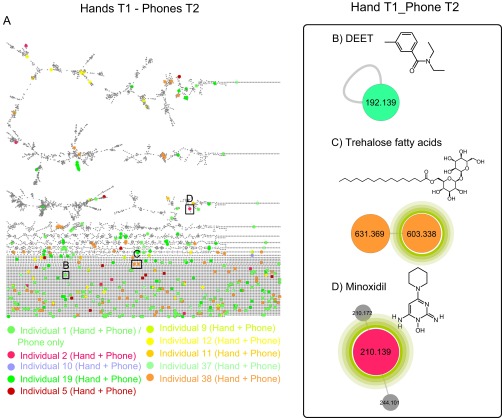
Some chemicals detected on phones and hands were shared among several individuals including nobiletin, found in citrus peel (50) (Fig. S6A and Dataset S1); chlorhexidine, an antiseptic used in cosmetics (51) (Fig. S6B and Dataset S1); the sunscreen ingredients avobenzone and octocrylene (13) (Fig. S6C and Dataset S1); caffeine that was consumed daily and most likely originates from secreted sweat on hands (52, 53) (Fig. S6D and Dataset S1); aspartame (Dataset S1); and diethyltoluamide (DEET) (Fig. S6E and Dataset S1) that was detected months after its original application by two volunteers. Remarkably, the data show that lifestyle signatures can be revealed months after the event that generated the signature. DEET, the active ingredient of antimosquito sprays and lotions (54), was found on individuals 1 and 12 (Fig. S6E and Dataset S1). DEET was observed 4 months later on individual 1, nearly 5 months after the original application. The antimosquito lotion had not been applied by this person during this period yet continues to be readily recovered from his/her phone (Fig. S7 A and B). On the other hand, the trehalose fatty acids cluster and minoxidil that were continuously used by volunteers 2 and 38, respectively, were also stably detected after 4 months (time 2), reflecting the same lifestyle over time for these individuals (Fig. S7 A, C, and D).
Fig. S6.
Representation of lifestyle chemicals detected on hands and phones of several individuals. Subnetworks were highlighted from the molecular network in Fig. S3 (gnps.ucsd.edu/ProteoSAFe/status.jsp?task=eea01f9ec9ea44bc80d76de30da67be4, ftp://massive.ucsd.edu/MSV000078993), and the color coding was used to highlight the individuals where each lifestyle chemical was found. ESI-Q-TOF MS/MS fragmentation of (A) nobiletin m/z 403.136, RT of 4.8 min in hands of individuals 32 (Upper) and 12 (Middle), and from GNPS database. Dominant fragmentation products with m/z 388, m/z 373, and m/z 327 correspond to the loss of methyl groups, and the further loss of hydroxy groups yield to fragmentation products with m/z 358 and m/z 342. B shows ESI-Q-TOF MS/MS fragmentation of chlorhexidine m/z 505.232 RT of 4.0 min in hand of individual 11 (Upper) and from GNPS database (Lower). Major fragments with m/z 336 and 353 results from the loss of chlorophenyl with imidamide group and –NH and chlorophenyl with imidamide group, respectively. (C) MS/MS fragmentation of avobenzone m/z 311.162, RT of 7.3 min in phones of individuals 22 and 1 (13). (D) MS/MS fragmentation of caffeine m/z 195.088, RT of 2.3 min, in phone of individual 2 and hand of individual 3 and from NIST database. (E) ESI-Q-TOF MS/MS fragmentation of diethyltoluamide (DEET) m/z 192.139, RT of 4.3 min, which was applied more than 1 mo before the first sample collection, in hand (Upper) and phone (Middle) of individual 1 and from GNPS database (Lower). Identification of these chemicals was based on MS/MS fragmentation, GNPS, NIST, METLIN libraries, and validation based on lifestyle of individuals.
Fig. S7.
Molecular network to highlight lifestyle chemicals that last on phones. A represents the molecular network generated from LC-MS/MS of hand samples collected on time 1 (T1) and phone samples collected 4 mo later [time 2 (T2)] from 10 same individuals randomly selected among a total of 39. Network was generated using a cosine threshold of 0.65. Networking parameters included the following: precursor m/z tolerance of 1 Da, fragment mass tolerance of 0.5 Da, minimum matched fragments ions 4, and a minimum cluster size of 2, gnps.ucsd.edu/ProteoSAFe/status.jsp?task=60b0ae8123284d6980204c6650c400d5, ftp://massive.ucsd.edu/MSV000079825. A color coding is used to highlight molecular features that are found on phone of each individual 4 mo later and still match the original hand signature. Examples of these lifestyle chemicals are as follows: (B) DEET detected on phone of volunteer 1, (C) trehalose fatty acid molecular family that is still detected on individual 38, and (D) minoxidil that is still detected on individual 2 samples 4 mo later. Note: Minoxidil was also detected on phone of individual 37, 4 mo later as this person started to use minoxidil before time 2 sample collection and was not using it when samples were collected 4 mo earlier, gnps.ucsd.edu/ProteoSAFe/status.jsp?task=60b0ae8123284d6980204c6650c400d5. All of these chemicals were previously highlighted in Fig. 4 C and D, and Figs. S3 and S6E. They were detected on hands and phones of individuals at the first sample collection (DEET, volunteers 1 and 12; trehalose fatty acids, volunteer 38; and minoxidil, volunteer 2).
Unique Chemicals Detected Only on Hands.
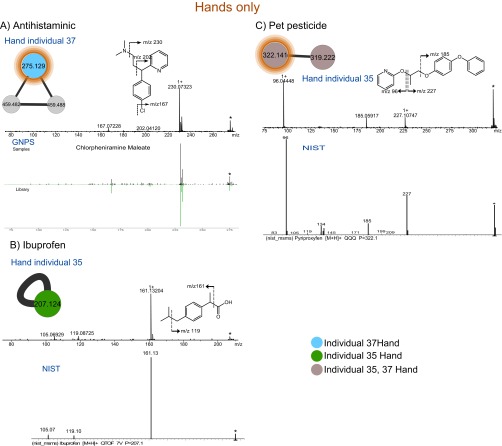
Molecules from diet were often individual specific. For example, piperine from black pepper (55) was only found on the hand of person 3 (Dataset S1), and capsaicin, the active ingredient in chili peppers (56), was detected only on the hand of person 28 (Dataset S1). Some molecules such as antihistamine that were taken as solution (Fig. S8A and Dataset S1), ibuprofen (Fig. S8B and Dataset S1), and pet pesticides (Fig. S8C and Dataset S1), used occasionally by volunteers, were found on hands of individuals but not on their phones. As highlighted above, the detection of molecules on the hands can result from sweat secreted by the skin (47, 48) or can be transferred upon contact (25, 49). The detection of chemicals on hands but not on phones indicates that not all lifestyle signatures from the hands are recovered on the phones, reinforcing that the overall profile is important to an investigator rather than the detection of individual molecules.
Fig. S8.
Molecular network to highlight lifestyle chemistries detected only on hands of individuals but not on their phones. ESI-Q-TOF MS/MS fragmentation of (A) antihistaminic (chlorpheniramine) m/z 275.129, RT of 3.1 min in hand (Upper) of volunteer 37 and from GNPS database (Lower). Dominant fragment ion (m/z 230) results from the loss of tertiary amine. B shows MS/MS fragmentation of Ibuprofen m/z 207.124, RT of 5.4 min in hand (Upper) of individual 35 and from NIST database (Lower). The release of the carboxylic group results in the dominant fragment ion (m/z 161). (C) MS/MS fragmentation of pet pesticide (pyriproxyfen) m/z 322.141, RT of 6.6 min from hand of individual 35, and from NIST database. The cleavage of the ether bond releases two dominant fragment ions m/z 227.107 and m/z 96.044. Subnetworks were highlighted from the molecular network in Fig. S3 (gnps.ucsd.edu/ProteoSAFe/status.jsp?task=60b0ae8123284d6980204c6650c400d5, ftp://massive.ucsd.edu/MSV000078993), and the color coding was used to highlight hands of individuals where each lifestyle chemical was found. Identification of these chemicals was based on MS/MS fragmentation, GNPS, NIST databases, and validation based on lifestyle of individuals.
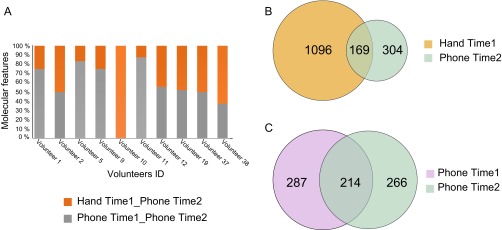
The combined molecular networks of the two time points from the 10 individuals reveal that the percentage of stable chemicals varies from person to person (Figs. S7 and S9A). Ten percent to 28% of detectable MS/MS spectra that originate from the hand (Fig. S9B) and phone (Fig. S9C), respectively, are stable over time and are still detected on phones after 4 months. This result suggests that, although personal lifestyle might change over time, for the same person many lifestyle traces recovered from phone can still match the original phone’s and hand’s chemistries after considerable time has elapsed.
Fig. S9.
Evaluation of chemicals that persist on phones 4 mo after the first sample collection. A–C were generated from the output of molecular network of LC-MS/MS data collected from hand, gnps.ucsd.edu/ProteoSAFe/status.jsp?task=ff2d50726af84006b2eec3fd983e63f2, or phone samples, gnps.ucsd.edu/ProteoSAFe/status.jsp?task=027732e55c344fa4bd940430c9e144fd, collected on time 1 and phone samples collected 4 mo later (time 2). A represents the percentage of stable chemicals, per individual, that still match the original hand (orange) or phone (gray) signature. Venn diagrams display the number of chemicals that (B) persist on phones (blue) and match the original hand signature (orange) (169 out of 1,569; ∼11%) and (C) the original phone signature (purple) (214 out of 767; ∼28%).
Predicting Lifestyle of Individuals Based on Phone Metabolomic Signatures
In addition to correctly and efficiently matching the molecular traces recovered from phones to the hands of the corresponding individuals, molecular networking helps gain insight into the individual’s lifestyle by identifying molecules detected on personal phones. For example, detecting sunscreen-derived molecules indicates that this person likely lives in a sunny area and spends time outside, caffeine indicates the person is a coffee consumer, nicotine indicates a smoker or at least someone who is exposed to smoke, medicines help establish the medical status of an individual, and detection of citrus-derived molecules observed on some individuals’ hands and phones indicate they may eat oranges or lemons. The combination of many such lifestyle routines defines a unique skin chemical signatures.
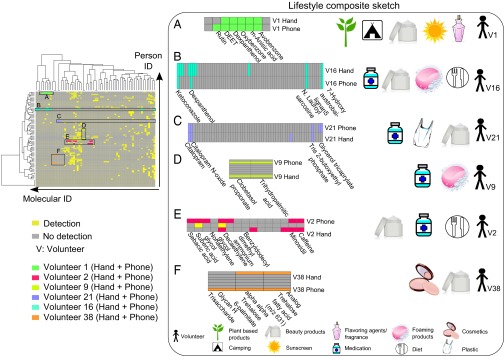
Because a combination of chemicals to predict lifestyle is more informative than a unique single molecule, we organized the annotated molecules (Dataset S1) using a hierarchically clustered heat map (Figs. 1C and 5, and Fig. S10A) based on presence/absence data regarding detection of annotated MS/MS spectra on the phones and hands of individuals. Therefore, hierarchical clustering reveals an overall view of an individual’s lifestyle that helps predict personal habits and routine (Fig. 5 and Fig. S10A). Although some annotated molecules are found on the phones and hands of multiple individuals, the heat map reveals specific signatures that reflect a personalized lifestyle. The origin of each molecule highlighted in the heat map was represented using a lifestyle-associated legend, allowing an easier interpretation of the molecules detected and how they relate to lifestyle (Fig. 5 and Dataset S1). As shown in Fig. 5, a chemical signature reflects several lifestyle characteristic features of a person. The personal habit, includes the kind of hygiene products a person uses, such as plant-based products, foaming products, or sunscreens; the kind of beauty products the individual uses, such as makeup and fragrance; and the type of food the person eats or drinks, such as spices or coffee. Skin-associated chemicals detected on phones also indicate where the person has been and their medical status. Below, we highlight representative examples that illustrate how an investigator might obtain insight into the lifestyle of the individual through analysis of the chemistries using untargeted metabolomics.
Fig. 5.
Hierarchical cluster heat map to predict lifestyle of individuals based on phone and hand chemical signatures. The heat map (left image) was generated using Jaccard dissimilarity method, from Dataset S1, which represents the detection/no detection of annotated chemicals on hands and phones. Hierarchical clustering of this table results in chemical clusters that provide information about the lifestyle of an individual. A high-resolution heat map is shown in Fig. S10. Each color is associated to an individual and represents a combination of lifestyle chemicals found on hands and phones of six volunteers: (A) volunteer 1, (B) volunteer 16, (C) volunteer 21, (D) volunteer 9, (E) volunteer 2, and (F) volunteer 38. The legend uses pictographs to represent the origin of every molecule from the lifestyle sketch associated with an individual.
Fig. S10.
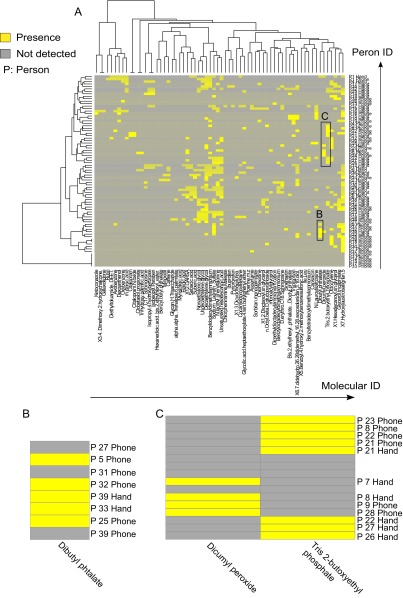
Hierarchical cluster heat map representing presence and absence of annotated molecules on hands and phones of 39 individuals. (A) The heat map was generated using Jaccard dissimilarity method, from Dataset S1, which represents the detection/no detection of identified chemicals on 39 hands and phones. Hierarchical clustering highlights combination of chemical lifestyles that can be used to provide information about the lifestyle of an individual. All putative molecular identifications from GNPS database are available here: gnps.ucsd.edu/ProteoSAFe/result.jsp?task=0671dd76c8334d528f5b4b5ac243e045&view=group_by_compound. B and C highlight chemicals detected on hands and phones reflecting exposure to plasticizers. B represents a plasticizer dibutyl phthalate detected on phones of individuals 5, 32, and 25, and on hands of individuals 39 and 33. C highlights the detection of dicumyl peroxide on hands of individuals 7 and 8, and phones of individuals 9 and 28; and the detection of tris(2-butoxyethyl) phosphate on phones of individuals 23, 8, 22, and 21, and on hands of individuals 21, 22, 27, and 26.
A group of chemicals detected on phone and matched to hand of individual 1 provides information regarding his/her lifestyle. Based on this signature (Fig. 5A), we can tell that this person uses plant-based products because rutin, a flavonoid glycoside found in many plants (57), was detected on his/her phone and hand (Dataset S1). This person likely lives in a sunny area and spends a lot of time outside (avobenzone and oxybenzone, two active ingredients of sunscreen). Volunteer 1 uses a skin moisturizer (dexpanthenol) (Dataset S1) (58), and flavoring products due to the detection of a flavoring agent (m-anisic acid), a molecule commonly added to fragrances (Dataset S1) (59). Furthermore, DEET (Fig. S6E) was detected and is associated with mosquito lotions, suggesting that the person is likely a camper or backpacker. We confirmed that this person, a female, spends time outside and indeed went camping and used DEET.
Volunteer 16, in addition to using an antifungal treatment, uses moisturizer due to the detection of dexpanthenol, often found in moisturizers (58) and personal care products that contain foaming agents (N-lauroyl sarcosine). This person eats herbs and spices, consistent with the detection of 7-hydroxyaustrobailignan (Fig. 5B and Dataset S1).
Similarly, the medical status of volunteer 21 can be established upon the detection of antidepressant drug and its metabolite. Additionally, this person uses skin care products such as facial or body creams, as a skin-conditioning agent [glycerol tricaprylate (60)] was detected (Fig. 5C and Dataset S1). A flame retardant [tris(2-butoxyethyl) phosphate] usually used in plasticizers (61) and textiles was also detected on individual 21 (Fig. 5C and Dataset S1). In addition of the antifungal medication (clobetasol propionate) used by person 9 (Fig. S4A), a lipid trihydroxy palmitic acid used to produce soap and cosmetics was also detected (Fig. 5D and Fig. S4B).
Volunteer 2, in addition to using a hair regrowth treatment (minoxidil), is a coffee or tea consumer (caffeine) (Fig. S6D) and is likely female based on the personal care product signatures. This individual uses a lot of cosmetic products, as we detect castor oil derivatives (sebacic and suberic acids) used as skin-conditioning and -moisturizing agents (62) and nonoxynols (webdictionary.personalcarecouncil.org/) often used in hair dyes and as wetting agents in cosmetics, including hair and skin care products (Fig. 5E and Dataset S1).
The detection of two pigment dispersants (trehalose fatty acids) (Fig. S4 C and D) (45) associated with individual 38 together with the detection of glycans (Dataset S1) that are usually incorporated in facial creams for their antiaging properties (63), likely indicate that this person is a female who uses makeup (Fig. 5F).
Each of these unique molecules mentioned above was confirmed by the volunteers and is in agreement with the lifestyle of each individual. According to the volunteers, none of the lifestyle molecules annotated was discordant with their own personal knowledge of their lifestyle. Currently, due to the absence of the correct databases, we do not have another option but to ask participants to study the effectiveness of the matches and how they correlate to their lifestyle. One can imagine, however, in the future to have a statistical approach and a confidence score for the type of lifestyle when appropriate databases become available that connect each molecule and associate such signatures with a lifestyle (e.g., beer drinker, jogger, hunter, diabetic, fruit eater, etc.).
Spatial Distribution of Lifestyle Chemistries on Phones and Hands of Individuals
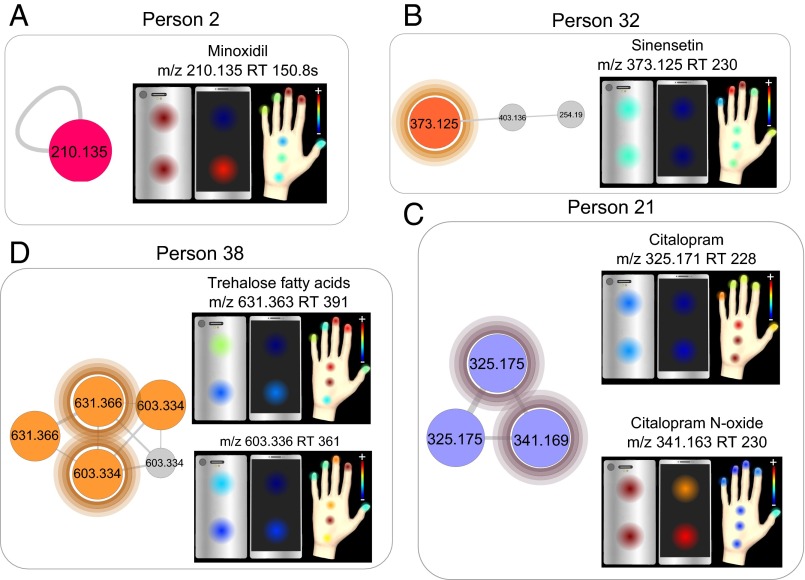
To evaluate whether different parts of phones and hands have similar molecular features, spatial molecular maps (13) were generated (Fig. 1C), therefore allowing the visualization of the distribution and the abundance of specific chemicals detected on phones and hands. Fig. 6 illustrates the spatial distribution of specific molecules detected on phones and hands of four individuals. The hair loss treatment minoxidil is highly abundant on the index and middle fingers of volunteer 2, which correlates with its high localization on the top back of the phone (Fig. 6A), probably due to the frequent contact of these two fingers with that part of the phone.
Fig. 6.
Spatial mapping of lifestyle chemicals detected on hands and phones of individuals. Two-dimensional spatial maps generated from LC-MS1 data display the localization and abundance of molecules of interest on hands and phones of four individuals. Figure highlights phone and hand localization of (A) the hair loss treatment molecule minoxidil (m/z 210.135; RT, 150.8 s) on person 2, (B) sinensetin (m/z 373.125; RT, 230 s) on person 32, (C) antidepressant citalopram (m/z 325.171; RT, 228) and its metabolite citalopram N-oxide (m/z 341.163; RT 230) on person 21, and (D) trehalose fatty acids (m/z 631.363; RT 391) and its analog (m/z 603.336; RT 361) on person 38. Color scale is associated to the relative abundance of features, with red corresponding to the highest relative abundance; this is indicated as a plus (+), and the minus (−) is the lowest abundance.
For individual 32, the citrus-associated molecule annotated as sinensetin is mainly present on middle and ring fingers with correlation to a high abundance on the back of the phone (Fig. 6B). The drug citalopram, used by volunteer 21, is mostly present in the bottom palm of the hand and little finger and more abundant on hand rather than on the phone (Fig. 6C), whereas the oxidized metabolite of citalopram is mostly present on the phone (Fig. 6C). The distribution of α,α′-trehalose 6-palmitate (m/z 603.334, [M+Na]+) from the trehalose fatty acids molecular family displays a very similar spatial distribution to that of its analog (m/z 631.336, [M+Na]+) (Fig. 5D), revealing that these two molecules originate most likely from the same beauty product (Fig. 6D).
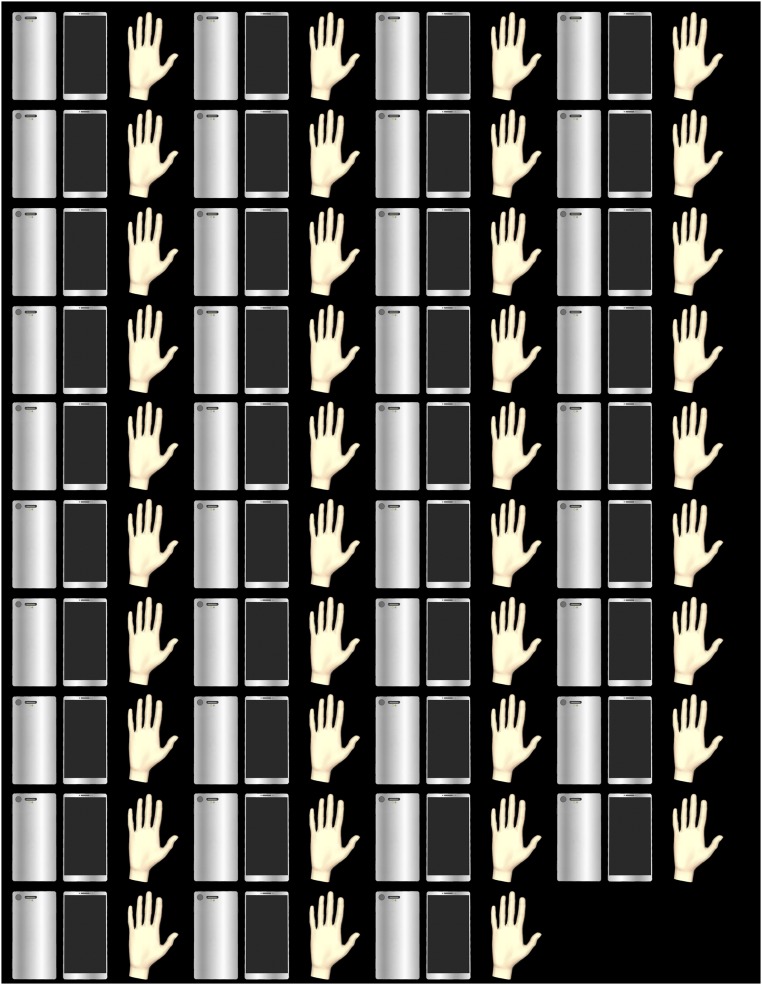
The use of spatial mapping thus allows visual comparison of molecular distributions on phones and hands, by displaying the localization and abundance of molecules of interest and correlating that with personal habits. Additionally, like molecular networking, spatial mapping can also be used to match chemical features detected on phones to hands of individuals (Fig. S11 and Dataset S2). Moreover, untargeted spatial mapping and molecular networking are complementary tools as they are generated based on different fractions of the same dataset: MS1 features (m/z + retention time) and MS/MS data, respectively. Thus, if molecules that might be found on hand and phone of a specific individual are not highlighted by molecular networking because they did not fragment during MS/MS analysis, they can be picked by spatial mapping. Additionally, the detection of molecules in corresponding spatial locations on hands and phones decreases the possibility of chance matches.
Fig. S11.
Two-dimensional spatial maps of hands and phones of 39 individuals. This spatial map has to be used along with the mapping file .CSV (Dataset S2) to visualize the distribution and relative abundance of molecules in hands and phones of 39 individuals. The two files are simply dragged and dropped to ili-toolbox.github.io/ for visualization. From Top to Bottom, each column represents hand and phone of individuals: the first column, individuals 1–10; the second column, individuals 11–20; the third column, individuals 21–30; and the last column, individuals 31–39.
Conclusion/Discussion
In this study, we established a methodology to characterize the chemistry present on mobile phones and to calculate the relationships between chemistries that can be found on objects and the skin. Our approach shows that many chemicals recovered from phones originate from the hands of the owners, highlighting therefore the transfer of our skin molecules on objects that we touch.
Furthermore, we show that molecular signatures recovered from phones can be used to gain insights into personal habits based on similarities of skin-to-object chemical signatures. Many molecular classes, revealed through molecular networking, were identified on phones. These include beauty and hygiene products, diet, pesticides/insecticides, plasticizers, and medications such as antifungal, skin inflammation, and oral antidepressant treatments. Furthermore, we show that even molecules that were applied more than 6 months before sample collection can still be detected on phones, such as DEET, active ingredient of mosquito lotions. Some molecular traces tested 4 months later persist on phones and match the hands of the same individuals sampled at the first time point.
In addition to highlighting unique lifestyle chemicals detected on phones of individuals, molecular networking correctly and efficiently links the molecular traces recovered from phone to the hand of the owner. Furthermore, we show that the combination of many such identifiable chemistries detected on phones defines chemical signatures that help to predict the lifestyle of an individual and to construct a composite sketch of personal lifestyle.
Our findings introduce an additional form of trace evidence based on molecular signatures of human hands. Such a MS-informatics–based approach has yet to be used to link traces of untargeted chemical data collected from an item, such as a phone, to the lifestyle of an individual. Because the computational challenges of such untargeted metabolomics analysis are intensive, only now can we begin to perform such calculations at the scale that is needed for forensic analysis, but only with the use of supercomputers. Therefore, the MS data collection and analysis, although only about 500 samples in this study, are still laborious tasks. The main challenge in implementing large-scale untargeted forensics metabolomics is not the data collection, but the Big Data management and the development of the appropriate tools to integrate and effortlessly interpret the large datasets. Although significant challenges remain in annotating such a large-scale dataset, the implementation of this methodology provides the key stepping-stone needed to use molecular traces detected on personal belongings to gain insights into personal habits and daily and hygiene routine of individuals, and also to show where they have been or even if they are on medication.
At present, the molecular lifestyle signatures analysis approach to track and find an individual can complement traditional physical evidence including DNA, fingerprints, and skin microbial fingerprints (64, 65) to provide additional information about a person. Furthermore, if the traditional physical evidence is not reliable, incomplete, or not available to accurately identify an individual, the molecular lifestyle signature might be used to provide information that is otherwise impossible to obtain. The molecular analysis would help a criminal investigator in narrowing down the owners of the object (e.g., a suspect of a crime scene or understanding the habits of a terrorist) by identifying specific lifestyle characteristics from objects they touch.
Perspective
Although it is unusual to write a dedicated section as a perspective in a research paper, we felt it is important to describe how this work might move beyond the proof-of-principle presented in this paper. We envision the development of confidence measures that can be associated with each lifestyle chemical signature identified on objects, similar to confidence that can be assigned to fingerprints matches. Despite the development of tools such as large-scale molecular networking and the increasing number of publicly accessible MS/MS reference datasets in the recent years, the current method described in this paper still requires manual interpretation of the data and needs further validation to be applied in forensics. However, we anticipate this proof-of-principle study to complement the traditional approaches in forensics science, through mass-spectral analysis of the objects someone touches frequently.
Ultimately, this work suffers from the chicken-and-egg conundrum where the approach is the egg and the database is the chicken: one of them had to come first. With all of the current MS/MS mass-spectral reference libraries METLIN (66), mzCLoud (https://www.mzcloud.org), Massbank (67), National Institute of Standards and Technology (NIST) (https://www.nist.gov/index.html), Respect (68), the Human Metabolome Database (69), and GNPS (gnps.ucsd.edu/ProteoSAFe/static/gnps-splash.jsp) (40), the scientific community can only, on average, annotate 1.8% of metabolomics data (70) (2.3% in this study, gnps.ucsd.edu/ProteoSAFe/result.jsp?task=eea01f9ec9ea44bc80d76de30da67be4&view=view_all_annotations_DB), and yet we can already reveal specific lifestyle signatures of people with this level of annotations due to large number of molecules that are detected with a single metabolomics run. However, as the community makes more reference spectra available, the construction of a database of lifestyle/personal habit versus a reference spectra will lead to solid association of lifestyles to people. Currently, such a database does not exist and it will take significant community effort akin to the level of fingerprint databases.
Here, we show that the principle behind the approach works. We believe that an extensive database with appropriate metadata of where these molecules are found and their associated lifestyles can become available. Such a database would not only benefit forensics (tracking a subject) or a terrorist tracing (useful for the military) but also be useful for toxicology, as it would be a noninvasive way to measure environmental exposures, such as exposure to plasticizers and other pollutants (Fig. S10 B and C). Finally, we envision the use of this approach in medicine perhaps to understand patient compliance and patient-specific metabolism, or even monitor individualistic responses to medications, even without the need to use a needle, but again with the proper computational and reference infrastructure.
Materials and Methods
Subject Recruitment and Sample Collection.
Thirty-nine healthy adults were recruited to participate in the study. All individuals signed a written informed consent and approved sample collection from their hands and personal objects, in accordance with the sampling procedure approved by the University of California, San Diego, Institutional Review Board (Approval 130537X). There was no skin preparation for sampling, and volunteers kept their same daily routine. The idea was to use chemistries that compose the traces on objects as a signature, including molecules from external environment and/or daily routine. Samples were collected from right hand and phone of each individual using swabs, following the previously validated protocol (13). Eight samples were collected from each right hand (three from the palm and one from each finger) and four samples from each phone (two from the screen and two from the back) (Fig. 1). Sampling was performed at 5 × 5-cm area for phones spots and 4 × 1-cm area for hands spots, with premoistened cotton swabs at each site in 50:50 ethanol/water. The absorbed material was then extracted in 200 μL of 50:50 ethanol/water. Time 2 samples were collected 4 mo later following the same protocol, from 10 individuals recruited in the first time of sampling. After collection, samples were stored at −80 °C until further analysis. The ethanol/water extracts were subjected to UPLC-Q-TOF for detection of smaller molecules, including MS/MS of molecules for molecular network analysis.
UPLC-Q-TOF MS Analysis.
Hand and phone swab sample extractions (Dataset S3) were analyzed using a previously validated UPLC-MS/MS method described in detail in ref. 13. We used a UltiMate 3000 UPLC system (Thermo Scientific), controlled by Chromeleon software (Thermo Scientific). Briefly, UPLC conditions of analysis were as follows: 1.7-µm C18 (50 × 2.1-mm) UHPLC Column (Phenomenex); column temperature, 40 °C; flow rate, 0.5 mL/min; mobile phase A, 97.95% water/1.95% acetonitrile/0.1% formic acid (vol/vol); mobile phase B, 97.95% acetonitrile/1.95% water/0.1% formic acid (vol/vol). A linear gradient was used for the chromatographic separation: 0–2 min, 0–20% B; 2–8 min, 20–99% B; 8–9 min, 99–99% B; 9–10 min, 0% B. The UPLC-MS analysis was performed on a Maxis Q-TOF mass spectrometer (Bruker Daltonics), controlled by the Otof Control and Hystar software packages (Bruker Daltonics) and equipped with electrospray ionization (ESI) source. MS spectra were acquired in a positive ion mode in the mass range m/z 80–2,000. Instrument parameters were set as follow: nebulizer gas (nitrogen) pressure, 2 bar; capillary voltage, 4,500 V; ion source temperature, 180 °C; dry gas flow, 9 L/min; spectra rate acquisition, 10 spectra/s. MS/MS fragmentation of the 10 most intense selected ions per spectrum was performed using ramped collision induced dissociation energy, ranged from 10 to 50 eV to get diverse fragmentation patterns. MS/MS active exclusion was set after four spectra and released after 30 s. MS data collected from hands and phones of 39 volunteers can be found here: ftp://massive.ucsd.edu/MSV000078832 and ftp://massive.ucsd.edu/MSV000078993. Data collected from 10 individuals 4 months later are available here: ftp://massive.ucsd.edu/MSV000079825.
LC-MS/MS Data Processing.
MS data were processed using an open MS workflow for features finding, previously validated to process large-scale LC-MS datasets, collected from human skin (13). The workflow involves the use of an open MS pipeline, to automatically select features for all LC-MS datasets collected from 39 hands and phones (time 1 and time 2 datasets; total, 588 samples) and save the features in featureXML format. The FeatureFinderCentroided algorithm was used (Dataset S4). Feature detection filtering parameters were as follows: threshold, 0.95; m/z tolerance, 10 ppm; and retention time (RT) tolerance, 10 s. Each detected feature represents a set of m/z and RT regions corresponding to isotopes of a molecule. Then, all detected features were merged into one list, commonly called “bucket table,” displaying the relative abundance/intensity of features in each sample. Molecular features were compared and if two features have a window intersection area above 10%, then only the feature with maximal intensity was considered. One bucket table with a total number of extracted features of 26,847 for time 1 and time 2 sampling combined was considered.
Bray–Curtis Dissimilarity Analysis.
For the calculation of sample-sample dissimilarity, the Bray–Curtis metric was used. The dissimilarity between a pair of samples i, j is defined as follows: , where is the amplitude of metabolite t in sample i, and denotes the sum of all metabolites in sample i, .
For calculation of statistical significance, the difference in the mean of the within and the between group Bray–Curtis dissimilarity was compared with the difference in 1,000 random permutation of the sample labels.
Random Forest Models.
Supervised random forest classifier was used to evaluate the discriminant power of molecular signatures collected from phones and hands of individuals. The classification model was tuned and evaluated with cross-validation with the bucket table generated from the samples collected from phones and hands. Then the model was applied to predict the phone samples to determine whether they can trace back to their owners with molecular signatures. The model performances of the time 1 and time 2 are consistent. For each time point, phone samples collected from the front and the back parts were also predicted separately, to determine which phone surface (glass, front, and plastic, back) provides the highest recovery of hands molecular signatures.
Molecular Networking.
LC-MS/MS data collected from hands and phones were converted to the .mzXML open file format in Compass data analysis software (Bruker Daltonics) and were subjected to the molecular network workflow of GNPS (40) (gnps.ucsd.edu/ProteoSAFe/static/gnps-splash.jsp). MSCluster was used to group MS/MS spectra that originated from identical compounds together (71). These clusters were then represented with a consensus spectra used to construct the molecular network. Similarity between every pair of MS/MS spectra was determined using a spectral alignment algorithm calculating a cosine score. Cosine score ranges from 0 to 1, with 1 indicating a perfect match. A cosine threshold of 0.65 was used for the molecular network in this study. Molecular networking parameters included precursor m/z tolerance of 1 Da and a fragment mass tolerance of 0.5, only MS/MS spectral pairs with at least four matched fragments ions were included, and each MS/MS spectrum was only allowed to connect to its top 10 scoring matches, resulting in a maximum of 10 connections per node. The maximum size of connected components allowed in the network was 600 and the minimum number of spectra required in a cluster was 3. Molecular network parameters for MS/MS data collected from 39 hands and phones are accessible here: gnps.ucsd.edu/ProteoSAFe/status.jsp?task=eea01f9ec9ea44bc80d76de30da67be4; molecular networks generated from MS/MS data collected from hands time 1 and phones time 2: gnps.ucsd.edu/ProteoSAFe/status.jsp?task=60b0ae8123284d6980204c6650c400d5; phones time 1 and phones time 2: gnps.ucsd.edu/ProteoSAFe/status.jsp?task=027732e55c344fa4bd940430c9e144fd.
The resulting molecular network bucket table was exported from GNPS and then visualized in Cytoscape software (42); nodes represent consensus MS/MS spectra connected with edges. Network organization was performed using the FM3 layout plugin (72) (apps.cytoscape.org/apps/fm3). To simplify the network, MS/MS spectra corresponding to the background (from swabs and solvents) were removed. MS/MS data were simultaneously searched against GNPS MS/MS spectral libraries, and putative identifications were imported into the network and displayed in Cytoscape as attributes.
Frequency Histogram and Heat Map.
To build the frequency histogram, the GNPS precursor ion intensity table (available as “Create Cluster Buckets” in the advanced option on Molecular Networking Workflow) was used to count the number of volunteers in which each molecule was present. Heat maps (https://cran.r-project.org/web/packages/d3heatmap/index.html) were obtained from a presence absence matrix manually curated from the molecular network output generated from hands and phones of 39 individuals (Dataset S1). The rows (samples) and columns (molecules) were ordered by hierarchical clustering using the Jaccard dissimilarity measure and Ward grouping method. The R package d3heatmap was used to draw and dynamically inspect the heat map.
Two-Dimensional Spatial Molecular Mapping.
Spatial mapping was used in this study to map the number of features detected in each sample and to display the localization and abundance of features on hands and phones of individuals.
Spatial mapping for hands and phones was performed in the ili toolbox for 2D and 3D spatial mapping. This open-source toolbox was developed by us and freely available at https://github.com/ili-toolbox/ili. We used the workflow previously developed for molecular and microbial cartography of the human skin surface (13). Two-dimensional mapping involves assigning for each sampling spot a spot (x–y pixel coordinates of the center, radius) in the image or photo of hand and phone that spatially fits the best as judged by the visual examination. Visualization of such 2D maps was performed in ili by dragging and dropping the hand or phone model (Fig. S11) and a .CSV file that combines coordinates information and the bucket table generated in section 3 (Dataset S2). A .CSV file includes hands/phones filenames, specific coordinates of each sampling spot, spot radii, and relative intensities of detected molecular features (Dataset S2). To display MS (UPLC-Q-TOF) data, spectral intensities are integrated over a given m/z and retention time regions, corresponding to the molecular abundance at each location on the hand and phone. These data were visualized using pseudocolormap and overlaid onto images of the hand and the phone, at specific coordinates based on sampling location. The so-called jet pseudocolormap was used to display the relative signal intensities at each spot location.
Supplementary Material
Acknowledgments
We thank all volunteers who were recruited in this study for their participation. We also thank Tal Luzzatto Knaan for her valuable input to the manuscript. This work was supported by National Institute of Justice Award 2015-DN-BX-K047. T.A., A.B., and P.C.D. acknowledge funding from the European Union’s Horizon 2020 Programme (Grant 634402). R.R.d.S. was supported by the São Paulo Research Foundation (Award FAPESP-2015/03348-3). This work was partially supported by US National Institutes of Health (NIH) Grant 5P41GM103484-07; N.B. was also partially supported as an Alfred P. Sloan Fellow. We further acknowledge NIH Grant GMS10RR029121 and Bruker for the shared instrumentation infrastructure that enabled this work.
Footnotes
The authors declare no conflict of interest.
This article is a PNAS Direct Submission.
Data deposition: The mass spectrometry data have been deposited in the MassIVE database (ftp://massive.ucsd.edu/MSV000078993, ftp://massive.ucsd.edu/MSV000078832, and ftp://massive.ucsd.edu/MSV000079825).
This article contains supporting information online at www.pnas.org/lookup/suppl/doi:10.1073/pnas.1610019113/-/DCSupplemental.
References
- 1.de Gruijter M, de Poot CJ, Elffers H. The influence of new technologies on the visual attention of CSIs performing a crime scene investigation. J Forensic Sci. 2016;61(1):43–51. doi: 10.1111/1556-4029.12904. [DOI] [PubMed] [Google Scholar]
- 2.Stoney DA, Stoney PL. Critical review of forensic trace evidence analysis and the need for a new approach. Forensic Sci Int. 2015;251:159–170. doi: 10.1016/j.forsciint.2015.03.022. [DOI] [PubMed] [Google Scholar]
- 3.van Oorschot RAH, Ballantyne KN, Mitchell RJ. Forensic trace DNA: A review. Investig Genet. 2010;1(1):14. doi: 10.1186/2041-2223-1-14. [DOI] [PMC free article] [PubMed] [Google Scholar]
- 4.Kasu M, Shires K. The validation of forensic DNA extraction systems to utilize soil contaminated biological evidence. Leg Med (Tokyo) 2015;17(4):232–238. doi: 10.1016/j.legalmed.2015.01.004. [DOI] [PubMed] [Google Scholar]
- 5.Rashaid AHB, Harrington PB, Jackson GP. Amino acid composition of human scalp hair as a biometric classifier and investigative lead. Anal Methods. 2015;7(5):1707–1718. [Google Scholar]
- 6.Wiltshire PE, Hawksworth DL, Webb JA, Edwards KJ. Two sources and two kinds of trace evidence: Enhancing the links between clothing, footwear and crime scene. Forensic Sci Int. 2015;254:231–242. doi: 10.1016/j.forsciint.2015.05.033. [DOI] [PubMed] [Google Scholar]
- 7.Bond JW. Value of DNA evidence in detecting crime. J Forensic Sci. 2007;52(1):128–136. doi: 10.1111/j.1556-4029.2006.00323.x. [DOI] [PubMed] [Google Scholar]
- 8.Wang YA, Hu J. Global ridge orientation modeling for partial fingerprint identification. IEEE Trans Pattern Anal Mach Intell. 2011;33(1):72–87. doi: 10.1109/TPAMI.2010.73. [DOI] [PubMed] [Google Scholar]
- 9.Chen FL, Feng JJ, Jain AK, Zhou J, Zhang J. Separating overlapped fingerprints. IEEE Trans Inf Forensics Security. 2011;6(2):346–359. [Google Scholar]
- 10.Weschler CJ, et al. Transdermal uptake of diethyl phthalate and di(n-butyl) phthalate directly from air: Experimental verification. Environ Health Perspect. 2015;123(10):928–934. doi: 10.1289/ehp.1409151. [DOI] [PMC free article] [PubMed] [Google Scholar]
- 11.Weschler CJ, Nazaroff WW. SVOC exposure indoors: Fresh look at dermal pathways. Indoor Air. 2012;22(5):356–377. doi: 10.1111/j.1600-0668.2012.00772.x. [DOI] [PubMed] [Google Scholar]
- 12.Gong M, Zhang Y, Weschler CJ. Measurement of phthalates in skin wipes: Estimating exposure from dermal absorption. Environ Sci Technol. 2014;48(13):7428–7435. doi: 10.1021/es501700u. [DOI] [PubMed] [Google Scholar]
- 13.Bouslimani A, et al. Molecular cartography of the human skin surface in 3D. Proc Natl Acad Sci USA. 2015;112(17):E2120–E2129. doi: 10.1073/pnas.1424409112. [DOI] [PMC free article] [PubMed] [Google Scholar]
- 14.Bouslimani A, Sanchez LM, Garg N, Dorrestein PC. Mass spectrometry of natural products: Current, emerging and future technologies. Nat Prod Rep. 2014;31(6):718–729. doi: 10.1039/c4np00044g. [DOI] [PMC free article] [PubMed] [Google Scholar]
- 15.Hoffmann WD, Jackson GP. Forensic mass spectrometry. Annu Rev Anal Chem (Palo Alto, Calif) 2015;8(1):419–440. doi: 10.1146/annurev-anchem-071114-040335. [DOI] [PubMed] [Google Scholar]
- 16.Lauzon N, Dufresne M, Chauhan V, Chaurand P. Development of laser desorption imaging mass spectrometry methods to investigate the molecular composition of latent fingermarks. J Am Soc Mass Spectrom. 2015;26(6):878–886. doi: 10.1007/s13361-015-1123-0. [DOI] [PubMed] [Google Scholar]
- 17.Peng L, Hua L, Wang W, Zhou Q, Li H. On-site rapid detection of trace non-volatile inorganic explosives by stand-alone ion mobility spectrometry via acid-enhanced evaporization. Sci Rep. 2014;4:6631. doi: 10.1038/srep06631. [DOI] [PMC free article] [PubMed] [Google Scholar]
- 18.Mäkinen M, Nousiainen M, Sillanpää M. Ion spectrometric detection technologies for ultra-traces of explosives: A review. Mass Spectrom Rev. 2011;30(5):940–973. doi: 10.1002/mas.20308. [DOI] [PubMed] [Google Scholar]
- 19.Lesiak AD, Musah RA, Domin MA, Shepard JR. DART-MS as a preliminary screening method for “herbal incense”: Chemical analysis of synthetic cannabinoids. J Forensic Sci. 2014;59(2):337–343. doi: 10.1111/1556-4029.12354. [DOI] [PubMed] [Google Scholar]
- 20.Jantzi SC, Almirall JR. Elemental analysis of soils using laser ablation inductively coupled plasma mass spectrometry (LA-ICP-MS) and laser-induced breakdown spectroscopy (LIBS) with multivariate discrimination: Tape mounting as an alternative to pellets for small forensic transfer specimens. Appl Spectrosc. 2014;68(9):963–974. doi: 10.1366/13-07351. [DOI] [PubMed] [Google Scholar]
- 21.Luo R, et al. Elements concentrations in the scalp hair of methamphetamine abusers. Forensic Sci Int. 2015;249:112–115. doi: 10.1016/j.forsciint.2015.01.016. [DOI] [PubMed] [Google Scholar]
- 22.Brust H, et al. Isotopic and elemental profiling of ammonium nitrate in forensic explosives investigations. Forensic Sci Int. 2015;248:101–112. doi: 10.1016/j.forsciint.2014.11.024. [DOI] [PubMed] [Google Scholar]
- 23.Ifa DR, Manicke NE, Dill AL, Cooks RG. Latent fingerprint chemical imaging by mass spectrometry. Science. 2008;321(5890):805. doi: 10.1126/science.1157199. [DOI] [PubMed] [Google Scholar]
- 24.Bailey MJ, et al. Chemical characterization of latent fingerprints by matrix-assisted laser desorption ionization, time-of-flight secondary ion mass spectrometry, mega electron volt secondary mass spectrometry, gas chromatography/mass spectrometry, X-ray photoelectron spectroscopy, and attenuated total reflection Fourier transform infrared spectroscopic imaging: An intercomparison. Anal Chem. 2012;84(20):8514–8523. doi: 10.1021/ac302441y. [DOI] [PubMed] [Google Scholar]
- 25.Kaplan-Sandquist KA, LeBeau MA, Miller ML. Evaluation of four fingerprint development methods for touch chemistry using matrix-assisted laser desorption ionization/time-of-flight mass spectrometry. J Forensic Sci. 2015;60(3):611–618. doi: 10.1111/1556-4029.12718. [DOI] [PubMed] [Google Scholar]
- 26.Francese S, et al. Beyond the ridge pattern: Multi-informative analysis of latent fingermarks by MALDI mass spectrometry. Analyst (Lond) 2013;138(15):4215–4228. doi: 10.1039/c3an36896c. [DOI] [PubMed] [Google Scholar]
- 27.Jospe MR, Fairbairn KA, Green P, Perry TL. Diet app use by sports dietitians: A survey in five countries. JMIR Mhealth Uhealth. 2015;3(1):e7. doi: 10.2196/mhealth.3345. [DOI] [PMC free article] [PubMed] [Google Scholar]
- 28.Chen J, Cade JE, Allman-Farinelli M. The most popular smartphone apps for weight loss: A quality assessment. JMIR Mhealth Uhealth. 2015;3(4):e104. doi: 10.2196/mhealth.4334. [DOI] [PMC free article] [PubMed] [Google Scholar]
- 29.Dunton GF, et al. Development of a smartphone application to measure physical activity using sensor-assisted self-report. Front Public Health. 2014;2:12. doi: 10.3389/fpubh.2014.00012. [DOI] [PMC free article] [PubMed] [Google Scholar]
- 30.Adlakha D, Budd EL, Gernes R, Sequeira S, Hipp JA. Use of emerging technologies to assess differences in outdoor physical activity in St. Louis, Missouri. Front Public Health. 2014;2:41. doi: 10.3389/fpubh.2014.00041. [DOI] [PMC free article] [PubMed] [Google Scholar]
- 31.Morris ME, et al. Mobile therapy: Case study evaluations of a cell phone application for emotional self-awareness. J Med Internet Res. 2010;12(2):e10. doi: 10.2196/jmir.1371. [DOI] [PMC free article] [PubMed] [Google Scholar]
- 32.Park JW, Chu MK, Kim JM, Park SG, Cho SJ. Analysis of trigger factors in episodic migraineurs using a smartphone headache diary applications. PLoS One. 2016;11(2):e0149577. doi: 10.1371/journal.pone.0149577. [DOI] [PMC free article] [PubMed] [Google Scholar]
- 33.Larkin A, Williams DE, Kile ML, Baird WM. Developing a smartphone software package for predicting atmospheric pollutant concentrations at mobile locations. Comput J. 2015;58(6):1431–1442. doi: 10.1093/comjnl/bxu067. [DOI] [PMC free article] [PubMed] [Google Scholar]
- 34.Glasgow ML, et al. Using smartphones to collect time-activity data for long-term personal-level air pollution exposure assessment. J Expo Sci Environ Epidemiol. 2016;26(4):356–364. doi: 10.1038/jes.2014.78. [DOI] [PubMed] [Google Scholar]
- 35.Lax S, et al. Forensic analysis of the microbiome of phones and shoes. Microbiome. 2015;3:21. doi: 10.1186/s40168-015-0082-9. [DOI] [PMC free article] [PubMed] [Google Scholar]
- 36.Watrous JD, et al. Microbial metabolic exchange in 3D. ISME J. 2013;7(4):770–780. doi: 10.1038/ismej.2012.155. [DOI] [PMC free article] [PubMed] [Google Scholar]
- 37.Watrous J, et al. Mass spectral molecular networking of living microbial colonies. Proc Natl Acad Sci USA. 2012;109(26):E1743–E1752. doi: 10.1073/pnas.1203689109. [DOI] [PMC free article] [PubMed] [Google Scholar]
- 38.Yang JY, et al. Molecular networking as a dereplication strategy. J Nat Prod. 2013;76(9):1686–1699. doi: 10.1021/np400413s. [DOI] [PMC free article] [PubMed] [Google Scholar]
- 39.Frank AM, et al. Spectral archives: Extending spectral libraries to analyze both identified and unidentified spectra. Nat Methods. 2011;8(7):587–591. doi: 10.1038/nmeth.1609. [DOI] [PMC free article] [PubMed] [Google Scholar]
- 40.Wang M, et al. Sharing and community curation of mass spectrometry data with Global Natural Products Social Molecular Networking. Nat Biotechnol. 2016;34(8):828–837. doi: 10.1038/nbt.3597. [DOI] [PMC free article] [PubMed] [Google Scholar]
- 41.Su G, Morris JH, Demchak B, Bader GD. Biological network exploration with Cytoscape 3. Curr Protoc Bioinformatics. 2014;47:8.13.1–8.13.24. doi: 10.1002/0471250953.bi0813s47. [DOI] [PMC free article] [PubMed] [Google Scholar]
- 42.Smoot ME, Ono K, Ruscheinski J, Wang PL, Ideker T. Cytoscape 2.8: New features for data integration and network visualization. Bioinformatics. 2011;27(3):431–432. doi: 10.1093/bioinformatics/btq675. [DOI] [PMC free article] [PubMed] [Google Scholar]
- 43.Sumner LW, et al. Proposed minimum reporting standards for chemical analysis Chemical Analysis Working Group (CAWG) Metabolomics Standards Initiative (MSI) Metabolomics. 2007;3(3):211–221. doi: 10.1007/s11306-007-0082-2. [DOI] [PMC free article] [PubMed] [Google Scholar]
- 44.Matuszak AH, Morway AJ, Munday JC. 1958. Grease wherein the thickener comprises metal soaps of hydroxy fatty acid formals. US Patent 2,850,456.
- 45.Ehara T, Yamaguchi K. 2011. Trehalose fatty acid ester composition. US Patent 7,956,181.
- 46.Sendra JM, Navarro JL, Izquierdo L. C18 solid-phase isolation and high-performance liquid chromatography/ultraviolet diode array determination of fully methoxylated flavones in citrus juices. J Chromatogr Sci. 1988;26(9):443–448. doi: 10.1093/chromsci/26.9.443. [DOI] [PubMed] [Google Scholar]
- 47.Gentili S, Mortali C, Mastrobattista L, Berretta P, Zaami S. Determination of different recreational drugs in sweat by headspace solid-phase microextraction gas chromatography mass spectrometry (HS-SPME GC/MS): Application to drugged drivers. J Pharm Biomed Anal. 2016;129:282–287. doi: 10.1016/j.jpba.2016.07.018. [DOI] [PubMed] [Google Scholar]
- 48.Rowell F, Hudson K, Seviour J. Detection of drugs and their metabolites in dusted latent fingermarks by mass spectrometry. Analyst (Lond) 2009;134(4):701–707. doi: 10.1039/b813957c. [DOI] [PubMed] [Google Scholar]
- 49.Kaplan-Sandquist K, LeBeau MA, Miller ML. Chemical analysis of pharmaceuticals and explosives in fingermarks using matrix-assisted laser desorption ionization/time-of-flight mass spectrometry. Forensic Sci Int. 2014;235:68–77. doi: 10.1016/j.forsciint.2013.11.016. [DOI] [PubMed] [Google Scholar]
- 50.Li S, Lo CY, Ho CT. Hydroxylated polymethoxyflavones and methylated flavonoids in sweet orange (Citrus sinensis) peel. J Agric Food Chem. 2006;54(12):4176–4185. doi: 10.1021/jf060234n. [DOI] [PubMed] [Google Scholar]
- 51.Opstrup MS, Johansen JD, Bossi R, Lundov MD, Garvey LH. Chlorhexidine in cosmetic products—a market survey. Contact Dermat. 2015;72(1):55–58. doi: 10.1111/cod.12298. [DOI] [PubMed] [Google Scholar]
- 52.Kuwayama K, et al. Time-course measurements of caffeine and its metabolites extracted from fingertips after coffee intake: A preliminary study for the detection of drugs from fingerprints. Anal Bioanal Chem. 2013;405(12):3945–3952. doi: 10.1007/s00216-012-6569-3. [DOI] [PubMed] [Google Scholar]
- 53.Tsuda T, Noda S, Kitagawa S, Morishita T. Proposal of sampling process for collecting human sweat and determination of caffeine concentration in it by using GC/MS. Biomed Chromatogr. 2000;14(8):505–510. doi: 10.1002/1099-0801(200012)14:8<505::AID-BMC17>3.0.CO;2-7. [DOI] [PubMed] [Google Scholar]
- 54.Domb AJ, Marlinsky A, Maniar M, Teomim L. Insect repellent formulations of N,N-diethyl-m-toluamide (DEET) in a liposphere system: Efficacy and skin uptake. J Am Mosq Control Assoc. 1995;11(1):29–34. [PubMed] [Google Scholar]
- 55.Wang H, So PK, Yao ZP. Direct analysis of herbal powders by pipette-tip electrospray ionization mass spectrometry. Anal Chim Acta. 2014;809:109–116. doi: 10.1016/j.aca.2013.11.060. [DOI] [PubMed] [Google Scholar]
- 56.Cordell GA, Araujo OE. Capsaicin: Identification, nomenclature, and pharmacotherapy. Ann Pharmacother. 1993;27(3):330–336. doi: 10.1177/106002809302700316. [DOI] [PubMed] [Google Scholar]
- 57.Kreft S, Knapp M, Kreft I. Extraction of rutin from buckwheat (Fagopyrum esculentum Moench) seeds and determination by capillary electrophoresis. J Agric Food Chem. 1999;47(11):4649–4652. doi: 10.1021/jf990186p. [DOI] [PubMed] [Google Scholar]
- 58.Camargo FB, Jr, Gaspar LR, Maia Campos PM. Skin moisturizing effects of panthenol-based formulations. J Cosmet Sci. 2011;62(4):361–370. [PubMed] [Google Scholar]
- 59.Surburg H, Panten J. Common Fragrance and Flavor Materials: Preparation, Properties and Uses. Wiley; Weinheim, Germany: 2006. [Google Scholar]
- 60.Johnson W., Jr Cosmetic Ingredient Review Expert Panel Final report on the safety assessment of trilaurin, triarachidin, tribehenin, tricaprin, tricaprylin, trierucin, triheptanoin, triheptylundecanoin, triisononanoin, triisopalmitin, triisostearin, trilinolein, trimyristin, trioctanoin, triolein, tripalmitin, tripalmitolein, triricinolein, tristearin, triundecanoin, glyceryl triacetyl hydroxystearate, glyceryl triacetyl ricinoleate, and glyceryl stearate diacetate. Int J Toxicol. 2001;20(Suppl 4):61–94. [PubMed] [Google Scholar]
- 61.Qian TT, Li DC, Jiang H. Thermochemical behavior of tris(2-butoxyethyl) phosphate (TBEP) during co-pyrolysis with biomass. Environ Sci Technol. 2014;48(18):10734–10742. doi: 10.1021/es502669s. [DOI] [PubMed] [Google Scholar]
- 62.Anonymous Final report on the safety assessment of Ricinus communis (castor) seed oil, hydrogenated castor oil, glyceryl ricinoleate, glyceryl ricinoleate SE, ricinoleic acid, potassium ricinoleate, sodium ricinoleate, zinc ricinoleate, cetyl ricinoleate, ethyl ricinoleate, glycol ricinoleate, isopropyl ricinoleate, methyl ricinoleate, and octyldodecyl ricinoleate. Int J Toxicol. 2007;26(Suppl 3):31–77. doi: 10.1080/10915810701663150. [DOI] [PubMed] [Google Scholar]
- 63.Ma YX, et al. The aging retarding effect of “Long-Life CiLi.”. Mech Ageing Dev. 1997;96(1-3):171–180. doi: 10.1016/s0047-6374(97)01890-3. [DOI] [PubMed] [Google Scholar]
- 64.Franzosa EA, et al. Identifying personal microbiomes using metagenomic codes. Proc Natl Acad Sci USA. 2015;112(22):E2930–E2938. doi: 10.1073/pnas.1423854112. [DOI] [PMC free article] [PubMed] [Google Scholar]
- 65.Fierer N, et al. Forensic identification using skin bacterial communities. Proc Natl Acad Sci USA. 2010;107(14):6477–6481. doi: 10.1073/pnas.1000162107. [DOI] [PMC free article] [PubMed] [Google Scholar]
- 66.Smith CA, et al. METLIN: A metabolite mass spectral database. Ther Drug Monit. 2005;27(6):747–751. doi: 10.1097/01.ftd.0000179845.53213.39. [DOI] [PubMed] [Google Scholar]
- 67.Horai H, et al. MassBank: A public repository for sharing mass spectral data for life sciences. J Mass Spectrom. 2010;45(7):703–714. doi: 10.1002/jms.1777. [DOI] [PubMed] [Google Scholar]
- 68.Sawada Y, et al. RIKEN tandem mass spectral database (ReSpect) for phytochemicals: A plant-specific MS/MS-based data resource and database. Phytochemistry. 2012;82:38–45. doi: 10.1016/j.phytochem.2012.07.007. [DOI] [PubMed] [Google Scholar]
- 69.Wishart DS, et al. HMDB: The Human Metabolome Database. Nucleic Acids Res. 2007;35(Database issue):D521–D526. doi: 10.1093/nar/gkl923. [DOI] [PMC free article] [PubMed] [Google Scholar]
- 70.da Silva RR, Dorrestein PC, Quinn RA. Illuminating the dark matter in metabolomics. Proc Natl Acad Sci USA. 2015;112(41):12549–12550. doi: 10.1073/pnas.1516878112. [DOI] [PMC free article] [PubMed] [Google Scholar]
- 71.Frank AM, et al. Clustering millions of tandem mass spectra. J Proteome Res. 2008;7(1):113–122. doi: 10.1021/pr070361e. [DOI] [PMC free article] [PubMed] [Google Scholar]
- 72.Hachul S, Junger M. 2004. Drawing large graphs with a potential-field-based multilevel algorithm. Graph Drawing, ed Pach J, Lecture Notes in Computer Science (Springer, Berlin), Vol 3383, pp 285–295.
Associated Data
This section collects any data citations, data availability statements, or supplementary materials included in this article.


