Significance
Juvenile idiopathic arthritis, a common chronic childhood rheumatic disease, is characterized by joint inflammation and synovial accumulation of activated autoreactive T cells. Although current therapies induce high rates of disease remission, 50–80% patients flare upon treatment withdrawal, thus requiring continued exposure to the safety risks and costs of an immunosuppressive biologic. Unfortunately, at the time of therapy withdrawal, patients who will maintain inactive disease are clinically indistinguishable from those who will not. We identified differences in the DNA methylation status of T-cell activation genes—detectable at a protein level and established at the time of therapy withdrawal—that were specifically associated with clinical outcome, demonstrating the mechanistic and diagnostic relevance of epigenetic features in autoimmune arthritis.
Keywords: arthritis, epigenetics, T-cell activation, DNA methylation signature, transcriptomics
Abstract
Multifactorial diseases, including autoimmune juvenile idiopathic arthritis (JIA), result from a complex interplay between genetics and environment. Epigenetic mechanisms are believed to integrate such gene–environment interactions, fine-tuning gene expression, and possibly contributing to immune system dysregulation. Although anti-TNF therapy has strongly increased JIA remission rates, it is not curative and up to 80% of patients flare upon treatment withdrawal. Thus, a crucial unmet medical and scientific need is to understand the immunological mechanisms associated with remission or flare to inform clinical decisions. Here, we explored the CD4+ T-cell DNA methylome of 68 poly-articular and extended oligo-articular JIA patients, before and after anti-TNF therapy withdrawal, to identify features associated with maintenance of inactive disease. Individual CpG sites were clustered in coherent modules without a priori knowledge of their function through network analysis. The methylation level of several CpG modules, specifically those enriched in CpG sites belonging to genes that mediate T-cell activation, uniquely correlated with clinical activity. Differences in DNA methylation were already detectable at the time of therapy discontinuation, suggesting epigenetic predisposition. RNA profiling also detected differences in T-cell activation markers (including HLA-DR) but, overall, its sensitivity was lower than epigenetic profiling. Changes to the T-cell activation signature at the protein level were detectable by flow cytometry, confirming the biological relevance of the observed alterations in methylation. Our work proposes epigenetic discrimination between clinical activity states, and reveals T-cell–related biological functions tied to, and possibly predicting or causing, clinical outcome.
Juvenile idiopathic arthritis (JIA) is the most common chronic childhood rheumatic disease and encompasses several forms, including extended oligo- and poly-articular JIA. Disease is characterized by chronic joint inflammation and synovial accumulation of activated autoreactive T cells (1). The low concordance rate between monozygotic twins (20–40%) (2) underscores that, although there is a genetic component to this autoimmune condition, environmental triggers and stochastic events are fundamental to disease pathogenesis. Epigenetic mechanisms are believed to integrate environmental influences on gene expression, possibly affecting immune system dysregulation and autoimmune manifestations (3). In this regard, epigenetic variation has been associated with various rheumatic diseases, including adult rheumatoid arthritis (RA) (4, 5), lupus (6, 7), and JIA (8). In addition, Liu et al. (9) identified two differentially methylated regions within the major histocompatibility complex (MHC) locus between RA patients and healthy controls, and suggested that a proportion of the risk conferred by the MHC region in RA is in fact mediated by altered DNA methylation.
Currently, the most effective treatment for JIA is anti-TNF, usually in combination with the first-line therapeutic, methotrexate. Unfortunately, 50–80% patients flare upon treatment withdrawal (10), thus requiring continued immunosuppressive treatment with its associated safety risks and costs (11). At the time of therapy withdrawal, patients who will eventually maintain inactive disease (ID) are clinically indistinguishable from those who will not. Thus, to better guide clinical decisions, it is crucial to unravel the mechanisms underlying disease remission.
Whereas most studies focus on the role of epigenetics in disease onset, we hypothesized that DNA methylation is also associated with responsiveness to therapy and subsequent maintenance of ID. We took advantage of the availability of well-characterized samples from a clinical trial that was designed to study rates and mechanisms of clinical relapse upon therapy withdrawal in patients who had initially achieved ID while on anti-TNF. By performing gene network analysis, we were able to identify differences in the DNA methylation of various T-cell activation genes that were specifically associated with clinical outcome. These changes were already evident at the time of therapy withdrawal and led to functional changes in the protein expression levels of molecules involved in T-cell activation. This study provides insight into the immunological mechanisms underlying disease remission and relapse, and reveals a previously unappreciated application of epigenetic analysis in distinguishing between clinical activity states in autoimmune arthritis.
Results
CpG Modules Are Associated with Clinical Activity.
We measured the genome-wide DNA methylation status of circulating CD4+ T cells collected from a homogeneous cohort of JIA patients sampled at the time of anti-TNF withdrawal (T0) and at the time of flare (Tend) (10). Nonflaring control samples were collected 8 mo after anti-TNF withdrawal, and were further segregated into patients maintaining ID (12) or not (NO ID) (Dataset S1). The latter category includes patients who did not meet the criteria to be considered inactive, while not worsening to the point of being considered flares (see SI Materials and Methods for definitions). We studied CD4+ T cells on the basis of their fundamental role in autoimmune disease pathogenesis (1, 13, 14), opting for fluorescence-activated cell sorting of CD4+ T cells to minimize the variability resulting from the divergent epigenetic profiles of heterogeneous peripheral blood mononuclear cell (PBMC) cell subsets (9, 15). DNA methylation was selected from several candidate epigenetic features for its relative stability (16–18) and potential for translation into clinical settings (19).
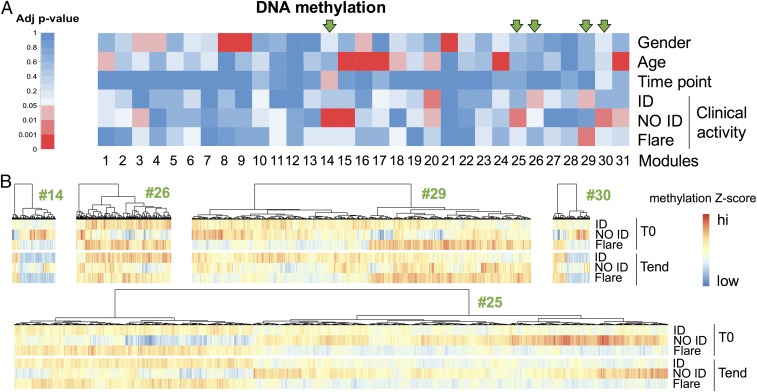
We used weighted gene coexpression network analysis (WGCNA) (20–25) to aggregate statistically correlated CpG sites into coherent modules. Because correlated CpG sites are likely to be biologically coregulated, focusing the analysis on modules as opposed to single CpG sites allows for reduction of both dimensionality and noise. The information carried by a CpG module is summarized by the module eigengene (i.e., the dominant across-sample profile of the CpG sites belonging to that module) (20). We tested the module eigengene for its association with demographic and clinical variables: age, gender, time point, and clinical activity. Gender and age served as controls, as these two traits are known to correlate with DNA methylation (26–30). A number of modules were indeed strongly associated with gender and age, validating our analytical strategy [false-discovery rate (FDR)-adjusted P value between 4.92e-2 and 1.99e-70] (Fig. 1A and Datasets S2 and S3).
Fig. 1.
CpG modules are associated with clinical activity. CD4+ T cells were sorted from blood samples collected before (T0) and up to 8 mo after (Tend) therapy withdrawal, and their DNA methylome was analyzed. Samples were stratified as ID, NO ID, and flares according to disease activity at Tend. For flares, Tend corresponds to the time of flare. (A) Single CpG sites were first aggregated in modules based on their intercorrelation through a WGCNA and then correlated with the demographic and clinical traits shown. FDR-adjusted correlation P values (adj P value) were color-coded according to the legend. Arrows mark modules associated with clinical activity but not with gender or age. (B) The median z-scored methylation level of each CpG site belonging to the five modules associated with clinical activity but not with gender or age was color-coded according to the legend, and hierarchical clustering was performed to visualize patterns across clinical activity and time point. n = 68.
Only one module was weakly associated with time point (FDR-adjusted P = 4.11e-2), suggesting that minimal variation in DNA methylation occurs upon therapy discontinuation. This finding was further supported by hierarchical clustering of the top 500 most variable CpG sites (Fig. S1), which showed perfect cosegregation of the two time points for each patient.
Fig. S1.

Hierarchical clustering of samples based on the 500 most variable CpG positions. Hierarchical clustering of samples based on the top 500 CpG sites by variance was performed using a correlation-based distance and average linkage. Pairs of baseline (T0) and end-of-study (Tend) time points cluster together for every patient (labeled with arbitrary numbers).
Nine CpG modules correlated with clinical activity (FDR-adjusted P value between 3.85e-2 and 2.29e-4), indicating that patients with distinct clinical outcomes differ in their DNA methylation profile. However, four of nine modules were more strongly associated with demographic traits rather than with clinical outcome. Therefore, we focused on the five modules that did not correlate with either gender or age (#14, #25, #26, #29, and #30, highlighted by green arrows in Fig. 1A; see also Dataset S4) to avoid the confounding effects of demographics. Consistent with Fig. 1A, the methylation pattern of CpG sites in NO ID patients differed from ID patients and flares (Fig. 1B).
Together, our data suggest that DNA methylation is largely unaffected by therapy discontinuation, but differs between patients who will maintain ID and those who will not.
Modules Associated with Clinical Activity Are Enriched in CpG Sites from the MHC Locus.
We performed positional and functional enrichment on the five modules associated with clinical activity, but not gender or age. Module 26 did not yield any significant enrichment and was not investigated any further.
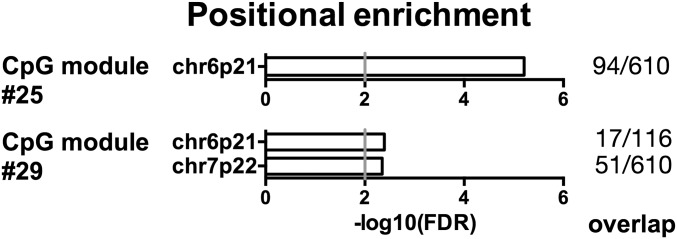
Modules 25 and 29 scored positive for positional enrichment. Both modules were enriched for CpG sites in the cytogenetic location 6p21, which encompasses the MHC locus (FDR-adjusted P = 6.19e-6 and 4.06e-3, respectively) (Fig. 2 and Datasets S5 and S6). When we analyzed CpG modules associated with traits other than clinical outcome, we could not find such a strong enrichment in the MHC locus, demonstrating its specific association with clinical activity. Moreover, all CpG sites associated with known single nucleotide polymorphisms were omitted from our analysis, thereby excluding the possibility that the detected epipolymorphisms were merely because of genetics (i.e., high polymorphism of the HLA locus). These findings are in line with recent literature showing that not only genetic but also epigenetic variation at the MHC locus is a risk factor for rheumatoid arthritis (9), thereby providing a possible pathogenic link between juvenile and adult autoimmune arthritis. Among the CpG sites belonging to these modules and located at 6p21, several fell into classic and nonclassic MHC genes, as well as into other immunologically relevant genes, including MICA, MICB, TRIM26, TRIM29, CCHCR1, and TNXB (Datasets S5 and S6).
Fig. 2.
Modules associated with clinical activity are enriched in CpG sites from the MHC locus. Positional enrichment analysis of the CpG modules #25 and #29, associated with clinical activity (NO ID, or ID and flare, respectively) but not with gender or age. The enriched locations (FDR-adjusted P < 0.01) and the gene overlap between modules and location gene sets are ranked by P value. The gray vertical line indicates an FDR-adjusted P = 0.01.
In conclusion, both MHC and other immunologically relevant genes in the MHC locus are differentially methylated according to clinical outcome.
CpG Modules Associated with Clinical Activity Bear a Signature of T-Cell Activation.
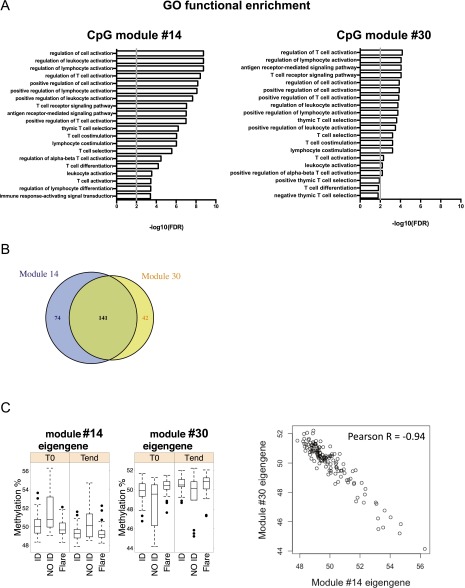
Next, we interrogated CpG modules for their functional significance. Of the five selected modules specifically associated with clinical outcome, modules #14 and #30 showed a remarkably similar functional enrichment profile (Fig. S2A). The reason for this similarity is that modules #14 and #30 shared most CpG sites (Fig. S2B) because of the almost perfect anticorrelation of their eigengenes (Fig. S2C). The degree of overlap between modules #14 and #30 was quite unique in this network, and underscores the dominance of two anticorrelated methylation patterns related to clinical activity; that is, higher (#14) or lower (#30) methylation in NO ID patients compared with ID patients and flares (Fig. 1B and Dataset S2).
Fig. S2.
CpG module #14 strongly overlaps with CpG module #30. (A) Functional enrichment analyses of CpG modules #14 (Left) and #30 (Right), both associated with the NO ID state but not with age or gender. The top 20 GO terms (FDR-adjusted P < 0.01) and the gene overlap between modules and GO categories are shown, ranked by P value. The gray vertical line indicates a threshold of FDR-adjusted P = 0.01. (B) Number of CpG sites uniquely belonging to or shared by modules #14 and #30. (C) Inverse correlation between the eigenegenes of CpG modules #14 and #30. In the box plots (Left), samples are aggregated by clinical activity. In the dot plot (Right), each point is a sample, regardless of clinical activity. In both plot types, the eigengene methylation level is shown.
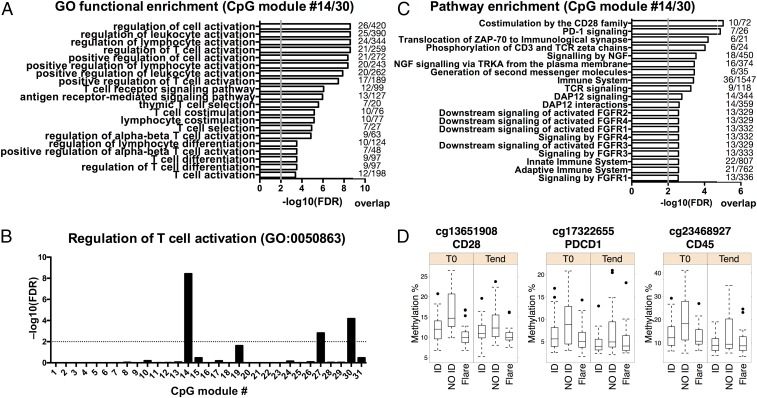
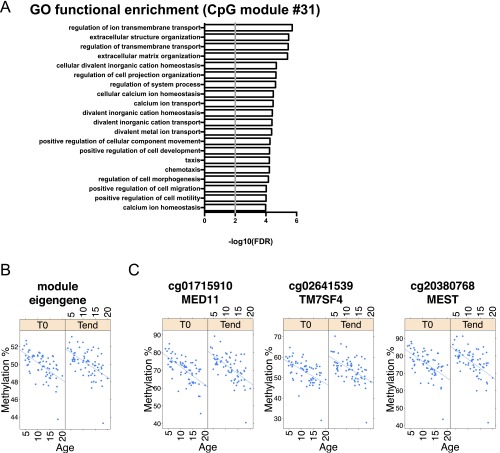
Because both modules #14 and #30 carry similar information, we focused on their union in all subsequent analyses. Importantly, not only were all of the enriched Gene Ontology (GO) terms of the merged modules #14 and #30 were immunologically relevant, but they were mostly related to T-cell activation, comprising genes such as GATA3, CXCR5, CCR7, CD5, IKZF1, ADORA2A, PRDM1, and CSK (Fig. 3A and Dataset S7). Modules #14 and #30 included multiple CpG sites for many of these genes, increasing confidence in our findings (Dataset S4). In contrast, modules predominantly associated with other variables, such as age, were enriched in GO terms related to fundamental, nonimmune functions of the cell (Fig. S3), demonstrating the specificity of the association of the T-cell activation signature with clinical outcome.
Fig. 3.
A CpG module associated with clinical activity bears a signature of T-cell activation. (A) Functional enrichment analysis of the merged CpG modules #14 and #30, associated with the NO ID state but not with gender or age. The top 20 enriched GO terms (FDR-adjusted P < 0.01) and the gene overlap between modules and GO categories are shown, ranked by P value. The gray vertical line indicates an FDR-adjusted P = 0.01. (B) FDR-adjusted P value for the GO term 0050863 across all CpG modules. The dashed line indicates an FDR-adjusted P = 0.01. (C) Pathway enrichment analysis of the merged CpG modules #14 and #30. The top 20 enriched Reactome terms (FDR-adjusted P < 0.01) and the gene overlap between modules and pathways are shown, ranked by P value. The gray vertical line indicates an FDR-adjusted P = 0.01. (D) Methylation percentage of three representative CpG sites from modules #14/#30.
Fig. S3.
A CpG module not associated with clinical activity is enriched in fundamental, nonimmune cell functions. (A) Functional enrichment analysis of the CpG module #31, mainly associated with age. The top 20 enriched GO terms (FDR-adjusted P < 0.01) are shown, ranked by P value. The black vertical line indicates an FDR-adjusted threshold of P = 0.01. (B and C) Percentage methylation of the prototypical module eigengene (B) and of three representative CpG sites (C) from module #31, in relation to age.
The enrichment of modules #14 and #30 in T-cell–related pathways was unparalleled, as demonstrated by an enrichment analysis for the GO term #0050863 (regulation of T-cell activation) across all modules (Fig. 3B). Therefore, we investigated which T-cell pathways were driving this GO classification. The top enriched pathways in modules #14 and #30 were related to TCR signaling and costimulation (Fig. 3 C and D) and comprised various CD3 subunits (D, E, G, and Z), ZAP70, LCK, CD28, CTLA4, PDCD1, and IL2RB (Dataset S8).
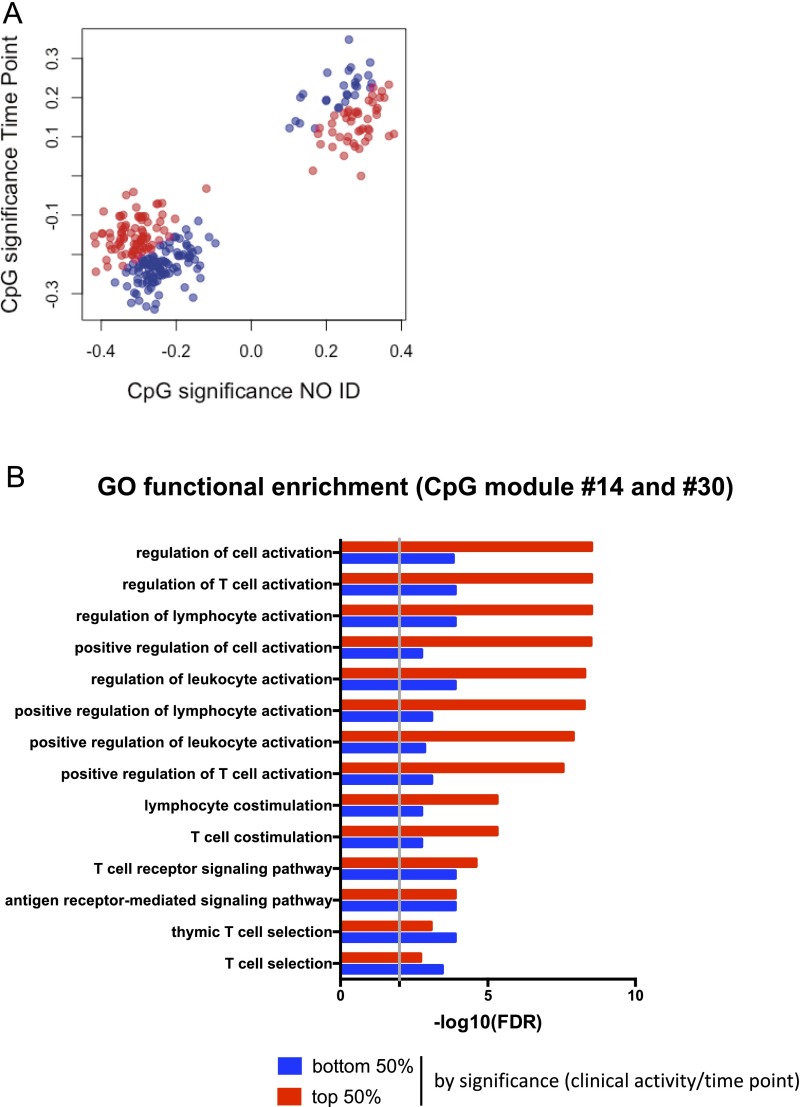
As noted above, CpG module #14 was associated with the time point, but to a lesser extent than clinical activity (the difference in FDR-adjusted P values is two orders of magnitude) (Dataset S2). Similarly, the association between module #30 and time point was only marginally not significant (FDR-adjusted P = 1.1e-1). Accordingly, significance analysis of individual CpG sites belonging to the modules #14 and #30 revealed stronger correlation with clinical activity than with time point (Fig. S4A). We set out to determine whether distinct functions were associated with clinical activity-correlated vs. time point-correlated CpG sites. However, because only 50 (of 257) CpG sites were more strongly associated with time point than clinical activity, no meaningful functional enrichment analysis could be performed. To bypass this limitation, we ranked the CpG sites based on the ratio between clinical activity and time-point significance, and then equally partitioned them into the top 50% (Fig. S4B, red) and bottom 50% (Fig. S4B, blue). Although the same pathways related to T-cell activation were found enriched in both partitions (Fig. S4B), the enrichment was much more significant for the subgroup more strongly associated with clinical activity.
Fig. S4.
Association of time point with CpG modules #14 and #30. (A) CpG significance analysis against for time point and clinical activity. (B) CpG sites were ranked by ratio between clinical activity and time-point significance, equally split into the top 50% (red) and the bottom 50% (blue), and the genes associated to each subgroup used for functional enrichment analysis. The union of the top 10 GO terms of each subgroup is shown, with the enrichment FDR-adjusted P value displayed separately for either subgroup.
In summary, epigenetic traits differ among patients with divergent clinical outcome and target genes involved in T-cell activation and T-cell receptor (TCR) signaling, suggesting that DNA methylation may actively modulate the mechanisms underlying responsiveness to therapy. In contrast, the contribution of the time point to the overall variance seems marginal.
DNA Methylation Is More Sensitive Than Gene Expression in Identifying the Signature of T-Cell Activation.
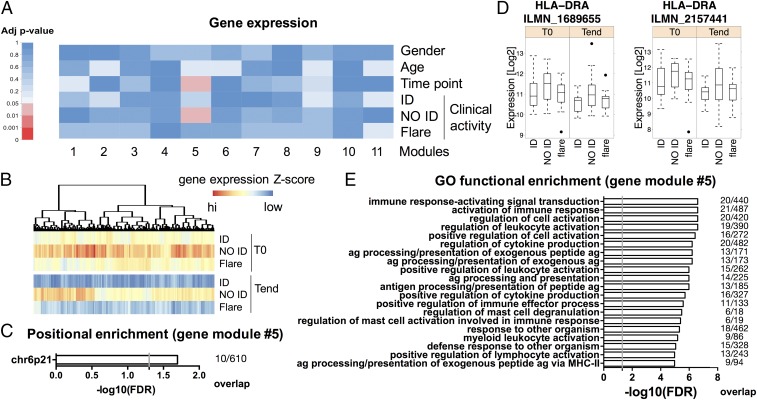
We were able to obtain sufficient high-quality RNA to investigate the transcriptional profile of 92% of the samples tested for DNA methylation (n = 63). We applied the same unbiased network analysis used for DNA methylation to whole-genome expression data, obtaining 11 modules. The number of genes per module is listed in Dataset S9. Among the identified gene modules, one (module #5) correlated with the NO ID state (FDR-adjusted P = 4.63e-2) (Fig. 4 A and B and Datasets S10 and S11).
Fig. 4.
The epigenetic signature of T-cell activation is confirmed by gene expression. CD4+ T cells were sorted from blood samples as in Fig. 1, and their transcriptome was analyzed. (A) Single RNA probes were first aggregated in modules based on their intercorrelation through a WGCNA, and then correlated with the demographic and clinical traits shown. FDR-adjusted correlation P values (adj P value) were color-coded according to the legend. (B) The median z-scored log abundance for each gene of module #5 (associated with the NO ID state) was color-coded according to the legend, and hierarchical clustering was performed to visualize patterns across clinical activity and time point. (C) Positional enrichment analysis of module #5. The enriched locations (FDR-adjusted P < 0.01) and the gene overlap between modules and location gene sets are shown, ranked by P value. The gray vertical line indicates an FDR-adjusted P = 0.05. (D) Methylation percentages of two HLA-DR probes from module #5, segregated by time point. (E) Functional enrichment analysis of module #5. The top 20 enriched GO terms (FDR-adjusted P < 0.01) and the gene overlap between modules and GO categories are shown, ranked by P value. The gray vertical line indicates an FDR-adjusted P = 0.05. n = 63.
When we investigated this module for positional enrichment, we found that the top hit (FDR-adjusted P < 0.05) was the cytogenetic location 6p21 (Fig. 4C), in line with our DNA methylation data. The expression of many MHC class II genes was increased in NO ID patients compared with both ID and flares (Dataset S12). This result was exemplified by HLA-DR expression (Fig. 4D). These findings are also in line with an activated phenotype of T cells and thus consistent with our results on DNA methylation. Indeed, HLA-DR is only expressed by human T cells upon stimulation (as first described in refs. 31 and 32 and exemplified in Fig. S5). Therefore, at least in this context, the relevance of the MHC locus for the disease seems to reside in its up-regulation on activated T cells, and is distinct from the influence of HLA polymorphism on genetic predisposition to disease.
Fig. S5.
Up-regulation of HLA-DR and CD86 upon T-cell activation. FACS-sorted CD4+ T cells were incubated with anti-CD3/anti-CD28–conjugated beads (bead:T cell = 1:10) for the indicated period before staining with CD86 and HLA-DR.
When we analyzed the GO classification of module #5, a number of immune cell activation pathways were enriched (Fig. 4E and Dataset S13), most of them driven by the up-regulation of MHC class II and another less-appreciated marker of T-cell activation, CD86 (33, 34) (Fig. S5).
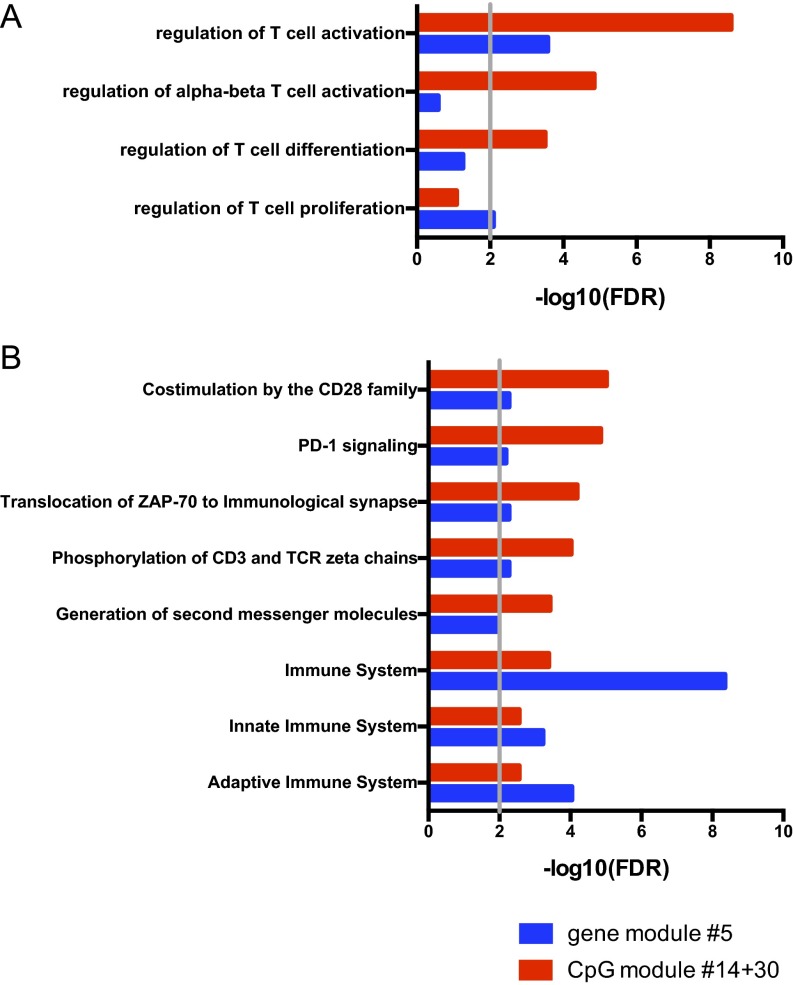
Although similar functions were revealed by both methylomics and transcriptomics, correlation of modules enriched for T-cell pathways with clinical activity was higher in the DNA methylation dataset (Figs. 1A and 4A). Indeed, CpG modules #14 and #30 showed stronger enrichment than gene module #5 for both GO (Fig. S6A) and Reactome (Fig. S6B) gene sets. The reasons behind the superior sensitivity of DNA methylation in identifying T-cell features associated with clinical outcome are elaborated in Discussion.
Fig. S6.
DNA methylation is more sensitive than RNA expression in exposing T-cell activation signatures. (A) Functional enrichment analysis of the merged CpG modules #14 and #30 vs. gene module #5 for the GO category #0050863 (regulation of T-cell activation) and its child terms. Compared with gene module #5, CpG modules #14/#30 exhibit stronger enrichment for T-cell–associated functions. (B) Pathway significance analysis of the merged CpG modules #14 and #30 vs. gene module #5 for Reactome pathways (top five in either ranking, but significantly enriched in both with an FDR-adjusted P value cut-off of 0.01, marked by the gray vertical line). CpG modules #14/#30 exhibit stronger enrichment for specific pathways critical for T-cell functions, while gene module #5 exhibits stronger enrichment only for generic immune-related terms.
The Signature of T-Cell Activation Is Confirmed by Flow Cytometry.
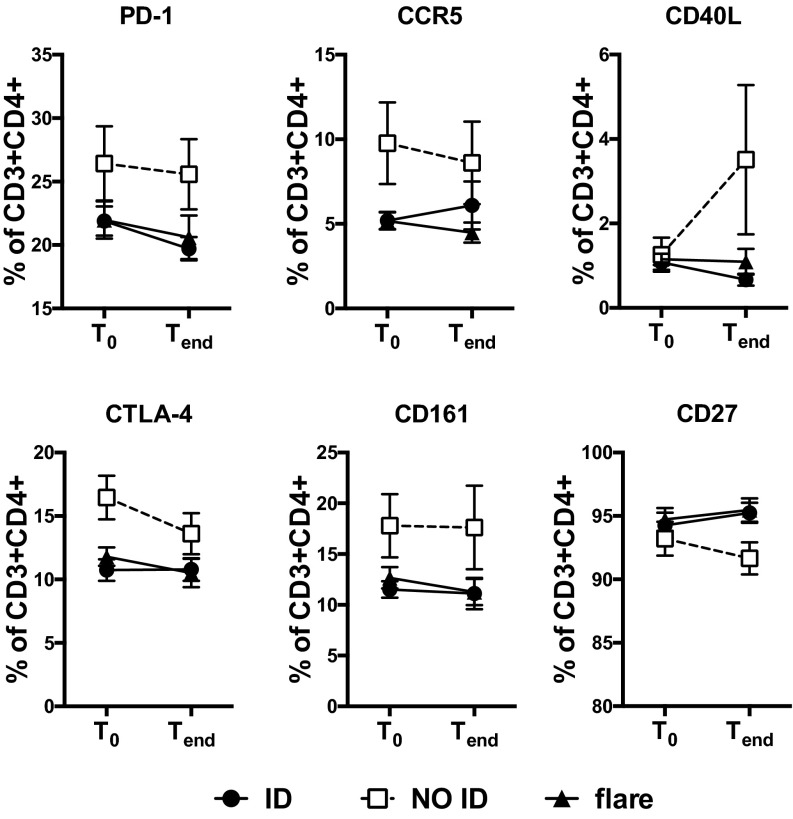
Analyzing protein expression might offer a more functionally relevant approach than RNA expression to validate our DNA methylation data. Therefore, we measured the abundance of proteins involved in T-cell activation by flow cytometry. Residual samples were sufficient for the analysis of one or more markers from up to 55 patients (81% of the samples). Importantly, despite the smaller number of samples available, we were able to validate the association of T-cell activation with clinical outcome. Indeed, the expression of several molecules involved in T-cell activation and costimulation were found to be elevated in NO ID patients compared with ID and flares (Fig. S7), confirming that the differential DNA methylation of genes related to T-cell activation observed in NO ID patients is associated with altered expression of the encoded proteins.
Fig. S7.
The epigenetic signature of T-cell activation is confirmed by flow cytometry. Differential marker expression within circulating CD4+ T cells of JIA patients, segregated by clinical activity and time point. n = 9–27 per group.
SI Materials and Methods
Clinical Definitions.
ID patients have no active joints, erythrocyte sedimentation rate within normal range of test unless not attributable to JIA, and physician’s global assessment of disease activity of equal to or less than 0.5 on a 0–10 scale (12). To be considered “flared,” the subject will have to demonstrate at least a 30% worsening in greater than or equal to three of the six JIA Core Set parameters with no more than one improving by >30% (10). The six JIA Core Set parameters are: (i) number of joints with active arthritis, (ii) number of joints with loss of motion, (iii) physician’s global assessment of current disease activity, (iv) patient/parent global assessment of overall disease severity in prior week, (v) a validated measure of physical function, and (vi) erythrocyte sedimentation rate. Patients meeting neither ID nor flare definitions were classified as NO ID.
Isolation and Cryopreservation of PBMCs.
EDTA-anticoagulated blood was transported at room temperature and processed within 24 h of withdrawal. PBMCs were separated by density gradient with Histopaque-1077 (Sigma-Aldrich) and then frozen in freezing medium [90% (vol/vol) FBS, 10% (vol/vol) DMSO]. Viability by Trypan blue exclusion was routinely above 95% before freezing and above 85% after thawing.
Cell Sorting and Flow Cytometry.
CD3+CD4+ T cells were sorted from thawed PBMCs using a FACSAria III (BD Biosciences). Doublets were excluded by gating on pulse height vs. width of the forward and side scatters. Dead cells were excluded with Sytox Red (Life Technologies). CD4dim monocytes were further excluded by gating out CD14+ cells. FcR blocking reagent (Miltenyi Biotec) was used to block Fc receptors before staining. Fluorochrome-conjugated antibodies were from BioLegend. Immunophenotyping samples were acquired with an LSRFortessa (BD Biosciences).
Methylomics and Transcriptomics.
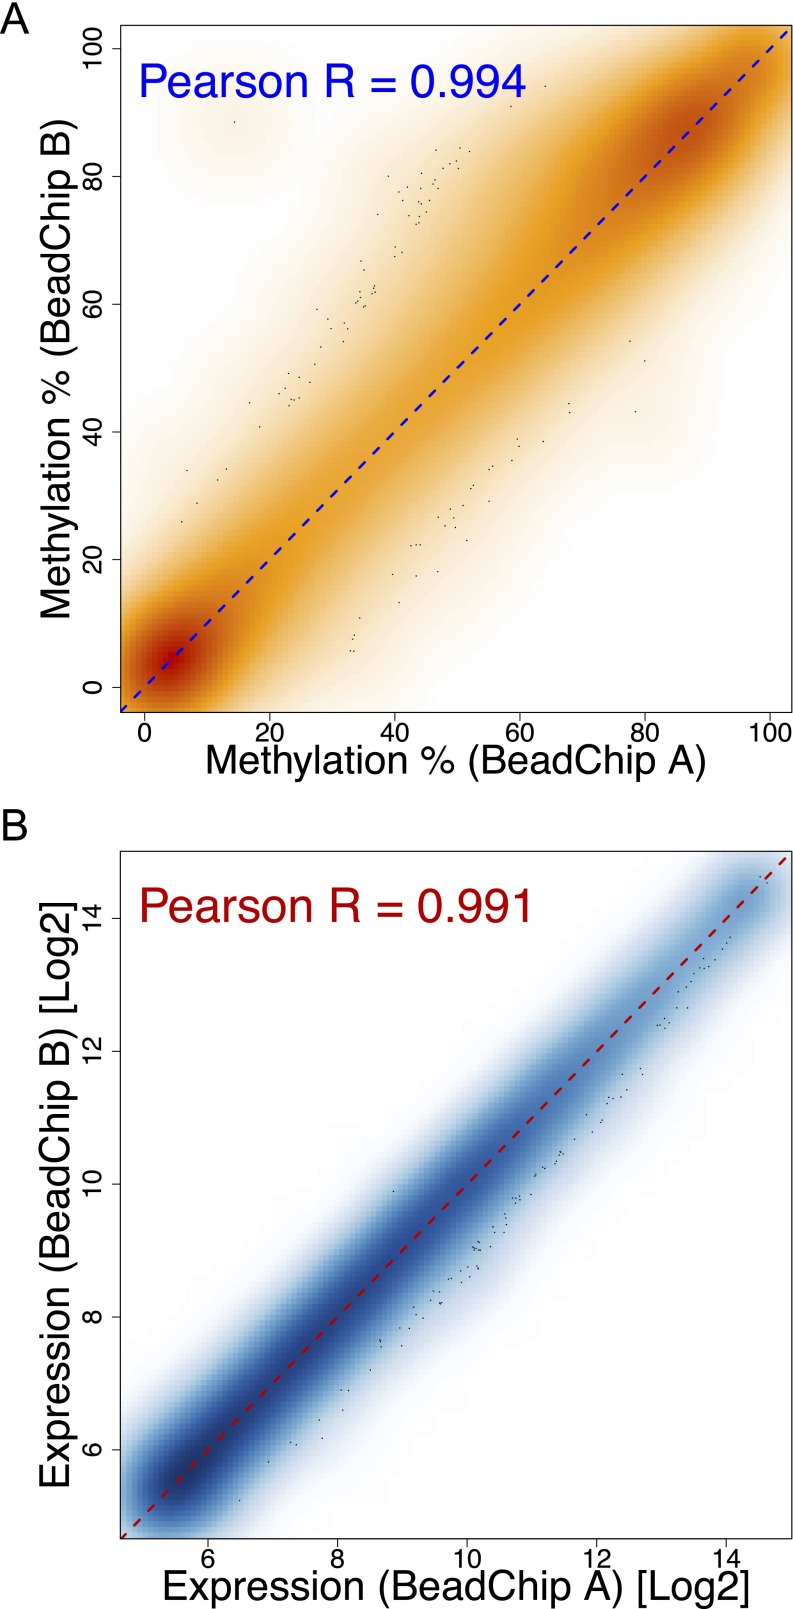
Genomic (g)DNA and RNA from sorted CD4+ T cells were extracted using the AllPrep DNA/RNA/miRNA Universal Isolation Kit (Qiagen). The minimum RNA integrity number obtained was 8, with a median of 8.7. Genome-wide DNA methylation was analyzed using Infinium HumanMethylation450 BeadChips (Illumina). Results from this platform are highly concordant with pyrosequencing (8, 37). Transcriptomes were analyzed using the HumanHT-12 v4 Expression BeadChips (Illumina). DNA and RNA were processed and hybridized to BeadChips according to the manufacturer’s instructions at The Southern California Genotyping Consortium (University of California, Los Angeles) in a single run to avoid batch effects. The same healthy control was run on different BeadChips to control for interchip variability (Fig. S8).
Fig. S8.
Negligible technical variability across DNA methylation and gene expression BeadChips. Density plot illustrating the correlation between percentage methylation (A) or log2 signal intensity of probes targeting expressed (detection P value < 0.05) genes (B) obtained from a healthy control sample run on two different Infinium HumanMethylation450 (A) or HumanHT-12 v4 (B) BeadChips.
Data Preprocessing.
All preprocessing steps were performed with R v3 and the packages minfi, limma, illuminaHumanv4.db, impute, and dplyr.
For DNA methylation, data were analyzed according to the recommended pipeline of the minfi package. All samples displayed comparable mean signal intensities. Data were background-subtracted and normalized in GenomeStudio (Illumina), then further processed with subset-quantile within array normalization, which normalizes Infinium type I and II probes together. We excluded probes targeting sex chromosomes or CH sites, and we imposed a detection P value threshold of 0.01. The detection P value is calculated by GenomeStudio by comparing the signal intensity (methylated probe intensity + unmethylated probe intensity) of a given CpG-targeting probe with the signal intensity of negative control probes. More than 99.8% of CpG sites passed this quality control step. If a CpG site showed unacceptable detection P values in more than 10% of samples, that CpG site was discarded entirely. Otherwise, missing values were imputed using the k-nearest neighbor averaging algorithm (42). We also excluded probes containing a SNP at the CpG interrogation point or at the single nucleotide extension (Illumina SNP table v1.2 based on dbSNP build 137). Finally, only probes with annotated genes were retained. After these filtering steps, 339,281 high-confidence CpG methylation measurements per sample were left for downstream analyses. The methylation levels β, which range from 0 (totally unmethylated) to 1 (completely methylated), were logit-transformed to M-values to mitigate the heteroscedasticity of β-values (43). Statistical analyses were performed on M-values, whereas results were visualized in figures as β-values, as they are easier to interpret. Hierarchical clustering of the top 500 CpG sites by variance across samples was performed using correlation-based distance and average linkage.
For RNA expression, data were analyzed according to the recommended pipeline of the limma package. Data were background-corrected and quantile-normalized, using negative control probes for background correction, and both negative and positive controls for normalization. Probes annotated as bad quality or no-match were excluded from analysis. Finally, only probes targeting expressed transcripts (detection P < 0.05) in at least 10% of samples were retained. After these filtering steps, 19,257 high-confidence probes were left for downstream analyses.
WGCNA.
The WGCNA framework allows the analysis of datasets of biological features (such as CpG methylation or mRNA abundance) holistically by taking into account the intrinsic correlation structure, which is otherwise disregarded by statistical tests that focus on individual features (a single CpG site or gene). WGCNA identifies modules of interconnected features using correlation, network analysis, and hierarchical clustering (20). Each module is summarized by an eigengene, which can be thought of as the (weighted) average profile of the biological features comprised in that module. Because the number of modules is much lower than that of the original features, and each module groups together “similar” features, WGCNA effectively reduces dimensionality, making -omics datasets more tractable. Moreover, interesting modules can be selected by correlating eigengenes with clinical traits.
First, a pairwise correlation matrix was computed using the biweight midcorrelation. Then, the correlation matrix was used to build a signed adjacency matrix. In this step, we used a power of 12, which was determined as suitable for both DNA methylation and gene-expression data according to the scale-free topology criterion (44). Raising correlations to a high power effectively implements soft-thresholding. Of note, weighted networks are highly robust with respect to the choice of the power parameter. From the adjacency matrix, a metric of network interconnectedness (topological overlap matrix), as well as its corresponding dissimilarity matrix, were computed. Finally, the dissimilarity matrix was used in hierarchical clustering (average linkage) with adaptive branch cutting (height = 0.35), which produces robust modules of coregulated CpG sites (or genes). Modules were required to group together at least 30 features. Features that could not be clustered into one of the modules were collectively assigned to a separate module.
Modules were then numbered and summarized by the eigengene, which is the first principal component of the standardized feature profiles across samples (25). Therefore, the eigengene captures the maximum amount of variation within each module. Each individual CpG site (or gene) was then correlated to the module eigengenes. The higher the absolute correlation (called eigengene-based connectivity), the closer the association of that biological feature to the module. Features were reassigned to a module if their connectivity with the eigengene passed a threshold of 0.6 (25). This strategy has the distinct advantage that CpG sites (or genes) are not constrained to a single module, but can instead exhibit multiple memberships (21). Features not correlating with any module were disregarded. The pattern of methylation (or expression) of individual CpG sites (or genes) belonging to a specific module is shown with heat maps. Median z-scored methylation levels (or transcript abundances) were hierarchically clustered using the Euclidean distance and Ward’s linkage. To select interesting modules, eigengenes were related to clinical traits by the Student asymptotic test for correlation (24), and P values were adjusted globally (i.e., across both modules and traits) according to Benjamini–Hochberg. In this step, categorical variables were recoded using a binary representation of each level (1 = examined level; 0 = any other level) (24). Modules significantly associated (FDR-adjusted P < 0.05) with clinical traits of interest were then used for further analysis. In selected figures, significance of individual CpG sites (Pearson correlation with clinical traits) is also reported.
WGCNA was performed with R v3 and the package WGCNA (20), and visualization were created with packages gplots and lattice.
Gene Set Analysis.
Modules showing statistically significant correlation (FDR-adjusted P < 0.05) with the clinical variable of interest were interrogated for positional and functional enrichment with EnrichR (45) (gene sets: Chromosome Location, Gene Ontology Biological Process, Reactome) using the official gene symbols associated with each CpG site (30) or gene probe, as defined by Illumina annotations.
Complete List of Investigators.
The complete list of investigators in the parent clinical trial “Determining Predictors of Safe Discontinuation of Anti-TNF Treatment in JIA” (ID: NCT00792233) is as follows: Janalee Taylor (Cincinnati Children's Hospital Medical Center), Hermine I. Brunner (Cincinnati Children's Hospital Medical Center), Jennifer L. Huggins (Cincinnati Children's Hospital Medical Center), James J. Nocton (Medical College of Wisconsin), Kathleen A. Haines (Hackensack University Medical Center, Joseph M. Sanzari Children's Hospital), Barbara S. Edelheit (Connecticut Children's Medical Center), Michael Shishov (Phoenix Children's Hospital), Lawrence K. Jung (Children's National Medical Center), Calvin B. Williams (The Steven and Alexandra Cohen Children's Medical Center of New York), Melissa S. Tesher (University of Chicago, Comer Children's Hospital), Denise M. Costanzo (Cleveland Clinic Foundations), Lawrence S. Zemel (Connecticut Children's Medical Center), Jason A. Dare (University of Arkansas for Medical Science), Murray H. Passo (Medical University of South Carolina), Kaleo C. Ede (Phoenix Children's Hospital), Judyann C. Olson (Medical College of Wisconsin), Elaine A. Cassidy (Children's Hospital of Pittsburgh), Thomas A. Griffin (Cincinnati Children's Hospital Medical Center), Linda Wagner-Weiner (University of Chicago, Comer Children's Hospital), Jennifer E.Weiss (Hackensack University Medical Center, Joseph M. Sanzari Children's Hospital), Larry B. Vogler (Emory University School of Medicine), Kelly A. Rouster-Stevens (Emory University School of Medicine), Timothy Beukelman (University of Alabama-Birmingham), Randy Q. Cron (University of Alabama-Birmingham), Daniel Kietz (Children's Hospital of Pittsburgh), Kara M. Schmidt (University of Louisville), Dawn M. Wahezi (Children's Hospital at Montefiore), JayMehta (Children's Hospital at Montefiore), Tracy V. Ting (Cincinnati Children's Hospital Medical Center), James W. Verbsky (Medical College of Wisconsin), Anne B. Eberhard (The Steven and Alexandra Cohen Children's Medical Center of New York), Bin Huang (Cincinnati Children's Hospital Medical Center), and Edward H. Giannini (Cincinnati Children's Hospital Medical Center).
Discussion
A long-standing goal in clinical JIA management is the ability to identify patients at high risk of disease relapse following anti-TNF treatment withdrawal to inform clinical decisions, and reduce the associated safety and cost concerns of long-term treatment in low-risk patients. We aimed to uncover the immunological mechanisms underlying the varying clinical responses to treatment withdrawal by studying differential DNA methylation of CD4+ T cells from JIA patients. We observed clear differences in the DNA methylation of immunologically relevant genes—particularly those involved in T-cell activation and TCR signaling—in patients with divergent clinical outcomes, which were not associated with age or gender.
There is accumulating evidence that epigenetics plays a role in RA pathogenesis. Differences in DNA methylation patterns of synovial fibroblasts (35–38) and PBMC/T cells (4, 5, 9) have been observed between RA patients and healthy controls. In JIA, differential methylation of CD4+ T cells has also been reported (6). However, studies on the association between epigenetics and persistence of clinical remission upon therapy withdrawal in arthritis (adult or juvenile) are limited. To our knowledge, our work is unique in proposing an epigenetic discrimination between clinical activity states. The identification of biomarkers of responsiveness to therapy and off-therapy maintenance of disease remission remains a long-standing unmet clinical need in the rheumatological community (19). Our work uncovers the potential of DNA methylation to identify changes to the epigenetic regulation of immunologically relevant genes in different disease activity states, and warrants larger association studies aiming at identifying predictive epigenetic biomarkers. In this regard, it is worth noting that the epigenetic features associated with clinical outcome were already visible at the time of therapy withdrawal, demonstrating that methylation changes precede—and thus might predict, or even cause—clinical manifestations. This predictive potential of DNA methylation is in line with the notion that epigenetic mechanisms regulate both the current state of the cell and its predisposition to respond to environmental cues in specified ways (39). In this context, it is worth mentioning that only minor associations were observed with the time point, suggesting that detectable longitudinal changes upon therapy withdrawal are sparse (but still linked to T-cell regulation).
Our data also point to a functional impact of DNA methylation on disease pathogenesis. Indeed, the CpG modules associated with clinical outcome also correlated with differential protein expression, and may thus actively regulate autoimmune activation. Consistent with this notion, the identified CpG modules were either enriched in genes located in the MHC locus, notoriously enriched in immune-related genes, or were involved in T-cell activation and costimulation. We recently identified a subset of circulating pathogenic-like T cells, which comprise highly activated, HLA-DR–expressing T-cell clonotypes recirculating through the inflamed synovium, that are enriched in the blood of NO ID compared with ID patients (40, 41). We speculate that the DNA methylation signature of heightened T-cell activation and increased HLA-DR expression in NO ID patients observed here may be driven by this cell subset. Future studies probing the methylome of purified circulating pathogenic-like T cells may be useful to understand their importance in disease pathogenesis and their responsiveness to therapy.
Whereas the DNA methylation signatures of the intermediate NO ID state differed from the other clinical outcomes (seven significantly different CpG modules), the signatures of ID patients and flares overlapped considerably. Given the relative stability of DNA methylation over time, it is conceivable that an acute event, such as a flare, would not allow sufficient time for methylation to be perturbed. Moreover, during flaring episodes, pathogenic cells extravasate rapidly to the peripheral tissues, where they participate in inflammation and damage. Therefore, it may be necessary to examine the epigenetic signature of flare within the inflamed tissue rather than in the circulation. By contrast, immune dysregulation occurring in NO ID patients is subtler and may not lead to the same mass migration of inflammatory cells to the joints, leaving a residual signature within the circulation that we were able to detect.
The association of RNA features with clinical outcome was noticeably weaker than that obtained using DNA methylation features (FDR-adjusted P = 4.63e-2 for gene module #5 vs. 2.29e-4 for CpG module #14). The 2-log difference in sensitivity is striking, especially when considering the different statistical power of the two analyses: although the number of samples tested was very similar between the two platforms (<8% difference), DNA methylation required a much stricter FDR correction because of the higher number of features tested (i.e., 31 vs. 11 modules). Our data indicate that DNA methylation profiling may be a more-sensitive discovery platform than gene-expression profiling. Several reasons might contribute to this differential performance. First, in contrast to RNA expression, which fluctuates rapidly in response to external cues, including both biological stimuli and technical manipulation, DNA methylation is more robust to perturbations (19). Thus, DNA methylation-based clinical diagnostic assays may be preferable, particularly in the context of multicenter clinical trials where transport and processing are likely to introduce confounding variation.
Second, only a small proportion of circulating cells are actively involved in disease perpetuation; thus, the small signal from these pathogenic cells becomes diluted within the noise generated by all other irrelevant CD4+ T cells. In this respect, DNA methylation is superior to gene-expression profiles in uncovering rare cell contributions from complex samples for at least two reasons: (i) DNA methylation is binary (at each allele, a single CpG dinucleotide is either methylated or not), and even at a population level, its distribution usually remains bimodal (i.e., most CpG sites are either hypomethylated or hypermethylated), whereas RNA expression patterns are complex, varying from cell to cell; (ii) each cell contributes equally to the bulk DNA methylation levels as DNA content is equal in all cells, whereas a few outlier cells with higher transcript abundance dominate bulk gene-expression measurements, skewing the population mean. The combined effect of these two components is that the effect of a rare cell subset on the bulk DNA methylation measurement of the mixed population is linearly proportional to their relative abundance. In contrast, the contribution of the same rare cell subset may be easily masked in gene-expression profiling. Because we expect that only a few circulating cells are contributing to the clinical outcome, most differences could be picked up more efficiently by DNA methylation than by gene expression. Consistently, we were able to identify only a few T-cell activation markers by gene expression, such as HLA-DR/MHC class II and CD86, whose expression in T cells is digital (absent in resting T cells, induced upon stimulation); similar to DNA methylation features, binary expression profiles are easier to detect in population measurements. In contrast, most other activation markers show subtler changes; unlike digital expression, differences in analog expression are hard to detect by bulk measurements. This limitation might be mitigated by single-cell transcriptome analyses or by switching to other single-cell techniques, such as flow cytometry. In line with this notion, flow cytometric analysis of key T-cell activation markers showed strong correlation with the DNA methylation data.
Of note, the contribution of rare cell populations in unsegregated samples might be further masked by the common practice of thresholding on arbitrary minimum differences (usually 10% for DNA methylation and twofold change for gene expression). Although this strategy is useful when analyzing homogenous samples (e.g., cell lines), it may be inappropriate for clinical samples, such as those studied here, that are unlikely to reach this threshold as a result of the low prevalence of disease-relevant cells.
In conclusion, our data demonstrate that the DNA methylome yields both diagnostically and mechanistically relevant information for maintenance vs. loss of inactive disease in JIA, and provide a blueprint for future large-scale validation studies.
Materials and Methods
We used samples form 68 randomly selected patients recruited in the trial “Determining Predictors of Safe Discontinuation of Anti-TNF Treatment in JIA” (ID: NCT00792233) (Dataset S1). Our study was approved by the Sanford–Burnham Medical Research Center Institutional Review Board. All patients/parents signed assent/consent forms for participation in this study. At baseline (T0), patients were in clinical remission on medication: that is, they maintained ID (12) for at least 6 mo under treatment (anti-TNF). Therapy was withdrawn for 8 mo, after which (Tend) patients were stratified by clinical activity in patients maintaining ID or NO ID. Flares (10) were tested at the time of flare (Tend), and therapy was then reintroduced.
Additional experimental procedures, clinical definitions, and analytical strategies are available in the SI Materials and Methods.
Supplementary Material
Acknowledgments
The authors thank Xiayu Stacy Huang (Bioinformatics & Data Management Core, Sanford-Burnham Medical Research Institute) for preliminary statistical analyses, and Kerry McLaughlin of Insight Editing London for critical review of the manuscript. We also thank all the coinvestigators of the clinical trial “Determining Predictors of Safe Discontinuation of Anti-TNF Treatment in JIA” (ID: NCT00792233). This work was supported in part by National Medical Research Council, Singapore Grants NMRC/STaR/020/2013, NMRC/MOHIAFCAT2/005/2015, MOHIAFCAT2001, NMRC/CIRG/1383/2014, and NMRC MOHIAFCAT1-6003; and the Duke–National University of Singapore Medical School Singapore and Agency for Science and Technology–Biomedical Research Council Grant SPF2014/005.
Footnotes
The authors declare no conflict of interest.
This article is a PNAS Direct Submission.
Data deposition: The data reported in this paper have been deposited in the Gene Expression Omnibus (GEO) database, www.ncbi.nlm.nih.gov/geo (accession no. GSE89253).
This article contains supporting information online at www.pnas.org/lookup/suppl/doi:10.1073/pnas.1524056113/-/DCSupplemental.
References
- 1.Prakken B, Albani S, Martini A. Juvenile idiopathic arthritis. Lancet. 2011;377(9783):2138–2149. doi: 10.1016/S0140-6736(11)60244-4. [DOI] [PubMed] [Google Scholar]
- 2.Prahalad S, et al. Twins concordant for juvenile rheumatoid arthritis. Arthritis Rheum. 2000;43(11):2611–2612. doi: 10.1002/1529-0131(200011)43:11<2611::AID-ANR33>3.0.CO;2-T. [DOI] [PubMed] [Google Scholar]
- 3.Ballestar E. Epigenetic alterations in autoimmune rheumatic diseases. Nat Rev Rheumatol. 2011;7(5):263–271. doi: 10.1038/nrrheum.2011.16. [DOI] [PubMed] [Google Scholar]
- 4.Liu CC, et al. Global DNA methylation, DNMT1, and MBD2 in patients with rheumatoid arthritis. Immunol Lett. 2011;135(1-2):96–99. doi: 10.1016/j.imlet.2010.10.003. [DOI] [PubMed] [Google Scholar]
- 5.Glossop JR, et al. Genome-wide DNA methylation profiling in rheumatoid arthritis identifies disease-associated methylation changes that are distinct to individual T- and B-lymphocyte populations. Epigenetics. 2014;9(9):1228–1237. doi: 10.4161/epi.29718. [DOI] [PMC free article] [PubMed] [Google Scholar]
- 6.Javierre BM, et al. Changes in the pattern of DNA methylation associate with twin discordance in systemic lupus erythematosus. Genome Res. 2010;20(2):170–179. doi: 10.1101/gr.100289.109. [DOI] [PMC free article] [PubMed] [Google Scholar]
- 7.Coit P, et al. Renal involvement in lupus is characterized by unique DNA methylation changes in naïve CD4+ T cells. J Autoimmun. 2015;61:29–35. doi: 10.1016/j.jaut.2015.05.003. [DOI] [PMC free article] [PubMed] [Google Scholar]
- 8.Ellis JA, et al. Genome-scale case-control analysis of CD4+ T-cell DNA methylation in juvenile idiopathic arthritis reveals potential targets involved in disease. Clin Epigenetics. 2012;4(1):20. doi: 10.1186/1868-7083-4-20. [DOI] [PMC free article] [PubMed] [Google Scholar]
- 9.Liu Y, et al. Epigenome-wide association data implicate DNA methylation as an intermediary of genetic risk in rheumatoid arthritis. Nat Biotechnol. 2013;31(2):142–147. doi: 10.1038/nbt.2487. [DOI] [PMC free article] [PubMed] [Google Scholar]
- 10.Lovell DJ, et al. Pediatric Rheumatology Collaborative Study Group Etanercept in children with polyarticular juvenile rheumatoid arthritis. N Engl J Med. 2000;342(11):763–769. doi: 10.1056/NEJM200003163421103. [DOI] [PubMed] [Google Scholar]
- 11.Wallace CA, et al. Childhood Arthritis and Rheumatology Research Alliance Trial of early aggressive therapy in polyarticular juvenile idiopathic arthritis. Arthritis Rheum. 2012;64(6):2012–2021. doi: 10.1002/art.34343. [DOI] [PMC free article] [PubMed] [Google Scholar]
- 12.Wallace CA, Ruperto N, Giannini E. Childhood Arthritis and Rheumatology Research Alliance Pediatric Rheumatology International Trials Organization Pediatric Rheumatology Collaborative Study Group Preliminary criteria for clinical remission for select categories of juvenile idiopathic arthritis. J Rheumatol. 2004;31(11):2290–2294. [PubMed] [Google Scholar]
- 13.Macaubas C, Nguyen K, Milojevic D, Park JL, Mellins ED. Oligoarticular and polyarticular JIA: Epidemiology and pathogenesis. Nat Rev Rheumatol. 2009;5(11):616–626. doi: 10.1038/nrrheum.2009.209. [DOI] [PMC free article] [PubMed] [Google Scholar]
- 14.Farh KK, et al. Genetic and epigenetic fine mapping of causal autoimmune disease variants. Nature. 2015;518(7539):337–343. doi: 10.1038/nature13835. [DOI] [PMC free article] [PubMed] [Google Scholar]
- 15.Paul DS, Beck S. Advances in epigenome-wide association studies for common diseases. Trends Mol Med. 2014;20(10):541–543. doi: 10.1016/j.molmed.2014.07.002. [DOI] [PMC free article] [PubMed] [Google Scholar]
- 16.Cohen CJ, et al. Human Th1 and Th17 cells exhibit epigenetic stability at signature cytokine and transcription factor loci. J Immunol. 2011;187(11):5615–5626. doi: 10.4049/jimmunol.1101058. [DOI] [PubMed] [Google Scholar]
- 17.Thomas RM, Gamper CJ, Ladle BH, Powell JD, Wells AD. De novo DNA methylation is required to restrict T helper lineage plasticity. J Biol Chem. 2012;287(27):22900–22909. doi: 10.1074/jbc.M111.312785. [DOI] [PMC free article] [PubMed] [Google Scholar]
- 18.Wilson CB, Rowell E, Sekimata M. Epigenetic control of T-helper-cell differentiation. Nat Rev Immunol. 2009;9(2):91–105. doi: 10.1038/nri2487. [DOI] [PubMed] [Google Scholar]
- 19.Plant D, Wilson AG, Barton A. Genetic and epigenetic predictors of responsiveness to treatment in RA. Nat Rev Rheumatol. 2014;10(6):329–337. doi: 10.1038/nrrheum.2014.16. [DOI] [PubMed] [Google Scholar]
- 20.Langfelder P, Horvath S. WGCNA: An R package for weighted correlation network analysis. BMC Bioinformatics. 2008;9:559. doi: 10.1186/1471-2105-9-559. [DOI] [PMC free article] [PubMed] [Google Scholar]
- 21.Voineagu I, et al. Transcriptomic analysis of autistic brain reveals convergent molecular pathology. Nature. 2011;474(7351):380–384. doi: 10.1038/nature10110. [DOI] [PMC free article] [PubMed] [Google Scholar]
- 22.Hawrylycz MJ, et al. An anatomically comprehensive atlas of the adult human brain transcriptome. Nature. 2012;489(7416):391–399. doi: 10.1038/nature11405. [DOI] [PMC free article] [PubMed] [Google Scholar]
- 23.Xue Z, et al. Genetic programs in human and mouse early embryos revealed by single-cell RNA sequencing. Nature. 2013;500(7464):593–597. doi: 10.1038/nature12364. [DOI] [PMC free article] [PubMed] [Google Scholar]
- 24.Montoya D, et al. IL-32 is a molecular marker of a host defense network in human tuberculosis. Sci Transl Med. 2014;6(250):250ra114. doi: 10.1126/scitranslmed.3009546. [DOI] [PMC free article] [PubMed] [Google Scholar]
- 25.Langfelder P, Horvath S. Eigengene networks for studying the relationships between co-expression modules. BMC Syst Biol. 2007;1:54. doi: 10.1186/1752-0509-1-54. [DOI] [PMC free article] [PubMed] [Google Scholar]
- 26.Eckhardt F, et al. DNA methylation profiling of human chromosomes 6, 20 and 22. Nat Genet. 2006;38(12):1378–1385. doi: 10.1038/ng1909. [DOI] [PMC free article] [PubMed] [Google Scholar]
- 27.Boks MP, et al. The relationship of DNA methylation with age, gender and genotype in twins and healthy controls. PLoS One. 2009;4(8):e6767. doi: 10.1371/journal.pone.0006767. [DOI] [PMC free article] [PubMed] [Google Scholar]
- 28.Christensen BC, et al. Aging and environmental exposures alter tissue-specific DNA methylation dependent upon CpG island context. PLoS Genet. 2009;5(8):e1000602. doi: 10.1371/journal.pgen.1000602. [DOI] [PMC free article] [PubMed] [Google Scholar]
- 29.Reynolds LM, et al. Age-related variations in the methylome associated with gene expression in human monocytes and T cells. Nat Commun. 2014;5:5366. doi: 10.1038/ncomms6366. [DOI] [PMC free article] [PubMed] [Google Scholar]
- 30.Horvath S, et al. Aging effects on DNA methylation modules in human brain and blood tissue. Genome Biol. 2012;13(10):R97. doi: 10.1186/gb-2012-13-10-r97. [DOI] [PMC free article] [PubMed] [Google Scholar]
- 31.DeWolf WC, Schlossman SF, Yunis EJ. DRw antisera react with activated T cells. J Immunol. 1979;122(5):1780–1784. [PubMed] [Google Scholar]
- 32.Ko HS, Fu SM, Winchester RJ, Yu DT, Kunkel HG. Ia determinants on stimulated human T lymphocytes. Occurrence on mitogen- and antigen-activated T cells. J Exp Med. 1979;150(2):246–255. doi: 10.1084/jem.150.2.246. [DOI] [PMC free article] [PubMed] [Google Scholar]
- 33.Jeannin P, et al. Human effector memory T cells express CD86: A functional role in naive T cell priming. J Immunol. 1999;162(4):2044–2048. [PubMed] [Google Scholar]
- 34.Paine A, et al. IL-2 upregulates CD86 expression on human CD4(+) and CD8(+) T cells. J Immunol. 2012;188(4):1620–1629. doi: 10.4049/jimmunol.1100181. [DOI] [PubMed] [Google Scholar]
- 35.Richardson B, et al. Evidence for impaired T cell DNA methylation in systemic lupus erythematosus and rheumatoid arthritis. Arthritis Rheum. 1990;33(11):1665–1673. doi: 10.1002/art.1780331109. [DOI] [PubMed] [Google Scholar]
- 36.Karouzakis E, Gay RE, Michel BA, Gay S, Neidhart M. DNA hypomethylation in rheumatoid arthritis synovial fibroblasts. Arthritis Rheum. 2009;60(12):3613–3622. doi: 10.1002/art.25018. [DOI] [PubMed] [Google Scholar]
- 37.Nakano K, Whitaker JW, Boyle DL, Wang W, Firestein GS. DNA methylome signature in rheumatoid arthritis. Ann Rheum Dis. 2013;72(1):110–117. doi: 10.1136/annrheumdis-2012-201526. [DOI] [PMC free article] [PubMed] [Google Scholar]
- 38.de la Rica L, et al. Identification of novel markers in rheumatoid arthritis through integrated analysis of DNA methylation and microRNA expression. J Autoimmun. 2013;41:6–16. doi: 10.1016/j.jaut.2012.12.005. [DOI] [PubMed] [Google Scholar]
- 39.Winter DR, Amit I. The role of chromatin dynamics in immune cell development. Immunol Rev. 2014;261(1):9–22. doi: 10.1111/imr.12200. [DOI] [PubMed] [Google Scholar]
- 40.Rossetti M, et al. TCR repertoire sequencing identifies synovial Treg cell clonotypes in the bloodstream during active inflammation in human arthritis. Ann Rheum Dis. June 16, 2016 doi: 10.1136/annrheumdis-2015-208992. [DOI] [PMC free article] [PubMed] [Google Scholar]
- 41.Spreafico R, et al. A circulating reservoir of pathogenic-like CD4+ T cells shares a genetic and phenotypic signature with the inflamed synovial micro-environment. Ann Rheum Dis. 2016;75(2):459–465. doi: 10.1136/annrheumdis-2014-206226. [DOI] [PMC free article] [PubMed] [Google Scholar]
- 42.Hastie T, et al. 1999 Imputing missing data for gene expression arrays. Available at www.web.stanford.edu/∼hastie/Papers/missing.pdf. Accessed October 1, 2015.
- 43.Du P, et al. Comparison of Beta-value and M-value methods for quantifying methylation levels by microarray analysis. BMC Bioinformatics. 2010;11:587. doi: 10.1186/1471-2105-11-587. [DOI] [PMC free article] [PubMed] [Google Scholar]
- 44.Barabási AL, Bonabeau E. Scale-free networks. Sci Am. 2003;288(5):60–69. doi: 10.1038/scientificamerican0503-60. [DOI] [PubMed] [Google Scholar]
- 45.Chen EY, et al. Enrichr: interactive and collaborative HTML5 gene list enrichment analysis tool. BMC Bioinformatics. 2013;14:128. doi: 10.1186/1471-2105-14-128. [DOI] [PMC free article] [PubMed] [Google Scholar]
Associated Data
This section collects any data citations, data availability statements, or supplementary materials included in this article.


