Significance
We successfully achieve unprecedentedly deep levels of supersaturation (S ∼ 4.1) with KH2PO4 (KDP) solutions by using a newly developed device that combines electrostatic levitation with Raman and X-ray scattering. Our study reveals two interesting phenomena. One is an existence of two different solution states, that is, low-concentration KDP solution (LCS) and high-concentration KDP solution (HCS). The other is an emergence of different crystallization paths that depend on the degree of supersaturation: (i) LCS to stable KDP crystal (tetrahedral structure), (ii) LCS to HCS to a metastable KDP crystal (monoclinic structure) to stable KDP crystal. This is a direct in situ observation of multiple pathways of nucleation in aqueous solution.
Keywords: multipath nucleation, liquid-droplet levitation, supersaturation, in situ X-ray diffraction, in situ micro-Raman spectroscopy
Abstract
Solution studies have proposed that crystal nucleation can take more complex pathways than previously expected in classical nucleation theory, such as formation of prenucleation clusters or densified amorphous/liquid phases. These findings show that it is possible to separate fluctuations in the different order parameters governing crystal nucleation, that is, density and structure. However, a direct observation of the multipathways from aqueous solutions remains a great challenge because heterogeneous nucleation sites, such as container walls, can prevent these paths. Here, we demonstrate the existence of multiple pathways of nucleation in highly supersaturated aqueous KH2PO4 (KDP) solution using the combination of a containerless device (electrostatic levitation), and in situ micro-Raman and synchrotron X-ray scattering. Specifically, we find that, at an unprecedentedly deep level of supersaturation, a high-concentration KDP solution first transforms into a metastable crystal before reaching stability at room temperature. However, a low-concentration solution, with different local structures, directly transforms into the stable crystal phase. These apparent multiple pathways of crystallization depend on the degree of supersaturation.
Nucleation is the first step toward crystallization, in which atoms or particles aggregate to form clusters in a metastable liquid, called crystal nuclei. The crystal nuclei in metastable liquid grow continuously if their size exceeds a critical limit, and are subsequently stabilized. Based on the classical nucleation theory (CNT) (1, 2), nucleation is mainly governed by two factors, that is, interfacial free energy and volume Gibbs free energy (or chemical potential) between liquid and crystal phases. Although the volume Gibbs free energy acts to stabilize the crystal nuclei, the interfacial free energy works as an energy barrier preventing the formation of the nuclei. If the crystal–liquid interfacial free energy creates a sufficiently high energy barrier, the liquid can be supercooled, supersaturated, or even supercompressed. In case of liquid metals (3–6), the crystal–liquid interfacial free energy arises from configurational entropy differences between crystal and liquid. That is, the greater difference in local structural orderings between crystal and liquid phases results in higher interfacial free energy, which consequently leads to a higher nucleation barrier and thus deeper supercooling. This concept has been verified in various metallic systems for elements (7) and many alloys (8–12). However, many experimental and theoretical investigations have raised questions that CNT may not be adequate to describe the initial nucleation processes in biomaterials (13–17) and minerals (18–26).
Recently, an alternate nucleation mechanism, called multipathway nucleation (or crystallization) (13–23, 25, 26), has been proposed for supersaturated solutions. In this model, nucleation does not take place directly from solutions, but instead may take intermediate steps, such as forming prenucleation clusters and even a dense liquid (or an amorphous) state in the solution. In particular, the formation of a dense liquid cluster in the supersaturated solution carries important implications; in contrast to CNT in which density and structural fluctuations usually occur simultaneously, those fluctuations in a metastable phase are separated upon nucleating (13, 16, 18, 21). This process is called two-step nucleation (TSN). The TSN phenomenon has been often observed in protein- and mineral-based materials where the density fluctuation precedes the structural counterpart due to liquid–liquid (L–L) separation (13, 16, 18, 21). This raises crucial questions. First, how can the dense liquids be achieved if there is no L–L separation? Second, by how much does the liquid need to be densified to observe the TSN? Last, if the TSN occurs under such a dense liquid environment, is the nucleation process in the low supersaturation regimes the same as in the highly supersaturated? For the first two questions, one could attempt to manifest the dense liquid by achieving a highly supersaturated or deeply supercooled solution that provides favorable conditions for near-homogenous nucleation. The last question can be addressed by monitoring the nucleation process in a bulk solution at different regimes of supersaturation.
Although the suggested concept for nucleation (i.e., TSN) in solutions is plausible and supported by experiments (1–11, 14–16, 21–26) and simulation (13) that incorporate the idea of phase separation, direct answers to the above questions still remain elusive. Such phenomena are often difficult to observe and confirm experimentally due to stochastic and fluctuating behavior of the nucleation, small sizes of nuclei (typically less than a few nanometers), and short lifetime of the metastable liquid and crystal phases. Moreover, container walls retaining the solutions provide unavoidable heterogeneous nucleation sites hindering deep supersaturation. Ultimately, these obstacles have prevented direct studies of the homogeneous nucleation mechanisms and the correct interpretation of the results with CNT. Motivated by these questions and technical challenges, we have developed an instrument that integrates a containerless device based on the electrostatic levitation (ESL) with in situ micro-Raman and X-ray scattering apparatus. Although there have been previous efforts to combine levitation techniques [acoustic (27, 28) and electrodynamic levitation (29, 30)], various technical limitations such as the presence of strong acoustic pressures or very small sample sizes may have hindered direct observation of the spontaneous nucleation at the deepest level of supersaturation.
We demonstrate an unprecedented degree of supersaturation with KH2PO4 (KDP) aqueous solution, which is more than three times over previously reported values (31–39) (Table S1) by using the solution ESL apparatus. A crystal–solution interfacial free energy value estimated by CNT was also found to be much greater than previously reported (31–36, 38). In addition, we measure two distinctive probability distributions for the nucleation events as a function of supersaturation, which implies a possible existence of two different solution states. Surprisingly, in situ micro-Raman and synchrotron X-ray scattering measurements reveal that the local structure of the highly supersaturated solution indeed differs from the one at low supersaturation. We observe two different pathways of KDP crystal formation at room temperature. A new metastable monoclinic KDP crystal can be formed in the highly supersaturated solution, which subsequently transforms into a stable tetragonal KDP crystal phase. On the other hand, the stable tetragonal KDP crystal can be directly formed in the solution at relatively low supersaturation.
Table S1.
Reported values of the KDP crystal/liquid interfacial free energy
| Temperature, °C | σ, mJ/m2 | Method | Ref. |
| 25 (S = 4.1) | 39.7 ± 1.3* | Containerless (ESL) | This study |
| 60 | 4.848 | Container (TRM) | (31) |
| 40 | 1.9 | Container (TRM) | (32) |
| 30 (S = 1.1∼1.9) | 5.915 | Container (TRM) | (33) |
| 30 | 2.4 | Container (TRM) | (34) |
| 45 (S = 1.1∼1.8) | 1.8 | ||
| 30 (S = 1.7∼1.95) | 12.9 ± 0.5 (24.8*) | Container (TRM) | (35) |
| 40 (S = 1.5∼1.65) | 11.9 ± 0.6 | ||
| 35 (S = 1.2∼1.5) | 16.87 (17*) | Container (TRM) | (36) |
| 12 | Container (TRM) | (38) | |
| 25 (S = 1.1) | 13 | Container (TRM) | (39) |
| 24 | Theory | (39) |
TRM, temperature reduction method.
Values are obtained by ESL in the present study.
Results
High Supersaturation by Electrostatic Levitation.
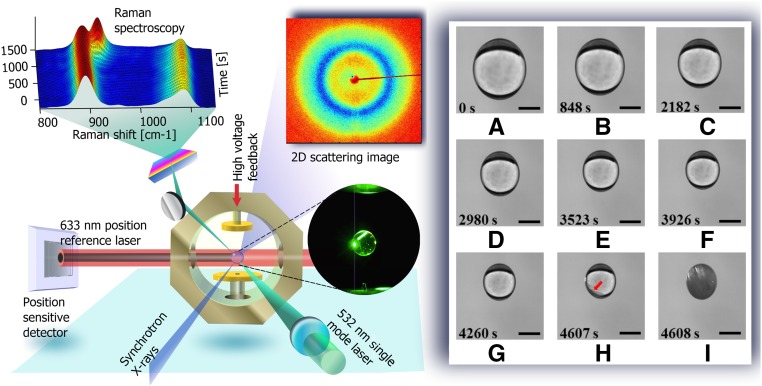
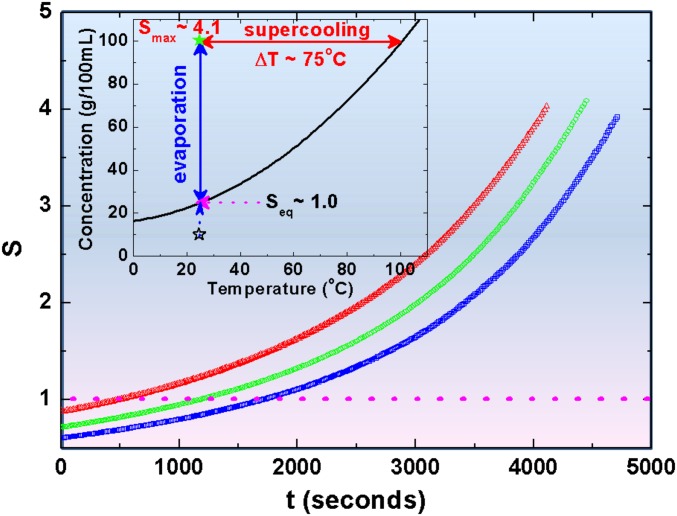
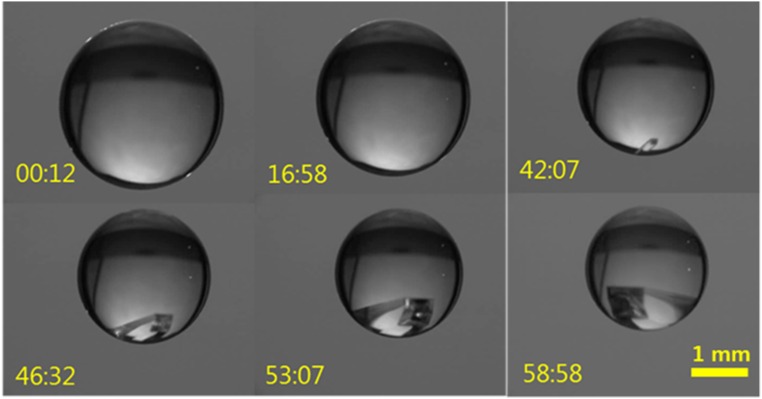
An undersaturated solution droplet is levitated between two electrodes by injection of the solution via a syringe (Fig. 1, Left and Fig. S1). The droplet becomes supersaturated via evaporation as shown in Fig. 1 (Right) at an ambient temperature of 25 ± 0.2 °C and relative humidity of 42 ± 2%. Here, we assumed that only water evaporates during the levitation as the initial and final KDP solute masses differ by less than 3%. Fig. 2 shows representative supersaturation curves as a function of time for different initial concentrations. (See Supersaturation Ratio Measurement, Figs. S2–S4 for detail.) When the supersaturation, S = C/Ce (Ce is the concentration of a solution), reaches 4.1, the droplet solidifies within 1 s (Fig. 1 H and I, and Movie S1), which is referred as “crystal I.” The crystallization also often takes longer than a few seconds at relatively lower levels of supersaturation and is referred to as “crystal II” (Movie S2). If such levels of supersaturation were achieved by supercooling, rather than evaporation, a supercooling of 75 K from 393 K would be required for a concentration of 100 g/100 mL (Fig. 2, Inset). It corresponds to about 20% of the degree of supercooling, which is close to a homogenous nucleation limit for liquid metals (40).
Fig. 1.
(Left) Schematics of ESL apparatus combined with real time in situ micro-Raman and X-ray scattering. A reference laser beam (632.8 nm, 1 mW) incidents on a liquid droplet casting a circular shadow on a position-sensitive detector (PSD). (Right) The levitated KDP solution droplet is prepared at an initial concentration of 20 g/100 mL and undergoes supersaturation (A ∼ I) as it evaporates at a rate of 2.92 × 10⁻⁴ mm2/s. During the evaporation, the diameter of the droplet shrinks from 2.5 to 1.25 mm. The contactless environment enables unprecedentedly high degree of supersaturation (S ∼ 4.1) where a very rapid crystallization can be observed within 1 s (H ∼ I). (Scale bar: 1 mm.)
Fig. S1.
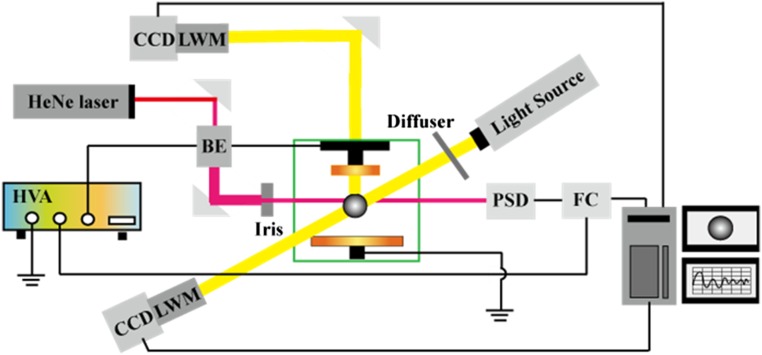
ESL apparatus. BE, beam expander; FC, feedback control unit; HVA, high-voltage amplifier; LWM, zoom lens (5× magnification; working distance of 30 cm); PSD, position-sensitive detector.
Fig. 2.
Representative saturation curves of KDP solutions for different initial concentrations (blue, 15 g/100 mL; green, 18 g/100 mL; red, 22 g/100 mL). We confirm that all curves have almost the same evaporation rate (Supersaturation Ratio Measurement). The evaporation rate is 2.92 × 10⁻⁴ mm2/s with an experimental uncertainty of ±0.31 × 10⁻⁴ mm2/s. (Inset) Solubility curve of KDP (tetragonal structure): the highest supersaturation corresponds to supercooling the droplet by 75 K.
Fig. S2.
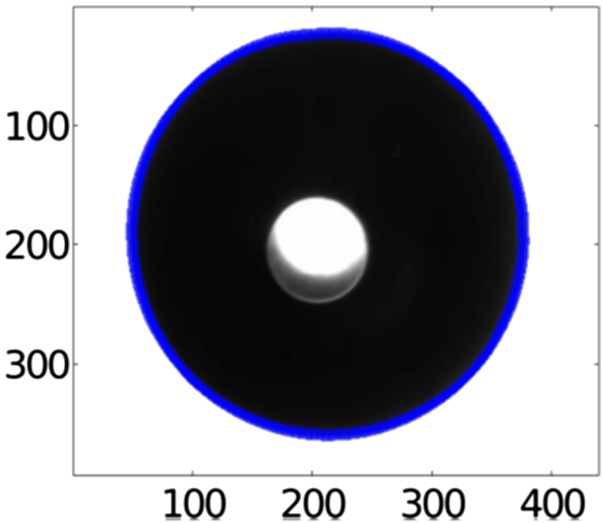
A levitated droplet shadow projected on a high-resolution CCD sensor. The blue line represents the surface profile of the droplet, which is determined using an edge detection algorithm (41).
Fig. S4.
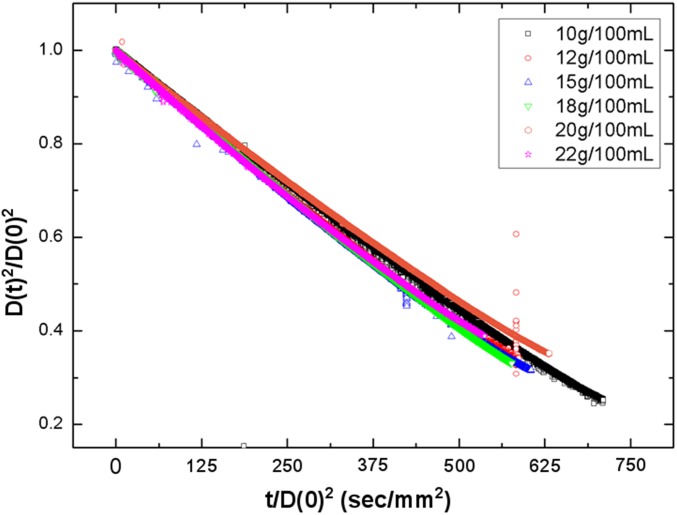
Drying kinetics of the levitated droplets with different initial concentrations.
Crystallization Probability Dependence on Supersaturation.
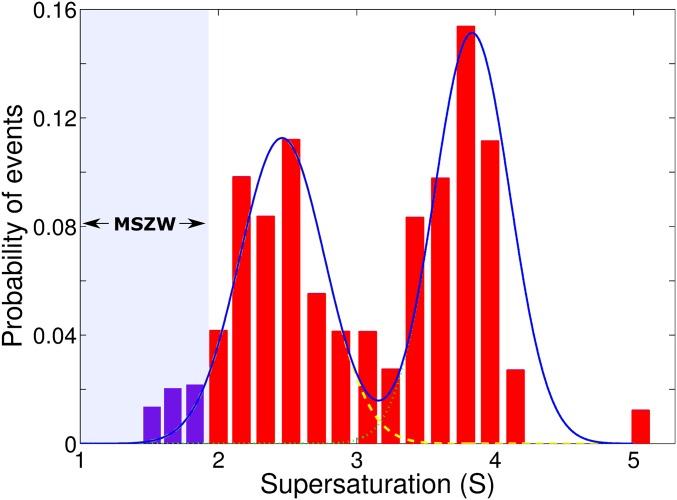
Fig. 3 shows the number of crystallization events as a function of supersaturation based on 128 experimental trials. Initially, the crystallization events increases with supersaturation because of increasing driving force for crystallization (i.e., chemical potential difference between solution and crystal) until around S = 2.45. At this level, CNT predicts that the probability of nucleation should decrease, because the viscosity contribution becomes dominant. According to previous studies (31–37), the maximum supersaturation of a KDP solution extends up to S = 1.95 at 30 °C. This boundary is very important in crystal engineering communities because a spontaneous nucleation and growth occurs beyond this limit. The region between the saturation solubility and the supersolubility is called the metastable zone width (MSZW). In this region, nucleation cannot occur and only growth of the already existing nuclei is allowed. For this reason, we attributed the crystallization, which occurred below S = 2 to heterogeneous nucleation (Fig. S5). Those events could have been caused by impurities or perturbation due to positioning instability of the droplet. A supersaturation greater than S = 2 is still above the previous results, S = 1.1∼1.95, in which homogenous nucleation was assumed (31–36, 38, 39). Interestingly, the crystallization probability increases after S = 3.0, forming another distribution centered about S = 3.83, which has not been observed in the previous studies (31–39). CNT does not predict this phenomenon, because viscosity should continuously increase with supersaturation. The two distinctive crystallization events imply that different crystal types may be able to form, and local structures of the highly supersaturated solution (S > 3) may be different from the one at low supersaturation, as we will elaborate in the following sections. Although the possibility of heterogeneous nucleation cannot be completely discounted, the crystallization at S ∼ 4.1 should have occurred under significantly more homogenous conditions.
Fig. 3.
The probability of crystallization events in supersaturated solution drops as a function of supersaturation. The first and second peaks at around S = 2.45 and S = 3.83 form more Gaussian-like distributions. A blue line is a cumulative curve with two Gaussian fitting curves. Metastable zone width (MZSW) is shown below S = 2.0.
Fig. S5.
Single-crystal growth from a levitated KDP solution. Initially unsaturated KDP solution drop is levitated, and its solute concentration progressively increases via evaporation. Once the degree of supersaturation exceeds S = 1, a crystal growth becomes possible. When a crystal seed forms, it subsequently falls to the bottom of the droplet due to gravity and proceeds to grow as a single crystal. Well-defined crystal edges are observed in the solution drop.
Crystal–Solution Interfacial Free Energy.
Such deep supersaturation requires an extremely high nucleation barrier that is caused by a large crystal–liquid interfacial free energy. Once the liquid is supersaturated, the probability to form crystal nuclei increases due to the lowered nucleation barrier. If the size of the nucleus formed in the supersaturated liquid is larger than a critical size, r*, the nucleus starts growing. Ideally, at least one nucleus with the critical size is necessary to trigger crystallization at a given supersaturation. In previous studies (31–36, 38, 39), the crystal–solution interfacial free energy of KDP was obtained by the induction time method where the solution is initially supercooled to a desired temperature, and the elapsed times until nucleation events are measured. In our study, nucleation occurs by continuous evaporation at a fixed temperature. Therefore, we here applied a different analysis method that has been widely used in supercooling experiments of metallic liquids (7–10). This alternative analysis uses precise knowledge of the volume and concentration of the solution droplet, which are measured from magnified droplet images during supersaturation. The details are elaborated in Supersaturation Ratio Measurement, Crystal Nucleation Analysis, and Table S2, as well as in our previous study (41). We obtain an approximate interfacial free energy of 39.7 ± 1.3 mJ/m2 at supersaturation S = 4.1 with a critical radius r* ∼ 1.3 nm. This value is significantly greater than any other results previously reported (31–36, 38, 39) (i.e., σ = 2∼16.87 mJ/m2 at S = 1.2∼1.95). If nucleation took place at S = 1.95 near the MSZW limit, the estimated interfacial free energy based on our approach yields 24.80 mJ/m2. Although this value is still greater than the highest value 16.87 mJ/m2 previously reported, it is close to a theoretical value of 24 mJ/m2 that was reported by Söhnel (39).
Table S2.
Parameters used for calculating KDP interfacial free energy
| Parameters | Value and equation | Unit |
| 2,335 | kg/m3 | |
| kg/mol | ||
| m3/mol | ||
| m3 | ||
| m | ||
| (30) | kg/m⋅s |
, density of KDP crystal; , molecular weight of KDP; , molar volume of KDP; , volume of a building unit of KDP; , average jumping distance; , dynamic viscosity of KDP solution as a function of the mass fraction ; , dynamic viscosity of solvent at room temperature, that is, water .
In Situ Micro-Raman Scattering Experiment.
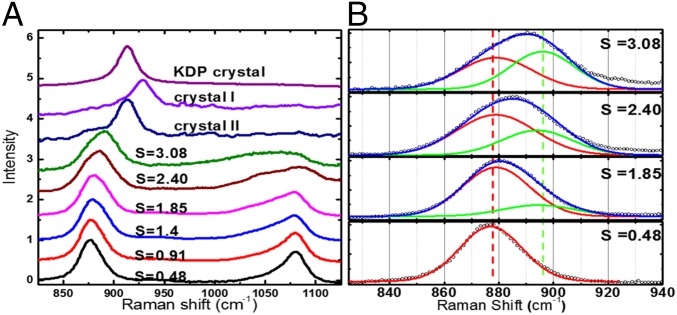
We investigated the possibility of finding a new metastable liquid in the deep supersaturation limit by using an in situ micro-Raman spectroscopy (Fig. S6). Fig. 4A shows typical Raman signals of H2PO4 molecule observed at undersaturation (S = 0.48 and S = 0.91) and low supersaturation (S = 1.4, S = 1.85, and S = 2.40). The undersaturated KDP solution shows almost symmetric shape of P(OH)2 Raman peak appearing at 877 cm−1 with a nearly equal intensity to that of PO2 peak at 1,077 cm−1, which indicates that the H2PO4− exists in monomers of hydrated clusters [H2PO4−–(H2O)n] (32–34). As the supersaturation increases, the monomers aggregate, forming dimers, trimers, oligomer, and higher polymers. Such polymerization behaviors can be deduced from the shape of PO2 peak at 1,077 cm−1, which becomes progressively more asymmetric and broadens at higher supersaturation as reported previously (42–44). The P(OH)2 Raman peak at 877 cm−1 shows a blue-shift behavior with respect to supersaturation as expected (33). In addition, we observe that the symmetry of the P(OH)2 peak changes beyond S = 1.85 in Fig. 4A. In fact, the blue shift of the P(OH)2 peak is complemented with the appearance of a new Raman vibration peak at around 896 cm−1 as shown in Fig. 4B. That is, P(OH)2 peaks at S = 2.40 and 3.08 can now be decomposed into two peaks, each centered at 879 cm−1 and 896 cm−1, respectively. Although the first peak at 879 cm−1 is identical to that of the monomers of P(OH)2 observed in a dilute solution, the second peak at 896 cm−1 only appears at deep supersaturation and becomes dominant at around S = 3.08. This observation implies possible new preferential local structures in the solution, which is consistent with our preliminary expectation based on the probability distribution in Fig. 3. The similar asymmetric Raman peak due to an emergence of a new solution phase was observed in MgSO4 solution (45).
Fig. S6.
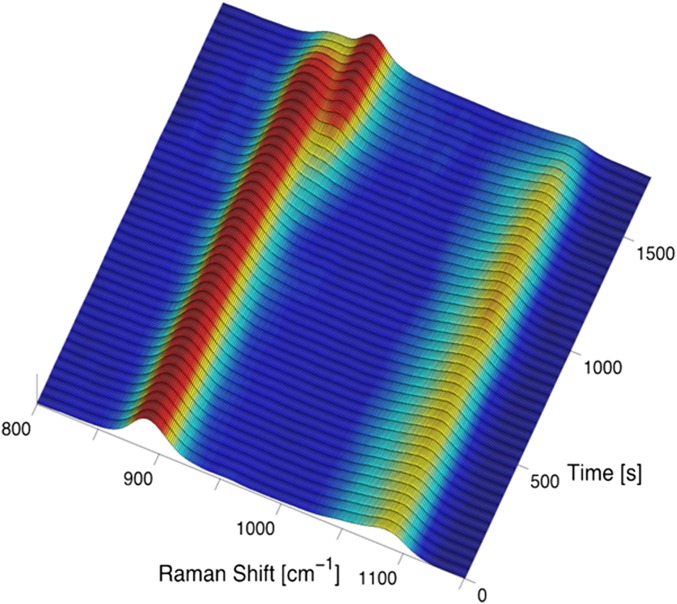
Real-time in situ Raman spectra measurement from levitated solution. Temporal evolution of shapes and peak shifts can be observed as a function of time.
Fig. 4.
(A) Raman spectra of P(OH)2 and PO2 bands in KDP solution with supersaturation. The crystallization of the supersaturated solution shows two distinct crystallization paths; one is crystal I, and the other is crystal II. The crystallization of crystal I from supersaturated liquid takes about 1∼3 s, whereas the crystallization of crystal II takes more than 20 s. (B) Decompositions of P(OH)2 peaks at S = 3.08, S = 1.85, and S = 0.48. As supersaturation increases, a new Raman peak (green line) appears at 896 cm−1, as a precursor for a new phase.
Surprisingly, we observe that the highly supersaturated KDP solution takes two different crystallization paths. In the first case, the solution under S ∼ 3.0 slowly crystallizes (taking more than 20 s) into a stable KDP crystal with a tetragonal structure as indicated by crystal II in Fig. 4A. Alternatively, the highly supersaturated solution at around S = 3.2 transforms into a metastable KDP crystal, in which the crystallization takes place within 1∼3 s as marked by a crystal I. After crystallization, the Raman spectra of P(OH)2 is centered at 912 cm−1 for the crystal II and at 928 cm−1 for the crystal I, respectively. The Raman peak position for the former case is consistent with that of a stable KDP crystal (tetragonal) as shown in Fig. 4A. The Raman peak position for the crystal I (928 cm−1) was shifted to 912 cm−1 after ∼30 min, following the onset of the crystallization. This observation implies that the crystal I is a new metastable phase.
In Situ Synchrotron X-ray Diffraction Study.
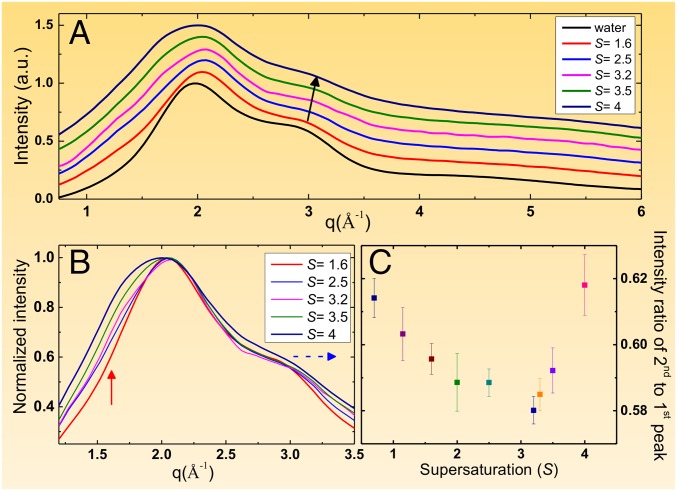
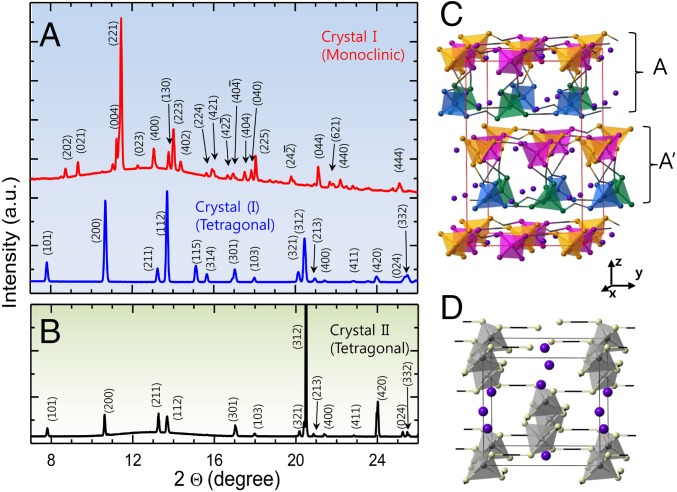
Fig. 5 shows the X-ray (with a wavelength of 0.692 Å) diffraction patterns of KDP solutions at varying degrees of supersaturation. The first interesting feature is the increasing intensity at low q range less than 2 Å−1 as a function of supersaturation in Fig. 5 A and B (marked by a red and blue arrow in the Fig. 5B). This behavior is related to the formation of networks or medium range ordering of molecules, and it is consistent with the broadening of the Raman spectra at 1,077 cm−1. The shoulder of the second peak continuously shifts toward higher q where supersaturation causing broadenings of the peak (marked by the blue arrow in Fig. 5B). Finally, the intensity ratio of the second peak with respect to the first peak (see In Situ Synchrotron X-ray Diffraction and Peak Intensity Analysis and Fig. S7) initially decreases until S = 3.2 is reached, and then rapidly increases as shown in Fig. 5C. The turning point found at S = 3.2 coincides with the regimes of supersaturation where crystal I is found, which also corresponds to the second distribution of the crystallization event in Fig. 3. Fig. 6 shows the X-ray diffraction patterns of the levitated KDP crystals immediately following the crystallization of crystal I at S = 4 (Fig. 6A) and crystal II at S = 2.7 (Fig. 6B). A Pawley refinement analysis using Lorentzian profile function reveals that the crystal structure of crystal I is identified with monoclinic structure (space group: C1c1, Bottom in Fig. 6A) with lattice parameters of a = 12.2286 Å, b = 8.9479 Å, and c = 14.2165 Å and angles of α = 90°, β = 91.826°, and γ = 90°.
Fig. 5.
(A) X-ray diffraction patterns of the levitated KDP solution droplets at varying degrees of supersaturation. A single unit-scale along y axis corresponds to 4,400 X-ray photons. (B) Magnified scattering patterns at low q side. (C) Changes of shoulder intensity at 2.85 Å−1 as a function of supersaturation.
Fig. S7.
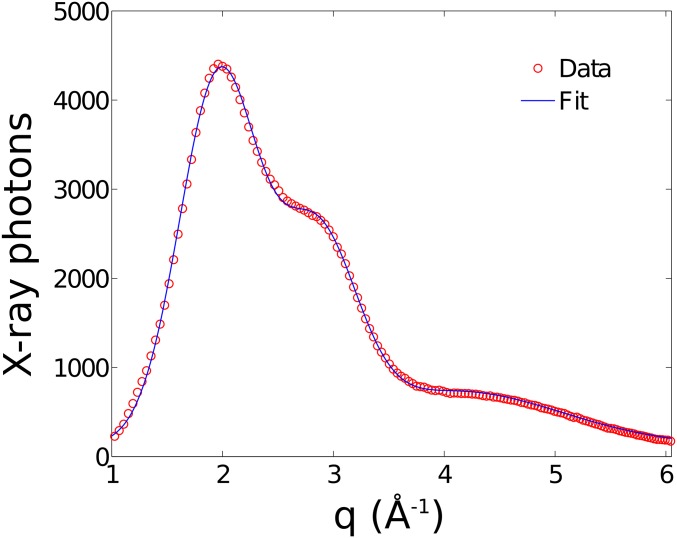
X-ray diffraction signal from the levitated water droplet is fitted with three Gaussian peaks based on Eq. S2.
Fig. 6.
In situ X-ray diffraction patterns of KDP crystals formed from supersaturated solutions. (A) Crystal I with monoclinic structure is formed from highly supersaturated solution at S = 4 (Top in A). The monoclinic crystal of crystal I transforms to tetragonal structure later (Bottom in A). (B) Crystal II with tetragonal structure is formed from low supersaturated solution at S = 2.7. X-ray diffraction pattern of the crystal I was refined through a Pawley refinement analysis using Lorentzian profile function. The diffraction patterns for the crystal II coincide exactly with the peak of reported tetragonal phase. Using the obtained structural information and atomic coordinates, the diffraction peaks were indexed. The monoclinic and tetragonal crystal structures are visualized in C and D, respectively (see Crystal Nucleation Analysis for details).
This is an observation of the monoclinic KDP at room temperature. Previously, the monoclinic structure only has been found at high temperature (∼503 K, P21/c) (46) or at low temperature (∼211 K, C1c1) (47) regimes. In Fig. 6A, the monoclinic KDP transformed into tetragonal structure (space group: I) eventually (Top in Fig. 6A), indicating that the monoclinic KDP is a metastable phase. This observation is consistent with Raman spectral result shown in Fig. 4. The diffraction pattern of the crystal II yields a tetragonal structure with lattice parameters, a = 7.4707 Å and c = 6.9884 Å. The in situ real-time X-ray study clearly shows that the crystallization path of the highly supersaturated solution can be distinguished from the low supersaturated solution.
Discussion
Over a century ago, Ostwald (48) recognized that a first crystal phase nucleated from a liquid can be often one of the intermediate phases rather than the most thermodynamically stable phase. This concept is called Ostwald step rule (48). van Santen (49) theoretically revealed that the multiple steps taking intermediate phases for crystallization minimized entropy production for the transformation. Therefore, the detailed mechanism for the multiple pathways of nucleation should be related to the local structural similarity, that is, entropic similarity, between solution and crystal phases during each transformation step. According to the Spaepen’s model (4–6), the crystal–liquid interfacial free energy determining nucleation barrier is attributed to the configurational entropy difference between crystal and liquid, as given by the following:
| [1] |
where α is called Turnbull’s coefficient, that is, interfacial free energy per fusion enthalpy, Ni is the number of atoms in the interface, N is the number of atoms in the crystal plane, ΔSconfig(Bulk) is the configurational entropy of the bulk crystal, ΔSconfig(Interface) is the configurational entropy of the interface, and ΔSf is the fusion entropy per atom. Although the enthalpic property also affects the formation of crystal–solution interface, Eq. 1 still provides an insight for the origin of the interfacial free energy in a geometrical point of view. That is, the local structural similarity between crystal and liquid determines the interfacial free energy and thus crystallization behaviors, which have been demonstrated in metal and alloy liquids (7–12).
The in situ structural studies from Raman and X-ray scattering, and statistical analysis of the nucleation events indicates the existence of two types of liquids depending on the degree of supersaturation, which we hereafter refer as low- (LCS) and high-concentration solutions (HCS). We also discovered different crystal nucleation pathways that go through crystal I and crystal II. According to Eq. 1, the formation of the monoclinic KDP crystal from the highly supersaturated solution implies that the structural configuration or short range order structure should become more similar to a monoclinic structure rather than a tetragonal structure of the stable KDP. Regarding local structure of the crystal phases, as shown in Fig. 6, tetrahedral clusters of H2PO4 molecules in the monoclinic structure are distorted with four different forms and are more disordered in their arrangement, compared with that of the tetragonal structure (Fig. S8). Therefore, the peak broadening with supersaturation in Figs. 4B and 5B signal that the local orders of regular tetrahedra are distorted in extremely supersaturated solution. According to this rationale, the local orders of the solution at low supersaturation (LCS) may become more similar to that of the monoclinic KDP at high supersaturation. Consequently, we expect that HCS, which is composed of distorted tetrahedra of H2PO4 with random ordering, carries a relatively low interfacial free energy with the monoclinic crystal compared with the tetragonal KDP.
Fig. S8.
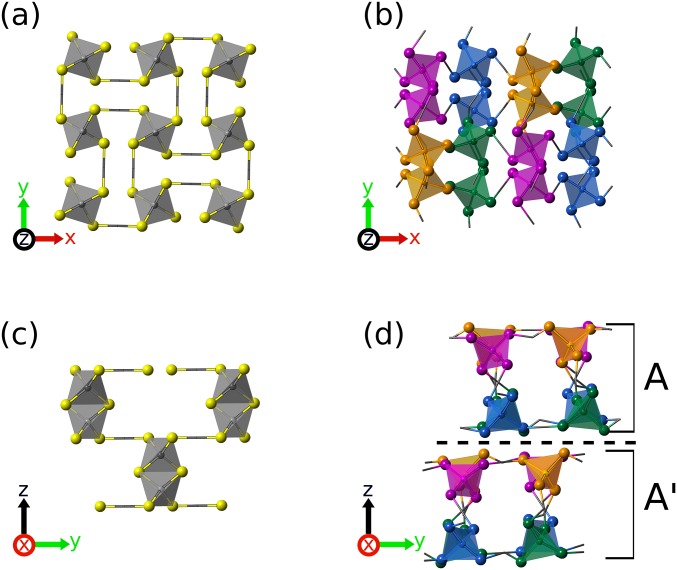
The comparison between the linkages PO4 tetrahedron in tetragonal and monoclinic structure of KDP. (A) PO4 tetrahedrons linkages in a tetragonal structure. (B) PO4 tetrahedrons linkages in a monoclinic structure, which are more disordered compared with the tetragonal structure. (C) P–P layer distance of first and fourth tetrahedra along the z axis in the tetragonal structure. (D) P–P layer distance of first and fourth tetrahedra along the z axis in the monoclinic structure, which is about two times larger than that of the tetragonal. The marked A and A′ layers have same structure and have a symmetrical relation over the glide mirror plane (dashed line).
Although we can show that the configurational similarity of local structures between solution and metastable crystal underlies the formation of metastable KDP phase, the meaning of such a high crystal–solution interfacial free energy 39.7 mJ/m2 at S = 4.1 is still ambiguous. In addition, a deep supersaturation should give a lower nucleation barrier for the stable phase than for the metastable phase in general, because the nucleation barrier is given by ΔG* = 16πvm2σ3/(kT lnS)2. One way to understand this phenomenon is to consider the relation between the interfacial free energy and the equilibrium; a high concentration gives a low interfacial free energy (39). However, this does not guarantee whether the lower interfacial free energy value leads to the formation of metastable or stable phases. This ambiguity can be resolved if we have a saturation curve of the metastable monoclinic phase, which is difficult to obtain experimentally. Therefore, we are unable to provide an exact value of the interfacial free energy for the metastable phase presently. Instead, we may provide its upper-bound limit. If we determine the interfacial free energy for the stable KDP crystal that nucleated at S = 3, it is 34.5 mJ/m2 based on Eq. 1. Because the nucleation barrier ΔG*(∼σ3/(lnS)2) of the metastable phase is smaller than that of the stable phase, the interfacial energy of the metastable phase should be smaller than that of the stable phase, that is, σms3 < σs3 (lnSms/lnSs)2 (where subscripts ms and s denote metastable and stable phases). Provided that the saturated concentration of the metastable phase is almost same as that of the stable phase, the formation of the metastable phase implies that its interfacial free energy should be smaller than 34.5 mJ/m2. This upper-bound value is still overestimated because the nucleation observed in this study may not be perfectly homogeneous due to possible presence of impurities in raw KDP materials.
As reported in aqueous solutions (24, 50), nucleation can occur at the gas–solution surface or in bulk solutions, depending on transport properties in the liquid and interfacial properties. Although our current camera resolution is insufficient for studying surface nucleation, we estimate a Peclet number (Pe), the ratio between advection and diffusion rates inside the droplet, of about 0.22 (see Peclet Number Estimation for details). This implies homogeneous condition in the droplet and less possibility for the surface nucleation. If Pe > 1, which implies fast evaporation and relatively slow diffusion, the solution may form a denser layer near gas–solution interface where nucleation is likely to occur. A more elaborate study will be needed to address this issue in the future.
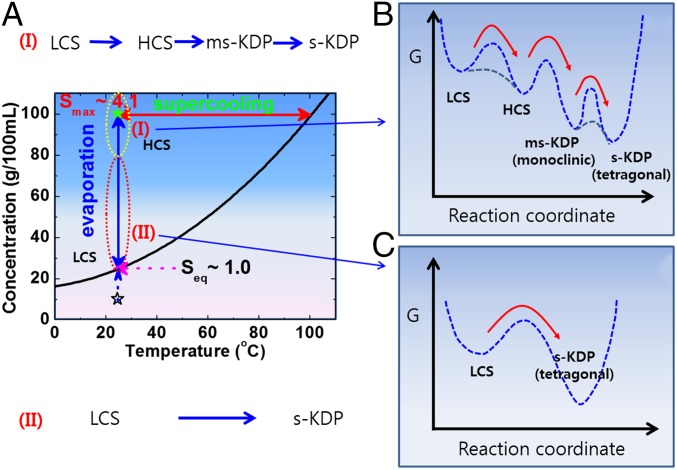
Our results support the theory that the structures of HCS beyond S = 3.2 differ from LCS and the outcome of the multiple pathways of the crystallization depends on the degree of supersaturation. That is, the solution at low supersaturation (LCS) directly transforms into the stable tetrahedral KDP (s-KDP) (case II in Fig. 7), whereas HCS over S = 3.2 can initially crystallizes to the metastable (ms-KDP) crystal as shown in Fig. 7 (case I), and then to s-KDP. In this case, the formation of ms-KDP may be attributed to the structural similarity between the metastable solution (HCS) and the metastable crystal (monoclinic phase). For the formation of ms-KDP, the crystal–solution interfacial free energy should be smaller than 34.5 mJ/m2, the upper-bound limit. The detailed mechanism of the formation of HCS is still ambiguous in the present study (marked by dashed lines in Fig. 7B). We note that spinodal decomposition has been predicted in KDP solutions under extremely supersaturated condition, at about S ∼ 25.56 (30), in which solution density is higher than that of the crystal. Because the supersaturation in our current study is far below the spinodal line, this topic requires further studies.
Fig. 7.
(A) Multiple pathways of KDP crystallization from solution. The supercooling is from the solubility curve of stable KDP. During evaporation, I shows a complex crystallization path of low-concentration solution (LCS) → high-concentration solution (HCS) → metastable KDP crystal (ms-KDP) → stable KDP crystal (s-KDP). A corresponding schematic for a Gibbs energy diagram is shown in B. II shows the crystallization path from LCS to s-KDP at low supersaturation, which follows the energy landscape shown in C. In the case of II, we often observed that LCS transforms into a single KDP crystal at low supersaturation (Movie S3).
In summary, we successfully achieved an extremely high degree of supersaturation for KDP solution up to S = 4.1 and reveal that the solution transforms from a low-concentration to a high-concentration solution with different local structures. The degree of supersaturation was an important criterion for determining different KDP crystallization paths; specifically, whether the supersaturated solution transformed into a stable KDP crystal or the newly found metastable crystal with monoclinic structure. Although the Ostwald step rule does not explicitly state the origin of multiple steps of crystallization, the findings in this study (i.e., different local orders between LCS and HCS as well as the configurational similarity between HCS and the monoclinic KDP crystal) implies a possible basis for such mechanism. Recently, a CaSO4 crystal was nucleated through dense liquid clusters with mesoscopic sizes but with short lifetimes in a highly supersaturated solution, which also suggests the multiple pathways of nucleation (24). If the levitation technique had been available to achieve higher supersaturation, a longer lifetime may have been given to the dense clusters and we may have more detailed insights about the phenomenon. The present results reflect that the multiple pathways of nucleation may be more common than previously expected, and open up venues for studying multiple pathways for crystallization in aqueous solution systems.
Materials and Methods
Supporting Information provides further technical information about levitation procedure, light scatterings, and sample preparations.
Electrostatic Levitation of Liquid Droplet.
The solution ESL unit consists of two vertically aligned electrodes in an environmentally isolated chamber for the sample levitation. He–Ne position laser (632.8-nm wavelength) incidents on the droplet casting a shadow on a position-sensitive detector, which outputs positional feedbacks for maintaining the sample suspension.
Solution Preparation.
We prepare our aqueous solution by dissolving KDP of purity 98% (Daejung Chem) and 99% (Aldrich) in deionized water with a resistivity of 18.2 MΩ⋅cm, which is produced by using Milli-Q ultrapure water purification system.
Sample Preparation and Delivery
We have prepared our aqueous solution by dissolving potassium dihydrogen phosphate (KDP) of purity 98% (Daejung Chem) and 99% (Aldrich) in deionized water with a resistivity of 18.2 MΩ⋅cm, which is produced by using Milli-Q ultrapure water purification system. A typical bulk concentration () of the solution ranged between 12 and ∼22 g/100 mL (KDP solute in grams/water solvent in milliliters) slightly below the solubility curve at room temperature (25 ± 0.2 °C). To ensure the homogenous mixture of the samples, they were stirred for ∼6 h. Subsequently, it was permeated through a syringe filter with a pore size of 220 nm (BIOFIL) to remove potential heterogeneous nucleation sites such as air contaminants and undissolved microcrystals. Finally, the filtered KDP solution was delivered to the solution injection needle that is mounted at the bottom of the ESL unit (Fig. S1). We note that the final liquid delivery was achieved by carefully controlling the flow rate of the solution in the needle with a motorized syringe pump (KDS-200; kdScientific).
Sample Levitation
Fig. S1 shows the layout of our solution ESL apparatus. The unit consists of two vertically aligned electrodes that are spaced apart by 1.7 cm to allow sufficient space for the sample levitation and in situ light scattering/spectroscopic measurements such as Raman spectroscopy and X-ray scattering. The top electrode is connected to a high-voltage amplifier (Trek 10/10B) while the bottom one is grounded to the optical table. The beam diameter of a low power He–Ne laser (1 mW, 632.8-nm wavelength) is expanded to 1 cm and then collimated before incident on the liquid droplet casting a shadow on a position-sensitive detector (PSD) (Hamamatsu Photonics C10443-03). The output from the PSD control unit feeds real-time droplet positions to the master-control PC, which accordingly modulates the high-voltage amplifier outputs at 500 Hz to maintain the sample suspension. We note that the core-levitation components (i.e., electrodes and needle) are enclosed in an environmentally isolated chamber, in which temperature and relative humidity are maintained at 25 ± 0.2 °C and , respectively. When the electrostatic force applied on the liquid droplet overcomes the wetting force holding it on top of the injection needle, it becomes levitated in a form of freestanding macroscopic droplet (very close to an ideal sphere) with a diameter of 2∼3 mm. Typical applied voltage to levitate a droplet ranges from 800 to 1,500 V depending on its density. We have not observed any correlation between nucleation behaviors (e.g., degree of supersaturation) and magnitude of the voltage applied to the electrode under given conditions. Therefore, we conclude that there is no effect from the electric field on crystallization (or nucleation) in this study. The sample position is held within ±20 μm throughout the experiments via the PSD feedback routine that is described above.
Supersaturation Ratio Measurement
While the levitated solution droplet continuously shrinks via evaporation process, the time-varying size, shape, and interior of the droplet was monitored and recorded via CCD cameras (Lt365R; Lumenera) in two different directions (i.e., top and side). Each CCD was equipped with a microscopic zoom lens to allow 5× magnification at a working distance of 300 mm. The volumes of the droplet on successive frames are obtained by performing Legendre polynomial fittings (41) on the droplet images. The degree of supersaturation can be calculated from the volume.
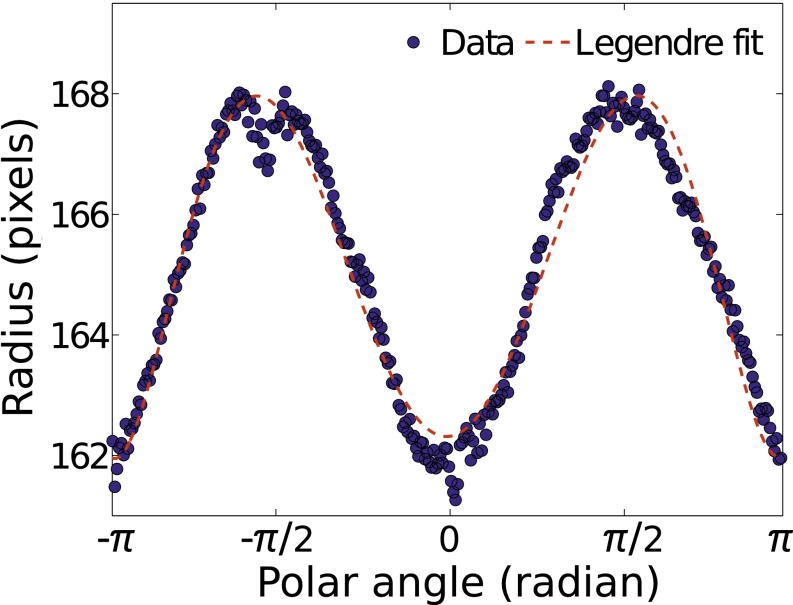
Fig. S2 shows a snapshot of a magnified backlight lit drop image measured by the side CCD. The surface profile of the droplet is determined using an edge detection algorithm (41). The radial edge points are transformed into polar coordinates and then fit with spherical harmonics as follows: , where is the nth order Legendre polynomial and Cn are the coefficients that are determined via fitting. For the fitting, the polynomial of sixth order was used as shown in Fig. S3. Subsequently, the droplet volume is obtained by integrating the fitting results according to , from which we calculate its diameter D(t). The evaluation of uncertainty with this method is well described in our previous work (41). From the fitting procedure, the uncertainty of pixel volume is of 0.172 (41).
Fig. S3.
The radial edge points of the droplet image in Fig. S2 is transformed into polar coordinates and then fit with sixth-order Legendre polynomials.
Here, the drying kinetics of the droplet is confirmed by the d2 law (51):
| [S1] |
where is a diameter at time , is the initial diameter at the beginning of the levitation, and is the evaporation coefficient (or rate) in a unit of square millimeters per second. Fig. S4 shows the drying kinetics of the evaporating droplets as a function time. We observe that the evaporation rates were almost same for all of the samples with different initial concentrations. The outlying measurements for 20 g/100 mL dataset (red circle) near t/D(0)2 = 575 are caused by severe shape deformation of the drop, which occurs during a rapid crystallization process.
Crystallization of KDP Solution: Single-Crystal and Polycrystal Growth
We observed different crystallization behaviors. Interestingly, we most often observed a single KDP crystal growth that occurs usually at low supersaturation (Fig. S5 and Movie S3). Movies S1 and S2 show that crystallization behaviors of “crystal I” and “crystal II” depend on the degree of supersaturation. In the case of the single-crystal formation, we observed that a small crystal floated around in the solution. Then, as it grew, the crystal became heavy and might drop down on the bottom of the droplet due to gravitational force. The crystallization of the highly supersaturated solution seems to occur near the surface of the droplet.
In Situ Raman Spectroscopy
The flexible design of the solution ESL chamber allows us to perform an in situ Raman spectroscopy measurement on the levitated sample (Fig. S6). In particular, the large acceptance and output windows are sealed with 20-μm-thick kapton film, which is very transparent to the optical light and also allows a full visual access to the inside of the chamber. During the sample levitation, microfocal measurements with an incident laser wavelength of 532 nm are performed in a transmission geometry. The transmitted beam is relayed via multiple high-quality silver mirrors to a Raman spectrometer (DONGWOO OPTRON; model DM500i), in which the incident light is dispersed by a diffraction grating (1,200 Gr/mm) and then collected on a 2D detector (Andor DV401A-Bv) consisting of 1,024 × 24 pixels (pixel size of 26 μm2). For the spectral measurement, a typical laser power of 1.7 mW was used to minimize the heating of the solution, and thus a relatively long exposure time of 60 s was used to collect a single spectrum. Ultimately, the Raman spectra from the KDP solution at varying degrees of supersaturation are obtained before, during, and after the final crystallization.
In Situ Synchrotron X-ray Diffraction and Peak Intensity Analysis
The compact design allows the ESL chamber to be transported to a synchrotron for X-ray diffraction measurements. The experiments were conducted at the sector 5A insertion device beamline at the Pohang Light Source II. The X-rays from the undulator were monochromatized by cryogenically cooled silicon 111 double-crystal monochromator where the photon energy was set to 18 keV. An in-vacuum delivery pipe was extended up to the chamber and two slits (50 μm × 50 μm) were placed before and after the delivery pipe to minimize the effect of air scattering as well as background scattering from stray X-rays. Finally, 2D X-ray detector (Pilatus 300K-W) was placed behind the ESL chamber to collect scattered signals from the levitated droplet solution.
X-ray scattering patterns from liquid can be modeled with multiple Gaussian peaks, which can be used to locate their centroid positions along Q-axis. Fig. S7 shows the wide-angle X-ray scattering analysis for a levitated water drop. The experimentally obtained scattering signal displays the usual pattern of a liquid. For this particular example, we closely examine its line-shapes by fitting the data with three Gaussian peaks. More specifically, the centroids of the Gaussian peaks are obtained by numerically fitting the data to the following equation (Eq. S2) via χ2 minimization,
| [S2] |
where , , and are the extracted centroid positions of the Gaussian peaks. and correspond to width and amplitude of mth Gaussian peak, respectively. Here, the numerical fit yields the centroid positions of the first, second, and third peaks at Q1 = 1.966, Q2 = 2.851, and Q3 = 4.094 Å−1, respectively.
In Fig. 5C of the main text, we describe the changes in the intensity ratio between the first and second characteristic peaks. The Pilatus 300K-W 2D detector, which was used for measuring X-ray scattering patterns, is a photon-counting detector. The integrated silicon sensors with a pixelated diode structure in the detector allow direct conversion of X-rays to electronic signals. During the experiment, X-ray photon counts from the scattering peaks were measured as a function Q. Subsequently, the ratio between two peaks f = A(Q2)/B(Q1) is calculated where A and B are the number of X-ray photons accumulated at first and second peak positions. In above example (Fig. S7), we find f = 0.632 for A(Q1) = 4,402 and B(Q2) = 2,782. In this case, the error bar for the ratio between the first and second peak is obtained by propagating statistical uncertainties. Because the counting uncertainty can be calculated as where N is the number of photons measured at a particular Q, the propagated uncertainty can be calculated as follows:
| [S3] |
where and are the associated statistical uncertainties. For this dataset, we obtain a ratio value of 0.632 0.008.
Structure of Stable and Metastable KDP Crystals
Fig. S8 shows structures of two different KDP crystals that are formed at low and high supersaturation levels. In the figure, hydrogen atoms have been omitted for clarity and H-bonded oxygen are joined with sticks. A tetragonal structure (Fig. S8 A and C), which is formed in the low supersaturation regime, carries a single type of tetrahedral order of H2PO4. On the other hand, a monoclinic structure (Fig. S8 B and D), which is a metastable phase formed in the extremely supersaturated solution, carries four different types of tetrahedral order of H2PO4. In Fig. S8, we can see that arrangements of the tetrahedra are more disordered in the monoclinic structure compared with that of the tetragonal structure. More specifically, although the tetragonal structure consists of the identical tetrahedra, the monoclinic structure comprises of four different kinds of distorted tetrahedral bases that form 2D layered structures. As shown in Fig. S8 B and D, the alternating arrangements of orange-to-magenta and blue-to-green tetrahedra form nearly linear chains of H-bound tetrahedral along y axis. In Fig. S8D, the indicated A′ layer in the monoclinic phase carries a symmetric relation with the A layer underneath. According to previous studies (46, 47), the formation of this C-centered KDP crystal phase (C1c1), which is similar to a well-known high temperature phase (P21/c) at 503 K, has been only observed at low temperature regimes (∼211 K) far below room temperature. Further structural details of the two crystal phases are elaborated in the caption of Fig. S8.
Crystal Nucleation Analysis
It should be noted that the high degree of supersaturation greater than S = 2 in present study is far above the results, S = 1.1∼1.95, from the previous studies that assumed homogenous nucleation (31–36, 38, 39) (Table S1). Although the possibility of heterogeneous nucleation should not be completely discarded due to impurities in the solution, the crystallization occurred in such a highly supersaturated solution (S ∼ 4.1) implies that the nucleation occurred more homogeneously. Such deep supersaturation of KDP solution demonstrated in this work cannot be possibly obtained without an extremely high nucleation barrier, which is caused by an unusually high crystal–liquid interfacial free energy. To understand the high supersaturation phenomenon, we estimate the interfacial free energy using CNT. According to CNT, the stability of a crystal nucleus in a supersaturated liquid phase is determined by a chemical potential energy (Δμ) and an interfacial free energy (σ), that is, , where r is the radius of the nucleus, is the molar volume of a building unit of the nucleus, and is the difference in chemical potential of the crystal nucleus () and the liquid (). The chemical potential is expressed by a function of the supersaturation, that is, (where is the Boltzmann constant, and T is the ambient temperature). Once the liquid is supersaturated, the probability to form crystal nuclei increases due to the lowered nucleation barrier. If the size of the nucleus formed in the supersaturated liquid is larger than a critical size, r*, the nucleus starts growing. Ideally, at least one nucleus with the critical size is necessary to trigger the crystallization at a given supersaturation.
In this study, a levitated solution droplet crystallizes via continuous evaporation. This experimental approach differs from previous studies (31–39), in which a temperature reduction method was used. More specifically in the studies before our work, the solution with a given concentration was supercooled and held at a fixed temperature until nucleation occurs. Here, the lag time until the crystallization is referred to as an induction time. In this method, a crystal–solution interfacial free energy of KDP could be obtained based on the induction time measurements via the relation of the nucleation induction time (ln t) and supersaturation (ln (1/S))2. This method requires constant sample concentration and ambient temperature. However, we cannot maintain the constant concentration in this study, because the concentration of initial solution droplet increases via the continuous evaporation at a given temperature. Therefore, we here applied a different method to estimate the crystal–solution interfacial free energy, which has been widely used in supercooling experiment of metallic liquids (1, 7–11).
In an ensemble of many droplets of a uniform volume, V, the probability x of having no nuclei in a supersaturated solution droplet with N nuclei per unit volume is given by exp[− VN] (1). For the supersaturated solution obtained by the continuous evaporation, the probability is the summation of individual nucleation events at varying degree of supersaturation during multiple time steps, which is given by exp . Here, Is is steady-state nucleation rate. During evaporation (i.e., supersaturation), if we can assume that a quasistatic process can be maintained, and at least one critical size of nucleus is necessary for initiating the crystallization, the multiplication of nucleation rate, sample volume, and elapsed time from saturation should be greater than 1 (that is, the multiplication is the number of nucleus):
| [S4] |
where time t = 0 refers to the onset of the saturated state, that is, S = 1, and time t = τ means the onset of nucleation.
The steady-state nucleation rate Is per unit volume at temperature T is given by the following:
| [S5] |
where η (C(t)) is the viscosity of KDP solutions as a function of the bulk concentration C(t) at time t, a is the average molecular jump distance, is the average number of solutes in the critical nucleus, and NA is the Avogadro number. The nucleation barrier is given by , where r* is critical nucleus size, . The viscosity, η (C(t)) is obtained by extrapolating the experimental data (30) that were measured at low supersaturation. Volume V and concentration C are measured by taking images during supersaturation (see Supersaturation Ratio Measurement for supersaturation ratio measurement).
Consequently, the only unknown parameter in Eq. S4 is the interfacial free energy. Because we have concentration (or supersaturation) data as a function of time (Fig. 2), we can obtain the interfacial free energy satisfying Eq. S4 on nucleating. That is, by summing number of all of the nuclei at every supersaturation with a certain time interval, we can determine the interfacial free energy by satisfying the inequality of Eq. S4, that is, at least one nuclei initiating the nucleation. All of the parameters used in this calculation are tabulated in Table S2.
Peclet Number Estimation
By estimating Peclet number (Pe), which is defined with the ratio of advection rate and diffusion rate inside the levitated droplet, we can see the possibility of nucleation at the gas–solution interface. In present study, we used diffusion coefficients of 4.66 × 10⁻⁶ cm2/s, and 2.56 × 10⁻⁶ cm2/s for KDP solutions at S = 1.6 and at S = 4, respectively, which were obtained by the extrapolation of viscosity data (24). The mean free paths from those diffusion coefficients are given as 30.5 μm and 22.6 μm per s at S = 1.6 and at S = 4, respectively. The large mean free paths reflect that the supersaturated solution may be homogeneous, that is, easily equilibrated by diffusion. The Pe number is defined with Pe = R×U/D, where R is the radius of the drop, U is the flow velocity, and D is the diffusion coefficient of the solution. The flow velocity U is estimated by recording the flux (dV/dt, V is the volume of the droplet) and the area of the droplet (12). During our experiment, we typically measure a flow velocity of ∼7 × 10⁻⁸ m/s inside a droplet. Using those values, the estimated Pe number is about 0.22, which is less than 1. On the other hand, if Pe > 1, which implies fast evaporation and relatively slow diffusion, the solution may have a denser layer near gas–solution interface. In this case, nucleation may occur in the denser layer near the surface. However, the Pe = 0.22 implies homogeneous droplet and less possibility of the surface nucleation. Overall, the Pe number as well as the containerless environment and the deep supersaturation support that the nucleation occurs more like homogeneously in present study. Nevertheless, a more elaborate study will be needed in the future because the current limitation of camera resolution cannot discard the possibility of the surface nucleation.
Supplementary Material
Acknowledgments
We thank H. K. Park for useful discussion and acknowledge use of the sector 5A beamline and Photon Test Facility at Pohang Light Source II. This research was supported by the Converging Research Center Program through the Ministry of Science, Information and Communications Technology and Future Planning, Korea (Grants NRF-2014M3C1A8048818 and NRF-2014M1A7A1A01030128).
Footnotes
The authors declare no conflict of interest.
This article is a PNAS Direct Submission. P.G.V. is a Guest Editor invited by the Editorial Board.
See Commentary on page 13551.
This article contains supporting information online at www.pnas.org/lookup/suppl/doi:10.1073/pnas.1604938113/-/DCSupplemental.
References
- 1.Kelton KF. In: Solid State Physics. Ehrenreich H, Turnbull D, editors. Vol 45 Academic; Boston: 1991. [Google Scholar]
- 2.Walton AG. Nucleation of crystals from solution: Mechanisms of precipitation are fundamental to analytical and physiological processes. Science. 1965;148(3670):601–607. doi: 10.1126/science.148.3670.601. [DOI] [PubMed] [Google Scholar]
- 3.Turnbull D. In: Physics of Non-Crystalline Solids. Prins JA, editor. North-Holland; Amsterdam: 1964. [Google Scholar]
- 4.Spaepen F. In: Solid State Physics. Ehrenreich H, Turnbull D, editors. Vol 47 Academic; Boston: 1994. [Google Scholar]
- 5.Spaepen F, Meyer R. The surface tension in a structural model for the solid-liquid interface. Scr Metall. 1976;10(1):37–43. [Google Scholar]
- 6.Spaepen F. A structural model for the solid-liquid interface in monatomic system. Acta Metall. 1975;23(6):729–743. [Google Scholar]
- 7.Kang D-H, et al. Nano-sized nucleus-supercooled liquid interfacial free energy and thermophysical properties of early and late transition liquid metals. Cryst Growth Des. 2014;14(3):1103–1109. [Google Scholar]
- 8.Kelton KF, et al. First x-ray scattering studies on electrostatically levitated metallic liquids: Demonstrated influence of local icosahedral order on the nucleation barrier. Phys Rev Lett. 2003;90(19):195504. doi: 10.1103/PhysRevLett.90.195504. [DOI] [PubMed] [Google Scholar]
- 9.Lee GW, et al. Link between liquid structure and the nucleation barrier for icosahedral quasicrystal, polytetrahedral, and simple crystalline phases in Ti-Zr-Ni alloys; verification of Frank’s hypothesis. Phys Rev B. 2005;72(17):174107. [Google Scholar]
- 10.Holland-Moritz D, Herlach DM, Urban K. Observation of the undercoolability of quasicrystal-forming alloys by electromagnetic levitation. Phys Rev Lett. 1993;71(8):1196–1199. doi: 10.1103/PhysRevLett.71.1196. [DOI] [PubMed] [Google Scholar]
- 11.Kang D-H, et al. Interfacial free energy controlling glass-forming ability of Cu-Zr alloys. Sci Rep. 2014;4:5167. doi: 10.1038/srep05167. [DOI] [PMC free article] [PubMed] [Google Scholar]
- 12.Tang C, Harrowell P. Anomalously slow crystal growth of the glass-forming alloy CuZr. Nat Mater. 2013;12(6):507–511. doi: 10.1038/nmat3631. [DOI] [PubMed] [Google Scholar]
- 13.ten Wolde PR, Frenkel D. Enhancement of protein crystal nucleation by critical density fluctuations. Science. 1997;277(5334):1975–1978. doi: 10.1126/science.277.5334.1975. [DOI] [PubMed] [Google Scholar]
- 14.Galkin O, Chen K, Nagel RL, Hirsch RE, Vekilov PG. Liquid-liquid separation in solutions of normal and sickle cell hemoglobin. Proc Natl Acad Sci USA. 2002;99(13):8479–8483. doi: 10.1073/pnas.122055299. [DOI] [PMC free article] [PubMed] [Google Scholar]
- 15.Vekilov PG. The two-step mechanism of nucleation of crystals in solution. Nanoscale. 2010;2(11):2346–2357. doi: 10.1039/c0nr00628a. [DOI] [PubMed] [Google Scholar]
- 16.Vekilov PG. Dense liquid precursor for the nucleation of ordered solid phases from solution. Cryst Growth Des. 2004;4(4):671–685. [Google Scholar]
- 17.Erdemir D, Lee AY, Myerson AS. Nucleation of crystals from solution: Classical and two-step models. Acc Chem Res. 2009;42(5):621–629. doi: 10.1021/ar800217x. [DOI] [PubMed] [Google Scholar]
- 18.De Yoreo J. Crystal nucleation: More than one pathway. Nat Mater. 2013;12(4):284–285. doi: 10.1038/nmat3604. [DOI] [PubMed] [Google Scholar]
- 19.Baumgartner J, et al. Nucleation and growth of magnetite from solution. Nat Mater. 2013;12(4):310–314. doi: 10.1038/nmat3558. [DOI] [PubMed] [Google Scholar]
- 20.Smeets PJM, Cho KR, Kempen RGE, Sommerdijk NAJM, De Yoreo JJ. Calcium carbonate nucleation driven by ion binding in a biomimetic matrix revealed by in situ electron microscopy. Nat Mater. 2015;14(4):394–399. doi: 10.1038/nmat4193. [DOI] [PubMed] [Google Scholar]
- 21.Gebauer D, Völkel A, Cölfen H. Stable prenucleation calcium carbonate clusters. Science. 2008;322(5909):1819–1822. doi: 10.1126/science.1164271. [DOI] [PubMed] [Google Scholar]
- 22.Nielsen MH, Aloni S, De Yoreo JJ. In situ TEM imaging of CaCO3 nucleation reveals coexistence of direct and indirect pathways. Science. 2014;345(6201):1158–1162. doi: 10.1126/science.1254051. [DOI] [PubMed] [Google Scholar]
- 23.Pouget EM, et al. The initial stages of template-controlled CaCO3 formation revealed by cryo-TEM. Science. 2009;323(5920):1455–1458. doi: 10.1126/science.1169434. [DOI] [PubMed] [Google Scholar]
- 24.Shahidzadeh N, Schut MF, Desarnaud J, Prat M, Bonn D. Salt stains from evaporating droplets. Sci Rep. 2015;5:10335. doi: 10.1038/srep10335. [DOI] [PMC free article] [PubMed] [Google Scholar]
- 25.Hu Q, et al. The thermodynamics of calcite nucleation at organic interfaces: Classical vs. non-classical pathways. Faraday Discuss. 2012;159:509–523. [Google Scholar]
- 26.Wallace AF, et al. Microscopic evidence for liquid-liquid separation in supersaturated CaCO3 solutions. Science. 2013;341(6148):885–889. doi: 10.1126/science.1230915. [DOI] [PubMed] [Google Scholar]
- 27.Klimakow M, et al. Combined synchrotron XRD/Raman measurements: In situ identification of polymorphic transitions during crystallization processes. Langmuir. 2010;26(13):11233–11237. doi: 10.1021/la100540q. [DOI] [PubMed] [Google Scholar]
- 28.Radnik J, Bentrup U, Leiterer J, Brückner A, Emmerling F. Levitated droplets as model system for spray drying of complex oxides: A simultaneous in situ X-ray diffraction/Raman study. Chem Mater. 2011;23(24):5425–5431. [Google Scholar]
- 29.Knezic D, Zaccaro J, Myerson AS. Thermodynamic properties of supersaturated protein solutions. Cryst Growth Des. 2004;4(1):199–208. [Google Scholar]
- 30.Bohenek M, Myerson AS, Sun W. Thermodynamics, cluster formation and crystal growth in highly supersaturated solutions of KDP, ADP and TGS. J Cryst Growth. 1997;179(1):213–225. [Google Scholar]
- 31.Chen J, Lin S, Yang F, Wang J, Lang J. Effect of alcoholic additives on the nucleation of KDP and DKDP crystals. J Cryst Growth. 1997;179(1):226–230. [Google Scholar]
- 32.Wojciechowski K, Kibalczyc W. Light scattering study of KH2PO4 and BaSO4 nucleation process. J Cryst Growth. 1986;76(2):379–382. [Google Scholar]
- 33.Shanmungham M, Gnanam FD, Ramasamy P. Nucleation studies in supersaturated potassium dihydrogen orthophosphate solution and the effect of soluble impurities. J Mater Sci. 1984;19(9):2837–2844. [Google Scholar]
- 34.Joshi MS, Antony AV. Nucleation in supersaturated potassium dihydrogen orthophosphate solutions. J Cryst Growth. 1979;46(1):7–9. [Google Scholar]
- 35.Zaitseva N, Carman L. Rapid growth of KDP-type crystals. Prog Cryst Growth Charact Mater. 2001;43(1):1–118. [Google Scholar]
- 36.Parikh KD, Parekh BB, Dave DJ, Joshi MJ. Nucleation kinetics of l-arginine, l-lysine and l-alanine doped potassium dihydrogen phosphate crystals. JCPT. 2013;3(3):92–96. [Google Scholar]
- 37.Srinivasan K, Meera K, Ramasamy P. A novel method to enhance metastable zone width for crystal growth from solution. Cryst Res Technol. 2000;35(3):291–297. [Google Scholar]
- 38.Chernov AA. Secondary nucleation induced by the cracking of a growing crystal: KH2PO4 (KDP) and K(H,D)2PO4 (DKDP) J Cryst Growth. 1990;102(4):793–800. [Google Scholar]
- 39.Söhnel O. Electrolyte crystal-aqueous solution interfacial tensions from crystallization data. J Cryst Growth. 1982;57(1):101–108. [Google Scholar]
- 40.Turnbull D. Formation of crystal nuclei in liquid metals. J Appl Phys. 1950;21(10):1022–1028. [Google Scholar]
- 41.Yoo H, Park C, Jeon S, Lee S, Lee GW. Uncertainty evaluation for density measurements of molten Ni, Zr, Nb and Hf by using a containerless method. Metrologia. 2015;52(5):677–684. [Google Scholar]
- 42.Lu GW, et al. Cluster formation in solid-liquid interface boundary layers of KDP studied by raman spectroscopy. Phys Status Solidi A. 2001;188(3):1071–1076. [Google Scholar]
- 43.Syed KA, Pang S-F, Zhang Y, Zhang Y-H. Micro-Raman observation on the H2PO4− association structures in a supersaturated droplet of potassium dihydrogen phosphate (KH2PO4) J Chem Phys. 2013;138(2):024901. doi: 10.1063/1.4773585. [DOI] [PubMed] [Google Scholar]
- 44.Lu GW, Sun X. Raman study of lattice vibration modes and growth mechanism of KDP single crystals. Cryst Res Technol. 2002;37(1):93–99. [Google Scholar]
- 45.Wang XL, Chou IM, Hu WX, Burruss RC. In situ observations of liquid–liquid phase separation in aqueous MgSO4 solutions: Geological and geochemical implications. Geochim Cosmochim Acta. 2013;103:1–10. [Google Scholar]
- 46.Cai W, Katrusiak A. Structure of the high-pressure phase IV of KH2PO4 (KDP) Dalton Trans. 2013;42(4):863–866. doi: 10.1039/c2dt32131a. [DOI] [PubMed] [Google Scholar]
- 47.Subramony JA, Marquardt BJ, Macklin JW, Kahr B. Reevaluation of Raman spectra for KH2PO4 high-temperature phases. Chem Mater. 1999;11(5):1312–1316. [Google Scholar]
- 48.Ostwald W. Studienüber die Bildung und Umwandlung fester Körper. Z Phys Chem. 1897;22:289–330. [Google Scholar]
- 49.van Santen RA. The Ostwald step rule. J Phys Chem. 1984;88(24):5768–5769. [Google Scholar]
- 50.Shahidzadeh-Bonn N, Rafaï S, Bonn D, Wegdam G. Salt crystallization during evaporation: Impact of interfacial properties. Langmuir. 2008;24(16):8599–8605. doi: 10.1021/la8005629. [DOI] [PubMed] [Google Scholar]
- 51.Omrane A, Santesson S, Alden M, Nilsson S. Laser techniques in acoustically levitated micro droplets. Lab Chip. 2004;4(4):287–291. doi: 10.1039/b402440k. [DOI] [PubMed] [Google Scholar]
Associated Data
This section collects any data citations, data availability statements, or supplementary materials included in this article.


