Significance
The T-cell–inflamed tumor microenvironment correlates with efficacy of immunotherapy. It is critical to understand whether non–T-cell–inflamed tumors lack antigens for T-cell recognition. In melanoma, no difference between inflamed and noninflamed tumors for multiple antigen classes was observed. Synthesized peptides corresponding to predicted HLA-A2 binding epitopes showed no differences between inflamed and noninflamed tumors. Extrapolation of a T-cell signature across The Cancer Genome Atlas showed no correlation between gene expression and mutational burden in any cancer type. These results indicate that lack of spontaneous immune infiltration in solid tumors is unlikely to be due to lack of antigens. Rather, transcriptional profiling suggests lack of Batf3-lineage dendritic cells. Our data suggest that strategies to restore T-cell entry into noninflamed tumors should be developed.
Keywords: checkpoint blockade, neoantigens, immunotherapy, T-cell inflammation, tumor microenvironment
Abstract
Melanoma metastases can be categorized by gene expression for the presence of a T-cell–inflamed tumor microenvironment, which correlates with clinical efficacy of immunotherapies. T cells frequently recognize mutational antigens corresponding to nonsynonymous somatic mutations (NSSMs), and in some cases shared differentiation or cancer–testis antigens. Therapies are being pursued to trigger immune infiltration into non–T-cell–inflamed tumors in the hope of rendering them immunotherapy responsive. However, whether those tumors express antigens capable of T-cell recognition has not been explored. To address this question, 266 melanomas from The Cancer Genome Atlas (TCGA) were categorized by the presence or absence of a T-cell–inflamed gene signature. These two subsets were interrogated for cancer–testis, differentiation, and somatic mutational antigens. No statistically significant differences were observed, including density of NSSMs. Focusing on hypothetical HLA-A2+ binding scores, 707 peptides were synthesized, corresponding to all identified candidate neoepitopes. No differences were observed in measured HLA-A2 binding between inflamed and noninflamed cohorts. Twenty peptides were randomly selected from each cohort to evaluate priming and recognition by human CD8+ T cells in vitro with 25% of peptides confirmed to be immunogenic in both. A similar gene expression profile applied to all solid tumors of TCGA revealed no association between T-cell signature and NSSMs. Our results indicate that lack of spontaneous immune infiltration in solid tumors is unlikely due to lack of antigens. Strategies that improve T-cell infiltration into tumors may therefore be able to facilitate clinical response to immunotherapy once antigens become recognized.
Novel immune checkpoint blocking immunotherapies have contributed to a marked improvement in the treatment options available to patients with metastatic melanoma and are increasingly being applied to multiple other tumor types (1–3). Despite this activity, only a subset of patients benefit from these therapies, and mechanisms of primary resistance remain incompletely understood. Predictive biomarker studies have indicated a trend toward improved clinical benefit in tumors with strong immunohistochemical staining for programmed death ligand-1 (PD-L1) (3) or the presence of CD8+ T cells within the tumor microenvironment (4). However, composite gene expression profiling may represent a more encompassing biomarker, reflecting the complex biology of the tumor/immune system interaction when the immune response is in fact engaged. T-cell presence is associated with chemokines, which likely mediate their recruitment, as well as expression of other innate immune genes. IFN-γ, produced by activated T cells, up-regulates expression of PD-L1 and indoleamine-2,3-dioxygenase within the tumor site (5), indicating that recruited tumor antigen-specific T cells promote up-regulation of immune-inhibitory pathways (6). Anti-PD-1/PD-L1 antibodies are thought to relieve one component of this inhibition, enabling refunctionalization of tumor-infiltrating CD8+ T cells and subsequent immune-mediated tumor regression (4, 7).
However, a major proportion of patients with melanoma lacks evidence for spontaneous T-cell infiltration within tumor sites at baseline (8), and strong correlations between immunohistochemistry and gene profiling assays have been observed relative to immunotherapy treatment outcomes (9). Thus, absence of a T-cell–inflamed tumor microenvironment appears to approximately correlate with immunotherapy resistance. Understanding molecular mechanisms that explain the exclusion of T cells should ultimately lead to new therapeutic targets with the goal of restoring T-cell engagement at tumors sites and expanding the fraction of patients responsive to immunotherapies. Recent evidence has indicated that tumor-intrinsic activation of specific oncogene pathways can result in immune exclusion. Both the Wnt/β-catenin pathway and PTEN deletion/PI3K activation have been mechanistically shown to reduce T-cell infiltration within the tumor microenvironment, leading to resistance to checkpoint blockade in mouse models (10, 11). Both of these pathways are also associated with lack of T-cell infiltration in human melanoma (10, 11).
As new therapies are being considered and developed to restore innate immune activation and T-cell trafficking into non–T-cell–inflamed tumors, it is critical to understand whether such tumors express antigens for T-cell recognition. One hypothesis for absence of a T-cell–inflamed tumor microenvironment at baseline is lack of antigens, and if that were the case, then immunotherapies might never be effective in such cases. Defined melanoma antigens for T-cell recognition include tissue-specific differentiation antigens, cancer–testis antigens, and neoantigens generated by point mutations in normal genes (12). Whereas melanoma-specific T cells capable of mediating tumor cell killing have been described with specificity for each of these major categories of antigen, recent attention has focused on mutational neoantigens. A major subset of patients showing clinical benefit to tumor-infiltrating lymphocyte adoptive transfer have been shown to have T cells specific for mutational neoepitopes (13). In addition, clinical response to checkpoint blockade has been associated with expansion of T cells specific for neoantigens in some patients (14). A recent report has suggested that clinical benefit to the anti–CTLA-4 mAb ipilimumab in melanoma was correlated with a higher overall mutational load (15), although there was significant overlap between the cohorts.
Understanding whether lack of antigens contributes to failed T-cell infiltration into tumors is a critical question, as new therapies are being considered to restore T-cell infiltration into tumors and render them potentially responsive to checkpoint blockade. Only if such tumors remain antigenic can the goal of expanding the proportion of patients responding to checkpoint blockade be realized. In the current study, we used The Cancer Genome Atlas (TCGA) dataset for malignant melanoma to categorize tumors into T-cell inflamed versus non–T-cell inflamed by gene expression profiling, then analyzed the potential for differential abundance of differentiation antigens, cancer–testis antigens, and mutational neoantigens. We combined a computational approach with in vitro immunogenicity studies of selected HLA-A*0201-restricted peptides. Our results suggest that non–T-cell–inflamed melanomas do not lack antigens for T-cell recognition, arguing for other mechanisms for lack of T-cell priming and recruitment. In contrast, non–T-cell–inflamed melanomas lacked markers for Batf3-lineage dendritic cells (DCs), suggesting that failure to recruit and activate this DC subset could be rate limiting.
Comparable analyses across all tumors represented in TCGA suggest that similar mechanisms are broadly involved, paving the way for development of therapeutic strategies to generate spontaneous DC and T-cell infiltration into tumors to expand checkpoint blockade efficacy.
Results
T-Cell–Inflamed and Non–T-Cell–Inflamed Metastatic Melanoma Samples Do Not Differ in the Expression of Differentiation Antigens or Cancer–Testis Antigens.
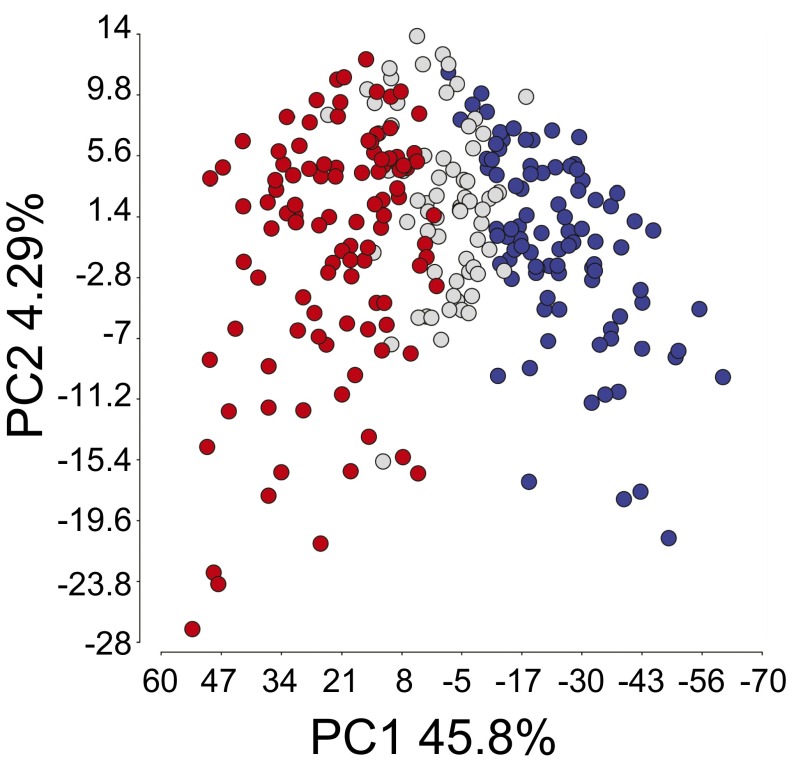
To evaluate the potential for differential antigen expression in T-cell–inflamed and non–T-cell–inflamed melanomas, we used the cohort of 266 metastatic melanoma samples represented in TCGA (10). As shown in Fig. 1, principal component analysis revealed separation of the T-cell–inflamed and non–T-cell–inflamed tumor groups, along with a third cohort of intermediate expression. The inflamed gene signature has been correlated with CD8+ T-cell infiltration by immunohistochemistry (5, 8) and encompasses patterns of transcripts associated with clinical response to immunotherapies (16, 17). For the current analysis, we focused exclusively on the extreme phenotypes, inflamed (n = 106) vs. noninflamed (n = 91). Although the TCGA dataset does not include immunohistochemical analysis of CD8+ T-cell infiltration, our previously obtained data as well as studies by others indicate that extreme gene expression cohorts likely correspond to truly T-cell–inflamed or non–T-cell–inflamed tumors (8, 9, 18).
Fig. 1.
Two-dimensional principle component analysis of 266 metastatic melanoma patient samples. Each circle represents a melanoma sample. The blue, gray, and red colors represent samples with low (noninflamed), intermediate, and high (inflamed) levels of T-cell gene expression, respectively. The variance of the three subsets is described mostly by principle component 1 (PC1; 45.8%) and much less by principle component 2 (PC2; 4.29%).
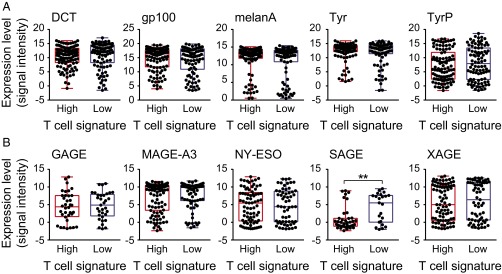
To begin to address whether non–T-cell–inflamed tumors express candidate antigens, the RNA sequencing (RNAseq) data from inflamed and noninflamed melanoma cohorts were examined for level of expression of genes encoding melanoma differentiation antigens and cancer–testis antigens. Expression of dopachrome tautomerase (DCT), gp100, Melan-A/MART1, tyrosinase (Tyr), and tyrosinase-related protein 1 (TyrP) was observed in the majority of tumor samples and no statistically significant difference was found between the inflamed and noninflamed cohorts (Fig. 2A). For the cancer–testis antigens, we examined expression of GAGE, MAGE-A3, NY-ESO1, SAGE, and XAGE, with no statistically significant difference between the inflamed and noninflamed cohorts (Fig. 2B). It is worth noticing that expression of SAGE was found to be significantly lower in T-cell–inflamed tumors, which might indicate a T-cell–inflamed selection against SAGE+ tumor cells. Therefore, lack of evidence for intratumoral T cells in the noninflamed tumor microenvironment cohort does not appear to be secondary to lack of expression of differentiation antigens or cancer–testis antigens.
Fig. 2.
Expression levels of tumor-associated differentiation and cancer–testis antigen genes in inflamed and noninflamed melanomas. (A) Log2-transformed expression levels of the melanoma differentiation antigens DCT, gp100, Melan-A, Tyr, and TyrP are shown for each tumor within the inflamed and noninflamed cohorts (P values in order: 0.53, 0.43, 0.25, 0.28, and 0.29). (B) Log2-transformed expression levels for the cancer–testis antigens GAGE, MAGE-A3, NY-ESO, SAGE, and XAGE are shown for individual tumors within each cohort (P values in order: 0.75, 0.2, 0.92, 0.0011, and 0.59).
Non–T-Cell–Inflamed Melanomas Contain Comparable Numbers of Neoantigens Compared with T-Cell–Inflamed Melanomas.
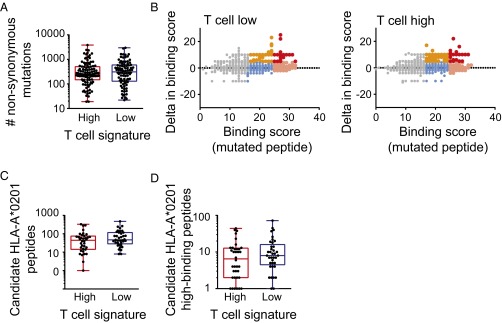
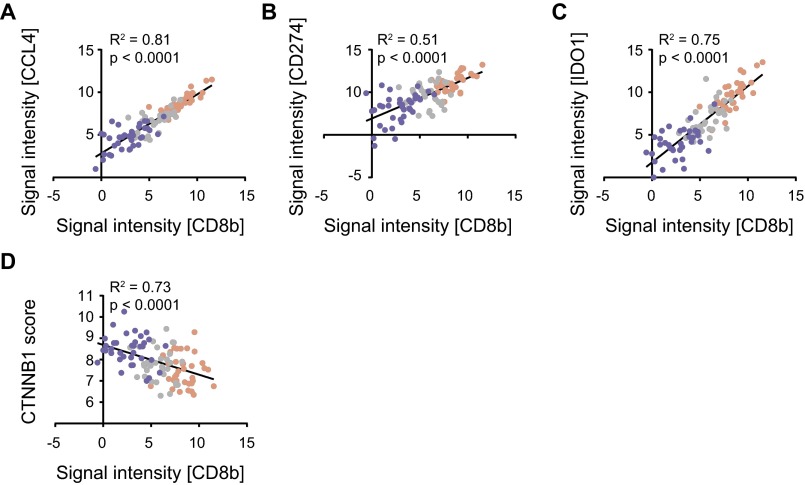
To evaluate expression of candidate neoantigens in inflamed vs. noninflamed melanomas, exome sequencing data were analyzed. By comparing to germline sequences, the overall number of nonsynonymous somatic mutations (NSSMs) was determined in each tumor. In fact, the mean and range of nonsynonymous mutations were virtually identical between the inflamed and noninflamed tumors (453.9 ± 55.9 vs. 481.5 ± 58.3, P = 0.73; Fig. 3A). An algorithm was pursued to identify candidate neoepitopes generated by these mutations. First, genes carrying the mutations were filtered to retain those highly expressed based on RNAseq data. For this purpose, genes expressed below the median expression level across all samples were filtered out. Second, a focus on HLA-A*0201-positive patients was selected, because the prediction algorithms for HLA binding are most reliable for this variant and because it is the most commonly expressed HLA allele in the melanoma population. HLA-A*0201 allele calling was made based on exome sequencing data, and revealed 36 tumors in each of the T-cell signature high and low cohorts. Those tumors seemed representative of the defined phenotypes of the entire cohort, retaining the expected correlation between CD8b and CCL4, CD274 and IDO (Fig. S1 A–C). In addition, we assessed whether a defined β-catenin score would inversely correlate with CD8b in HLA-A*0201 patients, as our previously generated data indicated a strong correlation between the non–T-cell–inflamed phenotype and activation of the WNT/β-catenin signaling pathway (10). Indeed this was the case (Fig. S1D).
Fig. 3.
Neoantigen expression in inflamed and noninflamed patient cohorts. (A) The overall number of NSSMs is presented per tumor, among the inflamed and noninflamed cohorts (P = 0.73, 453.0 = 9 ± 55.9 inflamed, 481.5 ± 58.3 noninflamed, mean ± SEM). (B) Predicted neoepitopes displayed according to HLA-A2 binding scores. Along the x axis are the absolute binding scores (BSs), and along the y axis are the differential binding scores (dBSs) of mutated compared with wild-type peptides (P = 0.36, 65 ± 13 inflamed, 48 ± 15 noninflamed, mean ± SEM). Color code indicates binding strength: gray, BS ≤ 17; blue, BS 17–25 and dBS ≤ 5; orange, BS 17–25 and dBS > 5; peach, BS ≥ 25 and dBS ≤ 5; and red, BS ≥ 25 and dBS > 5. (C) The number of identified candidate HLA-A*0201 binding peptides are plotted for the inflamed and noninflamed cohorts. (D) The subset of candidate peptides with high predicted binding is plotted for the inflamed and noninflamed cohorts (P = 0.44, 5.6 ± 1.2 inflamed, 6.9 ± 1.2 noninflamed, mean ± SEM).
Fig. S1.
Correlation analysis of gene expression in T-cell–inflamed and non–T-cell–inflamed melanomas. (A) Log2-transformed expression levels CCL4 correlated with CD8b expression level. (B and C) Log2-transformed expression levels of CD274 (PD-L1) and IDO1 compared with CD8b expression. (D) Correlation between CTNNB1 score and CD8b expression. All plots show T-cell–inflamed patients as red, intermediate patients as gray, and non–T-cell–inflamed patients as blue. Correlation analysis was done using a Pearson correlation.
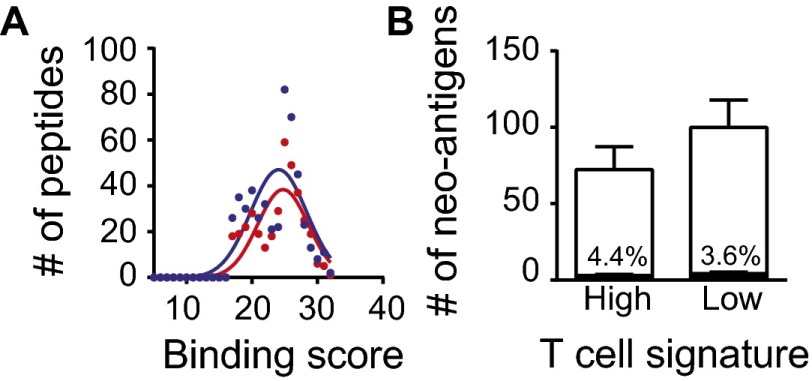
Third, an algorithm was developed for screening candidate HLA-A*0201 binding neoepitopes using the SYFPEITHI web tool (19). Assuming 9-mer peptides, each nonsynonymous mutation could, in principle, give rise to 9 different candidate epitopes depending on the position of the altered amino acid in the MHC peptide-binding cleft. Therefore, a 17-mer centered on each altered amino acid was interrogated, with each sequential register considered for potential HLA binding. At the same time, the wild-type sequences from the same genes were analyzed similarly, and binding scores for corresponding nonmutated peptides were determined. As shown in Fig. 3B, a plot of the absolute binding scores for individual mutated peptides vs. the differential binding scores for mutated over wild-type peptides revealed no overall differences between the inflamed and noninflamed cohorts. We then considered two criteria to designate peptides worthy of further investigation. Any peptide with a differential binding score (mutated minus wild type) of at least 5 was selected, as well as any peptide with a high absolute HLA binding score (≥25). These subsets of candidate peptides are represented by color coding in Fig. 3B. Enumerating either all of the candidate HLA-A*0201 binding peptides (Fig. 3C) or selecting out the high-binding subset (Fig. 3D) revealed no differences between the inflamed and noninflamed cohorts. In fact, a trend toward greater candidate epitopes in the noninflamed tumors was observed. The overall distribution of HLA binding scores for the two cohorts also was examined and revealed no obvious differences (Fig. S2A).
Fig. S2.
Neoantigen expression in HLA-A*0201 inflamed and noninflamed patient cohorts. (A) The overall distribution of binding scores across both tumor cohorts is plotted (P = 0.45, 24.7 ± 3.9 inflamed, 24.1 ± 4.3 noninflamed, mean ± SD). (B) The fraction of peptides containing the so-called tetrapeptide sequences are displayed according to the inflamed and noninflamed cohorts (neopeptides P = 0.99, all peptides P = 0.22, two-way ANOVA).
A recent report has suggested that clinical benefit of patients with melanoma treated with the anti–CTLA-4 antibody ipilumumab was associated with the presence of so called “tetrapeptides” or four amino acid sequences thought to correspond with pathogen-derived antigen sequences (15). However, only a small fraction of tetrapeptide sequences was observed among these candidate epitopes, and there was no difference between inflamed and noninflamed cohorts (4.4% vs. 3.6%, respectively; Fig. S2B).
Non–T-Cell–Inflamed and T-Cell–Inflamed Melanomas Retain Expression of HLA-A*0201.
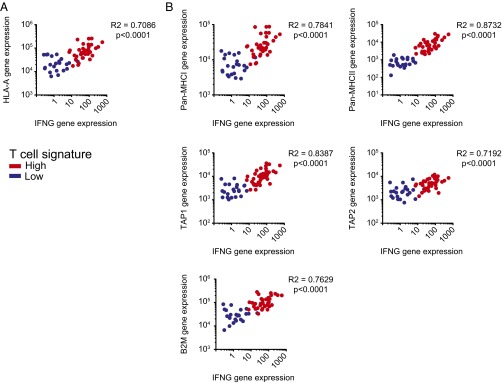
Besides presence of neoantigens with the capacity to bind to HLA-A*0201 within tumor cells, the presentation of such antigens would require expression of HLA molecules and also antigen processing machinery. We therefore assessed HLA-A expression among the HLA-A*0201+ cohort above (Fig. 4A). No tumors showed loss of HLA-A expression, indicating that peptide presentation would be expected to be intact although could have quantitative differences. However, it should be noted that a range of expression of genes encoding MHC molecules, both class I and class II, and also antigen processing machinery genes was observed (including TAP1/2 and beta-2 microglobulin). Indeed, a strong correlation between IFN-γ gene expression and the expression of both MHC and antigen processing machinery genes was observed (Fig. 4B), as expected based on prior work (20). In fact, several of these genes are components of the gene signature used to segregate the tumor samples (10). Collectively, these results argue that the higher HLA expression in T-cell–infiltrated tumors is likely driven by locally produced IFN-γ.
Fig. 4.
Correlation analysis of major-histocompatibility gene expression in T-cell–inflamed and non–T-cell–inflamed melanomas. (A) Expression levels HLA-A correlated with IFN-γ expression level. (B) Expression of Pan-MHCI (HLA-A, HLA-B, HLA-C, HLA-E, HLA-F, HLA-G, HLA-H, HLA-J, and HLA-L), MHCII (HLA-DMA, HLA-DMB, HLA-DOA, HLA-DOB, HLA-DPA1, HLA-DPB1, HLA-DPB2, HLA-DQA1, HLA-DQA2, HLA-DQB1, HLA-DQB2, HLA-DRA, HLA-DRB1, HLA-DRB5, and HLA-DRB6), TAP1, TAP2, and B2M genes, all part of the T-cell signature, in correlation with IFN-γ in melanoma tumors from TCGA. Correlation analysis was performed using a Spearman correlation.
Neoantigens Derived from Non–T-Cell–Inflamed or T-Cell–Inflamed Melanomas Exhibit Comparable Binding to Class I MHC and Immunogenicity in Vitro.
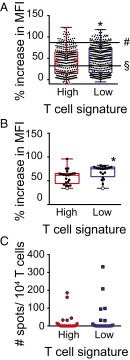
Because the HLA predictive binding algorithms are imperfect, we synthesized all of the identified candidate neoepitope peptides for further study. This amounted to 707 9-mer peptides, 313 identified from the inflamed and 394 from the noninflamed cohort. To evaluate actual binding to HLA-A2, a high-throughput FACS-based T2 peptide binding assay was used, in which augmented HLA-A2 expression was used as a measure of peptide-HLA binding. As controls and to establish reference points, the defined HLA-A2 binding epitopes derived from Melan-A (AAGIGILTV) and from MAGE-A3 (FLWGPRALV) were used, representing relatively weak vs. strong binders, respectively. Both of these reference peptides have been shown to be able to prime de novo CD8+ T-cell responses in vitro, and both have been found to induce specific T-cell responses when used for vaccination of patients in vivo (21). As shown in Fig. 5A, the vast majority of the candidate neoepitope peptides showed detectable binding to HLA-A2, and most of them showed binding that was at least as good as Melan-A, with no differences between the inflamed and noninflamed cohorts (60.1% vs. 63.7%). In addition, the mean HLA binding score for all peptides was only mildly different between cohorts with a trend of a higher binding score in the noninflamed cohort (43.7 ± 1.8 SEM in the inflamed vs. 48.4 ± 2.3 SEM) in the noninflamed, P = 0.04.
Fig. 5.
Immunogenicity of neoantigens obtained from the inflamed and noninflamed patient cohorts. (A) A total of 707 peptides were synthesized and tested for HLA-A2 binding using a high-throughput T2 binding assay. The percent increase of MFI of HLA-A2 expression is shown, among neoantigen peptides identified in the inflamed and noninflamed cohorts (P = 0.04, 43.7 ± 1.8 inflamed, 48.4 ± 2.3 noninflamed, mean ± SEM). As control we assessed the binding of MAGE-A3 (#) and melan-A (§). (B) Plotted are the HLA-A2 binding scores of 20 randomly selected peptides. (C) Selected neoantigen peptides were used to induce de novo T-cell priming using peripheral blood CD8+ T cells (P = 0.02, 58.2 ± 3.3 inflamed, 68.5 ± 3.1 noninflamed, mean ± SEM). The resulting expanded T cells were restimulated with specific peptide and analyzed using an IFN-γ ELISPOT assay (P = 0.44, 24.9 ± 12 inflamed, 43.0 ± 20 noninflamed, mean ± SEM).
To test actual immunogenicity, 20 peptides each from the inflamed and noninflamed cohorts were randomly selected for in vitro priming assays to evaluate the ability to elicit T-cell responses. These selected peptides also showed a comparable range of HLA-A2 binding for the inflamed and noninflamed cohorts (Fig. 5B). The frequency of peptide-specific T cells at the end of the in vitro priming culture was assessed by IFN-γ ELISPOT. Interestingly, ∼25% of these peptides were confirmed to prime a detectable frequency of CD8+ T cells, 5 from the inflamed and 6 from the noninflamed cohorts. No statistically significant difference in percentage or intensity of response could be detected (Fig. 5C). We conclude that the presence of the inflamed tumor microenvironment phenotype in melanoma is likely independent from the presence or absence of immunogenic antigens.
Non–T-Cell–Inflamed Melanomas Show Reduced Expression of Genes Associated with CD141+Batf3-Lineage Dendritic Cells.
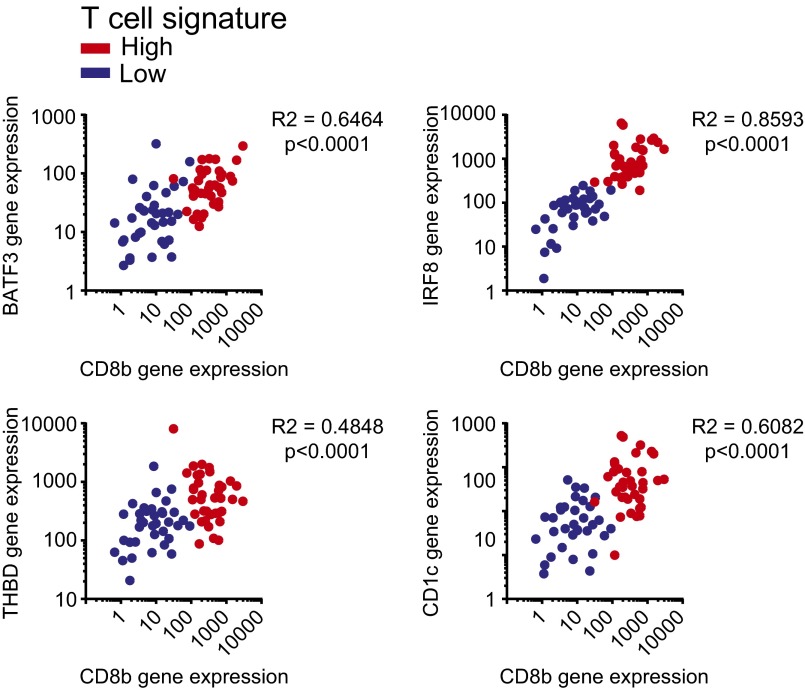
Previous studies have provided evidence that the subset of DCs driven by the transcription factor Batf3 is particularly critical for the induction of spontaneous antitumor CD8+ T-cell responses (10, 22). To obtain insight as to whether CD8+ T-cell infiltration might be associated with the presence of Batf3-lineage DCs within the tumor microenvironment, we assessed expression levels of BATF3, IRF8, THBD (CD141), and CD1c with respect to CD8b expression levels. Indeed, all DC markers were found to be highly correlated with CD8b transcript levels (Fig. 6), supporting the notion that infiltration or accumulation of Batf3 DCs into the tumor microenvironment might be rate limiting in noninflamed tumors. Several studies have provided indication that the subset of DCs is infiltrating upon a CCR5-dependent chemokine signal (10, 23). In fact, we and others have observed a highly significant correlation between the degree of T-cell infiltration and the predominantly tumor cell-derived expression of CCL3, CCL4, and CCL5, all chemokines binding to the CCR5 receptor, suggesting a potentially strong correlation between chemokine suppression, lack of DC infiltration, and thereby mediated lack of T-cell infiltration (8, 10, 24). We also evaluated whether tumor cell-intrinsic activation of Wnt/β-catenin signaling or loss of PTEN, both previously reported to affect accumulation or activation of DCs, might be associated with a skewed neoantigen profile in the HLA-A*0201-positive patients. We did not detect any differences in overall mutational load, candidate HLA-A*0201 binding peptides, or selecting out the high-binding subset (Fig. 7 A–C), indicating that activation of those pathways might be the dominant driver for lack of T-cell infiltration rather than availability of immunogenic antigens.
Fig. 6.
Correlation analysis of DC gene expression in T-cell–inflamed and non–T-cell–inflamed melanomas. Expression levels of BATF3, IRF8, THBD (CD141), and CD1c compared with CD8b expression. Correlation analysis was performed using a Spearman correlation.
Fig. 7.
Neoantigen expression in CTNNB1/PTEN altered inflamed and noninflamed patient cohorts. (A) The overall number of NSSMs is presented per HLA-A*0201 tumor, among the inflamed and noninflamed cohorts separated into CTNNB1/PTEN altered and unknown alterations (no alterations). (B and C) The number of identified candidate (B) and predicted high-binding (C) HLA-A*0201 binding peptides are plotted for CTNNB1/PTEN altered and nonaltered, inflamed and noninflamed cohorts. One-way ANOVA was used to determine significance; shown are boxplots with a 0.05 confidence interval.
Mutational Density Does Not Correlate with the Presence of the T-Cell–Inflamed Tumor Microenvironment Across Multiple Cancer Types.
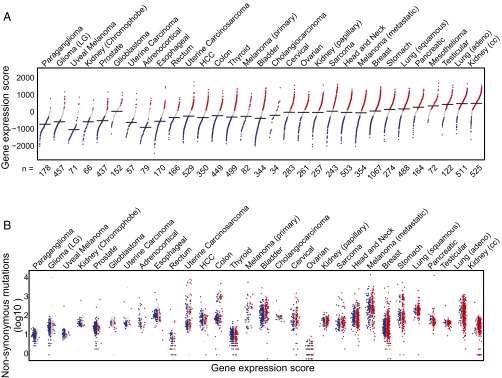
Given the lack of correlation observed between the inflamed tumor microenvironment and immunogenic antigens in malignant melanoma, a broader investigation was pursued to examine this relationship in other solid tumors. To this end, 30 solid tumor cancers from TCGA were segregated into inflamed and noninflamed cohorts, based on the 160 transcripts that are consistently correlated with the T-cell–inflamed signature across all cancers. Each tumor sample was scored as high, intermediate, or low for the T-cell signature, and the tumor types were ranked based on the percentage with the T-cell signature-high phenotype. As shown in Fig. 8A, a wide range of abundance of the T-cell–inflamed tumor microenvironment gene signature was observed. The highest fraction was seen in clear cell kidney cancer and lung adenocarcinoma, whereas almost no samples with a T-cell signature were observed in paraganglioma and low grade glioma.
Fig. 8.
The spectrum of the inflamed tumor microenvironment phenotype across human cancer types. (A) Distribution of inflamed, noninflamed, and intermediate tumors. Each dot represents a single sample, with the black horizontal lines indicating the median value of weighted gene expression score (shown on the vertical axis) in the respective cancer types. The numbers on the horizontal axis represent the total number of tumor samples in each cancer type. The color of dots represents the inflamed (red), intermediate (gray), and noninflamed (blue) tumor cohorts. Cancer types are ordered by their percentage of inflamed tumors, with the extreme noninflamed cancer (Left) (paraganglioma) and the extreme inflamed cancer (Right) (renal clear cell carcinoma). (B) Somatic mutation density observed in exomes from the same tumors in A. The vertical axis (log10 scaled) shows the total number of NSSM and indels, with the cancer types ordered the same as in A. Within each cancer, samples are ordered by the gene expression score, with the lowest to the Left (blue, noninflamed) and the highest to the Right (red, inflamed). Note that exome sequencing data were not available for mesothelioma, so that tumor type does not appear in B.
Exome sequencing data were then analyzed for the abundance of nonsynonymous mutations in each tumor type. These were enumerated within the T-cell signature high, intermediate, and low phenotypes (color coded in Fig. 8B). As expected, a wide range of frequencies of nonsynonymous mutations was observed, with some of the highest values being seen in cancers known to be associated with mutagenic carcinogens (melanoma, lung, and bladder cancer). In contrast, paraganglioma and uveal melanoma showed very low mutational burdens. Of note, there was no overall correlation between the percentage of tumors showing presence of the T-cell gene signature and the average number of nonsynonymous mutations. For example, clear cell kidney cancer displayed the highest fraction of tumors with the T-cell gene signature, yet on average there were more than 10 times fewer nonsynonymous mutations per tumor compared with nonsmall cell lung cancer. In addition, anti–PD-1 antibodies have been FDA approved for the treatment of both of these cancer types, with a similar overall response rate of 20–25% (25–27). Other outliers include adrenocortical carcinoma, which showed a moderate mutational load similar to kidney cancer yet a very low percentage of tumors expressing the T-cell gene signature, and ovarian cancer, which displayed an extremely low mutational burden yet a high frequency of tumors with the T-cell gene signature still having a demonstrated response rate to anti-PD-1 (28). In addition, the mutational load broken down into the T-cell gene signature high, intermediate, and low subsets within each cancer type showed no correlation. In each case, tumors lacking the T-cell gene signature nonetheless showed a comparable number of nonsynonymous mutations compared with the T-cell signature high subset. We conclude that absence of mutational neoepitopes is unlikely to explain lack of a T-cell–inflamed tumor microenvironment in any of these cancer types.
Discussion
Our current interrogation of metastatic melanoma has indicated that tumors displaying the noninflamed tumor microenvironment do not appear to lack antigens capable of being recognized by CD8+ T cells. We found comparable expression of differentiation antigens, cancer–testis antigens, and mutational neoantigens in both inflamed and the noninflamed cohorts. Peptides derived from these classes of antigens have been shown to be immunogenic and have been reported to be associated with effective antitumor immunity in patients, either via endogenous immune responses, adoptive T-cell transfer, or checkpoint blockade therapies (29). Thus, we conclude that the lack of spontaneous T-cell infiltration in the noninflamed tumor microenvironment is not due to lack of antigen expression.
The generation of a spontaneous T-cell response against tumors is a complex and multistep process. Innate immune sensing of tumors is largely driven by the STING pathway that normally detects cytosolic DNA within antigen-presenting cells. STING−/− mice fail to generate an effective spontaneous antitumor T-cell response, which is associated with defective recruitment and activation of the Batf3-lineage DCs expressing CD8α or CD103 in the mouse (30). Downstream from STING pathway activation is the induction of type I IFNs (in particular IFN-β), which is critical to promote cross-presentation of antigens by Batf3-lineage DCs to CD8+ T cells. Analysis of the melanoma TCGA data has indicated a correlation between T-cell markers and both Batf3 and type I IFN-induced genes (10). These data suggest that lack of T-cell activation and infiltration in the non–T-cell–inflamed tumor microenvironment cases is likely secondary to failed recruitment and activation of Batf3-lineage DCs. This notion is supported by the strong correlation between CD8 gene transcripts and dendritic cell markers, described herein. This model accounts for more of the available data than does the hypothesis that this subset of tumors lacks antigens for recognition.
Molecular mechanisms that might explain lack of recruitment and activation of Batf3-lineage DCs in noninflamed tumors are being elucidated, with one defined pathway being tumor-intrinsic Wnt/β-catenin activation (10). A second identified pathway contributing to T-cell exclusion is PTEN loss/PI3K activation (11). In that study, a PI3Kβ inhibitor could act synergistically with checkpoint blockade for improved tumor control in vivo, arguing that it may be possible to target immune-exclusionary oncogene pathways to expand immunotherapy efficacy. In fact, we failed to observe any differences in antigen load between patients with or without alterations of those pathways, indicating that oncogene-mediated lack of DC recruitment might be a dominant mechanism rather than antigen availability. Importantly, documentation that noninflamed tumors do indeed express antigens for potential recognition by CD8+ T cells provides encouragement to continue to develop novel therapies to restore T-cell activation and trafficking into these tumors with the hope of rendering them responsive to checkpoint blockade therapy.
Our data do not directly address whether clinical activity of checkpoint blockade immunotherapy is associated with high neoepitope density, as has been suggested recently. Within T-cell–inflamed tumors, clinical efficacy may be favored in the context of tumors with a greater range of antigens available for T-cell recognition. Related observations have been reported correlating higher levels of cytolytic granule genes to the overall mutational load, although there was overlap between cohorts (31). Additionally, not all potential somatic genomic changes have been analyzed systematically. Other types of genomic aberrations such as large-scale structural variants, gene fusions, or alternative splicing events have not been investigated. Another limitation of TCGA is the fact that, with the exception of melanoma, the samples were derived from primary tumors rather than metastases. While it seems unlikely that mutational density would decrease with the metastatic process, it is very plausible that the proportion of samples having a T-cell infiltrate may be less in metastatic lesions, as immune-exclusionary oncogene pathways may be selected for under immune pressure. Nonetheless, our results confirm that multiple types of antigens are indeed expressed in noninflamed melanomas, and that mutational load is not diminished in non–T-cell–inflamed subsets of any other cancer type within TCGA. Therefore, it is hoped that continued pursuit of new therapeutic interventions that might enable T-cell trafficking into noninflamed tumors (e.g., STING agonists, stereotactic radiation, β-catenin inhibitors) may ultimately expand the proportion of patients who benefit from immunotherapies such as checkpoint blockade.
Materials and Methods
Gene Expression and Somatic Mutation Profiling on TCGA Malignant Melanoma Samples.
The gene expression and somatic mutation data of malignant melanoma samples were downloaded, processed, and used for identification of tumor groups following the strategy described previously (10). In brief, 15,974 genes represented by the RNAseq data were grouped using unsupervised hierarchical clustering methods. Clusters containing the 13 established T-cell gene signatures (CD8A, CCL2, CCL3, CCL4, CXCL9, CXCL10, ICOS, GZMK, IRF1, HLA-DMA, HLA-DMB, HLA-DOA, and HLA-DOB) were retrieved to categorize 266 melanoma metastatic samples into high, intermediate, and low expression tumor groups. The somatic mutations were annotated and filtered by minor allele frequency (MAF) <0.01 derived from the 1000 Genomes Project (32) (phase 1, release v3, 20101123) and the National Heart, Lung, and Blood Institute (NHLBI) Exome Sequencing Project (ESP6500SI-V2-SSA137). Synonymous single nucleotide variants (SNVs) were excluded from further consideration. For gene expression correlation analysis the expression level of each gene of interest of non–T-cell–inflamed, intermediate, and T-cell–inflamed, HLA-A*0201-positive patients was correlated to the expression of CD8b for each patient. Similarly, the CTNNB1 score (mean expression of TCF1, TCF12, MYC, EFNB3, VEGFA, and APC2) was correlated with CD8b expression for each patient.
In Silico HLA Haplotyping on TCGA Malignant Melanoma Samples.
A total of 542 whole exome sequencing read alignment files were downloaded from CGHub (33) in binary sequence alignment/map (BAM) format (34) for 261 malignant melanoma samples (5 of 266 samples did not have exome data available). Reads were retrieved from the BAM files, converted to FastQ format, and combined at the sample level. Two independent pipelines were used for HLA allele genotyping identification and inferences, ATHLATES (35) and PHLAT (36). Reads were aligned to all HLA cDNA and genomic sequences from the HLA/ImMunoGeneTics (IMGT) database using Burrows–Wheeler Aligner (in PHLAT pipeline) or novoalign (in ATHLATES pipeline) (Novocraft Technologies, www.novocraft.com). Patients predicted to be HLA-A*0201 positive by each pipeline were combined and carried on for further analysis.
Peptide-HLA-A2 Binding Prediction on TCGA Malignant Melanoma Samples.
The altered protein sequences resulting from NSSMs were predicted by the Variant Effect Predictor v78 (37). The 17-mer amino acid sequences centered on each somatic mutation were extracted from both the reference (wild type) and altered proteins. A 9-mer sliding window was applied to each reference and altered 17-mer pair to obtain binding scores from the SYFPEITHI web server (19), using a code algorithm developed in Python.
T2 Cell-Based HLA-A2 Peptide Binding Assay.
Synthesized peptides were purchased from Cellmano Biotech. The sequences are listed in Table S1. Peptides were dissolved into DMSO and added to T2 cell cultures at a concentration of 50 μM. The T2 cells were incubated for 2 h at 37 °C. DMSO alone was added as negative control. The excess peptide was washed off using FACS buffer and the T2 cells were labeled using a FITC-conjugated anti-HLA-A2 antibody (One Lambda) following the manufacturer’s instructions. The labeled T2 cells were analyzed on MACSQuant Analyzer (Miltenyi Biotec) using a 96-well plate reader format. The peptide binding ability was calculated using the formula mean fluorescent intensity (MFIpeptide − MFIDMSO)/MFIDMSO × 100%.
Evaluation of Peptide Immunogenicity.
HLA-A*0201 normal donor blood was purchased from Research Blood Component. Peripheral blood mononuclear cells (PBMCs) were isolated using Ficoll-Hypaque gradient centrifugation. CD8+ T cells were isolated from the PBMCs using CD8+ selection beads (Miltenyi Biotec). Monocytes were then isolated from the CD8− fraction using the human pan-monocyte isolation kit from Miltenyi Biotec and cultured in AIM-V medium with the presence of IL-4 and GM-CSF for 6 d. The resulting immature DCs were matured with IL-4, GM-CSF, IL-1β, IL-6, TNF-α, and PGE2 for 48 h. The mature DCs were then pulsed with peptide at a concentration of 50 μM in the presence of 2.5 μg/mL β2 microglobulin for 2 h at 37 °C then irradiated at a dose of 3000 rads. The previously isolated CD8+ T cells were then cocultured with the peptide-pulsed, irradiated DCs in the presence of IL-6 and IL-12 for 1 wk and restimulated with the peptide-pulsed, irradiated DCs in the presence of IL-2 and IL-7 for another week. The resulting CD8+ T cells were restimulated with the same peptide and analyzed using an IFN-γ ELISPOT assay. Plates were read and counted using a CTL-ImmunoSpot S6 Core Analyzer from Cellular Technology.
TCGA All Cancer Datasets.
Gene expression data (release date February 4, 2015) and somatic mutation data (release date April 2, 2015) were downloaded for 30 solid tumor types from TCGA (acute myeloid leukemia, diffuse large B-cell lymphoma, and thymoma were excluded because of high tumor-intrinsic immune cell transcripts). Skin cutaneous melanoma had both primary and metastatic samples available, whereas the other 29 cancers had only primary tumors available. A total of 9,555 tumor samples were included in the analysis.
Gene Expression and Somatic Mutation Profiling Across All Cancer Types.
For each cancer type, raw read counts mapped to gene features were processed by upper quartile normalization followed by log2 transformation. Genes expressed in fewer than 50% of the samples were removed from further analysis. Unsupervised hierarchical clustering with K equal to 12 and Euclidean distance was conducted on the normalized gene expression matrix. Clusters containing the 13 established T-cell gene signature were selected. A total of 160 genes that consistently coclustered with the 13 genes were retrieved for further analysis (also known as “concordant gene list”). Somatic mutations were annotated for affected genes, consequence on the protein sequence, and MAF derived from the 1000 Genomes Project and NHLBI GO Exome Sequencing Project (ESP6500). Synonymous SNVs and variants with MAF ≥0.01 were removed. Mutation density was calculated as the total number of somatic NSSM and insertions/deletions (indels) in each tumor compared with their matched normal.
Identification of T-Cell–Inflamed and Non–T-Cell–Inflamed Groups Across All Cancer Types.
A two-level quantitative scoring system was developed to categorize tumors into three groups: non–T-cell inflamed, T-cell inflamed, and intermediate, based on the expression profile of the concordant genes. Level 1 defines the group to which a tumor belongs. Gene expression values were converted to a score Si = µi ± βiσi (i = 1,2, … n), where µ and σ represent the mean and SD of the ith gene’s expression across all samples, respectively. n is the total number of genes. β represents the distance between the ith gene’s expression in a sample and its mean in the unit of SD (equivalent to a z score). In this system, the threshold for non–T-cell–inflamed and T-cell–inflamed tumors was β0 = 0.1. As a result, samples with at least half of the concordant genes (80) with a score lower than µ − 0.1σ are non–T-cell inflamed, those higher than µ + 0.1σ are T-cell inflamed, and samples in between are intermediate. Level 2 defines the magnitude of T-cell–inflamed gene expression a given tumor sample has. The “fold change” of how much a gene is expressed lower/higher than the baseline is measured by βi − β0, hence the level 2 scores (also known as “weighted”).
Statistical Testing.
If not indicated differently, a Student t test was used to determine significance with a P <0.05.
Regulatory Approvals.
Gene expression and exome sequencing data were obtained from TCGA and were deidentified. In vitro immunogenicity assays were done with donor PBMCs, obtained from Research Blood Component and also deidentified. No approval by University of Chicago Institutional Review Board was therefore required.
Supplementary Material
Acknowledgments
S.S. was a postdoctoral fellow of the Cancer Research Institute and is currently supported by the National Cancer Institute (NCI) (Grant K99CA204595); J.J.L. was supported by a Paul Calabresi Career Development in Clinical Oncology Award (NIH 1K12CA139160-05), a Young Investigator Award from the Cancer Research Foundation, and the Arthur J. Schreiner Family Melanoma Research Fund, with support from The Center for Research Informatics of the University of Chicago Biological Science Division and The Institute for Translational Medicine/Clinical and Translational Award (Grant NIH UL1 RR024999). This work was supported in part by research funding from Bristol Myers Squibb and Grant R01CA198496 from the NCI. This paper was presented in part at the 51st Annual Meeting of the American Society of Clinical Oncology, Chicago, IL, May 28–June 2, 2015 and the Society for Immunotherapy of Cancer 30th Anniversary Annual Meeting, National Harbor, MD, November 6–8, 2015.
Footnotes
The authors declare no conflict of interest.
This article is a PNAS Direct Submission. P.H. is a Guest Editor invited by the Editorial Board.
This article contains supporting information online at www.pnas.org/lookup/suppl/doi:10.1073/pnas.1609376113/-/DCSupplemental.
References
- 1.Topalian SL, et al. Safety, activity, and immune correlates of anti-PD-1 antibody in cancer. N Engl J Med. 2012;366(26):2443–2454. doi: 10.1056/NEJMoa1200690. [DOI] [PMC free article] [PubMed] [Google Scholar]
- 2.Larkin J, et al. Combined Nivolumab and Ipilimumab or monotherapy in untreated melanoma. N Engl J Med. 2015;373(1):23–34. doi: 10.1056/NEJMoa1504030. [DOI] [PMC free article] [PubMed] [Google Scholar]
- 3.Robert C, et al. KEYNOTE-006 investigators Pembrolizumab versus Ipilimumab in advanced melanoma. N Engl J Med. 2015;372(26):2521–2532. doi: 10.1056/NEJMoa1503093. [DOI] [PubMed] [Google Scholar]
- 4.Tumeh PC, et al. PD-1 blockade induces responses by inhibiting adaptive immune resistance. Nature. 2014;515(7528):568–571. doi: 10.1038/nature13954. [DOI] [PMC free article] [PubMed] [Google Scholar]
- 5.Spranger S, et al. Up-regulation of PD-L1, IDO, and T(regs) in the melanoma tumor microenvironment is driven by CD8(+) T cells. Sci Transl Med. 2013;5(200):200ra116. doi: 10.1126/scitranslmed.3006504. [DOI] [PMC free article] [PubMed] [Google Scholar]
- 6.Gajewski TF, Schreiber H, Fu YX. Innate and adaptive immune cells in the tumor microenvironment. Nat Immunol. 2013;14(10):1014–1022. doi: 10.1038/ni.2703. [DOI] [PMC free article] [PubMed] [Google Scholar]
- 7.Spranger S, et al. Mechanism of tumor rejection with doublets of CTLA-4, PD-1/PD-L1, or IDO blockade involves restored IL-2 production and proliferation of CD8(+) T cells directly within the tumor microenvironment. J Immunother Cancer. 2014;2:3. doi: 10.1186/2051-1426-2-3. [DOI] [PMC free article] [PubMed] [Google Scholar]
- 8.Harlin H, et al. Chemokine expression in melanoma metastases associated with CD8+ T-cell recruitment. Cancer Res. 2009;69(7):3077–3085. doi: 10.1158/0008-5472.CAN-08-2281. [DOI] [PMC free article] [PubMed] [Google Scholar]
- 9.Chen J, et al. Predictive immune biomarker signatures in the tumor microenvironment of melanoma metastases associated with tumor-infiltrating lymphocyte (TIL) therapy. J Immunother Cancer. 2014;2(Suppl 3):P243. [Google Scholar]
- 10.Spranger S, Bao R, Gajewski TF. Melanoma-intrinsic β-catenin signalling prevents anti-tumour immunity. Nature. 2015;523(7559):231–235. doi: 10.1038/nature14404. [DOI] [PubMed] [Google Scholar]
- 11.Peng W, et al. Loss of PTEN promotes resistance to T cell-mediated immunotherapy. Cancer Discov. 2016;6(2):202–216. doi: 10.1158/2159-8290.CD-15-0283. [DOI] [PMC free article] [PubMed] [Google Scholar]
- 12.Snyder A, et al. Genetics and immunology: Reinvigorated. OncoImmunology. 2015;4(10):e1029705. doi: 10.1080/2162402X.2015.1029705. [DOI] [PMC free article] [PubMed] [Google Scholar]
- 13.Gros A, et al. Prospective identification of neoantigen-specific lymphocytes in the peripheral blood of melanoma patients. Nat Med. 2016;22(4):433–438. doi: 10.1038/nm.4051. [DOI] [PMC free article] [PubMed] [Google Scholar]
- 14.McGranahan N, et al. Clonal neoantigens elicit T cell immunoreactivity and sensitivity to immune checkpoint blockade. Science. 2016;351(6280):1463–1469. doi: 10.1126/science.aaf1490. [DOI] [PMC free article] [PubMed] [Google Scholar]
- 15.Snyder A, et al. Genetic basis for clinical response to CTLA-4 blockade in melanoma. N Engl J Med. 2014;371(23):2189–2199. doi: 10.1056/NEJMoa1406498. [DOI] [PMC free article] [PubMed] [Google Scholar]
- 16.Gajewski TF, Louahed J, Brichard VG. Gene signature in melanoma associated with clinical activity: A potential clue to unlock cancer immunotherapy. Cancer J. 2010;16(4):399–403. doi: 10.1097/PPO.0b013e3181eacbd8. [DOI] [PubMed] [Google Scholar]
- 17.Seiwert TY, et al. 2015. Inflamed-phenotype gene expression signatures to predict benefit from the anti-PD-1 antibody pembrolizumab in PD-L1+ head and neck cancer patients. J Clin Oncol 33, (suppl; abstr 6017)
- 18.Sweis RF, et al. Molecular drivers of the non-T-cell-inflamed tumor microenvironment in urothelial bladder cancer. Cancer Immunol Res. 2016;4(7):563–568. doi: 10.1158/2326-6066.CIR-15-0274. [DOI] [PMC free article] [PubMed] [Google Scholar]
- 19.Rammensee H, Bachmann J, Emmerich NP, Bachor OA, Stevanović S. SYFPEITHI: Database for MHC ligands and peptide motifs. Immunogenetics. 1999;50(3–4):213–219. doi: 10.1007/s002510050595. [DOI] [PubMed] [Google Scholar]
- 20.Martini M, et al. IFN-gamma-mediated upmodulation of MHC class I expression activates tumor-specific immune response in a mouse model of prostate cancer. Vaccine. 2010;28(20):3548–3557. doi: 10.1016/j.vaccine.2010.03.007. [DOI] [PubMed] [Google Scholar]
- 21.Gajewski TF, Fallarino F, Ashikari A, Sherman M. Immunization of HLA-A2+ melanoma patients with MAGE-3 or MelanA peptide-pulsed autologous peripheral blood mononuclear cells plus recombinant human interleukin 12. Clin Cancer Res. 2001;7(3 Suppl):895s–901s. [PubMed] [Google Scholar]
- 22.Roberts EW, et al. Critical role for CD103(+)/CD141(+) dendritic cells bearing CCR7 for tumor antigen trafficking and priming of T cell immunity in melanoma. Cancer Cell. 2016;30(2):324–336. doi: 10.1016/j.ccell.2016.06.003. [DOI] [PMC free article] [PubMed] [Google Scholar]
- 23.Aliberti J, et al. CCR5 provides a signal for microbial induced production of IL-12 by CD8 alpha+ dendritic cells. Nat Immunol. 2000;1(1):83–87. doi: 10.1038/76957. [DOI] [PubMed] [Google Scholar]
- 24.Salerno EP, Olson WC, McSkimming C, Shea S, Slingluff CL., Jr. T cells in the human metastatic melanoma microenvironment express site-specific homing receptors and retention integrins. Int J Cancer. 2014;134(3):563–574. doi: 10.1002/ijc.28391. [DOI] [PMC free article] [PubMed] [Google Scholar]
- 25.Borghaei H, et al. Nivolumab versus Docetaxel in advanced nonsquamous non-small-cell lung cancer. N Engl J Med. 2015;373(17):1627–1639. doi: 10.1056/NEJMoa1507643. [DOI] [PMC free article] [PubMed] [Google Scholar]
- 26.Brahmer J, et al. Nivolumab versus Docetaxel in advanced squamous-Cell non-small-cell lung cancer. N Engl J Med. 2015;373(2):123–135. doi: 10.1056/NEJMoa1504627. [DOI] [PMC free article] [PubMed] [Google Scholar]
- 27.Motzer RJ, et al. CheckMate 025 Investigators Nivolumab versus Everolimus in advanced renal-cell carcinoma. N Engl J Med. 2015;373(19):1803–1813. doi: 10.1056/NEJMoa1510665. [DOI] [PMC free article] [PubMed] [Google Scholar]
- 28.Hamanishi J, et al. Safety and antitumor activity of anti-PD-1 antibody, Nivolumab, in patients with platinum-resistant ovarian cancer. J Clin Oncol. 2015;33(34):4015–4022. doi: 10.1200/JCO.2015.62.3397. [DOI] [PubMed] [Google Scholar]
- 29.Ward JP, Gubin MM, Schreiber RD. The role of neoantigens in naturally occurring and therapeutically induced immune responses to cancer. Adv Immunol. 2016;130:25–74. doi: 10.1016/bs.ai.2016.01.001. [DOI] [PMC free article] [PubMed] [Google Scholar]
- 30.Woo SR, et al. STING-dependent cytosolic DNA sensing mediates innate immune recognition of immunogenic tumors. Immunity. 2014;41(5):830–842. doi: 10.1016/j.immuni.2014.10.017. [DOI] [PMC free article] [PubMed] [Google Scholar]
- 31.Rooney MS, Shukla SA, Wu CJ, Getz G, Hacohen N. Molecular and genetic properties of tumors associated with local immune cytolytic activity. Cell. 2015;160(1-2):48–61. doi: 10.1016/j.cell.2014.12.033. [DOI] [PMC free article] [PubMed] [Google Scholar]
- 32.Auton A, et al. 1000 Genomes Project Consortium A global reference for human genetic variation. Nature. 2015;526(7571):68–74. doi: 10.1038/nature15393. [DOI] [PMC free article] [PubMed] [Google Scholar]
- 33.Wilks C, et al. The Cancer Genomics Hub (CGHub): Overcoming cancer through the power of torrential data. Database (Oxford) 2014;2014:bau093. doi: 10.1093/database/bau093. [DOI] [PMC free article] [PubMed] [Google Scholar]
- 34.Li H, et al. 1000 Genome Project Data Processing Subgroup The Sequence Alignment/Map format and SAMtools. Bioinformatics. 2009;25(16):2078–2079. doi: 10.1093/bioinformatics/btp352. [DOI] [PMC free article] [PubMed] [Google Scholar]
- 35.Liu C, et al. ATHLATES: Accurate typing of human leukocyte antigen through exome sequencing. Nucleic Acids Res. 2013;41(14):e142. doi: 10.1093/nar/gkt481. [DOI] [PMC free article] [PubMed] [Google Scholar]
- 36.Bai Y, Ni M, Cooper B, Wei Y, Fury W. Inference of high resolution HLA types using genome-wide RNA or DNA sequencing reads. BMC Genomics. 2014;15:325. doi: 10.1186/1471-2164-15-325. [DOI] [PMC free article] [PubMed] [Google Scholar]
- 37.McLaren W, et al. Deriving the consequences of genomic variants with the Ensembl API and SNP Effect Predictor. Bioinformatics. 2010;26(16):2069–2070. doi: 10.1093/bioinformatics/btq330. [DOI] [PMC free article] [PubMed] [Google Scholar]
Associated Data
This section collects any data citations, data availability statements, or supplementary materials included in this article.


