

Significance
The pervasiveness of influenza among humans and its rapid spread during pandemics create a false sense that all humans are affected equally. In this work, we show that neighborhood-level social determinants were associated with greater burdens of pandemic influenza in 1918 and several other diseases in a major US city. We show that literacy, homeownership, and unemployment were associated with cumulative influenza mortality as well as measures of the speed of transmission using a unique dataset describing the home location and week of death of individuals who died during the influenza pandemic in 1918. Our results suggest that, similar to other infectious diseases, social disparities should be a focus of research and public health response in future pandemics.
Keywords: influenza, 1918, transmission, mortality, sociodemographic
Abstract
Social factors have been shown to create differential burden of influenza across different geographic areas. We explored the relationship between potential aggregate-level social determinants and mortality during the 1918 influenza pandemic in Chicago using a historical dataset of 7,971 influenza and pneumonia deaths. Census tract-level social factors, including rates of illiteracy, homeownership, population, and unemployment, were assessed as predictors of pandemic mortality in Chicago. Poisson models fit with generalized estimating equations (GEEs) were used to estimate the association between social factors and the risk of influenza and pneumonia mortality. The Poisson model showed that influenza and pneumonia mortality increased, on average, by 32.2% for every 10% increase in illiteracy rate adjusted for population density, homeownership, unemployment, and age. We also found a significant association between transmissibility and population density, illiteracy, and unemployment but not homeownership. Lastly, analysis of the point locations of reported influenza and pneumonia deaths revealed fine-scale spatiotemporal clustering. This study shows that living in census tracts with higher illiteracy rates increased the risk of influenza and pneumonia mortality during the 1918 influenza pandemic in Chicago. Our observation that disparities in structural determinants of neighborhood-level health lead to disparities in influenza incidence in this pandemic suggests that disparities and their determinants should remain targets of research and control in future pandemics.
The influenza pandemic of 1918 is one of the most devastating infectious disease outbreaks on record, with an estimated death toll of 50 million worldwide (1). The deadly nature of the H1N1 virus that caused the pandemic, the unique epidemiological features of the pandemic, and the pathophysiology of deaths caused by this virus set this pandemic apart from its successors and its predecessors alike (1). Although there is evidence of substantial geographic variation in mortality rates across countries (2) and even within cities (3), studies of the 1918 pandemic in the United States (4, 5), the United Kingdom (6, 7), Europe (8), South America (9–11), and Asia (12, 13) focus mainly on differences in onset of the pandemic, age-specific mortality, and transmission of the virus across large geographic regions. Few studies have explored the effects of sociodemographic factors on differential mortality during the 1918 pandemic, despite the known impacts of social inequalities on disease progression and outcomes through decreased access to healthcare, overcrowding, comorbidities associated with lower resources, lower nutritional status, and a poor understanding of control measures because of lack of education (14–17). One such study found that excess mortality from 1918 to 1920 was negatively associated with per-head income in many countries (2). The authors attributed this association to a combination of community factors, such as healthcare access, and individual factors, including comorbidities and nutritional status. However, they were unable to separate an impact on incidence of infection from increased case fatality rates, and also, they were unable to detect variation in excess mortality within countries or even finer spatial scales.
Here, we investigate whether sociodemographic factors contributed to the spatial variation in mortality observed within the city of Chicago during the 1918 pandemic. To evaluate the spatial and social dependencies of influenza mortality, we digitized historical maps of point-level mortality incidence published shortly after the pandemic and combined the spatial data with near-contemporaneous US Census data. We constructed a Poisson model with generalized estimating equations (GEEs) model to explore the fine-scale effects of sociodemographic factors, including illiteracy, homeownership, unemployment, and population density, on influenza mortality. Illiteracy has been cited as the closest approximation of socioeconomic and health status (18), whereas high rates of homeownership and low rates of unemployment are often considered predictors of improved financial security, access to healthcare resources, and general health status (19). To test the robustness of our results to the possibility that the pandemic virus (or a related virus) infected significant numbers of individuals in the spring of 1918 (referred to as a herald wave), we used simulations to investigate the impact of an unobserved herald wave on the observed sociodemographic relationships. We also expanded our analysis to investigate the relationship of sociodemographic covariates to diseases other than influenza.
This dataset of point-level mortality data and census tract-level demographic data provides an opportunity to investigate pandemic influenza dynamics at a spatial scale rarely examined for the 1918 pandemic. Some studies have assessed influenza dynamics at the state or county level (2, 20, 21), but temporal and spatial variations have not been widely studied at within-city spatial scales (3). There could be great variations in social status and disease burden across small geographic units, such as census tracts, particularly in a city as large and diverse as Chicago, that might be concealed by analysis at the country or state level. Quantifying the relationship between social disparities and mortality can be helpful for policymakers looking to optimize allocation of interventions during future pandemics of similar severity.
Results
Demographic data from the 1920 census (22) and the home location of pneumonia and influenza mortality data by week from September 29 to November 16, 1918 (23) were available for 496 of Chicago’s 499 census tracts. There were 7,971 influenza and pneumonia deaths in the 7-wk study period. The epidemic peaked in the fourth week (Table S1). There was high mortality incidence in the central and southcentral regions of the city, whereas the northern, western, and southernmost areas of the city experienced a lower disease burden (Fig. 1). The average case fatality rate city-wide was 17.5% during the pandemic period, although this rate is likely to be an overestimate because of underreporting of nonfatal cases.
Table S1.
Characteristics of influenza and pneumonia deaths in Chicago, 1918
| Variable | Cumulative | Week 1 | Week 2 | Week 3 | Week 4 | Week 5 | Week 6 | Week 7 | ||||||||
| N | % | N | % | N | % | N | % | N | % | N | % | N | % | N | % | |
| Influenza and pneumonia deaths | 7,971 | 100 | 436 | 5.47 | 1,030 | 12.92 | 2,149 | 26.96 | 2,142 | 26.87 | 1,258 | 15.78 | 619 | 7.77 | 337 | 4.23 |
| Illiteracy rate, % | ||||||||||||||||
| <0.7 | 1,474 | 18.49 | 138 | 9.36 | 263 | 17.84 | 359 | 24.36 | 340 | 23.07 | 207 | 14.04 | 96 | 6.51 | 71 | 4.82 |
| 0.71–1.91 | 1,648 | 20.67 | 120 | 7.28 | 265 | 16.08 | 444 | 26.94 | 410 | 24.88 | 226 | 13.71 | 106 | 6.43 | 77 | 4.67 |
| 1.92–5.6 | 2,138 | 26.82 | 86 | 4.02 | 252 | 11.79 | 585 | 27.36 | 585 | 27.36 | 350 | 16.37 | 196 | 9.17 | 84 | 3.93 |
| >5.6 | 2,711 | 34.01 | 92 | 3.39 | 250 | 9.22 | 761 | 28.07 | 807 | 29.77 | 475 | 17.52 | 221 | 8.15 | 105 | 3.87 |
| Homeownership, % | ||||||||||||||||
| <3.0 | 2,036 | 25.72 | 124 | 6.09 | 276 | 13.56 | 524 | 25.74 | 541 | 26.57 | 330 | 16.21 | 155 | 7.61 | 86 | 4.22 |
| 3.1–5.3 | 2,265 | 28.61 | 119 | 5.25 | 286 | 12.63 | 628 | 27.73 | 604 | 26.67 | 357 | 15.76 | 170 | 7.51 | 101 | 4.46 |
| 5.4–8.4 | 1,822 | 23.01 | 95 | 5.21 | 227 | 12.46 | 498 | 27.33 | 488 | 26.78 | 279 | 15.31 | 153 | 8.40 | 82 | 4.50 |
| 8.5–19.7 | 1,848 | 23.34 | 98 | 5.30 | 241 | 13.04 | 499 | 27.00 | 509 | 27.54 | 292 | 15.80 | 141 | 7.63 | 68 | 3.68 |
| Unemployment, % | ||||||||||||||||
| <32.0 | 2,342 | 29.38 | 103 | 4.39 | 255 | 10.89 | 640 | 27.33 | 664 | 28.35 | 391 | 16.70 | 198 | 8.45 | 91 | 3.89 |
| 32.1–3.05 | 1,752 | 21.98 | 64 | 3.65 | 178 | 10.16 | 463 | 26.43 | 506 | 28.88 | 308 | 17.58 | 155 | 8.85 | 78 | 4.45 |
| 35.1–37.0 | 1,846 | 23.16 | 119 | 6.45 | 262 | 14.19 | 506 | 27.41 | 489 | 26.49 | 256 | 13.87 | 135 | 7.31 | 79 | 4.28 |
| >37.1 | 2,031 | 25.48 | 150 | 7.39 | 335 | 16.49 | 540 | 26.59 | 483 | 23.78 | 303 | 14.92 | 131 | 6.45 | 89 | 4.38 |
| Population density, per acre | ||||||||||||||||
| <20.32 | 1,515 | 19.14 | 60 | 3.96 | 166 | 10.96 | 371 | 24.49 | 428 | 28.25 | 270 | 17.82 | 157 | 10.36 | 63 | 4.16 |
| 20.233–44.98 | 1,808 | 22.84 | 110 | 6.08 | 271 | 14.99 | 488 | 26.99 | 448 | 24.78 | 272 | 15.04 | 138 | 7.63 | 81 | 4.48 |
| 44.98–66.97 | 1,866 | 23.57 | 140 | 7.50 | 228 | 12.22 | 508 | 27.22 | 508 | 27.22 | 255 | 13.67 | 136 | 7.29 | 91 | 4.88 |
| >66.98 | 2,782 | 35.14 | 126 | 4.53 | 365 | 13.12 | 782 | 28.11 | 758 | 27.25 | 461 | 16.57 | 188 | 6.76 | 102 | 3.67 |
Fig. 1.

Cumulative incidence of influenza and pneumonia mortality per 1,000 by census tracts during the 7 wk of the epidemic in Chicago in 1918. The three empty regions represent the three census tracts for which there were no demographic data that were excluded from analysis. The southernmost empty region is a lake.
Relationship with Sociodemographic Factors.
Fig. 2 shows the weekly point pattern mortality overlaid on a map of illiteracy rates by census tracts. The first deaths were observed in census tracts with higher illiteracy rates. As the epidemic progressed, the disease spread to the neighboring tracts but remained concentrated in the high-illiteracy areas.
Fig. 2.

Point locations of influenza and pneumonia mortality occurring in each week from September 29 to November 16 superimposed on a choropleth map showing illiteracy rates by census tracts in Chicago in 1918.
A Poisson model fit with GEE was used to estimate average mortality per census tract with robust variance. The clustering variable in the model was the census tract, and the correlation in data in each census tract was assumed to be unstructured. Assuming correlation within census tracts, we analyzed association between mortality and illiteracy rate, homeownership, unemployment, and population density. The model also accounted for any unknown correlations between the outcomes and was offset by the total underlying population of each census tract. The multivariate models were also adjusted for age, because pandemic mortality was known to vary by age (1).
The univariate and multivariate analyses’ estimates for risk ratios of mortality rate per census tract are presented in Table 1. Univariate analysis found that illiteracy rate, homeownership, and unemployment were independently statistically associated with mortality. The association between population density and incidence of mortality was nonsignificant. In the multivariate model, for every 10% increase in illiteracy rate within a given census tract, mortality increased by 32.2% [95% confidence interval (95% CI) = 22.2%, 43.0%]. Mortality incidence decreased by 33.7% (95% CI = 24.5%, 41.8%) per 10% increase in homeownership, 19.6% (95% CI = 13.8%, 25.0%) per 10% increase in unemployment rate, and 4.3% (95% CI = 3.1%, 5.5%) per 10% increase in population density. All sociodemographic predictors of mortality were statistically significant in the multivariate model. Mortality was statistically significantly associated with the number of individuals in each census tract over the age of 45 y old but not associated with the number of individuals in other age classes (Table S2). Regression results were insensitive to inclusion of week of epidemic in the analysis (Table S3).
Table 1.
Results of univariate and multivariate GEE regression models of pandemic influenza mortality
| Variables | Univariate regression unadjusted RR (95% CI) | Multivariate regression adjusted RR (95% CI) |
| Percentage illiterate | 1.056 (1.048, 1.063) | 1.028 (1.020, 1.036) |
| Population density (per acre) | 1.001 (0.999, 1.002) | 0.996 (0.994, 0.997) |
| Percentage homeowners | 0.971 (0.961, 0.982) | 0.960 (0.947, 0.972) |
| Percentage unemployed | 0.958 (0.952, 0.964) | 0.978 (0.972, 0.985) |
Age was included but largely nonsignificant (Table S2). RR, risk ratio.
Table S2.
Full results of univariate and multivariate GEE regression models of pandemic influenza mortality as a function of sociodemographic factors, including age (see also Table 1 and Table S3)
| Variables | Univariate regression unadjusted RR (95% CI) | Multivariate regression adjusted RR (95% CI) |
| Percentage illiterate | 1.056 (1.048, 1.063) | 1.028 (1.020, 1.036) |
| Population density (per acre) | 1.001 (0.999, 1.002) | 0.996 (0.994, 0.997) |
| Percentage homeowners | 0.971 (0.961, 0.982) | 0.960 (0.947, 0.972) |
| Percentage unemployed | 0.958 (0.952, 0.964) | 0.978 (0.972, 0.985) |
| Age categories, y | ||
| <1 | 1.001 (0.999, 1.002) | |
| 1–4 | 1.000 (1.000, 1.001) | |
| 5–10 | 1.000 (0.999, 1.001) | |
| 11–15 | 1.000 (1.000, 1.001) | |
| 16–20 | 1.000 (1.000, 1.000) | |
| 21–44 | 1.000 (1.000, 1.000) | |
| ≥45 | 1.000 (1.000, 1.000) |
RR, risk ratio.
Table S3.
Results of a multivariate GEE regression model with week of epidemic added to account for possible correlation induced by time
| Variables | Multivariate regression | |
| Adjusted RR (95% CI) | P value | |
| Percentage illiterate | 1.028 (1.020, 1.036) | <0.001 |
| Population density (people per acre) | 0.996 (0.994, 0.997) | <0.001 |
| Percentage homeowners | 0.960 (0.947, 0.972) | <0.001 |
| Percentage unemployed | 0.978 (0.972, 0.985) | <0.001 |
| Week of epidemic | ||
| Week 1 | Reference | |
| Week 2 | 2.362 (2.05, 2.71) | <0.001 |
| Week 3 | 4.929 (4.31, 5.62) | <0.001 |
| Week 4 | 4.913 (4.31, 5.60) | <0.001 |
| Week 5 | 2.885 (2.52, 3.30) | <0.001 |
| Week 6 | 1.420 (1.22, 1.64) | <0.001 |
| Week 7 | 0.773 (0.655, 0.912) | 0.002 |
| Age categories, y | ||
| <1 | 1.001 (0.999, 1.002) | 0.24 |
| 1–4 | 1.000 (1.000, 1.001) | 0.55 |
| 5–10 | 1.000 (0.999, 1.001) | 0.58 |
| 11–15 | 1.000 (1.000, 1.001) | 0.32 |
| 16–20 | 1.000 (1.000, 1.000) | 0.76 |
| 21–44 | 1.000 (1.000, 1.000) | 0.08 |
| ≥45 | 1.000 (1.000, 1.000) | <0.001 |
The coefficients for all sociodemographic covariates and age categories were unchanged by the inclusion of week. RR, risk ratio.
To explore whether the Poisson model accounted for spatial correlation in the data, Moran’s I (MI) statistic of autocorrelation was calculated for model standardized residuals. The MI estimate for model residuals was statistically significant (MI = 0.09, P < 0.001), although significantly reduced compared with the MI estimate for the raw mortality rates (MI = 0.14, P < 0.001), suggesting that the model accounted for some of the existing spatial autocorrelation.
We investigated the relationship between illiteracy and other diseases in earlier years in Chicago (SI Text) and found that illiteracy was significantly positively associated with all-cause mortality, diphtheria, whooping cough, tuberculosis, and pneumonia (Table S4). Illiteracy was negatively associated with incidence of scarlet fever and measles.
Table S4.
Results of a univariate GEE model of disease incidence as a function of illiteracy rate in Chicago’s 35 wards
| Incidence (outcome) | Unadjusted RR (95% CI) | P value |
| All-cause mortality | 1.067 (1.058, 1.076) | 0.000 |
| Diphtheria | 1.046 (1.034, 1.058) | 0.000 |
| Scarlet fever | 0.988 (0.981, 0.995) | 0.001 |
| Measles | 0.956 (0.949, 0.964) | 0.000 |
| Whooping cough | 1.008 (1.001, 1.016) | 0.024 |
| Tuberculosis | 1.077 (1.069, 1.084) | 0.000 |
| Pneumonia | 1.076 (1.062, 1.091) | 0.000 |
RR, risk ratio.
We next used a GEE model to assess the relationship between pandemic mortality rates and all-cause mortality and disease burden at the ward level. Within Chicago, pandemic mortality rates were negatively associated with rates of scarlet fever, measles, and whooping cough infection and positively associated with cases of tuberculosis and pneumonia (Table S5). Pandemic mortality is significantly linearly associated with all-cause mortality in Chicago and three other cities (Fig. S1).
Table S5.
Results of a univariate GEE model of pandemic mortality rates as a function of all-cause mortality and disease incidence in Chicago’s 35 wards
| Incidence (covariate) | Unadjusted RR (95% CI) | P value |
| All-cause mortality | 1.000 (1.000, 1.000) | 0.071 |
| Diphtheria | 1.000 (0.999, 1.000) | 0.871 |
| Scarlet fever | 1.000 (0.999, 1.000) | 0.000 |
| Measles | 1.000 (0.999, 1.000) | 0.000 |
| Whooping cough | 0.998 (0.997, 0.999) | 0.000 |
| Tuberculosis | 1.000 (1.000, 1.001) | 0.000 |
| Pneumonia | 1.001 (1.000, 1.001) | 0.001 |
RR, risk ratio.
Fig. S1.

Pandemic mortality and all-cause mortality from 1912 to 1917 by ward in four cities. Pandemic mortality, the sum of influenza and pneumonia deaths from September 28 to November 17, 1918 (Chicago), all-cause mortality in September, October, and November of 1918 (Baltimore), or annual 1918 influenza mortality (Buffalo and Philadelphia), is strongly linearly related to all-cause mortality. Blue lines show the best fit linear regression.
Simulations of Spring Outbreak.
There were reports of small influenza outbreaks in Chicago in March of 1918 (24). Such herald waves were common around the world but varied substantially in magnitude. In Geneva, the first pandemic influenza wave occurred in July of 1918 and had an estimated R of less than one-half of that for the fall wave (25). However, two other studies found that transmissibility was significantly higher in the spring wave of three Scandinavian cities, although lower case fatality rates in the spring meant the vast majority of deaths still occurred in the later fall wave (26, 27).
Although the spring wave in Chicago seems to have been isolated to a handful of office buildings and industrial establishments (24), it is possible that this herald wave targeted certain social classes more than others, leaving disproportionately high levels of immune individuals in some census tracts. This underlying population immunity would then impact the spread of the pandemic wave in the fall and threaten our inferences about the impact of sociodemographic disparities in the fall wave. To test this hypothesis, we simulated, with a stochastic, fixed time step susceptible–infectious–recovered (SIR) model, a spring wave in which all individuals in a given census tract were initially susceptible and then, a fall wave in which only individuals who escaped the spring wave were susceptible. We tested multiple initial conditions and relationships between transmissibility and illiteracy and averaged the results of 1,000 simulations in each census tract. A univariate GEE model predicted the relationship between the final outbreak size of the fall wave and illiteracy.
In most cases where transmissibility was defined to be positively associated with illiteracy in both waves, there was still a strong and significant positive association between illiteracy rate and influenza incidence in the fall wave (Fig. S2 and Table S6). When transmissibility was negatively related to illiteracy in both waves (that is, the disease targeted higher social status individuals) and attack rates were low, illiteracy was consistently negatively associated with pandemic incidence in the fall. At higher attack rates, however, or when there was no social dependence imposed in the fall wave, the GEE model could incorrectly predict a relationship between illiteracy and pandemic incidence that does not match the defined relationship. However, the coefficients of these falsely predicted associations are much lower than those observed in the data (Table 1).
Fig. S2.

Spring and fall wave simulations: simulation 1 (Table S6). Stochastic realizations of the transmission model for selected census tracts in the (A) spring and (B) fall outbreaks. (C) Imposed positive relationship between transmissibility and illiteracy during both outbreaks. Fall attack rates in each census tract are highly correlated with (D) spring attack rates and (E) illiteracy rate.
Table S6.
Results of a univariate GEE model of simulated pandemic influenza incidence in the fall after a spring wave as a function of illiteracy rate by census tract
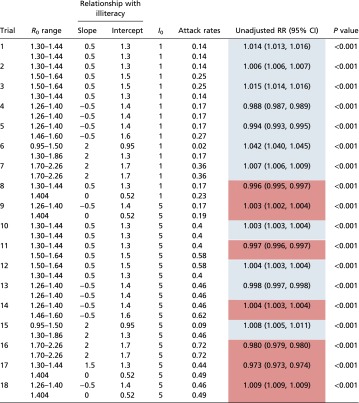 |
The defined relationship between illiteracy and transmissibility was varied in each simulation and could be either positive or negative. Where the GEE model coefficient matches the defined relationship between illiteracy and incidence, values are shaded blue. When there is an inversion in the defined and observed relationships, values are red. Range of reproduction numbers across all census tracts and city-wide attack rates are reported for the spring (first row) and fall (second row) waves of each simulation. RR, risk ratio.
Reproduction Number Estimates and Association with Sociodemographic Factors.
Estimates of reproduction number, R, were calculated for each census tract for the entire 7-wk period (Methods). Because of the spring wave or cases early in the fall possibly inducing some level of immunity in the population, these estimates are likely lower than the true basic reproduction number, R0. The mean R was 1.22 (95% CI = 1.21, 1.23). Table 2 shows the relationship between reproduction number estimates and sociodemographic factors. The strongest correlation was found with population density. R also significantly correlated with illiteracy and counterintuitively, was negatively associated with unemployment. There was no significant relationship between transmissibility and homeownership.
Table 2.
Relationship between reproduction number and sociodemographic factors at the census tract level
| Variables | Correlation coefficient (95% CI) | P value |
| Population density | 0.293 (0.249, 0.306) | <0.001 |
| Illiteracy | 0.262 (0.239, 0.298) | <0.001 |
| Homeownership | −0.071 (−0.038, −0.106) | 0.11 |
| Unemployment | −0.136 (−0.114, −0.179) | 0.002 |
Given by Spearman correlation coefficients; 95% CI generated from 1,000 bootstrapped resampled datasets.
We calculated the reproduction number for each census tract in each week of the epidemic to further explore the effects of illiteracy and population density on transmission at multiple points in the epidemic. Fig. 3A shows mean weekly reproduction number estimates for census tracts grouped by illiteracy rate. As expected, the census tracts with higher rates of illiteracy have greater R estimates throughout the peak of the epidemic. There is a statistically significant correlation between illiteracy and reproduction number in weeks 3–6 (Table S7). As the epidemic slowed, the reproduction numbers for all tracts reduced toward one, and the association between illiteracy and transmissibility became weaker and eventually, nonsignificant. Interestingly, when census tracts are grouped by population density, there is not a clear relationship with transmissibility (Fig. 3B). Only in week 2 is the correlation between population density and R significant (ρ = 0.20, P = 0.001) (Table S7).
Fig. 3.

Effective reproduction estimates by week for (A) illiteracy and (B) population density quartiles. Lines represent mean R at each week for 124 census tracts in each quartile, and shaded regions represent 95% bootstrapped CIs.
Table S7.
Relationship between reproduction number, R, illiteracy, and population density for weeks 1–7 of the pandemic given by Spearman’s correlation coefficient
| Week | Illiteracy | Population density | ||
| Correlation coefficient (ρ) | P value | Correlation coefficient (ρ) | P value | |
| 1 | −0.1339 | 0.17 | 0.0679 | 0.49 |
| 2 | 0.0714 | 0.26 | 0.2048 | 0.001 |
| 3 | 0.3908 | <0.001 | 0.0735 | 0.14 |
| 4 | 0.3101 | <0.001 | −0.0289 | 0.53 |
| 5 | 0.1330 | 0.003 | −0.0047 | 0.92 |
| 6 | 0.1440 | 0.002 | −0.0716 | 0.12 |
| 7 | 0.0689 | 0.13 | 0.0608 | 0.18 |
Spatial Dependence of Influenza Mortality.
By visual inspection, the map of cumulative mortality suggests that there was some spatial clustering of influenza and pneumonia mortality at the census tract level (Fig. 1). We used the spatiotemporal clustering statistic, ϕ(d1, d2), to characterize spatial and temporal dependence of individual deaths (28, 29). This statistic estimates the probability of any two deaths occurring within the same week and within a spatial window of one another relative to the expectation if spatial clustering and temporal clustering were independent (Methods). Any underlying heterogeneities, like population density and reporting rate, are included in the numerator and denominator of this statistic and therefore, do not bias our estimates.
There is moderately strong spatiotemporal dependence of individual deaths at small spatial scales (Fig. 4). Influenza and pneumonia deaths were more than 1.3 times more likely to occur in the same week and within 100 m and roughly 1.2 times more likely to occur in the same week and within 200 m given the underlying spatial and temporal distributions. There is significant, albeit much weaker, clustering at distances up to 1,500 m, beyond which there is no significant spatiotemporal clustering.
Fig. 4.

Short-term spatial dependence of influenza and pneumonia deaths occurring within the same week, ϕ(d1, d2). Spatial window d2 − d1 was held constant at 100 m. Estimates are plotted for the midpoint of each spatial window. The shaded regions represents 95% bootstrapped CIs.
Discussion
This study showed that the 1918 influenza pandemic had strong patterns of spatial clustering and sociodemographic dependence. Prior studies have produced contradictory views on the association between influenza mortality and social status during the 1918 pandemic. Some studies have argued that, because the 1918 H1N1 influenza virus was highly virulent, it indiscriminately killed, regardless of social class (30, 31), whereas some studies have proposed that sociodemographic differences affected mortality during this pandemic at the scale of countries, provinces, and counties (2, 7, 32, 33). This study found that, despite the highly virulent nature of the virus, influenza did not behave in a wholly democratizing fashion at the within-city scale. Rather, there was significant spatial variation in influenza mortality associated with sociodemographic factors, and there is evidence of localized transmission. This study also found that several other infectious diseases were associated with social factors, speaking to overall higher disease burden in areas of lower social status.
Sociodemographic indicators were associated with both the rate at which deaths per week increased (suggesting that transmission was greater in areas of reduced socioeconomic status) and increased cumulative mortality (suggesting increased incidence of infection and/or case fatality rates) during the 1918 pandemic. Note that it is impossible for us to disentangle the impact of these two mechanisms on cumulative mortality. The fact that we observe associations between specific sociodemographic factors, transmissibility, and mortality during 7 wk of the pandemic within a small geographic area allows us to refine some of the hypotheses of mechanisms associating sociodemographic factors and pandemic mortality. Pandemic onset time and physical geography, which may be important in explaining country-wide variance in mortality, vary little within the city of Chicago and are, therefore, unlikely to be important factors in explaining the observed differential mortality. Illiteracy was positively associated with mortality and transmissibility, likely contributing to lower access to medical care as well as decreased awareness and adoption of intervention measures proposed by public health officials, which increases risk of infection and poor clinical outcome (18). The latter explanation may be particularly relevant to the city of Chicago, where strict public health measures, including mandatory quarantines, school closings, and bans on public gatherings, are believed to have significantly reduced the size of the pandemic (34). Underlying health conditions, like chronic obstructive pulmonary disease, tuberculosis, and malnutrition, are known to have a strong social gradient and likely associated with census tracts with lower literacy rates (14, 16). Our findings that illiteracy is significantly and positively associated with ward-level all-cause mortality and incidence of several other infectious diseases in the years before the pandemic speak to the probable lower underlying health status of census tracts with higher illiteracy rates. In fact, the only two diseases that were not positively associated with illiteracy were measles and scarlet fever, which infected the overwhelming majority of the general population in the prevaccination era, and thus, heterogeneity in incidence rate across wards can primarily be attributed to differences in reporting rates.
Rate of homeownership was significantly negatively related to mortality in this study, likely a reflection of the higher income and socioeconomic status of homeowners. More robust measures of socioeconomic status, including poverty indices and per-capita income, were not available in the 1920 census data. Interestingly, it was observed that unemployment, assumed to be a measure of low income and poverty, had a protective effect on influenza mortality and was associated with decreased transmission. This result might be an artifact of the method of quantifying unemployment, which includes individuals who willingly elected not to work and were likely of higher social status (Methods). Unemployment may also result in fewer social interactions and less migration to overcrowded regions, which would reduce risk of infection and death. Finally, the highest mortality during the pandemic was observed in 21–44 y olds, who also make up majority of the working population. The decrease in mortality might reflect the fact that the unemployed population contained disproportionately few members of the age class at the highest risk of mortality compared with the general population.
The range of reproduction numbers across census tracts was 1.09–1.54, which is on the lower end of previous estimates for the 1918 pandemic (35–38). However, basic reproduction numbers (R0) greater than three have been reported on small spatial scales, such as military bases (39), prisons and ships (26), and even in some cities (25). The lower estimates found in this study could be the result of population immunity after a spring outbreak of this pandemic virus in Chicago or the impact of control measures (24, 34).
This study observed a significant association between transmissibility and population density at the census tract level, which has not been observed at greater spatial scales (4, 7). The association between R and population density may be a result of an increased number of effective contacts between individuals in denser population tracts, but the relationship is confounded by the strong associations between population density and other sociodemographic factors and the largely nonsignificant association between population density and weekly R estimates (Tables S7 and S8). Moreover, the increased transmissibility of influenza in more densely populated census tracts did not translate into significantly higher mortality risk, although population density has been linked to pandemic influenza mortality at greater spatial scales (7, 11, 20).
Table S8.
Relationship between sociodemographic factors given by Spearman’s correlation coefficient
| Sociodemographic factors | Correlation coefficient (ρ) | P value |
| Illiteracy and homeownership | −0.2302 | <0.001 |
| Illiteracy and unemployment | −0.5542 | <0.001 |
| Homeownership and unemployment | 0.4275 | <0.001 |
| Population density and illiteracy | 0.1036 | <0.001 |
| Population density and homeownership | −0.4914 | <0.001 |
| Population density and unemployment | −0.1673 | <0.001 |
It is important to note that this study uses influenza and pneumonia mortality data as a proxy for influenza incidence when estimating reproduction numbers. When making inferences about transmissibility, it is preferable to use data on all influenza cases, not just those that resulted in death, to eliminate possible errors from heterogeneity or secular changes in case fatality rates, but this information was not present in the available data. Our transmissibility estimates may be more precise in census tracts with lower socioeconomic status, where there may have been more deaths per influenza infection because of worse preexisting health status and access to healthcare expected in those census tracts. Additionally, it has been shown that climate, particularly temperature and absolute humidity, can have a substantial impact on transmissibility (40). September of 1918 was unseasonably cold throughout Illinois, which may have helped facilitate the rapid spread of influenza in the latter half of the month (41). There are no data on humidity from this time period, but it is unlikely that climate conditions would have varied significantly enough by census tract to cause noticeable differences in transmission at such fine spatial scales.
This study characterized the spatial dependence of influenza deaths at the level of individual cases. The spatial analysis indicates that influenza transmission and mortality were highly localized at small spatiotemporal scales. Deaths were more likely to occur within the same week and a few hundred meters than expected given the underlying spatial and temporal clustering, speaking to the importance of neighborhood-level transmission even in a mobile, urban population. Previous studies found significant autocorrelation in influenza mortality across county boroughs in England and Wales (42) and provinces in Spain (20), but this study is unique in showing a spatial dependence in the spread of individual influenza cases during the 1918 pandemic.
There are several limitations to this study. This study focuses on only one wave of pandemic influenza in Chicago. Other studies have shown significant differences in transmissibility and mortality patterns of different waves of pandemic influenza in 1918 (7, 21). The social and spatial dependencies observed in this study are likely at least partially context-specific and may not hold true for different cities or pandemics. Our simulations indicate that a spring herald wave could not fully explain the observed mortality disparities; however, it may have affected disease spread and mortality in Chicago and other regions. It is important to note that our transmission model does not explicitly account for possible heterogeneity in case fatality rates across census tracts or introductions of cases from outside of the community, both important potential drivers of disparities. There is also potential misalignment between the census data collected in 1920 and the true demographics of Chicago in 1918 that could bias these results. The MI estimate on the residuals of the Poisson model suggests that the model accounted for some but not all of the spatial autocorrelation and that there may be unmeasured predictors of influenza and pneumonia mortality, such as underlying comorbidities. The impacts of the public health interventions implemented may have varied by census tract and could also explain some variability not captured in the model. Socioeconomic and demographic factors could also affect reporting rates of mortality in different census tracts. In lower-status census tracts, more deaths may have occurred at home, and people may have been unaware of ways to report deaths, leading to underreporting that would, in turn, cause the estimates of association between social factors and mortality obtained from this study to be underestimated.
Better understanding of the epidemiology of past pandemics is critical in preparing for future pandemics. This study attempts to fill some of the gaps surrounding the relationship between social status and influenza mortality at the within-city spatial scale of the 1918 pandemic, one of the most studied and impactful infectious disease outbreaks in recorded history. The significant associations between pandemic mortality and sociodemographic factors as well as the absence of a correlation with population density might have been lost if studied on a state- or country-wide scale. Previous studies indicated that the strain of influenza responsible for the 1918 pandemic was highly virulent and infected individuals indiscriminately and regardless of social status or spatial distribution (30, 31). This study suggests that people living in underprivileged neighborhoods, in fact, experienced significantly higher mortality and that the outbreak spread in a spatiotemporally dependent manner. The results from this study will help city public health authorities decide how to optimally visualize their limited resources to improve control strategies to minimize transmission and mortality.
Methods
Data Collection and Outcome Definitions.
Census tract-level data on demographic characteristics in 1920 were collected from the National Historical Geographic Information System website (22). Influenza mortality data were obtained from maps published in a report by the City of Chicago Department of Health after the pandemic (23). Each paper map showed the point location of the home address of individuals who died from influenza or pneumonia in Chicago each week from September 29, 1918 to November 16, 1918. The maps were scanned and georeferenced to raster files using ArcGIS. Locations of the influenza deaths in 1918 were transferred from the digitized maps to a current vector-based shapefile of Chicago. The report included the location of 7,971 influenza and pneumonia deaths in 496 census tracts in Chicago. There were an additional 59 deaths in three census tracts for which there was no demographic information available that were excluded from analysis. Spatial and statistical analyses were performed using ArcGIS, version 10.1 and R (43).
Annual incidence of pneumonia and several other infectious diseases in each of 35 wards of Chicago from 1915 to 1918 was reported in the same City of Chicago Department of Health report (23) (SI Text). We used overlapping shapefiles of wards and census tracts and aggregated data from the constituent census tracts to obtain demographic information in each ward. All-cause and pandemic mortality data from 1912 to 1918 were collected from the Baltimore, Buffalo, and Philadelphia Departments of Health annual reports (44–46).
Association Between Sociodemographic Factors and Mortality.
The covariates included in the Poisson model were age, population density (total population divided by total area in acres of each census tract), illiteracy rate (number of people over 10 y of age who were illiterate divided by the total population in each census tract), proportion of homeowners (number of people who owned houses free and clear, with encumbrance, and with encumbrance status unknown divided by total population in each census tract), and unemployment rate (number of individuals not used in the nine most common professions included in the census survey—agriculture/forestry, mining, factory, transportation, trade, public service, professionals, domestic servants, and clerics—divided by total population in each census tract). Age was categorized as in the original census data: less than 1, 1–4, 5–10, 11–16, 16–20, 21–44, and 45 y old or older.
Univariate analysis was first performed to determine the association of each covariate independently with mortality. A forward stepwise selection approach was used to identify significant predictors in the multivariate model. Population density and age were included in the multivariate model, regardless of significance, because they are very strong confounders of the relationship between sociodemographic factors and mortality. All P values were two sided based on 95% significance levels.
Estimating Transmissibility and Social Determinants of R.
R was estimated for each census tract by substituting an initial exponential growth rate, λ, in an expression derived from the SIR compartmental model
We assumed that influenza incidence grew exponentially for 3 wk after the first influenza or pneumonia death was reported and calculated the initial growth rate, λ, from the epidemic curve of each census tract. The average infectious period (1/γ, where γ is the mean recovery rate) was assumed to be 2.7 d (47). The 95% CIs for reproduction numbers were generated by creating 1,000 bootstrapped resampled datasets of deaths in each census tract, repeating the estimation procedure, and identifying the 2.5 and 97.5 percentiles of these estimates. The 95% CIs on the regression coefficients of sociodemographic covariates with reproduction numbers were created in a similar manner. The correlation between reproduction number and sociodemographic variables in each census tract was explored using Spearman rank correlation coefficients (7).
Analysis of Spatial Dependence.
The ϕ clustering statistic [ϕ(d1, d2)] is defined as the probability of two deaths occurring in a defined spatial and temporal window relative to the independent probabilities of observing two deaths within the spatial window or within the temporal window (29, 30)
where i(d1, d2, t1 = 0, t2 = 1) is the set of all influenza deaths occurring both within the (d1, d2) spatial window of case i and within 1 wk (t1 = 0, t2 = 1) of case i. Window size (d2 − d1) was kept constant at 100 m, and d2 ranged from 100 m to 2.5 km; 95% CIs were calculated using the 2.5 and 97.5 percentiles of 1,000 bootstrap samples.
SI Text
The number of annual cases of scarlet fever, measles, whooping cough, diphtheria, and tuberculosis in each of 35 wards in Chicago from 1915 to 1918 was reported in the same City of Chicago Department of Health report (27). The report also included the number of annual cases and deaths by ward caused by pneumonia from 1912 to 1918. However, because of what seemed to be incomplete reporting from 1918 for some diseases, we only included data up to and including 1917 in our analysis.
To compare our results describing the relationship of pneumonia and influenza mortality with sociodemographic covariates with the same relationships for other diseases, we used a univariate GEE model to determine the association between other infectious diseases and illiteracy at the ward level in Chicago. There are 35 wards in the city of Chicago for which we had data on annual incidence rates of measles, scarlet fever, diphtheria, whooping cough, and tuberculosis from 1915 to 1917 and all-cause mortality and pneumonia incidence from 1912 to 1917. Illiteracy was significantly positively associated with all-cause mortality, diphtheria, whooping cough, tuberculosis, and pneumonia (Table S7). Illiteracy was negatively associated with incidence of scarlet fever and measles.
Acknowledgments
The authors would like to thank the US National Institutes of Health National Institute of General Medical Sciences MIDAS program (U54GM088491) (D.A.T.C. and K.H.G.), the Bill and Melinda Gates Foundation Vaccine Modeling Initiative (D.A.T.C.), and the US National Institutes of Health National Institute of Allergy and Infectious Disease (R01 AI102939) (D.A.T.C. and H.S.) for support of this research.
Footnotes
The authors declare no conflict of interest.
This article is a PNAS Direct Submission.
Data deposition: The data reported in this paper have been deposited in the Dryad Digital Repository, https://datadryad.org (10.5061/dryad.48nv3).
See Commentary on page 13557.
This article contains supporting information online at www.pnas.org/lookup/suppl/doi:10.1073/pnas.1612838113/-/DCSupplemental.
References
- 1.Taubenberger JK, Morens DM. 1918 Influenza: The mother of all pandemics. Emerg Infect Dis. 2006;12(1):15–22. doi: 10.3201/eid1201.050979. [DOI] [PMC free article] [PubMed] [Google Scholar]
- 2.Murray CJL, Lopez AD, Chin B, Feehan D, Hill KH. Estimation of potential global pandemic influenza mortality on the basis of vital registry data from the 1918-20 pandemic: A quantitative analysis. Lancet. 2006;368(9554):2211–2218. doi: 10.1016/S0140-6736(06)69895-4. [DOI] [PubMed] [Google Scholar]
- 3.Mamelund S-E. A socially neutral disease? Individual social class, household wealth and mortality from Spanish influenza in two socially contrasting parishes in Kristiania 1918-19. Soc Sci Med. 2006;62(4):923–940. doi: 10.1016/j.socscimed.2005.06.051. [DOI] [PubMed] [Google Scholar]
- 4.Mills CE, Robins JM, Lipsitch M. Transmissibility of 1918 pandemic influenza. Nature. 2004;432(7019):904–906. doi: 10.1038/nature03063. [DOI] [PMC free article] [PubMed] [Google Scholar]
- 5.Olson DR, Simonsen L, Edelson PJ, Morse SS. Epidemiological evidence of an early wave of the 1918 influenza pandemic in New York City. Proc Natl Acad Sci USA. 2005;102(31):11059–11063. doi: 10.1073/pnas.0408290102. [DOI] [PMC free article] [PubMed] [Google Scholar]
- 6.Langford C. The age pattern of mortality in the 1918-19 influenza pandemic: An attempted explanation based on data for England and Wales. Med Hist. 2002;46(1):1–20. [PMC free article] [PubMed] [Google Scholar]
- 7.Chowell G, Bettencourt LMA, Johnson N, Alonso WJ, Viboud C. The 1918-1919 influenza pandemic in England and Wales: Spatial patterns in transmissibility and mortality impact. Proc Biol Sci. 2008;275(1634):501–509. doi: 10.1098/rspb.2007.1477. [DOI] [PMC free article] [PubMed] [Google Scholar]
- 8.Erkoreka A. The Spanish influenza pandemic in occidental Europe (1918-1920) and victim age. Influenza Other Respi Viruses. 2010;4(2):81–89. doi: 10.1111/j.1750-2659.2009.00125.x. [DOI] [PMC free article] [PubMed] [Google Scholar]
- 9.Chowell G, et al. The 1918-1920 influenza pandemic in Peru. Vaccine. 2011;29(Suppl 2):B21–B26. doi: 10.1016/j.vaccine.2011.02.048. [DOI] [PMC free article] [PubMed] [Google Scholar]
- 10.Chowell G, et al. The 1918-19 influenza pandemic in Boyacá, Colombia. Emerg Infect Dis. 2012;18(1):48–56. doi: 10.3201/eid1801.101969. [DOI] [PMC free article] [PubMed] [Google Scholar]
- 11.Chowell G, Simonsen L, Flores J, Miller MA, Viboud C. Death patterns during the 1918 influenza pandemic in Chile. Emerg Infect Dis. 2014;20(11):1803–1811. doi: 10.3201/eid2011.130632. [DOI] [PMC free article] [PubMed] [Google Scholar]
- 12.Nishiura H, Chowell G. Rurality and pandemic influenza: Geographic heterogeneity in the risks of infection and death in Kanagawa, Japan (1918-1919) N Z Med J. 2008;121(1284):18–27. [PubMed] [Google Scholar]
- 13.Hsieh Y-H. Excess deaths and immunoprotection during 1918-1920 influenza pandemic, Taiwan. Emerg Infect Dis. 2009;15(10):1617–1619. doi: 10.3201/eid1510.080811. [DOI] [PMC free article] [PubMed] [Google Scholar]
- 14.Omachi TA, Sarkar U, Yelin EH, Blanc PD, Katz PP. Lower health literacy is associated with poorer health status and outcomes in chronic obstructive pulmonary disease. J Gen Intern Med. 2013;28(1):74–81. doi: 10.1007/s11606-012-2177-3. [DOI] [PMC free article] [PubMed] [Google Scholar]
- 15.Semenza JC, Suk JE, Tsolova S. Social determinants of infectious diseases: A public health priority. Euro Surveill. 2010;15(27):2–4. doi: 10.2807/ese.15.27.19608-en. [DOI] [PubMed] [Google Scholar]
- 16.Meshram II, et al. Prevalence and determinants of undernutrition and its trends among pre-school tribal children of Maharashtra State, India. J Trop Pediatr. 2012;58(2):125–132. doi: 10.1093/tropej/fmr035. [DOI] [PubMed] [Google Scholar]
- 17.Mayoral JM, et al. CIBERESP Cases and Controls in Pandemic Influenza Working Group, Spain Social factors related to the clinical severity of influenza cases in Spain during the A (H1N1) 2009 virus pandemic. BMC Public Health. 2013;13(1):118. doi: 10.1186/1471-2458-13-118. [DOI] [PMC free article] [PubMed] [Google Scholar]
- 18.Grosse RN, Auffrey C. Literacy and health status in developing countries. Annu Rev Public Health. 1989;10(78):281–297. doi: 10.1146/annurev.pu.10.050189.001433. [DOI] [PubMed] [Google Scholar]
- 19.Marmot M, Friel S, Bell R, Houweling TAJ, Taylor S. Commission on Social Determinants of Health Closing the gap in a generation: Health equity through action on the social determinants of health. Lancet. 2008;372(9650):1661–1669. doi: 10.1016/S0140-6736(08)61690-6. [DOI] [PubMed] [Google Scholar]
- 20.Chowell G, Erkoreka A, Viboud C, Echeverri-Dávila B. Spatial-temporal excess mortality patterns of the 1918-1919 influenza pandemic in Spain. BMC Infect Dis. 2014;14(1):371. doi: 10.1186/1471-2334-14-371. [DOI] [PMC free article] [PubMed] [Google Scholar]
- 21.Stark JH, et al. Local spatial and temporal processes of influenza in Pennsylvania, USA: 2003-2009. PLoS One. 2012;7(3):e34245. doi: 10.1371/journal.pone.0034245. [DOI] [PMC free article] [PubMed] [Google Scholar]
- 22.Minnesota Population Center 2011. National Historical Geographic Information System (University of Minnesota, Minneapolis), Version 2.0.
- 23.City of Chicago Department of Health 1919 Report of the Department of Health of the City of Chicago for the Years 1911 to 1918 Inclusive. Available at https://resource.nlm.nih.gov/101318114. Accessed September 9, 2012.
- 24.Frost WH. The epidemiology of influenza. 1919. Public Health Rep. 2006;121(Suppl 1):149–159. [PubMed] [Google Scholar]
- 25.Chowell G, Ammon CE, Hengartner NW, Hyman JM. Transmission dynamics of the great influenza pandemic of 1918 in Geneva, Switzerland: Assessing the effects of hypothetical interventions. J Theor Biol. 2006;241(2):193–204. doi: 10.1016/j.jtbi.2005.11.026. [DOI] [PubMed] [Google Scholar]
- 26.Vynnycky E, Trindall A, Mangtani P. Estimates of the reproduction numbers of Spanish influenza using morbidity data. Int J Epidemiol. 2007;36(4):881–889. doi: 10.1093/ije/dym071. [DOI] [PubMed] [Google Scholar]
- 27.Andreasen V, Viboud C, Simonsen L. Epidemiologic characterization of the 1918 influenza pandemic summer wave in Copenhagen: Implications for pandemic control strategies. J Infect Dis. 2008;197(2):270–278. doi: 10.1086/524065. [DOI] [PMC free article] [PubMed] [Google Scholar]
- 28.Salje H, et al. Revealing the microscale spatial signature of dengue transmission and immunity in an urban population. Proc Natl Acad Sci USA. 2012;109(24):9535–9538. doi: 10.1073/pnas.1120621109. [DOI] [PMC free article] [PubMed] [Google Scholar]
- 29.Bhoomiboonchoo P, et al. The spatial dynamics of dengue virus in Kamphaeng Phet, Thailand. PLoS Negl Trop Dis. 2014;8(9):e3138. doi: 10.1371/journal.pntd.0003138. [DOI] [PMC free article] [PubMed] [Google Scholar]
- 30.Crosby AW. America’s Forgotten Pandemic: The Influenza of 1918. Cambridge Univ Press; Cambridge, UK: 2003. [Google Scholar]
- 31.Summers JA, Wilson N, Baker MG, Shanks GD. Mortality risk factors for pandemic influenza on New Zealand troop ship, 1918. Emerg Infect Dis. 2010;16(12):1931–1937. doi: 10.3201/eid1612.100429. [DOI] [PMC free article] [PubMed] [Google Scholar]
- 32.Sydenstricker E. The incidence of influenza among persons of different economic status during the epidemic of 1918. 1931. Public Health Rep. 2006;121(4) Suppl 1:191–204. [PubMed] [Google Scholar]
- 33.Pearce DC, Pallaghy PK, McCaw JM, McVernon J, Mathews JD. Understanding mortality in the 1918-1919 influenza pandemic in England and Wales. Influenza Other Respi Viruses. 2011;5(2):89–98. doi: 10.1111/j.1750-2659.2010.00186.x. [DOI] [PMC free article] [PubMed] [Google Scholar]
- 34.Bootsma MCJ, Ferguson NM. The effect of public health measures on the 1918 influenza pandemic in U.S. cities. Proc Natl Acad Sci USA. 2007;104(18):7588–7593. doi: 10.1073/pnas.0611071104. [DOI] [PMC free article] [PubMed] [Google Scholar]
- 35.Lessler J, dos Santos T, Aguilera X, Brookmeyer R, Cummings DAT. PAHO Influenza Technical Working Group H1N1pdm in the Americas. Epidemics. 2010;2(3):132–138. doi: 10.1016/j.epidem.2010.07.001. [DOI] [PMC free article] [PubMed] [Google Scholar]
- 36.Fraser C, Cummings DAT, Klinkenberg D, Burke DS, Ferguson NM. Influenza transmission in households during the 1918 pandemic. Am J Epidemiol. 2011;174(5):505–514. doi: 10.1093/aje/kwr122. [DOI] [PMC free article] [PubMed] [Google Scholar]
- 37.Rizzo C, et al. Epidemiology and transmission dynamics of the 1918-19 pandemic influenza in Florence, Italy. Vaccine. 2011;29(Suppl 2):B27–B32. doi: 10.1016/j.vaccine.2011.02.049. [DOI] [PubMed] [Google Scholar]
- 38.Yang W, Petkova E, Shaman J. The 1918 influenza pandemic in New York City: Age-specific timing, mortality, and transmission dynamics. Influenza Other Respi Viruses. 2014;8(2):177–188. doi: 10.1111/irv.12217. [DOI] [PMC free article] [PubMed] [Google Scholar]
- 39.Sertsou G, Wilson N, Baker M, Nelson P, Roberts MG. Key transmission parameters of an institutional outbreak during the 1918 influenza pandemic estimated by mathematical modelling. Theor Biol Med Model. 2006;3(1):38. doi: 10.1186/1742-4682-3-38. [DOI] [PMC free article] [PubMed] [Google Scholar]
- 40.Lowen AC, Mubareka S, Steel J, Palese P. Influenza virus transmission is dependent on relative humidity and temperature. PLoS Pathog. 2007;3(10):1470–1476. doi: 10.1371/journal.ppat.0030151. [DOI] [PMC free article] [PubMed] [Google Scholar]
- 41.US Department of Agriculture, Weather Branch 1918. Climatological Data: Illinois Section (Weather Bureau Office, Springfield, IL), Vol 22, No. 9. Available at https://catalog.hathitrust.org/Record/009782353. Accessed November 11, 2015.
- 42.Smallman–Raynor M, Johnson N, Cliff AD. The spatial anatomy of an epidemic: Influenza in London and the county boroughs of England and Wales, 1918–1919. Trans Inst Br Geogr. 2002;27(4):452–470. [Google Scholar]
- 43. R Core Team (2015). R: A Language and Environment for Statistical Computing (R Foundation for Statistical Computing, Vienna)
- 44.Baltimore Health Department . Annual Report of the Sub-Department of Health to the Mayor and City Council of Baltimore for the Fiscal Year Ended December 31, 1912–1918. Baltimore Health Department; Baltimore: 1912–1918. [Google Scholar]
- 45.Department of Health of the City of Buffalo (NY) Department . Annual Report of the Department of Health of the City of Buffalo, NY for the Year Ending December 31, 1912–1918. Department of Health of the City of Buffalo, NY Department; Buffalo, NY: 1912–1918. [Google Scholar]
- 46.Philadelphia Bureau of Health . Annual Report of the Bureau of Health of the City of Philadelphia for the Year Ending December 31, 1912–1918. Philadelphia Bureau of Health; Philadelphia: 1912–1918. [Google Scholar]
- 47.Lessler J, et al. New York City Department of Health and Mental Hygiene Swine Influenza Investigation Team Outbreak of 2009 pandemic influenza A (H1N1) at a New York City school. N Engl J Med. 2009;361(27):2628–2636. doi: 10.1056/NEJMoa0906089. [DOI] [PubMed] [Google Scholar]