Significance
The Cancer Genome Atlas datasets were used in the current study to explore the relationship of programmed death ligand-1 (PD-L1) expression, a cytotoxic T-cell gene signature, and mutational load to each other, to immunoactive factors, such as programmed cell death protein-1 (PD-1), PD-L2, and other checkpoint molecules, and to survival across multiple solid tumor types. We found that PD-L2 expression is more closely related to an ongoing host immune response in certain tumor types than PD-L1. Notably, mutational load was not immediately related to inflammation in any tumor type studied, and was inferior to an inflamed tumor microenvironment for predicting survival in patients with metastatic melanoma. Our findings also indicate the need for biomarker assays that are tumor-type–specific and include both expression studies and genomic profiling.
Keywords: PD-1, PD-L1, PD-L2, melanoma, mutational load
Abstract
Programmed cell death protein-1 (PD-1)/programmed death ligand-1 (PD-L1) checkpoint blockade has led to remarkable and durable objective responses in a number of different tumor types. A better understanding of factors associated with the PD-1/PD-L axis expression is desirable, as it informs their potential role as prognostic and predictive biomarkers and may suggest rational treatment combinations. In the current study, we analyzed PD-L1, PD-L2, PD-1, and cytolytic activity (CYT) expression, as well as mutational density from melanoma and eight other solid tumor types using The Cancer Genome Atlas database. We found that in some tumor types, PD-L2 expression is more closely linked to Th1/IFNG expression and PD-1 and CD8 signaling than PD-L1. In contrast, mutational load was not correlated with a Th1/IFNG gene signature in any tumor type. PD-L1, PD-L2, PD-1, CYT expression, and mutational density are all positive prognostic features in melanoma, and conditional inference modeling revealed PD-1/CYT expression (i.e., an inflamed tumor microenvironment) as the most impactful feature, followed by mutational density. This study elucidates the highly interdependent nature of these parameters, and also indicates that future biomarkers for anti–PD-1/PD-L1 will benefit from tumor-type–specific, integrated, mRNA, protein, and genomic approaches.
The host–tumor interaction represents a complex, layered interplay of competing factors, the balance of which ultimately impacts patient survival. Genomic instability gives rise to mutations, facilitating tumor progression (1). At the same time, such mutations generate neoepitopes that may be recognized by the adaptive immune system, eliciting a protective, CD8+ T-cell–mediated antitumor response (2–5). In the next tier of interaction, the tumor may demonstrate programmed death ligand-1 (PD-L1)–mediated adaptive immune resistance, effectively turning off the surveilling T-cells via the programmed cell death protein-1 (PD-1)/PD-L1 axis (6). Agents blocking either PD-1 or PD-L1 prevent this last interaction, allowing an unbridled host response to tumor and potentially tipping the balance in favor of improved patient survival (7–9).
Factors at each of these levels have been highlighted as both prognostic and predictive. The impact of CD8+ T-cell infiltration on survival has been the most well-studied. One meta-analysis summarized that in 58 of 60 articles published, CD8+ immune cell infiltrates were a good prognostic feature in a wide variety of solid tumor types (10). CD8+ T-cell infiltration has also been associated with an improved response to chemotherapy (11, 12), neoadjuvant therapy (13), and most recently, to anti–PD-1 immunotherapy (8). Similarly, immunogenic mutations in six solid tumor types (lung, ovary, breast, colorectal, brain, and kidney cancer in combined analysis) were recently shown to correlate with both CD8+ T-cell infiltration and improved overall patient survival (14). Mutational burden has also recently been demonstrated to predict response to anti–PD-1 therapy in patients with nonsmall cell lung carcinoma (NSCLC) (15).
PD-L1 expression in the pretreatment tumor microenvironment has also been shown to predict response to PD-1/PD-L1 blockade in multiple tumor types (8, 16–19). However, in contrast to CD8, PD-L1 expression has been ascribed ambivalent prognostic significance. It has been correlated with decreased survival in esophageal, gastric, ovarian, pancreatic, and renal cell carcinomas (20–25), and has been associated with an improved survival in patients with Merkel cell (26), breast (27), and cervical carcinomas (28). Conflicting reports also exist regarding its significance within the same tumor type (e.g., melanoma and NSCLC) (6, 29–31). These differences may be attributed to the different detection and scoring systems used to quantify PD-L1 expression, variations in sample size, and variable follow-up duration. The mechanisms underlying PD-L1 expression—for example, an adaptive (IFN-γ–mediated) vs. an intrinsic pattern (because of oncogenic driver mutations, loss of tumor suppressor genes, or PD-L gene amplification)—may also influence the impact of PD-L1 expression on survival as well as its utility as a biomarker for response to anti–PD-1/L1 therapy. The second ligand for PD-1, PD-L2, is not as well-explored as PD-L1; that is, possible adaptive vs. innate mechanisms of PD-L2 expression, its relationship to other markers of the PD-1/PD-L axis, and the prognostic significance of PD-L2 have yet to be broadly and systematically addressed (21, 23, 25, 28, 32, 33). Studies at a protein level have likely been limited because of the lack of a reliable, commercially available anti–PD-L2 antibody. Studies focused on the prognostic and predictive value of PD-1 in the tumor microenvironment are also more limited (8, 18, 25, 34, 35).
The purpose of this study was to use The Cancer Genome Atlas (TCGA) dataset to determine the relationship between cytotoxic T-cells, PD-1/PD-L axis molecules, and mutational load, and their relationship to each other and to survival in melanoma and eight other solid tumor types. The TCGA cohort benefits from a uniform approach to specimen collection, methodology, and data analysis, allowing for standardized, pan-cancer comparisons. We found differences between tumor types with respect to the adaptive mechanism of PD-L/PD-1 expression, the impact of pathway member expression on survival, and how additional immunomodulatory factors associate with the PD-1/PD-L axis. We also demonstrate that the PD-L1 or -L2–mediated adaptive immune resistance phenotype is not a direct function of mutational load in any tumor type studied. These findings broaden our understanding of adaptive immune resistance by tumor and may help inform rational biomarker and treatment combinations.
Results
PD-1/PD-L Expression Levels and Mutational Load Vary by Tumor Type.
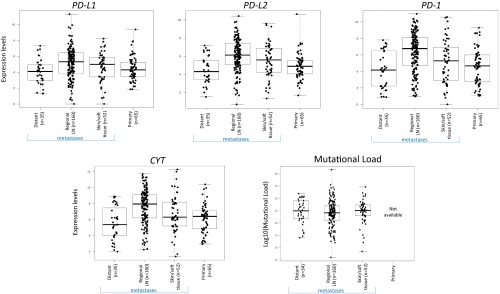
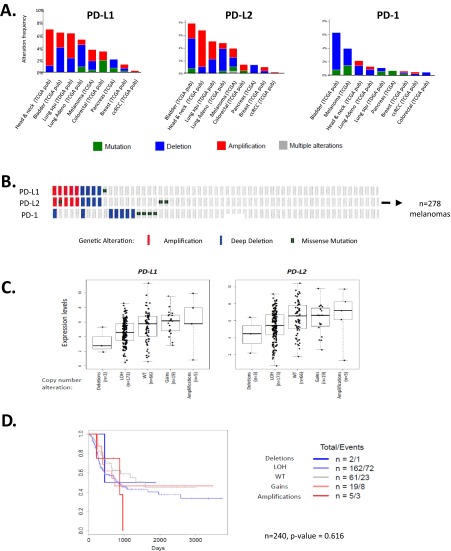
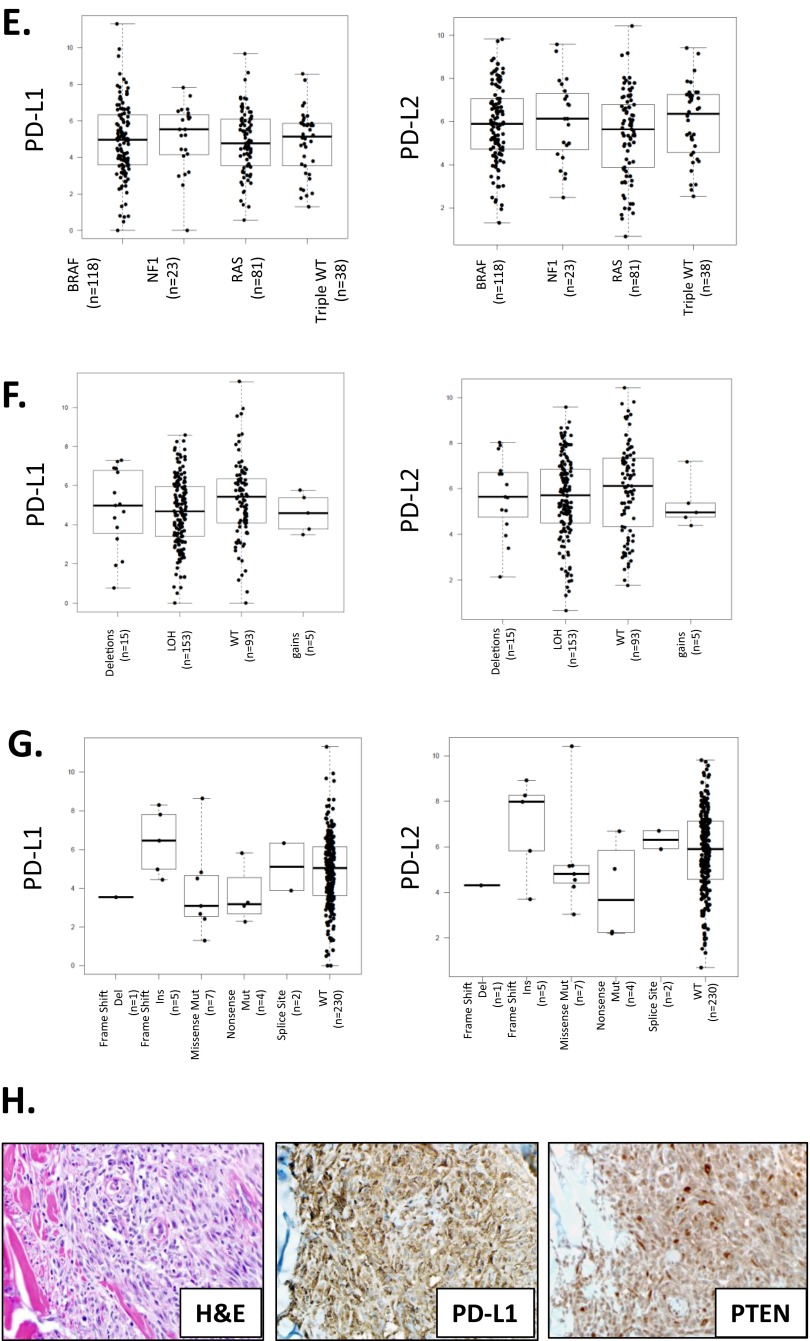
Comparisons of PD-L and PD-1 expression levels among different tumor types have been challenging because of the diverse assays used across studies. Using the TCGA public datasets for melanoma (SKCM) and eight other solid tumor types (KIRC, kidney renal clear cell carcinoma; LUSC, squamous cell carcinoma of the lung; LUAD, lung adenocarcinoma; COAD, colonic adenocarcinoma; HNSC, head and neck squamous cell carcinoma; PAAD, pancreatic adenocarcinoma; BRCA, breast carcinoma; BLCA, bladder carcinoma), we determined the relative expression levels of PD-L1 (CD274), PD-L2 (PDCD1LG2), PD-1 (PDCD1), and CYT (combined GZMA_PRF1 transcript levels, indicating cytolytic effector activity) (5). All cohorts were primary tumors, except for SKCM, where only metastases were studied because of available sample numbers. Importantly, median levels of PD-Ls, PD-1, and CYT expression did not vary significantly between primary or metastases, or by metastatic site for SKCM (Fig. S1). Innate mechanisms of PD-L1 expression have also been described, including amplifications of the PD-L genes and mutations in tumor suppressor genes (36–39). We found that genetic alterations in the PD-Ls themselves occur on average in <5% of tumor types studied, and that these alterations did not lead to statistically different levels of gene expression or altered survival compared with patients lacking such alterations (Fig. S2 A–D). We also found no impact of mutational subtype or phosphatase and tensin homolog deleted on chromosome 10 (PTEN) alteration (36) on PD-L expression levels in patients with melanoma (Fig. S2 E–H). As such, all patients were included in the subsequent analyses.
Fig. S1.
PD-L, PD-1, and CYT expression levels are not dependent on whether the SKCM is a primary lesion vs. a metastasis or the location of the metastasis. Mutational load also does not differ by location of the metastasis. The mutational loads for primary melanomas were not available in the studied dataset.
Fig. S2.
Innate mechanisms of PD-L/PD-1 expression vary by tumor type, but do not influence levels of gene expression or survival outcome. (A) Amplifications and deletions are the most common genetic alterations in PD-L1 and -L2, whereas deletions and mutations are more common for PD-1. Across the PD-L/PD-1 axis, BLCA shows the highest percentage of genetic alterations, with 6–8% of cases demonstrating changes in each molecule. Approximately 4% of melanomas show PD-L alterations, with the largest proportion in both molecules being attributable to gene amplifications, and an only slightly lesser proportion harboring deletions. KIRC, BRCA, and PAAD demonstrate the lowest prevalence of alterations on the PD-1 axis, with <1% of KIRC harboring alterations, all of which are amplifications. (B) In 278 primary and metastatic melanomas studied, 3.6%, 4.0%, and 4.0% of cases show genetic alterations in PD-L1, -L2, and PD-1, respectively. PD-L1 and -L2 amplifications occur in tandem, which is in keeping with their proximity at the 9p24.1 locus, and point mutations are random. (C) PD-L expression does trend toward a relationship with copy number; however, the mean expression levels between groups are not statistically significant. Note that expression of PD-Ls is evident even in the cases with a deleted locus, which is indicative of the presence of PD-L–expressing immune cells. It is likely that such expression by immune cells mutes the potential impact of copy number changes. (D) Patients with copy number alterations in the PD-Ls also did not demonstrate different survival outcomes (data shown here for patients with SKCM). (E) PD-molecule expression is plotted by genetic subtype of SKCM (86), and shows no difference in expression levels between the groups (BRAF and RAS categories include hotspot mutants; NF1 includes any mutants). (F and G) Neither copy number changes or mutations in PTEN, respectively, result in significantly different PD-L1 or -L2 mRNA expression compared with wild-type. One case with a missense mutation in PTEN demonstrated relatively high levels of PD-L1 and -L2, but also had comparably high CYT expression. (H) We also considered that PTEN alteration could influence PD-L expression at a posttranscriptional level (36). To investigate this point, we identified n = 10 SKCM cases with high levels (>50%) of tumor-cell surface PD-L1 expression as observed at the protein level (6). We did not observe any correlation between high PD-L1 expression and PTEN loss. (Original magnification: 400×, all fields.)
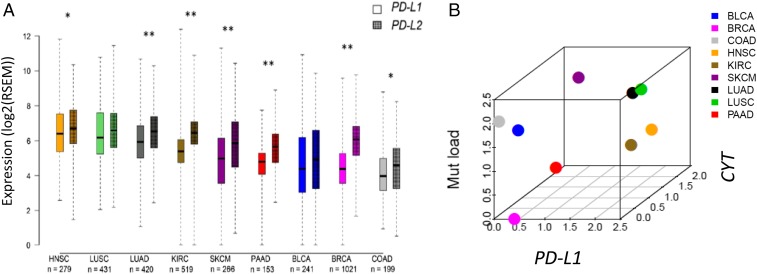
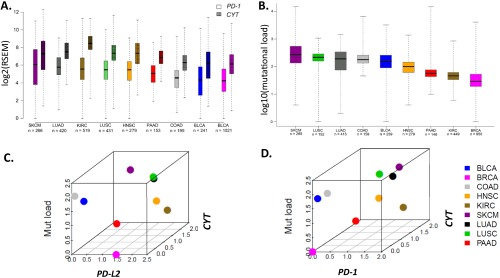
The highest levels of PD-L1 and -L2 expression were seen in the tumor types with squamous differentiation, whereas colonic adenocarcinoma demonstrated the lowest levels of both PD-Ls of the tumor types studied (Fig. 1A). Like PD-L1 and -L2, mean PD-1 and CYT expression levels trended in a paired fashion across the tumor types studied (Fig. S3A). KIRC demonstrated the greatest differential expression of CYT relative to PD-1, whereas SKCM demonstrated the smallest relative difference. For all of the studied markers, greater variances in expression were observed within a given tumor type than across tumor types. A similar finding was previously reported for mutational frequency (40), and was also observed here (Fig. S3B). We generated 3D plots to show the median expression levels for each of the PD-axis molecules, CYT, and mutational load, to determine if the relative relationship between these factors was constant across tumor types. We found that BRCA consistently showed relative low median values for each of these parameters, except for PD-L2 (Fig. 1B and Fig. S3 B and C), whereas both lung cancer histologies consistently showed relatively high median values for each. In general, across the tumor types studied, the relative PD-molecule and CYT expression levels were more closely related to each other than to mutational load.
Fig. 1.
Relative relationships between PD-L1 and -L2 expression levels, as well as relative relationships between PD-L1, CYT, and mutational load across multiple solid tumor types from ∼3,500 patients. (A) Median expression levels of PD-L2 and PD-L1 differ in some tumor types, with KIRC, SKCM, lung, pancreatic, and breast adenocarcinomas demonstrating the largest statistical difference in levels of expression between the two markers (*P < 0.05, **P < 0.001). Overall, each marker demonstrates greater variation of expression within a single tumor type than across tumor types. CYT and PD-1 expression levels and mutational load by tumor type are shown in Fig. S3 A and B, respectively. (B) Three-dimensional plot demonstrating the relative relationships between median PD-L1, CYT expression, and mutational load across tumor types. Three-dimensional plots demonstrating the relative relationships between PD-L2 and PD-1, CYT expression, and mutational load across tumor types are shown in Fig. S3 C and D.
Fig. S3.
Relative relationships between PD-molecules and CYT expression levels as well as mutational load across different cancer types from ∼3,500 patients. (A) PD-1 and CYT expression levels vary by tumor type, with CYT consistently expressed at higher levels than PD-1. As with expression of the PD-Ls (shown in Fig. 1), both markers demonstrate greater variation of expression within a single tumor type than across tumor types. (B) A similar trend in the differences in the median values of mutational load by tumor type, as well as the wide variance within a single tumor type, has been previously reported (40). Three-dimensional plot demonstrating the relative relationship between median (C) PD-L2 or (D) PD-1 and CYT expression levels with mutational load across multiple solid tumor types.
PD-1/PD-L Expression but Not Mutational Density Is Highly Associated with an Antitumor Host Immune Response.
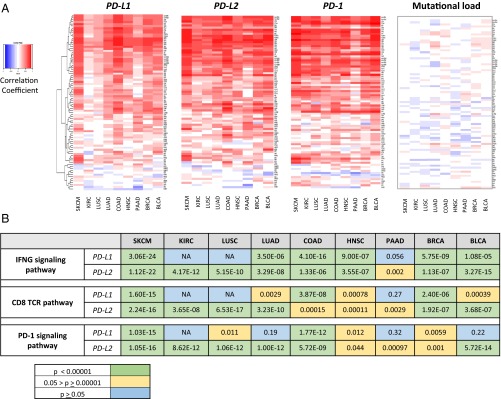
The expression of tumor neoantigens and subsequent recognition by host T-cells is hypothesized to be a major factor underlying the generation of an inflamed tumor phenotype. The antitumor host immune response may then eventuate in PD-L1 and -L2 display in the tumor microenvironment as a means of adaptive (IFN-γ-mediated) immune resistance. The TCGA public datasets were used to test the strength of these associations. Heat maps for a combined Th1/IFNG gene signature (Dataset S1) and the association with PD-molecule expression and mutational load are shown in Fig. 2A. Surprisingly, we found that although PD-axis molecule expression is strongly associated with the Th1/IFNG gene signature, the mutational load of tumors is not.
Fig. 2.
Strong correlations are observed between all PD-axis molecules and the presence of a host immune response, but not mutational load. (A) Heat maps of correlation coefficients between PD-molecules and mutational density and a Th1/IFNG gene signature. When viewed from a pan-cancer perspective, PD-L2 is more strongly associated with an antitumor host immune response than PD-L1. Perhaps most notably, mutational load is not associated with a Th1/IFNG gene signature in any tumor type studied. (B) Every other gene in the TCGA dataset was then studied to expand the analysis of factors that correlated and anticorrelated with PD-L1 and -L2. Cut-offs of 0.6 and −0.6 were used for the correlation coefficients for factors that correlated and anticorrelated with PD-L1, and pathway analysis was performed on these factors. PD-L1 and -L2 expression and the strength of their associations with IFNG, CD8 TCR, and PD-1 signaling vary by tumor type, with a notable lack of an association between PD-L1 expression and IFNG and CD8 TCR signaling in KIRC and LUSC. PD-L2 expression is more closely associated with the PD-1 signaling pathway in many of the tumor types studied. Additional pathways of interest are highlighted in Table S1. NA means a significant number of pathway genes did not have a correlation coefficient >0.6 or <−0.6.
The Th1/IFNG gene signature heat maps also highlighted differences in the strength of the associations across tumor types between PD-molecule expression and the host immune response. We further resolved these findings by performing pairwise correlations between CYT, PD-1, PD-L, and IFNG expression by tumor type, and demonstrated that PD-L1 expression is not associated with PD-1, CYT, or IFNG expression in KIRC or squamous cell carcinoma (SCC) of the lung (Dataset S2). We also performed pathway analysis for IFNG signaling, CD8 T-cell receptor (TCR) pathway and PD-1 signaling on genes correlated with PD-L1 and -L2 expression and found that PD-L2 is more closely related to IFNG, CD8 TCR, and PD-1 signaling pathway expression than PD-L1 in renal cell, lung, pancreatic, and bladder carcinomas (Fig. 2B). Taken together, these findings indicate that in some tumor types, PD-L2 may be a stronger single measure of the presence of an IFNG-mediated antitumor response than PD-L1, and that PD-L–mediated adaptive immune resistance is not a direct function of the tumor’s mutational load.
PD-1/PD-L Axis Expression Associates with Multiple Other Costimulatory and Immunoactive Factors That Vary by Tumor Type.
To expand the study of potential factors associated with PD-axis molecule expression in each tumor type, correlations were calculated between PD-1, PD-L1, and PD-L2 and every other gene in the TCGA dataset to identify genes either correlated or anticorrelated with expression (correlation coefficient >0.6 or <−0.6.). When pathway analyses were conducted on the identified genes, the resultant pathways were almost exclusively immune or inflammatory related, and included many known costimulatory molecules and molecules associated with the adaptive immune response (Table S1). Pancreatic adenocarcinoma was the only tumor type that had factors that notably anticorrelated, and when pathway analysis was performed on these factors, metabolic pathways were highlighted, including the TCA cycle, oxidative phosphorylation, and respiratory electron transport.
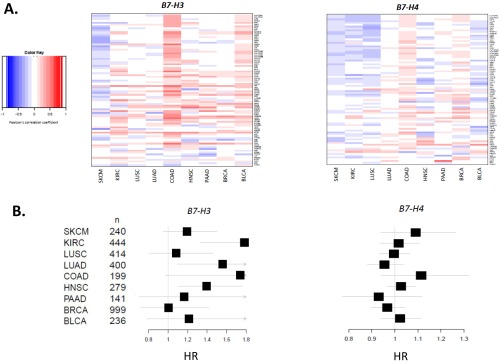
When we conducted pairwise analysis between PD-L1, PD-1, and CYT expression and other known costimulatory and immunoactive elements (Datasets S3–S5), respectively, we identified factors that could potentially be combined with anti–PD-1/PD-L1 therapies. Strong associations of PD-1 and PD-L1 were observed with indoleamine 2,3-dioxygenase (IDO), inducible costimulator (ICOS), CD27, and T-cell immunoreceptor with Ig and ITIM domains (TIGIT), among others, in multiple different tumor types. Notably, the other B7-family members, B7-H3 (CD276) and B7-H4 (VTCN1), did not associate with PD-axis molecules, CYT, or a Th1/IFNG gene signature (Fig. S4A). Similarly, B7-H2 (ICOSL) showed only a weak association with PD-L1, depending on the tumor type (Dataset S3). Regimens including anti–PD-1/PD-L1 coupled with agents targeting these latter molecules may thus be considered a more “orthogonal” approach to combination.
Fig. S4.
B7-H3 and -H4 expression are not associated with an ongoing host immune response against tumor and show distinct effects on survival. (A) Heat maps showing the relationship between B7-H3 and B7-H4 expression and a Th1/IFN-γ gene signature (Dataset S1) by tumor type. Unlike PD-L1 and PD-L2, B7-H3 and -H4 do not show a correlation, save for a weak correlation in microsatellite stable COAD, and in fact appear to be weakly anticorrelated in some tumor types, such as SKCM. (B) Forest plots showing impact on HRs for expression of B7-H3 and -H4 as continuous variables by tumor type. B7-H3 (CD276) expression trends toward an adverse impact on survival in most tumor types studied, whereas the potential impact of B7-H4 (VTCN1) expression on survival is less apparent.
Differential Impact of PD-Ls, PD-1, and CYT Expression and Mutational Load on Survival Across Multiple Solid Tumor Types.
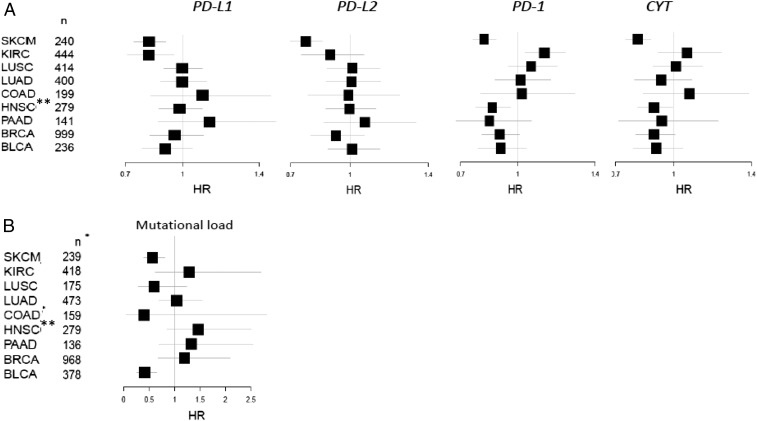
The potential impact of PD-molecule and CYT expression on survival were assessed for each tumor type. The strongest association for each of the factors was seen in SKCM, where each of these factors was shown to be of positive prognostic significance [PD-L1 hazard ratio (HR) = 0.807; PD-L2 HR = 0.761; PD-1 HR = 0.808; CYT HR = 0.798] (Fig. 3A). KIRC also showed an association of PD-L1 with improved survival (HR = 0.816, P value = 0.006), a finding that contradicts prior reports studying both protein and mRNA expression (22, 25), likely because our data are log-transformed, curtailing the potential impact of outliers. Across most of the tumor types studied, CYT expression was associated with improved survival, achieving statistical significance in some. The impact of PD-1 expression on survival tended to track that of CYT, consistent with the high correlations seen between these markers. Notably, the positive association between high PD-1 expression and survival was statistically significant in the case of HNSC, confirming an earlier report (41). Other members of the extended B7-family (i.e., B7-H3 and -H4) were assessed, and B7-H3 showed a consistent trend toward worse survival across nearly all tumor types studied, whereas the impact of B7-H4 varied by tumor type (Fig. S4B).
Fig. 3.
The impact of PD-L1, -L2, PD-1, CYT, and mutational load on survival varies by tumor type. (A) Forest plots showing the impact of PD-molecule and CYT expression on HRs from univariate Cox regression. The strongest associations were seen in SKCM, where all factors studied contributed to an improved prognosis. (B) Mutational load is a positive prognostic feature in SKCM and BLCA. *The number of samples varies between the mRNA expression-based assays and the DNA-based (mutation) analysis. **There was no difference in survival between HPV(+) and HPV(−) variants of HNSCC.
We also tested the impact of mutational load on survival. We found that like PD-molecule expression, the impact of mutational load on survival was also dependent on tumor type (Fig. 3B). Mutational load was a positive prognostic feature in BLCA and in SKCM, and on the opposite end of the spectrum, a high mutational density was an adverse prognostic feature in pancreatic carcinoma, and a similar trend was observed in KIRC. A high mutational load has recently been associated with the desmoplastic variant of SKCM (42). Additionally, desmoplastic melanoma is known to have a better survival than other melanoma subtypes (43). Because the TCGA dataset we studied does not include the desmoplastic variant, the association between mutational burden in SKCM and improved prognosis is a feature that extends beyond this rare subtype. The observed relationship between mutational load and survival in SKCM is particularly noteworthy, given the lack of an association between mutational load and a Th1/IFNG gene signature or PD-molecule or CYT expression and mutational burden. We hypothesize that although the total mutational burden may not immediately correlate with an antitumor immune response, an increase in mutational load increases the likelihood that one of the nonsynonymous mutations will ultimately be uniquely immunogenic (44).
PD-Axis Expression, CYT Expression, and Mutational Load Are Interdependent Factors That Associate with Survival in Melanoma.
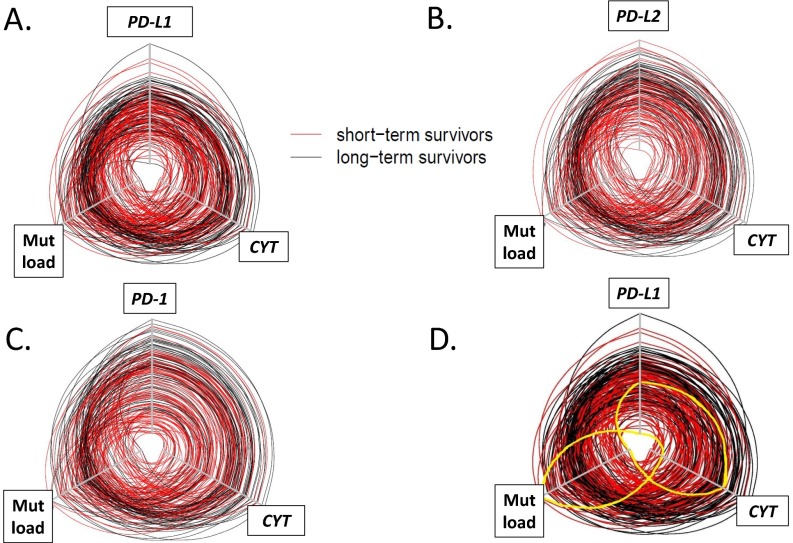
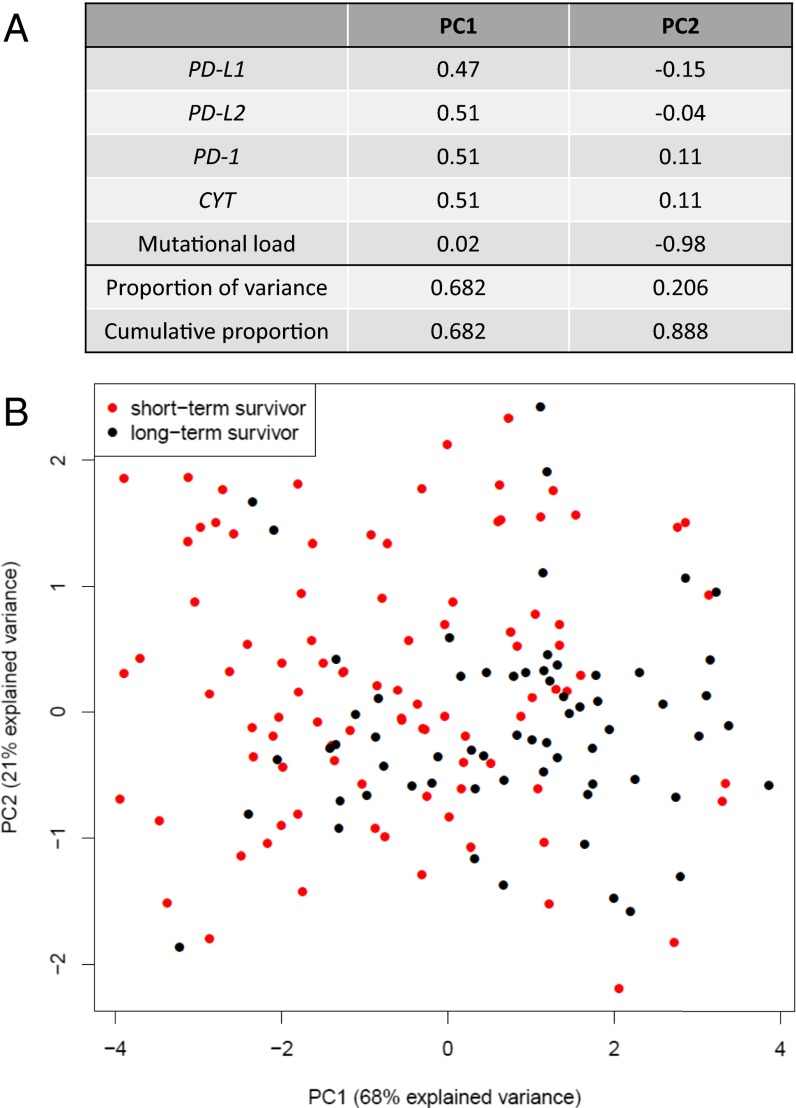
PD-axis molecules, CYT, and mutational load were all significantly associated with overall survival in SKCM by univariate analysis. When we plotted the expression of CYT, PD-molecule, and mutational load for each individual case in the SKCM TCGA cohort on a hive plot, the long-term survivors tended to demonstrate higher mutational rates, high CYT, and high PD-molecule expression, whereas the opposite was true for short-term survivors (Fig. S5). The interdependence of these factors was assessed using principal component analysis (PCA). By PCA, the first component explains 68% of the observed variance, with PD-1, PD-L1, PD-L2, and CD8 contributing nearly equally (Fig. 4A). The second component is comprised predominantly of mutational load and accounts for 21% of the variance. When we annotated the PCA by long- and short-term survivors, a degree of segregation was observed (Fig. 4B).
Fig. S5.
Hive plots demonstrating interrelationship between PD-L1, PD-L2, or PD-1, CYT, and mutational load and survival in SKCM. Each line represents an individual SKCM patient in the TCGA cohort, and the axes for expression of factors of interest or mutational load increase in value from the center of the plot. The cohort was split at the median for survival, with short-term survivors shown in red and long-term survivors shown in black. The circles are generally concentric, with long-term survivors demonstrating higher levels of CYT, mutational load, and (A) PD-L1, (B) PD-L2, or (C) PD-1 expression and short-term survivors demonstrating lower levels of each of these factors. PD-axis molecule expression levels and CYT track each other closely, whereas mutational density tends to be less aligned. (D) Exceptional patients are highlighted in yellow on this hive plot displaying the interrelationship between PD-L1, mutational load, and CYT. There is a patient (accession no. TCGA-EE-A29E, highlighted here by solid yellow line) with very high mutational load, low CYT, and low PD-L1 expression. Despite the high mutational burden, none were currently being recognized by the immune system at the time of specimen acquisition. On the opposite end of the spectrum is another patient (accession no. TCGA-D3-A2JB, also highlighted by solid yellow line), who shows one of the lowest mutational burdens in the cohort. However, the mutations that were seemingly immunogenic were actively being recognized by the immune system at the time of specimen acquisition, as the patient had a relatively high CYT infiltrate and level of PD-L1 expression.
Fig. 4.
PCA for PD-1, PD-Ls, CYT expression, and mutational load in SKCM. (A) PD-1, PD-L1, PD-L2, and CYT expression all contribute nearly equally to the first principle component (PC1). Mutational load almost solely defines the second component (PC2). (B) When the annotation for short- vs. long-term SKCM survivors is superimposed on the PCA plot, a degree of separation is evident between the two populations along the PC1 axis. The percentage of the total variance captured by each axis is shown in parenthesis.
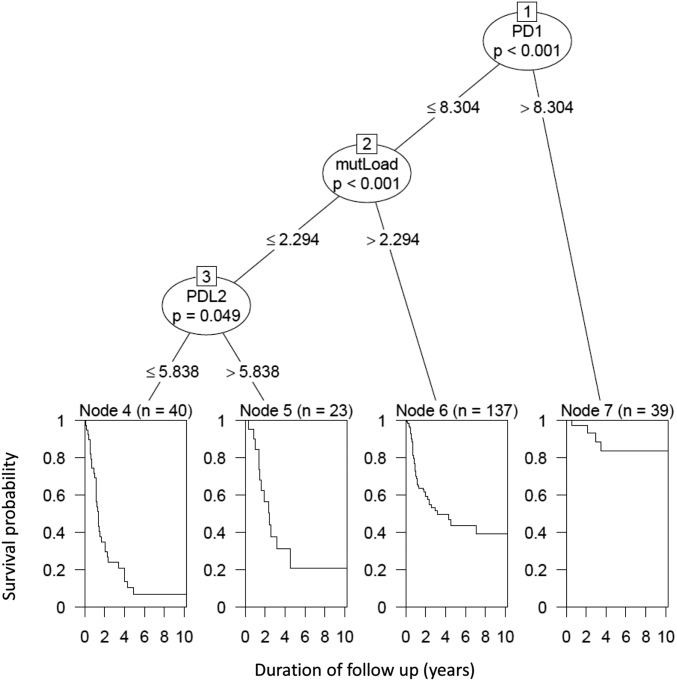
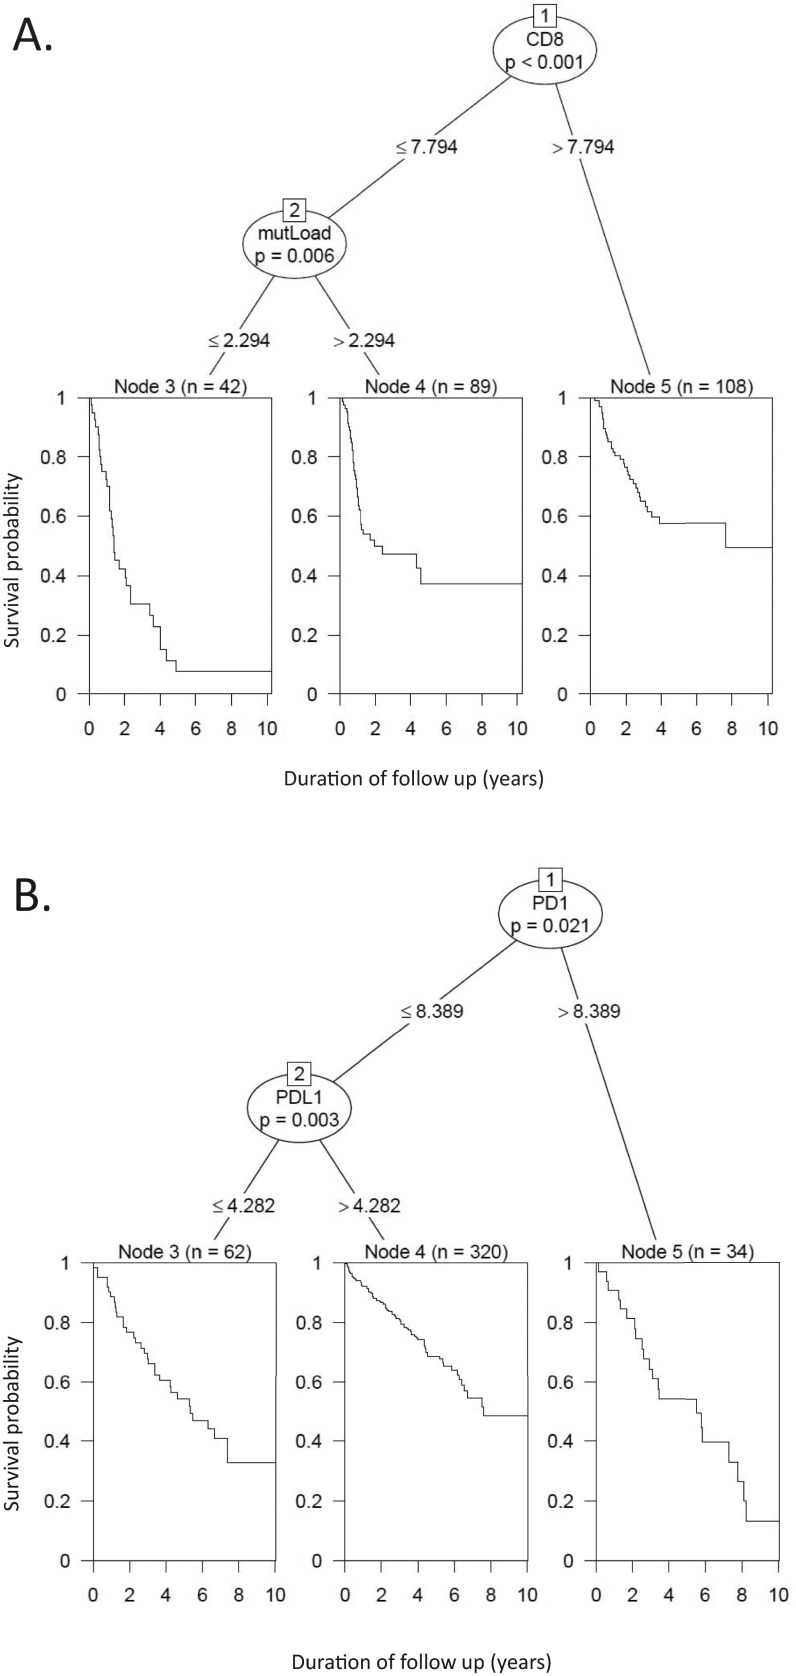
To better assess the relative contribution of PD-axis molecules, CYT, and mutational load to survival, we used a conditional inference tree method to gauge their proportional impact. In this five-factor model, PD-1 (ostensibly expressed predominantly by CD8+ cytotoxic T cells) was the factor demonstrating the strongest association with survival (P < 0.001) (Fig. 5). In fact, PD-1 was the sole factor predicting survival for patients with markedly elevated (top 15%) PD-1 expression. For patients with PD-1 expression levels below this threshold, mutational load also contributed to outcome (P < 0.001). Finally, for the 25% of patients with both relatively low CYT and a low mutational burden, PD-L2 played a contributing role in survival, with patients demonstrating improved survival with increasing PD-L2 expression (P = 0.049). When we removed PD-1 from the model and created a four-factor model, CYT demonstrated the strongest association with survival, followed by mutational load, affirming the importance of an inflamed phenotype in SKCM for patient outcome (Fig. S6A). When five-factor models (PD-1, PD-L1, PD-L2, CYT, and mutational load) were created for the eight other tumor types studied, only KIRC revealed that a combination of factors—in this case PD-1 and PD-L1 expression levels—was better able to predict survival than when only individual factors were assessed (Fig. S6B).
Fig. 5.
Conditional inference tree analysis demonstrating the relative contribution of CYT, PD-axis molecules, and mutational load to survival in SKCM patients. When the five studied factors are all entered into a multivariate model, PD-1 expression is the dominant factor influencing patient outcome. In patients demonstrating the highest levels of PD-1, it is the only significantly contributing factor out of those studied. For patients with PD-1 levels below this threshold, mutational load is the second most important factor influencing survival. In the ∼25% of cases with relatively low PD-1 expression and mutational load, PD-L2 expression also influences outcome. A four-factor model, including PD-L1, PD-L2, CYT, and mutational load, is shown in Fig. S6A.
Fig. S6.
Conditional inference tree analyses prioritizing the contribution of the studied factors to survival. (A) A four-factor model studying the contribution of PD-L1, PD-L2, CYT, and mutational load to survival in SKCM patients reveals that CYT expression is the dominant factor influencing patient outcome. For the 45% of patients demonstrating the highest levels, it is the only significantly contributing factor. For patients with CYT levels below this threshold, mutational load emerges as the second most important factor. In this model, neither PD-L1 nor -L2 expression are independent contributors to patient survival. (B) A five-factor model (PD-1, PD-L1, PD-L2, CYT, and mutational load) for KIRC revealed that a combination of PD-1 and PD-L1 expression significantly contributed to survival in this tumor type, with high PD-1 expression serving as the dominant prognostic feature. PD-L1 expression is the second most important factor. These two factors show opposite effects, with increasing PD-1 expression serving as an adverse prognostic feature, and increasing PD-L1 expression associating with an improved prognosis.
Discussion
Previous studies addressing the prognostic and predictive features of the PD-1/PD-L axis have either focused on a single tumor type, grouped multiple solid tumor types together, or have been limited in their ability to compare between tumor types because of patient sample numbers (16–18). In this study, we analyzed ∼3,500 tumors from patients with SKCM and eight other solid tumor types available in the TCGA dataset. We highlight the differences between tumor types with respect to the adaptive (IFN-γ–mediated) mechanism of PD-L/PD-1 expression, as well as identify additional immunomodulatory factors and how they associate with PD-L/PD-1 to different degrees by tumor type. We also demonstrated the differential impact of PD-1/PD-L pathway member expression and mutational density on survival. In doing so, we found that there is not a simple pan-cancer “PD-L/PD-1 immunotype,” and provide information that could be used for rational combinatorial treatment and biomarker strategies.
We previously described PD-L1–mediated adaptive immune resistance in SKCM, and the associated finding that PD-L1 protein expression correlated with improved survival (6). We later showed an association between PD-L1 mRNA and protein expression (45). Here, we confirm those findings and make the observation that median PD-L2 expression levels in the tumor microenvironment are similar to those of PD-L1 and describe features consistent with PD-L2–mediated adaptive immune resistance across numerous solid tumor types. PD-L2 is the second ligand of PD-1, and engagement of this receptor–ligand pair can also result in T-cell suppression. Anti–PD-1 therapies block both the interaction between PD-1 and PD-L1 and -L2, but anti–PD-L1 therapies do not block the latter interaction. Despite the perils of cross-trial comparisons, response rates from anti–PD-1 and anti–PD-L1 agents appear similar (19). This finding suggests that the PD-1/PD-L1 interaction is dominant over the PD-1/PD-L2 interaction in the hierarchy of intratumoral immunosuppression and the potential involvement of additional tolerance mechanisms. Notwithstanding, our results indicate that PD-L2 expression may serve as an even better surrogate marker of an antitumor immune response than PD-L1 in certain solid tumor types. Thus, even if agents blocking the PD-1/PD-L2 interaction do not demonstrate improved clinical efficacy over anti–PD-L1 monotherapy, PD-L2 may demonstrate utility as a biomarker of an ongoing host response to tumor that could be potentiated by PD-1/L1 checkpoint blockade.
We also made several additional observations regarding PD-L–mediated adaptive immune resistance that have biomarker implications. First, we showed that both PD-L1 and -L2 expression in SKCM are independent of v-Raf murine sarcoma viral oncogene homolog B (BRAF), neuroblastoma RAS viral oncogene homolog (NRAS), and PTEN mutations. Thus, BRAF, PTEN, and NRAS mutational status should be used as separate biomarkers from PD-L1 or -L2 expression when potentially combining anti–PD-1/L1 therapies with V600E antagonists, selective AKT pathway inhibitors (46), or NRAS inhibitors, respectively (47). Second, we showed that KIRC and squamous cell NSCLC differ from SKCM in that PD-L1 expression in these tumor types is not associated with the CYT or Th1/IFNG gene signature. This latter finding provides a potential explanation for why PD-L1 expression has not shown clear utility as a predictive biomarker in either of these tumor types (48–51). It also provides a rationale for why a combined assay for PD-L1 protein expression plus an IFNG gene signature in patients with NSCLC is a much better predictor of response than either assay used separately, because it enriches for the adaptive mechanism of PD-L1 expression (52). Additionally, we showed that PD-L gene amplification at the 9p24.1 locus in the tumor does not significantly influence global PD-L1 or L2 expression levels, most likely because of the presence of infiltrating immune cells lacking the alteration.
Our results also highlight numerous targetable immune genes that accompany PD-1/PD-L expression, many of which may coordinately contribute to immunosuppression. Combining agents that target LAG-3, IDO, ICOS, TIM-3, 4-1BB, OX40, and CD27 with anti–PD-1/PD-L has been supported by preclinical models (53–60), and many of these elements (e.g., LAG-3, TIM-3, IDO, and so forth) are currently being tested in clinical trials (https://clinicaltrials.gov; NCT01968109, NCT02608268, NCT02559492). The strength of the associations between PD-Ls and other immunomodulatory factors depended on the tumor type. IDO was associated with PD-L1 expression in SKCM, HNSC, COAD, and BRCA, but only weakly associated in LUAD, and showed no association in KIRC or squamous cell LUSC. Immunotherapeutic combinations may achieve synergy by mediating different mechanisms: for example, increasing lymphocyte infiltration into tumors, attenuation of immunosuppression in the tumor microenvironment, or enhancing the performance of antigen-presenting cells (61). Our results indicate that the design of combinatorial regimens should not only take into account the potential complementary mechanisms of action of the agents being considered, but also the specific tumor type being treated.
In contrast to PD-L1 and -L2, the other B7-family members studied here, B7-H3 and -H4, did not demonstrate an association with a Th1/IFNG–type response. Of these family members, B7-H3 may be of particular interest as a druggable target because it is highly expressed in solid tumors (62) and was shown here to be a negative prognostic feature in nearly every tumor type studied. The latter finding is consistent with previous reports showing that B7-H3 expression is associated with worse outcome in renal cell carcinoma (RCC), prostate cancer, pancreatic carcinoma, NSCLC, and SKCM (63–67). B7-H3 is thought to down-modulate T-cell responses (68), and may also impede NK-mediated cell lysis (62). Initial phase I results with an anti–B7-H3 monoclonal antibody showed antitumor activity in several solid tumor types and a favorable safety profile (NCT02628535) (69), and studies combining B7-H3 with anti–CTLA-4 are also underway (NCT02381314).
It has been challenging to compare the impact of PD-L and PD-1 expression on survival across different tumor types, because of the different cohort sizes, specimen size, and tissue analyzed (tissue microarray vs. biopsy vs. excision), assays, and scoring systems. The strength of this study is that we used the TCGA dataset, where large numbers of excisional specimens from each tumor type were analyzed in a uniform fashion, facilitating cross-cancer comparisons using meaningful sample sizes. We found that PD-1 expression tracked CYT and thus trended toward a positive prognostic feature in nearly every tumor type, except in KIRC. These findings are consistent with the prior body of literature on CYT (10), as well as prior reports for RCC (70–72). This seemingly paradoxical finding in RCC may be because CD8+ T-cells in the local tumor microenvironment require local education by dendritic cells to exert an antitumor effect; if this process does not take place, the T-cells exhibit an exhaustion phenotype, which includes high PD-1 expression (25).
We also found that PD-L1 and -L2 expression are positive prognostic features in SKCM and RCC, and further identified a positive trend for PD-L1 and -L2 expression in BLCA and BRCA, respectively. PD-L1 has previously been reported to be a positive prognostic feature in both NSCLC and BRCA when using an in situ approach to mRNA or protein detection and a dichotomous approach to scoring (30, 73, 74). We were not able to demonstrate similar prognostic significance here for PD-L1 in NSCLC. This discrepancy highlights one of the weaknesses of this study, which is that the TCGA results provide a global measure of marker expression that is not spatially resolved. Another closely related weakness is that we did not characterize a broad infiltrating immune cell repertoire, and different cellular subsets may exert either potentiating or opposing effects, depending on their moiety, density, and the tumor type. In our study, this limitation is likely most relevant to both kidney and colon cancer, where it is recognized that parameters, such as the ratio of effector-T cells to regulatory T-cells, levels of Th2 cells, presence of mature dendritic cells in tertiary lymphoid structures, and the association of B-cells with T-follicular helper cells may strongly influence patient outcome (25, 51, 75, 76). Specifically, the import of geographic context, cell-type–specific expression patterns, and limited cell types studied may have contributed to our finding that PD-1 and PD-L expression patterns have opposite effects on prognosis in KIRC when assessed as global metrics. Finally, because of sample size, we focused on metastatic SKCM in the TCGA dataset, in contrast to the other tumor types studied. It is possible that the studied factors may exert different influences at various stages in other tumor types.
A number of recent reports showed that mutational burden is predictive of response to checkpoint blockade (15, 77–79). Colorectal tumors with microsatellite instability are also recognized to have a better prognosis than their microsatellite-stable counterparts. Here, we analyzed the possible prognostic impact of mutational load across multiple tumor types and show that increased mutational load is also a positive prognostic factor in cutaneous melanoma (nondesmoplastic) and in BLCA. It is notable that we did not observe a direct association between mutational load and IFN-γ or a Th1/IFNG gene signature in any tumor type; the reason for this is not immediately clear, but it may be because of the timing of when neoantigens in the tumor are recognized by the immune system. The TCGA represents a snapshot in time, and tumors exhibiting PD-L1 expression associated with IFNG at the time of harvest may be considered as demonstrating evidence of the host immune system’s ability to exert some degree of control over tumor growth. Our findings suggest that a separate, subsequent interaction may then occur between mutation-associated neoantigens and therapy. This therapy, especially when it is immunomodulatory, may tip the balance toward tumor rejection. It is possible that if the posttherapeutic time point were assayed, a Th1/IFNG signature associated with neoantigen recognition would be detected.
SKCM was distinguished from the other tumor types studied here by the fact that PD-Ls, PD-1, CYT, and mutational load are all positive prognostic features. This finding provided us with the opportunity to further explore the relationship between these markers as they relate to survival in this disease. We found that an “inflamed” SKCM phenotype (80), as represented here by CYT or PD-1, is the most dominant feature in predicting survival. The second most important factor is mutational load. The fact that PD-1/CYT and mutational load are differential contributors to outcome supports the earlier finding that the influence of mutational density on prognosis may be temporally distinct from the immediately detectable host immune response to tumor. Stratification of this complex interaction also provides a new perspective on how to assimilate previously published studies where CD8 density, mutational load, and PD-L1 were tested as solitary biomarkers. It is possible that PD-L1 could emerge as more important to this hierarchy if it is spatially resolved, rather than studied as a global value; however, a previous study on melanoma brain metastases that assessed geographic relationships demonstrated that PD-L1 was not an independent biomarker when CD8 infiltration was also assayed (81).
Taken together, our data portray a comprehensive picture of the interactions between PD-L1, PD-L2, PD-1, CYT, and mutational burden across several tumor types. We found that PD-L2 is more highly expressed and often more strongly associated with IFNG than PD-L1. We also found that the coexpression of additional checkpoint molecules with PD-L1 and -L2 expression varies by tumor type. We determined that the parameters under study interact in a complex way to impact outcome, most notably in SKCM, where we identified mutational burden as a key prognostic indicator that is subordinate to PD-1/CYT expression in its contribution to prognosis. These data have several important implications, including the notion that CD8 density, PD-L1 expression, or mutational density as solitary biomarkers are insufficient to characterize the tumor microenvironment. Our data thus support the pursuit of multiplexed biomarker assays that are tumor-type specific and include both expression studies and genomic profiling.
Methods
Experimental Design.
We studied nine cancer types from The Cancer Genome Atlas project (TCGA) (https://gdc-portal.nci.nih.gov/): BLCA, BRCA, LUSC, LUAD, KIRC, COAD, SKCM, PAAD, and HNSC (82–89). All tumors analyzed were untreated primary lesions, except for melanoma, which were untreated metastases. RNA sequencing (RNAseq) data level 3 RSEM normalized data were downloaded from TCGA Data Portal (https://gdc-portal.nci.nih.gov/) and log2-transformed. Microsatellite stability of a colon adenocarcinoma sample was derived using MLH1 promoter methylation status (Illumina HumanMethylation 450k probe cg00893636) and threshold 0.2. Unmethylated samples with β-value less than 0.2 were considered microsatellite stable.
Mutation annotation files (MutSig 2.0) were downloaded from the Broad Institute TCGA GDAC Firehose’s analysis_2015_04_02, (gdac.broadinstitute.org/). Mutational counts were log10-transformed for the further analysis. Additionally, GISTIC2 level 4 data were downloaded the Broad Institute TCGA GDAC Firehose’s analysis_2015_04_02, and all_thresholded.by_genes.txt files were used to access copy number calls.
TCGA clinical datasets were also downloaded. For SKCM, we used the curated clinical data from the published marker paper, including postaccession survival (86). For KIRC and HNSC, we also used clinical data from the published marker papers (82, 87). For all other cancer types, we downloaded clinical files, including survival from the initial pathologic time of diagnosis, from Genomic Data Commons Data Portal (https://gdc-portal.nci.nih.gov/). The number of samples varied across the different types of analyses depending on required data availability.
Cytolytic Activity and the Combined Th1/IFNG Gene Signature.
CYT was calculated as the geometric mean of expression levels of GZMA and PRF1 genes, as previously described (5). For the Th1/IFNG gene signature, we combined genes from a published Th1 signature (76) and genes from IFNG signaling pathway from Reactome database (www.reactome.org) (Dataset S1).
Correlation Analysis.
The Pearson’s correlation coefficients were reported for expression of PD-L1 (CD274), PD-L2 (PDCD1LG2), PD-1 (PDCD1), or CYT, and the rest of the genes and the Spearman’s correlation coefficients were reported for the mutational load.
Pathway Analysis.
To study potential factors associated with PD-molecule expression in each tumor type, we applied the Fisher’s exact test to estimate the intersection of genes in a pathway and genes with correlation coefficients >0.6 or <−0.6 in every cancer type. We used gene sets provided by the Molecular Signatures Databases (software.broadinstitute.org/gsea/msigdb/index.jsp). The pathway gene sets are a collection of annotated gene sets from several online databases, such as the Kyoto Encyclopedia of Genes and Genomes (www.genome.jp/kegg), Reactome (www.reactome.org), and BioCarta (cgap.nci.nih.gov/Pathways/BioCarta_Pathways), among others. The P values from the Fisher’s exact test were adjusted by the Benjamini–Hochberg procedure (false-discovery rate) (90).
Survival Analyses.
Cox regression (the coxph function of the survival package) (91, 92) was used with continuous expression values or mutational load to estimate the hazard ratio, P value, and concordance for each studied parameter. Kaplan–Meier curves were made using the survfit function from the survival package (93, 94). To study the proportional impact of three (PD-L1, CYT, and mutational load) and five factors (PD-L1, PD-L2, PD-1, CYT, and mutational load) on survival in SKCM patients, we used a conditional inference tree method as it implemented in the ctree function of partykit package (95, 96). Fivefold internal cross-validation was performed on the models. The default settings of the ctree function were used.
Statistical Software and Plots.
Data analysis was performed using R/Bioconductor software with build-in packages and custom routines (91, 97). Heat maps, box-and-whisker plots, and scatter plots were created using the gplots package and build-in R graphic functions. The HiveR package was used to create the hive plots (98). The forest plots were created with the help of the forestplot function of the rmeta package (99). The built-in R function was used for principal component analysis. Cross-cancer alterations were obtained from the MSKCC cBio portal (100, 101).
Immunohistochemistry.
Immunohistochemistry for PD-L1 was performed and scored as previously described (6). Immunohistochemistry for PTEN was performed according to standard automated methods using antibody clone 6H2.1 (BioCare Medical). A case was considered PTEN− if it demonstrated a complete absence of staining in both the nuclear and cytoplasmic compartments.
Supplementary Material
Acknowledgments
We thank Drs. Jeffrey Sosman and Matthew Hellmann for helpful discussions. This work was supported by the Dermatology Foundation and the W.W. Smith Foundation (J.M.T.); the Melanoma Research Alliance (J.M.T. and D.M.P.); Bristol-Myers Squibb (J.M.T., R.A.A., and D.M.P.); 5′ Diagnostics (R.A.A.); Sidney Kimmel Cancer Center Core Grant P30 CA006973 (to J.M.T., D.M.P., C.G.D., H.W., and L.D.); the National Cancer Institute NIH Grant R01 CA142779 (to J.M.T. and D.M.P.); NIH Grant T32 CA193145 (to T.R.C.); the Commonwealth Foundation (D.M.P.); and Moving for Melanoma of Delaware (J.M.T. and D.M.P.). The authors were also supported by the Bloomberg-Kimmel Institute for Cancer Immunotherapy and a Stand Up To Cancer–Cancer Research Institute Cancer Immunology Translational Cancer Research Grant (SU2C-AACR-DT1012). Stand Up To Cancer is a program of the Entertainment Industry Foundation administered by the American Association for Cancer Research.
Footnotes
Conflict of interest statement: R.A.A. is a compensated consultant for Adaptive Biotech. D.M.P. has received research grants from Bristol-Myers Squibb and Potenza Therapeutics; consults for Amgen, Five Prime Therapeutics, GlaxoSmithKline, Jounce Therapeutics, MedImmune, Merck, Pfizer, Potenza Therapeutics, and Sanofi; owns stock options in Jounce and Potenza; and receives patent royalties through his institution, from Bristol-Myers Squibb, and Potenza. C.G.D. is a self-compensated consultant for Bristol-Myers Squibb, AstraZeneca/Medimmune, Roche/Genentech, Potenza Therapeutics, and Tizona Therapeutics; and has patents licensed by Bristol-Myers Squibb, AstraZeneca/Medimmune, and Potenza Therapeutics. J.M.T. is a compensated consultant for Bristol-Myers Squibb, AstraZeneca/Medimmune, and Merck.
This article is a PNAS Direct Submission. A.R. is a Guest Editor invited by the Editorial Board.
This article contains supporting information online at www.pnas.org/lookup/suppl/doi:10.1073/pnas.1607836113/-/DCSupplemental.
References
- 1.Hanahan D, Weinberg RA. Hallmarks of cancer: The next generation. Cell. 2011;144(5):646–674. doi: 10.1016/j.cell.2011.02.013. [DOI] [PubMed] [Google Scholar]
- 2.Lennerz V, et al. The response of autologous T cells to a human melanoma is dominated by mutated neoantigens. Proc Natl Acad Sci USA. 2005;102(44):16013–16018. doi: 10.1073/pnas.0500090102. [DOI] [PMC free article] [PubMed] [Google Scholar]
- 3.Matsushita H, et al. Cancer exome analysis reveals a T-cell-dependent mechanism of cancer immunoediting. Nature. 2012;482(7385):400–404. doi: 10.1038/nature10755. [DOI] [PMC free article] [PubMed] [Google Scholar]
- 4.Robbins PF, et al. Mining exomic sequencing data to identify mutated antigens recognized by adoptively transferred tumor-reactive T cells. Nat Med. 2013;19(6):747–752. doi: 10.1038/nm.3161. [DOI] [PMC free article] [PubMed] [Google Scholar]
- 5.Rooney MS, Shukla SA, Wu CJ, Getz G, Hacohen N. Molecular and genetic properties of tumors associated with local immune cytolytic activity. Cell. 2015;160(1-2):48–61. doi: 10.1016/j.cell.2014.12.033. [DOI] [PMC free article] [PubMed] [Google Scholar]
- 6.Taube JM, et al. Colocalization of inflammatory response with B7-h1 expression in human melanocytic lesions supports an adaptive resistance mechanism of immune escape. Sci Transl Med. 2012;4(127):127ra37. doi: 10.1126/scitranslmed.3003689. [DOI] [PMC free article] [PubMed] [Google Scholar]
- 7.Robert C, et al. Nivolumab in previously untreated melanoma without BRAF mutation. N Engl J Med. 2015;372(4):320–330. doi: 10.1056/NEJMoa1412082. [DOI] [PubMed] [Google Scholar]
- 8.Tumeh PC, et al. PD-1 blockade induces responses by inhibiting adaptive immune resistance. Nature. 2014;515(7528):568–571. doi: 10.1038/nature13954. [DOI] [PMC free article] [PubMed] [Google Scholar]
- 9.Brahmer J, et al. Nivolumab (anti-PD-1, BMS-936558, ONO-4538) in patients (pts) with advanced non-small-cell lung cancer (NSCLC): Survival and clinical activity by subgroup analysis. J Clin Oncol. 2014;32:8112 (abstr). [Google Scholar]
- 10.Fridman WH, Pagès F, Sautès-Fridman C, Galon J. The immune contexture in human tumours: impact on clinical outcome. Nat Rev Cancer. 2012;12(4):298–306. doi: 10.1038/nrc3245. [DOI] [PubMed] [Google Scholar]
- 11.Sotiriou C, Pusztai L. Gene-expression signatures in breast cancer. N Engl J Med. 2009;360(8):790–800. doi: 10.1056/NEJMra0801289. [DOI] [PubMed] [Google Scholar]
- 12.Halama N, et al. Localization and density of immune cells in the invasive margin of human colorectal cancer liver metastases are prognostic for response to chemotherapy. Cancer Res. 2011;71(17):5670–5677. doi: 10.1158/0008-5472.CAN-11-0268. [DOI] [PubMed] [Google Scholar]
- 13.Denkert C, et al. Tumor-associated lymphocytes as an independent predictor of response to neoadjuvant chemotherapy in breast cancer. J Clin Oncol. 2010;28(1):105–113. doi: 10.1200/JCO.2009.23.7370. [DOI] [PubMed] [Google Scholar]
- 14.Brown SD, et al. Neo-antigens predicted by tumor genome meta-analysis correlate with increased patient survival. Genome Res. 2014;24(5):743–750. doi: 10.1101/gr.165985.113. [DOI] [PMC free article] [PubMed] [Google Scholar]
- 15.Rizvi NA, et al. Cancer immunology. Mutational landscape determines sensitivity to PD-1 blockade in non-small cell lung cancer. Science. 2015;348(6230):124–128. doi: 10.1126/science.aaa1348. [DOI] [PMC free article] [PubMed] [Google Scholar]
- 16.Topalian SL, et al. Safety, activity, and immune correlates of anti-PD-1 antibody in cancer. N Engl J Med. 2012;366(26):2443–2454. doi: 10.1056/NEJMoa1200690. [DOI] [PMC free article] [PubMed] [Google Scholar]
- 17.Taube JM, et al. Association of PD-1, PD-1 ligands, and other features of the tumor immune microenvironment with response to anti-PD-1 therapy. Clin Cancer Res. 2014;20(19):5064–5074. doi: 10.1158/1078-0432.CCR-13-3271. [DOI] [PMC free article] [PubMed] [Google Scholar]
- 18.Herbst RS, et al. Predictive correlates of response to the anti-PD-L1 antibody MPDL3280A in cancer patients. Nature. 2014;515(7528):563–567. doi: 10.1038/nature14011. [DOI] [PMC free article] [PubMed] [Google Scholar]
- 19.Sunshine J, Taube JM. PD-1/PD-L1 inhibitors. Curr Opin Pharmacol. 2015;23:32–38. doi: 10.1016/j.coph.2015.05.011. [DOI] [PMC free article] [PubMed] [Google Scholar]
- 20.Wu C, et al. Immunohistochemical localization of programmed death-1 ligand-1 (PD-L1) in gastric carcinoma and its clinical significance. Acta Histochem. 2006;108(1):19–24. doi: 10.1016/j.acthis.2006.01.003. [DOI] [PubMed] [Google Scholar]
- 21.Ohigashi Y, et al. Clinical significance of programmed death-1 ligand-1 and programmed death-1 ligand-2 expression in human esophageal cancer. Clin Cancer Res. 2005;11(8):2947–2953. doi: 10.1158/1078-0432.CCR-04-1469. [DOI] [PubMed] [Google Scholar]
- 22.Thompson RH, et al. Tumor B7-H1 is associated with poor prognosis in renal cell carcinoma patients with long-term follow-up. Cancer Res. 2006;66(7):3381–3385. doi: 10.1158/0008-5472.CAN-05-4303. [DOI] [PubMed] [Google Scholar]
- 23.Hamanishi J, et al. Programmed cell death 1 ligand 1 and tumor-infiltrating CD8+ T lymphocytes are prognostic factors of human ovarian cancer. Proc Natl Acad Sci USA. 2007;104(9):3360–3365. doi: 10.1073/pnas.0611533104. [DOI] [PMC free article] [PubMed] [Google Scholar]
- 24.Nomi T, et al. Clinical significance and therapeutic potential of the programmed death-1 ligand/programmed death-1 pathway in human pancreatic cancer. Clin Cancer Res. 2007;13(7):2151–2157. doi: 10.1158/1078-0432.CCR-06-2746. [DOI] [PubMed] [Google Scholar]
- 25.Giraldo NA, et al. Orchestration and prognostic significance of immune checkpoints in the microenvironment of primary and metastatic renal cell cancer. Clin Cancer Res. 2015;21(13):3031–3040. doi: 10.1158/1078-0432.CCR-14-2926. [DOI] [PubMed] [Google Scholar]
- 26.Lipson EJ, et al. PD-L1 expression in the Merkel cell carcinoma microenvironment: Association with inflammation, Merkel cell polyomavirus and overall survival. Cancer Immunol Res. 2013;1(1):54–63. doi: 10.1158/2326-6066.CIR-13-0034. [DOI] [PMC free article] [PubMed] [Google Scholar]
- 27.Wimberly H, et al. PD-L1 expression correlates with tumor-infiltrating lymphocytes and response to neoadjuvant chemotherapy in breast cancer. Cancer Immunol Res. 2015;3(4):326–332. doi: 10.1158/2326-6066.CIR-14-0133. [DOI] [PMC free article] [PubMed] [Google Scholar]
- 28.Karim R, et al. Tumor-expressed B7-H1 and B7-DC in relation to PD-1+ T-cell infiltration and survival of patients with cervical carcinoma. Clin Cancer Res. 2009;15(20):6341–6347. doi: 10.1158/1078-0432.CCR-09-1652. [DOI] [PubMed] [Google Scholar]
- 29.Hino R, et al. Tumor cell expression of programmed cell death-1 ligand 1 is a prognostic factor for malignant melanoma. Cancer. 2010;116(7):1757–1766. doi: 10.1002/cncr.24899. [DOI] [PubMed] [Google Scholar]
- 30.Velcheti V, et al. Programmed death ligand-1 expression in non-small cell lung cancer. Lab Invest. 2014;94(1):107–116. doi: 10.1038/labinvest.2013.130. [DOI] [PMC free article] [PubMed] [Google Scholar]
- 31.Wang A, et al. The prognostic value of PD-L1 expression for non-small cell lung cancer patients: A meta-analysis. Eur J Surg Oncol. 2015;41(4):450–456. doi: 10.1016/j.ejso.2015.01.020. [DOI] [PubMed] [Google Scholar]
- 32.Zhang Y, et al. Protein expression of programmed death 1 ligand 1 and ligand 2 independently predict poor prognosis in surgically resected lung adenocarcinoma. Onco Targets Ther. 2014;7:567–573. doi: 10.2147/OTT.S59959. [DOI] [PMC free article] [PubMed] [Google Scholar]
- 33.Shi M, et al. Expression of programmed cell death 1 ligand 2 (PD-L2) is a distinguishing feature of primary mediastinal (thymic) large B-cell lymphoma and associated with PDCD1LG2 copy gain. Am J Surg Pathol. 2014;38(12):1715–1723. doi: 10.1097/PAS.0000000000000297. [DOI] [PMC free article] [PubMed] [Google Scholar]
- 34.Thompson RH, et al. PD-1 is expressed by tumor-infiltrating immune cells and is associated with poor outcome for patients with renal cell carcinoma. Clin Cancer Res. 2007;13(6):1757–1761. doi: 10.1158/1078-0432.CCR-06-2599. [DOI] [PubMed] [Google Scholar]
- 35.Ngiow SF, et al. A threshold level of intratumor CD8+ T-cell PD1 expression dictates therapeutic response to anti-PD1. Cancer Res. 2015;75(18):3800–3811. doi: 10.1158/0008-5472.CAN-15-1082. [DOI] [PubMed] [Google Scholar]
- 36.Parsa AT, et al. Loss of tumor suppressor PTEN function increases B7-H1 expression and immunoresistance in glioma. Nat Med. 2007;13(1):84–88. doi: 10.1038/nm1517. [DOI] [PubMed] [Google Scholar]
- 37.Green MR, et al. Integrative analysis reveals selective 9p24.1 amplification, increased PD-1 ligand expression, and further induction via JAK2 in nodular sclerosing Hodgkin lymphoma and primary mediastinal large B-cell lymphoma. Blood. 2010;116(17):3268–3277. doi: 10.1182/blood-2010-05-282780. [DOI] [PMC free article] [PubMed] [Google Scholar]
- 38.Pardoll DM. The blockade of immune checkpoints in cancer immunotherapy. Nat Rev Cancer. 2012;12(4):252–264. doi: 10.1038/nrc3239. [DOI] [PMC free article] [PubMed] [Google Scholar]
- 39.Skoulidis F, et al. Co-occurring genomic alterations define major subsets of KRAS-mutant lung adenocarcinoma with distinct biology, immune profiles, and therapeutic vulnerabilities. Cancer Discov. 2015;5(8):860–877. doi: 10.1158/2159-8290.CD-14-1236. [DOI] [PMC free article] [PubMed] [Google Scholar]
- 40.Lawrence MS, et al. Mutational heterogeneity in cancer and the search for new cancer-associated genes. Nature. 2013;499(7457):214–218. doi: 10.1038/nature12213. [DOI] [PMC free article] [PubMed] [Google Scholar]
- 41.Badoual C, et al. PD-1-expressing tumor-infiltrating T cells are a favorable prognostic biomarker in HPV-associated head and neck cancer. Cancer Res. 2013;73(1):128–138. doi: 10.1158/0008-5472.CAN-12-2606. [DOI] [PubMed] [Google Scholar]
- 42.Shain AH, et al. Exome sequencing of desmoplastic melanoma identifies recurrent NFKBIE promoter mutations and diverse activating mutations in the MAPK pathway. Nat Genet. 2015;47(10):1194–1199. doi: 10.1038/ng.3382. [DOI] [PMC free article] [PubMed] [Google Scholar]
- 43.Busam KJ, et al. Cutaneous desmoplastic melanoma: Reappraisal of morphologic heterogeneity and prognostic factors. Am J Surg Pathol. 2004;28(11):1518–1525. doi: 10.1097/01.pas.0000141391.91677.a4. [DOI] [PubMed] [Google Scholar]
- 44.Gubin MM, Schreiber RD. CANCER. The odds of immunotherapy success. Science. 2015;350(6257):158–159. doi: 10.1126/science.aad4140. [DOI] [PubMed] [Google Scholar]
- 45.Taube JM, et al. Differential expression of immune-regulatory genes associated with PD-L1 display in melanoma: Implications for PD-1 pathway blockade. Clin Cancer Res. 2015;21(17):3969–3976. doi: 10.1158/1078-0432.CCR-15-0244. [DOI] [PMC free article] [PubMed] [Google Scholar]
- 46.Peng W, et al. Loss of PTEN promotes resistance to T cell-mediated immunotherapy. Cancer Discov. 2016;6(2):202–216. doi: 10.1158/2159-8290.CD-15-0283. [DOI] [PMC free article] [PubMed] [Google Scholar]
- 47.Ascierto PA, et al. MEK162 for patients with advanced melanoma harbouring NRAS or Val600 BRAF mutations: a non-randomised, open-label phase 2 study. Lancet Oncol. 2013;14(3):249–256. doi: 10.1016/S1470-2045(13)70024-X. [DOI] [PubMed] [Google Scholar]
- 48.Brahmer J, et al. Nivolumab versus docetaxel in advanced squamous-cell non-small-cell lung cancer. N Engl J Med. 2015;373(2):123–135. doi: 10.1056/NEJMoa1504627. [DOI] [PMC free article] [PubMed] [Google Scholar]
- 49.Motzer RJ, et al. Nivolumab for metastatic renal cell carcinoma: Results of a randomized phase II trial. J Clin Oncol. 2015;33(13):1430–1437. doi: 10.1200/JCO.2014.59.0703. [DOI] [PMC free article] [PubMed] [Google Scholar]
- 50.Motzer RJ, et al. CheckMate 025 Investigators Nivolumab versus everolimus in advanced renal-cell carcinoma. N Engl J Med. 2015;373(19):1803–1813. doi: 10.1056/NEJMoa1510665. [DOI] [PMC free article] [PubMed] [Google Scholar]
- 51.McDermott DF, et al. Atezolizumab, an anti-programmed death-ligand 1 antibody, in metastatic renal cell carcinoma: Long-term safety, clinical activity, and immune correlates from a phase Ia study. J Clin Oncol. 2016;34(8):833–842. doi: 10.1200/JCO.2015.63.7421. [DOI] [PubMed] [Google Scholar]
- 52.Higgs BW, et al. 2015. High tumoral IFNg mRNA, PD-L1 protein, and combined IFNg mRNA/PD-L1 protein expression associates with response to durvalumab (anti-PD-L1) monotherapy in NSCLC patients. European Cancer Conference 2015 (European Cancer Congress, Vienna), abstr 15LBA.
- 53.Woo SR, et al. Immune inhibitory molecules LAG-3 and PD-1 synergistically regulate T-cell function to promote tumoral immune escape. Cancer Res. 2012;72(4):917–927. doi: 10.1158/0008-5472.CAN-11-1620. [DOI] [PMC free article] [PubMed] [Google Scholar]
- 54.Chauvin JM, et al. TIGIT and PD-1 impair tumor antigen-specific CD8⁺ T cells in melanoma patients. J Clin Invest. 2015;125(5):2046–2058. doi: 10.1172/JCI80445. [DOI] [PMC free article] [PubMed] [Google Scholar]
- 55.Spranger S, et al. Mechanism of tumor rejection with doublets of CTLA-4, PD-1/PD-L1, or IDO blockade involves restored IL-2 production and proliferation of CD8(+) T cells directly within the tumor microenvironment. J Immunother Cancer. 2014;2:3. doi: 10.1186/2051-1426-2-3. [DOI] [PMC free article] [PubMed] [Google Scholar]
- 56.Ding H, et al. Delivering PD-1 inhibitory signal concomitant with blocking ICOS co-stimulation suppresses lupus-like syndrome in autoimmune BXSB mice. Clin Immunol. 2006;118(2-3):258–267. doi: 10.1016/j.clim.2005.10.017. [DOI] [PubMed] [Google Scholar]
- 57.Sakuishi K, et al. Targeting Tim-3 and PD-1 pathways to reverse T cell exhaustion and restore anti-tumor immunity. J Exp Med. 2010;207(10):2187–2194. doi: 10.1084/jem.20100643. [DOI] [PMC free article] [PubMed] [Google Scholar]
- 58.Melero I, Grimaldi AM, Perez-Gracia JL, Ascierto PA. Clinical development of immunostimulatory monoclonal antibodies and opportunities for combination. Clin Cancer Res. 2013;19(5):997–1008. doi: 10.1158/1078-0432.CCR-12-2214. [DOI] [PubMed] [Google Scholar]
- 59.Koyama S, et al. Adaptive resistance to therapeutic PD-1 blockade is associated with upregulation of alternative immune checkpoints. Nat Commun. 2016;7:10501. doi: 10.1038/ncomms10501. [DOI] [PMC free article] [PubMed] [Google Scholar]
- 60.Buchan SL, et al. OX40- and CD27-mediated costimulation synergizes with anti-PD-L1 blockade by forcing exhausted CD8+ T cells to exit quiescence. J Immunol. 2015;194(1):125–133. doi: 10.4049/jimmunol.1401644. [DOI] [PMC free article] [PubMed] [Google Scholar]
- 61.Melero I, et al. Evolving synergistic combinations of targeted immunotherapies to combat cancer. Nat Rev Cancer. 2015;15(8):457–472. doi: 10.1038/nrc3973. [DOI] [PubMed] [Google Scholar]
- 62.Yi KH, Chen L. Fine tuning the immune response through B7-H3 and B7-H4. Immunol Rev. 2009;229(1):145–151. doi: 10.1111/j.1600-065X.2009.00768.x. [DOI] [PMC free article] [PubMed] [Google Scholar]
- 63.Crispen PL, et al. Tumor cell and tumor vasculature expression of B7-H3 predict survival in clear cell renal cell carcinoma. Clin Cancer Res. 2008;14(16):5150–5157. doi: 10.1158/1078-0432.CCR-08-0536. [DOI] [PMC free article] [PubMed] [Google Scholar]
- 64.Roth TJ, et al. B7-H3 ligand expression by prostate cancer: A novel marker of prognosis and potential target for therapy. Cancer Res. 2007;67(16):7893–7900. doi: 10.1158/0008-5472.CAN-07-1068. [DOI] [PubMed] [Google Scholar]
- 65.Wang J, et al. B7-H3 associated with tumor progression and epigenetic regulatory activity in cutaneous melanoma. J Invest Dermatol. 2013;133(8):2050–2058. doi: 10.1038/jid.2013.114. [DOI] [PMC free article] [PubMed] [Google Scholar]
- 66.Mao Y, et al. B7-H1 and B7-H3 are independent predictors of poor prognosis in patients with non-small cell lung cancer. Oncotarget. 2015;6(5):3452–3461. doi: 10.18632/oncotarget.3097. [DOI] [PMC free article] [PubMed] [Google Scholar]
- 67.Xu H, et al. B7-H3 and B7-H4 are independent predictors of a poor prognosis in patients with pancreatic cancer. Oncol Lett. 2016;11(3):1841–1846. doi: 10.3892/ol.2016.4128. [DOI] [PMC free article] [PubMed] [Google Scholar]
- 68.Leitner J, et al. B7-H3 is a potent inhibitor of human T-cell activation: No evidence for B7-H3 and TREML2 interaction. Eur J Immunol. 2009;39(7):1754–1764. doi: 10.1002/eji.200839028. [DOI] [PMC free article] [PubMed] [Google Scholar]
- 69.Powderly J, et al. Interim results of an ongoing Phase I, dose escalation study of MGA271 (Fc-optimized humanized anti-B7-H3 monoclonal antibody) in patients with refractory B7-H3-expressing neoplasms or neoplasms whose vasculature expresses B7-H3. J Immunother Cancer. 2015;3(Suppl 2):O8. [Google Scholar]
- 70.Nakano O, et al. Proliferative activity of intratumoral CD8(+) T-lymphocytes as a prognostic factor in human renal cell carcinoma: clinicopathologic demonstration of antitumor immunity. Cancer Res. 2001;61(13):5132–5136. [PubMed] [Google Scholar]
- 71.Beuselinck B, et al. Molecular subtypes of clear cell renal cell carcinoma are associated with sunitinib response in the metastatic setting. Clin Cancer Res. 2015;21(6):1329–1339. doi: 10.1158/1078-0432.CCR-14-1128. [DOI] [PubMed] [Google Scholar]
- 72.Remark R, et al. Characteristics and clinical impacts of the immune environments in colorectal and renal cell carcinoma lung metastases: influence of tumor origin. Clin Cancer Res. 2013;19(15):4079–4091. doi: 10.1158/1078-0432.CCR-12-3847. [DOI] [PubMed] [Google Scholar]
- 73.Schalper KA, et al. In situ tumor PD-L1 mRNA expression is associated with increased TILs and better outcome in breast carcinomas. Clin Cancer Res. 2014;20(10):2773–2782. doi: 10.1158/1078-0432.CCR-13-2702. [DOI] [PubMed] [Google Scholar]
- 74.Cooper WA, et al. PD-L1 expression is a favorable prognostic factor in early stage non-small cell carcinoma. Lung Cancer. 2015;89(2):181–188. doi: 10.1016/j.lungcan.2015.05.007. [DOI] [PubMed] [Google Scholar]
- 75.Senbabaoglu Y, et al. The landscape of T cell infiltration in human cancer and its association with antigen presenting gene expression. bioRxiv. September 1, 2015 doi: 10.1101/025908. [DOI] [Google Scholar]
- 76.Bindea G, et al. Spatiotemporal dynamics of intratumoral immune cells reveal the immune landscape in human cancer. Immunity. 2013;39(4):782–795. doi: 10.1016/j.immuni.2013.10.003. [DOI] [PubMed] [Google Scholar]
- 77.Le DT, et al. PD-1 blockade in tumors with mismatch-repair deficiency. N Engl J Med. 2015;372(26):2509–2520. doi: 10.1056/NEJMoa1500596. [DOI] [PMC free article] [PubMed] [Google Scholar]
- 78.Van Allen EM, et al. Genomic correlates of response to CTLA-4 blockade in metastatic melanoma. Science. 2015;350(6257):207–211. doi: 10.1126/science.aad0095. [DOI] [PMC free article] [PubMed] [Google Scholar]
- 79.Snyder A, et al. Genetic basis for clinical response to CTLA-4 blockade in melanoma. N Engl J Med. 2014;371(23):2189–2199. doi: 10.1056/NEJMoa1406498. [DOI] [PMC free article] [PubMed] [Google Scholar]
- 80.Gajewski TF, Schreiber H, Fu YX. Innate and adaptive immune cells in the tumor microenvironment. Nat Immunol. 2013;14(10):1014–1022. doi: 10.1038/ni.2703. [DOI] [PMC free article] [PubMed] [Google Scholar]
- 81.Kluger HM, et al. Characterization of PD-L1 expression and associated T-cell infiltrates in metastatic melanoma samples from variable anatomic sites. Clin Cancer Res. 2015;21(13):3052–3060. doi: 10.1158/1078-0432.CCR-14-3073. [DOI] [PMC free article] [PubMed] [Google Scholar]
- 82.Cancer Genome Atlas Research Network Comprehensive molecular characterization of clear cell renal cell carcinoma. Nature. 2013;499(7456):43–49. doi: 10.1038/nature12222. [DOI] [PMC free article] [PubMed] [Google Scholar]
- 83.Cancer Genome Atlas Research Network Comprehensive molecular characterization of urothelial bladder carcinoma. Nature. 2014;507(7492):315–322. doi: 10.1038/nature12965. [DOI] [PMC free article] [PubMed] [Google Scholar]
- 84.Cancer Genome Atlas Research Network Comprehensive molecular profiling of lung adenocarcinoma. Nature. 2014;511(7511):543–550. doi: 10.1038/nature13385. [DOI] [PMC free article] [PubMed] [Google Scholar]
- 85.Cancer Genome Atlas Research Network Comprehensive genomic characterization of squamous cell lung cancers. Nature. 2012;489(7417):519–525. doi: 10.1038/nature11404. [DOI] [PMC free article] [PubMed] [Google Scholar]
- 86.Cancer Genome Atlas Network Genomic classification of cutaneous melanoma. Cell. 2015;161(7):1681–1696. doi: 10.1016/j.cell.2015.05.044. [DOI] [PMC free article] [PubMed] [Google Scholar]
- 87.Cancer Genome Atlas Network Comprehensive genomic characterization of head and neck squamous cell carcinomas. Nature. 2015;517(7536):576–582. doi: 10.1038/nature14129. [DOI] [PMC free article] [PubMed] [Google Scholar]
- 88.Cancer Genome Atlas Network Comprehensive molecular portraits of human breast tumours. Nature. 2012;490(7418):61–70. doi: 10.1038/nature11412. [DOI] [PMC free article] [PubMed] [Google Scholar]
- 89.Cancer Genome Atlas Network Comprehensive molecular characterization of human colon and rectal cancer. Nature. 2012;487(7407):330–337. doi: 10.1038/nature11252. [DOI] [PMC free article] [PubMed] [Google Scholar]
- 90.Benjamini Y, Hochberg Y. Controlling the false discovery rate: A practical and powerful approach to multiple testing. J Roy Stat Soc B Met. 1995;57(1):289–300. [Google Scholar]
- 91.R Core Team 2004. R: A Language and Environment for Statistical Computing. (R Foundation for Statistical Computing, Vienna, Austria). Available at https://www.r-project.org/. Accessed May 6, 2015.
- 92.Smyth G. Limma: Linear models for microarray data. In: Gentleman R, Carey VJ, Dudoit S, Irizarry R, Huber W, editors. Bioinformatics and Computational Biology Solutions using R and Bioconductor. Springer; New York: 2005. pp. 397–420. [Google Scholar]
- 93.Andersen PK, Gill RD. Cox’s regression model for counting processes: A large sample study. Ann Stat. 1982;10(4):1100–1120. [Google Scholar]
- 94.Therneau TM, Grambsch PM. Modeling Survival Data: Extending the Cox Model. 1st Ed Springer; New York: 2000. [Google Scholar]
- 95.Hothorn T, Hornik K, Zeileis A. Unbiased recursive partitioning: A conditional inference framework. J Comput Graph Stat. 2006;15(3):651–674. [Google Scholar]
- 96.Hothorn T, Zeileis A. partykit: A modular toolkit for recursive partytitioning in R. J Mach Learn Res. 2015;16:3905–3909. [Google Scholar]
- 97.Gentleman RC, et al. Bioconductor: Open software development for computational biology and bioinformatics. Genome Biol. 2004;5(10):R80. doi: 10.1186/gb-2004-5-10-r80. [DOI] [PMC free article] [PubMed] [Google Scholar]
- 98.Hanson BA. 2014. The HiveR Package.1-23. Available at academic.depauw.edu/∼hanson/HiveR/HiveR.html. Accessed May 6, 2015.
- 99.Lumley T. 2012. rmeta: Meta-analysis. R package version. Available at CRAN.R-project.org/package=rmeta. Accessed May 6, 2015.
- 100.Gao J, et al. Integrative analysis of complex cancer genomics and clinical profiles using the cBioPortal. Sci Signal. 2013;6(269):pl1. doi: 10.1126/scisignal.2004088. [DOI] [PMC free article] [PubMed] [Google Scholar]
- 101.Cerami E, et al. The cBio cancer genomics portal: An open platform for exploring multidimensional cancer genomics data. Cancer Discov. 2012;2(5):401–404. doi: 10.1158/2159-8290.CD-12-0095. [DOI] [PMC free article] [PubMed] [Google Scholar]
Associated Data
This section collects any data citations, data availability statements, or supplementary materials included in this article.


