Abstract
Epistatic interactions play a fundamental role in molecular evolution, but little is known about the spatial distribution of these interactions within genes. To systematically survey a model landscape of intragenic epistasis, we quantified the fitness of ~60,000 Saccharomyces cerevisiae strains expressing randomly mutated variants of the 333-nt long U3 snoRNA. The fitness effects of individual mutations were correlated with evolutionary conservation and structural stability. Many mutations had small individual effects, but large effects in the context of additional mutations, indicating negative epistasis. Clusters of negative interactions were explained by local thermodynamic threshold effects, whereas positive interactions were enriched among large-effect sites and between base-paired nucleotides. We conclude that high-throughput mapping of intragenic epistasis can identify key structural and functional features of macromolecules.
The effect of a mutation on phenotype may depend on the presence of additional mutations. This phenomenon, known as epistasis, explains synthetic lethal interactions, where a combination of two individually viable mutations causes death, and compensatory interactions, where the fitness cost of a mutation is reduced by a second mutation (1, 2). Epistasis plays a major role in evolution; it determines the accessibility of mutational pathways (3), thereby influencing the rate of adaptation and the diversity and robustness of genetic variants (4, 5). Although genome-wide studies have revealed a network of intergenic epistasis (6), it has been suggested that interactions within genes may be even more common (7–11). However, previous studies focused on relatively small networks of interactions, and the comprehensive pattern of epistasis has not yet been determined for any gene.
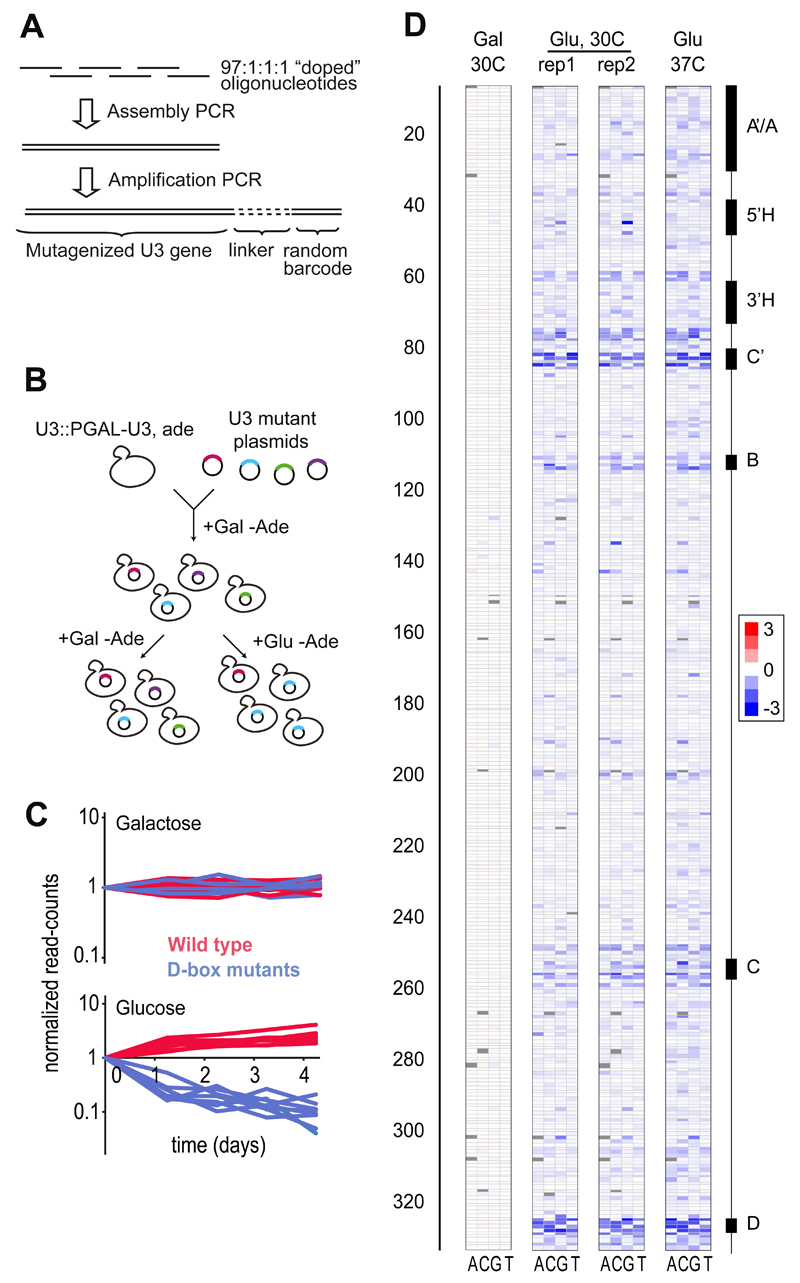
We used “doped” oligonucleotides to synthesize ~130,000 randomly mutated variants of the 333-nucleotide Saccharomyces cerevisiae gene SNR17A, which encodes the U3 small nucleolar RNA (snoRNA). U3 basepairs to the primary rRNA transcript (pre-rRNA) and this interaction is required for pre-rRNA cleavage and 18S rRNA biogenesis. Our mutagenesis approach ensures uniform coverage of mutations among positions 7-333, encompassing 98% of the gene, and prevents bias towards specific types of mutations (Figs. 1A, S1). We generated two independent mutant libraries, which contained on average 3 and 10 single nucleotide polymorphisms (SNPs) per allele, respectively. In addition to the SNPs, 43.6% of variants also contained short deletions (median length 1 nt) or insertions (median length 1 nt). All 981 (3*327) possible point mutations were represented in the library, and 99.4% of the 53,301 (327*326/2) possible pairs of sites were jointly mutated, most of them in alleles that contained additional mutations. To facilitate unambiguous identification of variants by high-throughput sequencing, we tagged each variant with a unique 20-nt barcode (Fig. 1A) placed in a non-transcribed region downstream of the U3 gene to minimize interference with function.
Figure 1. Experimental mapping of the U3 fitness landscape.
A. To perform saturation mutagenesis of U3 we used PCR to assemble overlapping “97:1:1:1-doped” and non-doped oligonucleotides covering the whole length of the gene (13) and attached a unique 20-nt barcode to each variant. B. We cloned the U3 mutant library into centromeric plasmids and transformed the plasmids into the D343 yeast strain. C. Normalized read-counts from barcode sequencing for 7 randomly chosen wild type U3 variants (red) and 7 variants carrying a single mutation in box D (blue), in control (galactose) and competitive (glucose) conditions. Fitness was approximated by fitting exponential decay curves to the barcode count data. D. Rows indicate positions along U3 and columns indicate substitution to one of 4 bases: A, C, G and T. Log fitness effects are shown in blue for deleterious effects, red for positive effects and white for no effect on galactose in 30C (Gal), and glucose (Glu) in 30C and 37C. Genetic variants with one or two mutations were included in the analysis (13). Positions for which no data were obtained are shown in grey.
To measure fitness, we used the D343 yeast strain, which contains a single copy of the wild-type U3 gene under control of a galactose-inducible promoter (12). D343 cells can grow in galactose-containing medium, but shifting to glucose results in downregulation of U3 and growth arrest. Transformation of wild-type U3 on a plasmid allows the cells to survive on glucose, but non-functional U3 mutants do not support growth (Fig. S2). We transformed D343 cells with centromeric plasmids carrying the U3 mutant libraries, and measured the frequency of each mutant during competitive growth on glucose (Fig. 1B). As expected, non-functional variants decreased in frequency during the competition, whereas the wild-type gene increased (Fig. 1C). Growth patterns were reproducible between four replicate experiments and across replicate U3 variants within an experiment (Figs. 1D, S3).
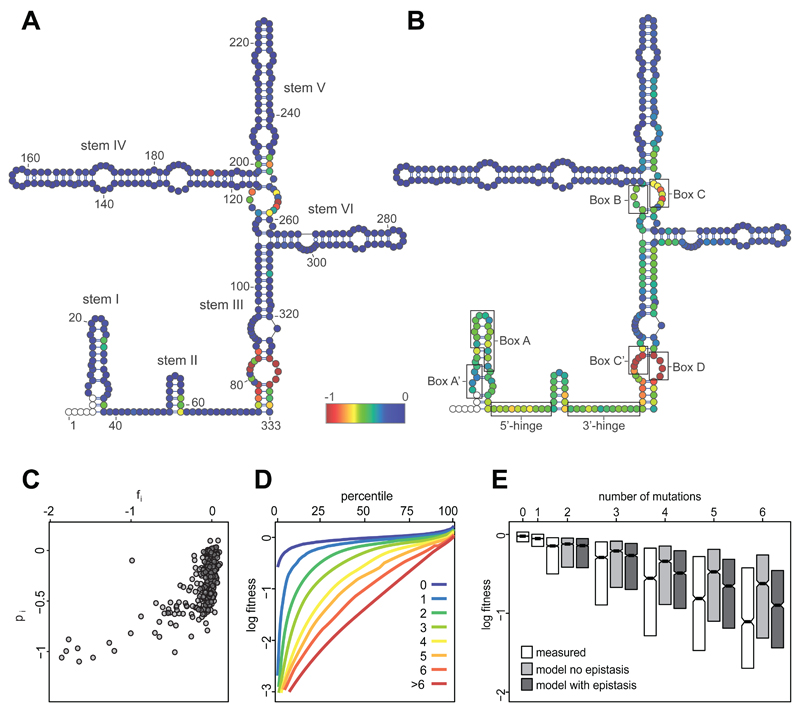
We measured the logarithm of relative fitness (log fitness) of ~60,000 variants that passed quality filters, by fitting exponential decay curves to the barcode count data (13). Log fitness of wild-type U3 was set to 0. We first focused on the effects of single mutations in an otherwise wild-type gene (13). In most positions, mutations were tolerated with minimal effect on fitness (Fig. 2A). The exceptions were the conserved protein binding sites known as Box B, C, C’ and D, mutations in which are lethal or highly deleterious. In addition, a moderate fitness decrease was observed for mutations within stems I, II, III and VI, particularly in G-C base pairs located at the base of stems, suggesting a role in structural stability. Folding predictions confirmed that destabilizing mutations in individual stems reduced fitness (Fig. S4). The 5nt 3’-terminal stem of U3 confers protection from degradation by 3’-5’ exonucleases (12). Mutations in this stem reduced fitness proportionally to their predicted effect on RNA folding strength (Figs. S4, S5). U->C mutations in positions 178 and 191 were highly deleterious (Fig. S5), possibly because they created consensus binding motifs (UCUUG) for the RNA degradation factor Nab3 (14). The fitness effects of mutations were slightly larger at 37C compared to 30C, consistent with the destabilizing effect of temperature on U3 structure (Fig. S6). We found no mutations that consistently increased fitness, suggesting that wild-type U3 is optimally adapted for function. In conditions where the genomic copy of U3 was coexpressed with the mutant library, the mutations had no effect, indicating lack of dominant negative or gain of function effects (Fig. 1D). Overall, these results show the expected pattern of single-site fitness effects and support the reliability of the measurements.
Figure 2. Distribution of fitness effects mapped to secondary structure.
A. The log fitness of single mutants at each position of U3 (fi) is represented according to the colour scale, from blue for no effect, to red for effects -1 and stronger; non-mutagenized positions are white. B. The population-average log fitness effect for each position in the background of multiple mutations (pi) (13). Evolutionarily conserved motifs are indicated on the secondary structure. C. Non-linear relationship between the fitness effects of single mutations in wild-type background (fi) and in mutated backgrounds (pi). D. Cumulative distributions of log fitness for mutants grouped by number of mutations per variant. E. Mean measured log fitness (white boxes) is always lower than expected in the absence of epistasis (grey boxes). Inclusion of epistasis improves the fit between the model and the data (dark grey boxes). The boxes show the median and inter-quartile ranges.
We then calculated pi, the aggregate log fitness effect of position i across all genetic backgrounds represented in the library (13). In contrast to the single mutants (Fig. 2A), most positions showed substantial effects on fitness in combination with other mutations (Fig. 2B). The variation in pi across the gene was reproducible between replicate experiments, was observed in both mutant libraries, was robust to the exclusion of outlier variants, and did not reflect the co-occurrence of mutations with large-effect mutations in other sites (Figs. S6,7). Most positions with very negative pi map to the conserved core of the U3 gene (stems I-III, 5’ hinge, 3’ hinge, Fig. 2B). In contrast, sites with near-zero pi were located in the fungal- or yeast-specific regions of the molecule (stems IV-VI, Fig. 2B). The pi values were correlated with fitness effects in wild-type background (Fig. 2C, Spearman rho=0.57, pval<2*10-16). However, the relationship was markedly non-linear, indicating that many mutations had small effects in an otherwise wild-type U3 but large effects in the context of additional mutations.
This pattern suggests a high prevalence of negative epistatic interactions within U3. To confirm this, we analyzed the distribution of fitness effects as a function of the number of mutations in each allele (Fig. 2D). As expected, the average fitness of variants decreased with increasing numbers of mutations. Notably, measured fitness was consistently lower than expected under an additive model (Fig. 2E). This indicates overall enrichment of negative epistatic interactions relative to positive interactions.
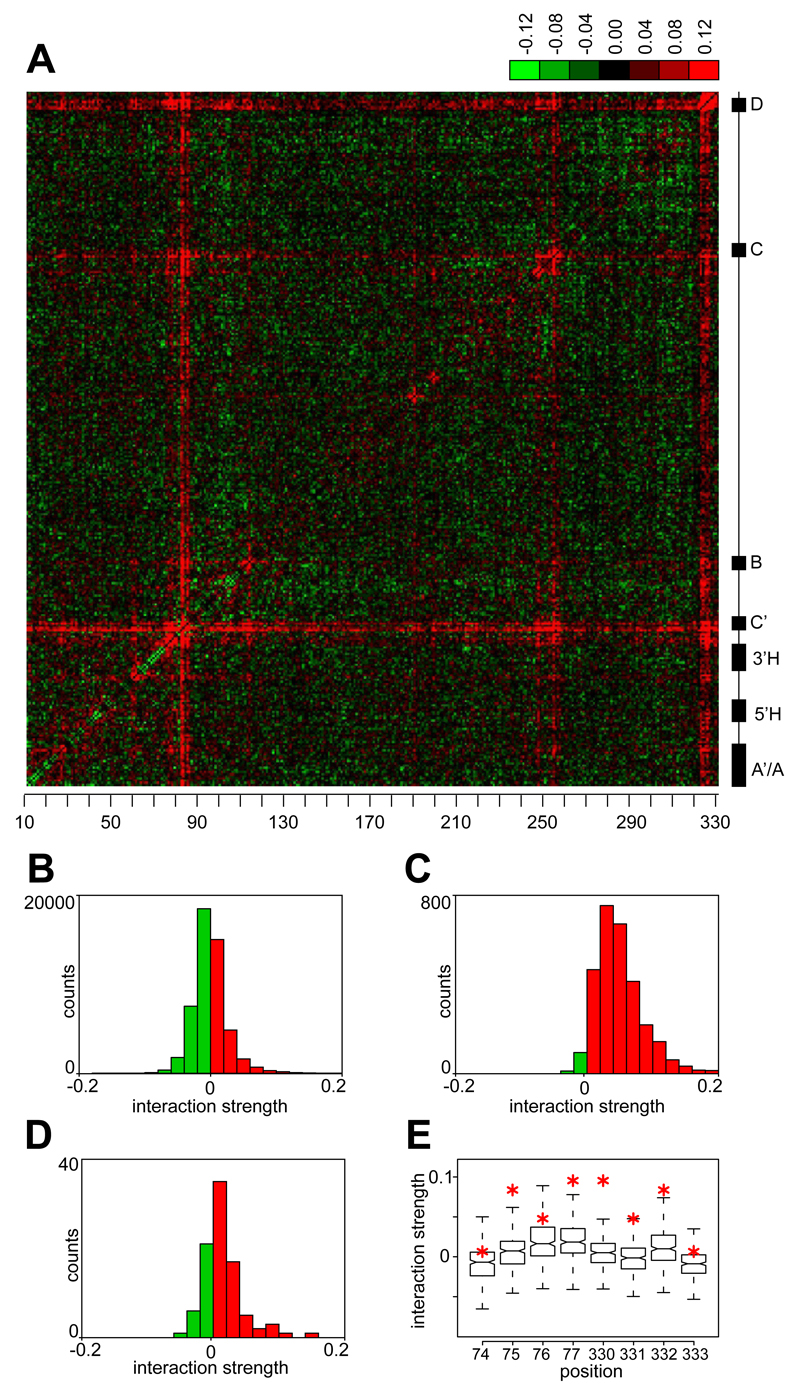
We estimated the strength of all pairwise interactions from measurements of single, double and multiple mutants (13) with a regression model (15–17) that explained approximately 86% of variance in measured fitness and produced similar patterns of interactions when applied to our replicate experiments (Fig. S9). We obtained a consensus set of epistatic interactions by averaging the interaction estimates from all four glucose competition experiments. Plotting these interactions resulted in a characteristic tartan pattern (Fig. 3A), in which several positions in the gene showed strong positive interactions with most other sites. These hubs of positive epistasis correspond to the C’, C and D boxes, which are highly conserved in evolution and show the largest individual effects on fitness. This observation indicates a saturation effect, whereby large-effect mutations inactivate the gene to such an extent that additional mutations become irrelevant, resulting in positive epistasis. Consistently, sites with large individual effects showed a strong bias towards positive epistasis (Wilcoxon test, p<2*10-16; Fig. 3B,C), and the fitness of C’, C and D box mutants did not depend strongly on the presence of additional mutations in the gene. The saturation effect is the within-gene equivalent of positive epistasis between pairs of mutations that independently inactivate the same metabolic pathway (18, 19).
Figure 3. Localization of negative and positive epistasis.
A. Estimated pairwise epistatic interactions (wij) between positions in U3 (13), averaged between all experiments in glucose media. Negative interactions are green and positive are red; evolutionarily conserved motifs are indicated on the right and positions in U3 on the bottom. Data for the first 6 positions are skipped due to lower coverage of mutations (see Fig. S1). B-D. Distribution of wij showing negative epistasis (green bars) and positive epistasis (red bars) for all interactions (B), for sites with large individual effects (effect size <-1 for at least one site in pair, C), and among pairs of base-paired positions (D). E. Distributions of wij for individual positions in the terminal stem (75-78, 330-333). Red asterisks indicate interactions between known basepairs.
We also expected positive interactions between base-paired positions, due to the presence of compensatory mutations, which are common in RNA evolution (5). Indeed, base-paired positions showed an enrichment of positive epistasis relative to all pairs of positions (Wilcoxon test, p=2*10-7; Fig. 3D). In particular, all positions within the essential terminal stem formed strong positive interactions with their corresponding base-paired residues (Fig. 3E). To test whether positive epistasis can be used to predict RNA folding, we intersected the set of positive interactions with a list of all potentially interacting triplets of nucleotides (13). In this analysis, 5 of 6 of the strongest positive interactions corresponded to known basepairs. When we used these interactions as constraints in RNA folding prediction, the accuracy of predicted secondary structure was improved (Fig. S10).
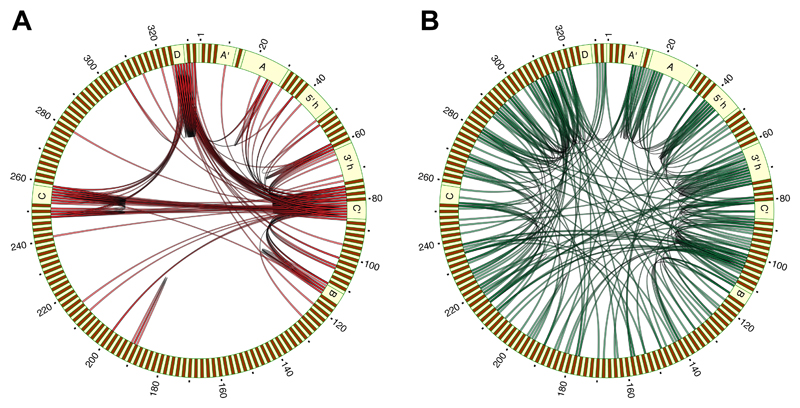
Despite the enrichment of positive interactions among large-effect or base-paired sites, negative interactions were more common overall (Fig. 3A,B). Whereas the strongest positive interactions typically involved at least one large-effect position (Fig. 4A), negative interactions were common among low- and intermediate-effect sites, and were distributed throughout the molecule, with enrichment in the conserved core (Fig. 4B). The strength of negative epistasis was inversely correlated with the distance along the primary sequence: 8 out of 10 strongest negative interactions were between pairs of adjacent nucleotides, and the median distance between the 100 most strongly interacting pairs was 18 nt. We thus focused on a hotspot of interactions encompassing the 3' hinge (Fig. S11A) that mediates base-pairing between U3 and the pre-ribosomal RNA (pre-rRNA), and is necessary for the pre-rRNA cleavage step of ribosome biogenesis (20). Our results suggest that the 3’ hinge can tolerate a single SNP, but that multiple mutations within this region reduce fitness, probably because they disrupt U3-rRNA binding. A similar, but less pronounced pattern was found in the 5’ hinge area. Our analysis shows that the thermodynamic threshold model, wherein fitness decreases abruptly when molecule stability falls below a certain level (9), also operates at the level of interactions between distinct molecules (Figure S11B).
Figure 4. Network of epistatic interactions.
Circos plots showing patterns of 200 strongest positive (A) and negative (B) interactions within U3. Evolutionarily conserved motifs are indicated.
In genome-wide studies, epistatic interactions between genes correlate with physical contacts, coevolution, and co-occurrence within biochemical pathways (6). Mapping genetic interaction networks therefore provides information about cellular organization. We postulate that intragenic interaction maps will similarly illuminate patterns of molecular organization. This and other studies (8, 17, 21, 22) suggest that within-gene epistatic interactions are enriched among residues in physical proximity. Were this correlation sufficiently strong, intra-gene epistasis would identify secondary and tertiary structures of macromolecules. Notably, recent studies have successfully predicted the 3D structures of proteins and complexes by measuring coevolution between residues within protein alignments, a phenomenon intimately linked to epistasis (23, 24). Improved methods to extract structurally relevant interactions from the dense network of intramolecular epistasis should allow macromolecular structures to be derived from maps of within-gene epistasis.
Supplementary Material
Figures S1-S11
Tables S1-S2
One Sentence Summary.
A high-throughput fitness assay identifies the complete network of epistatic interactions within a yeast RNA, and reveals mechanisms of epistasis.
Acknowledgments
We thank B. Charlesworth, A. DeLuna, J. Plotkin, C. Schneider and J. Zhang for discussion; E. Wacker and A. Gallacher for technical assistance; M. Bartosovic for computational help; Edinburgh Genomics, Edinburgh Clinical Research Facility and IGMM technical support for next-generation sequencing. The sequencing and barcode count data was deposited in GEO (accession number GSE77709), and the data modeling pipeline can be found on https://github.com/terembura/EpistaticInteractionsYeastU3. GK and OP designed the project, OP performed experiments, OP, BC, HC, DT, GS and GK analysed the data, BC and GS designed and BC implemented the data modeling pipeline, GK wrote the manuscript with input from other co-authors. OP and GK were supported by Wellcome Trust grant 097383 and by the MRC, DT was supported by Wellcome Trust grant 077248, GS was supported by the ERC grant MLCS306999
References and Notes
- 1.Phillips PC. Epistasis--the essential role of gene interactions in the structure and evolution of genetic systems. Nat Rev Genet. 2008 Nov;9:855. doi: 10.1038/nrg2452. [DOI] [PMC free article] [PubMed] [Google Scholar]
- 2.de Visser JA, Krug J. Empirical fitness landscapes and the predictability of evolution. Nat Rev Genet. 2014 Jul;15:480. doi: 10.1038/nrg3744. [DOI] [PubMed] [Google Scholar]
- 3.Weinreich DM, Delaney NF, Depristo MA, Hartl DL. Darwinian evolution can follow only very few mutational paths to fitter proteins. Science. 2006 Apr 7;312:111. doi: 10.1126/science.1123539. [DOI] [PubMed] [Google Scholar]
- 4.Jimenez JI, Xulvi-Brunet R, Campbell GW, Turk-MacLeod R, Chen IA. Comprehensive experimental fitness landscape and evolutionary network for small RNA. Proc Natl Acad Sci U S A. 2013 Sep 10;110:14984. doi: 10.1073/pnas.1307604110. [DOI] [PMC free article] [PubMed] [Google Scholar]
- 5.Meer MV, Kondrashov AS, Artzy-Randrup Y, Kondrashov FA. Compensatory evolution in mitochondrial tRNAs navigates valleys of low fitness. Nature. 2010 Mar 11;464:279. doi: 10.1038/nature08691. [DOI] [PubMed] [Google Scholar]
- 6.Costanzo M, et al. The genetic landscape of a cell. Science. 2010 Jan 22;327:425. doi: 10.1126/science.1180823. [DOI] [PMC free article] [PubMed] [Google Scholar]
- 7.Lehner B. Molecular mechanisms of epistasis within and between genes. Trends Genet. 2011 Aug;27:323. doi: 10.1016/j.tig.2011.05.007. [DOI] [PubMed] [Google Scholar]
- 8.Davis BH, Poon AF, Whitlock MC. Compensatory mutations are repeatable and clustered within proteins. Proceedings Biological sciences / The Royal Society. 2009 May 22;276:1823. doi: 10.1098/rspb.2008.1846. [DOI] [PMC free article] [PubMed] [Google Scholar]
- 9.Bershtein S, Segal M, Bekerman R, Tokuriki N, Tawfik DS. Robustness-epistasis link shapes the fitness landscape of a randomly drifting protein. Nature. 2006 Dec 14;444:929. doi: 10.1038/nature05385. [DOI] [PubMed] [Google Scholar]
- 10.Bank C, Hietpas RT, Jensen JD, Bolon DN. A systematic survey of an intragenic epistatic landscape. Mol Biol Evol. 2015 Jan;32:229. doi: 10.1093/molbev/msu301. [DOI] [PMC free article] [PubMed] [Google Scholar]
- 11.Podgornaia AI, Laub MT. Protein evolution Pervasive degeneracy and epistasis in a protein-protein interface. Science. 2015 Feb 6;347:673. doi: 10.1126/science.1257360. [DOI] [PubMed] [Google Scholar]
- 12.Samarsky DA, Fournier MJ. Functional mapping of the U3 small nucleolar RNA from the yeast Saccharomyces cerevisiae. Mol Cell Biol. 1998 Jun;18:3431. doi: 10.1128/mcb.18.6.3431. [DOI] [PMC free article] [PubMed] [Google Scholar]
- 13.Materials and methods are available as supporting material on Science Online.
- 14.Wlotzka W, Kudla G, Granneman S, Tollervey D. The nuclear RNA polymerase II surveillance system targets polymerase III transcripts. EMBO J. 2011 May 4;30:1790. doi: 10.1038/emboj.2011.97. [DOI] [PMC free article] [PubMed] [Google Scholar]
- 15.Otwinowski J, Nemenman I. Genotype to phenotype mapping and the fitness landscape of the coli E lac promoter. PLoS One. 2013;8:e61570. doi: 10.1371/journal.pone.0061570. [DOI] [PMC free article] [PubMed] [Google Scholar]
- 16.Otwinowski J, Plotkin JB. Inferring fitness landscapes by regression produces biased estimates of epistasis. Proc Natl Acad Sci U S A. 2014 Jun 3;111:E2301. doi: 10.1073/pnas.1400849111. [DOI] [PMC free article] [PubMed] [Google Scholar]
- 17.Hinkley T, et al. A systems analysis of mutational effects in HIV-1 protease and reverse transcriptase. Nat Genet. 2011 May;43:487. doi: 10.1038/ng.795. [DOI] [PubMed] [Google Scholar]
- 18.St Onge RP, et al. Systematic pathway analysis using high-resolution fitness profiling of combinatorial gene deletions. Nat Genet. 2007 Feb;39:199. doi: 10.1038/ng1948. [DOI] [PMC free article] [PubMed] [Google Scholar]
- 19.He X, Qian W, Wang Z, Li Y, Zhang J. Prevalent positive epistasis in Escherichia coli and Saccharomyces cerevisiae metabolic networks. Nat Genet. 2010 Mar;42:272. doi: 10.1038/ng.524. [DOI] [PMC free article] [PubMed] [Google Scholar]
- 20.Dutca LM, Gallagher JE, Baserga SJ. The initial U3 snoRNA:pre-rRNA base pairing interaction required for pre-18S rRNA folding revealed by in vivo chemical probing. Nucleic Acids Res. 2011 Jul;39:5164. doi: 10.1093/nar/gkr044. [DOI] [PMC free article] [PubMed] [Google Scholar]
- 21.Braberg H, et al. From structure to systems: high-resolution, quantitative genetic analysis of RNA polymerase II. Cell. 2013 Aug 15;154:775. doi: 10.1016/j.cell.2013.07.033. [DOI] [PMC free article] [PubMed] [Google Scholar]
- 22.Li C. The fitness landscape of a tRNA gene. 2015 doi: 10.1126/science.aae0568. submitted. [DOI] [PMC free article] [PubMed] [Google Scholar]
- 23.Hopf TA, et al. Sequence co-evolution gives 3D contacts and structures of protein complexes. eLife. 2014;3 doi: 10.7554/eLife.03430. [DOI] [PMC free article] [PubMed] [Google Scholar]
- 24.Marks DS, et al. Protein 3D structure computed from evolutionary sequence variation. PLoS One. 2011;6:e28766. doi: 10.1371/journal.pone.0028766. [DOI] [PMC free article] [PubMed] [Google Scholar]
- 25.Beltrame M, Tollervey D. Base pairing between U3 and the pre-ribosomal RNA is required for 18S rRNA synthesis. EMBO J. 1995 Sep 1;14:4350. doi: 10.1002/j.1460-2075.1995.tb00109.x. [DOI] [PMC free article] [PubMed] [Google Scholar]
- 26.Stotz A, Linder P. The ADE2 gene from Saccharomyces cerevisiae: sequence and new vectors. Gene. 1990 Oct 30;95:91. doi: 10.1016/0378-1119(90)90418-q. [DOI] [PubMed] [Google Scholar]
- 27.Gietz RD, Woods RA. Transformation of yeast by lithium acetate/single-stranded carrier DNA/polyethylene glycol method. Methods in enzymology. 2002;350:87. doi: 10.1016/s0076-6879(02)50957-5. [DOI] [PubMed] [Google Scholar]
- 28.Langmead B, Salzberg SL. Fast gapped-read alignment with Bowtie 2. Nat Methods. 2012 Apr;9:357. doi: 10.1038/nmeth.1923. [DOI] [PMC free article] [PubMed] [Google Scholar]
- 29.Li H, et al. The Sequence Alignment/Map format and SAMtools. Bioinformatics. 2009 Aug 15;25:2078. doi: 10.1093/bioinformatics/btp352. [DOI] [PMC free article] [PubMed] [Google Scholar]
- 30.Altschul SF, Gish W, Miller W, Myers EW, Lipman DJ. Basic local alignment search tool. J Mol Biol. 1990 Oct 5;215:403. doi: 10.1016/S0022-2836(05)80360-2. [DOI] [PubMed] [Google Scholar]
- 31.Quinlan AR, Hall IM. BEDTools: a flexible suite of utilities for comparing genomic features. Bioinformatics. 2010 Mar 15;26:841. doi: 10.1093/bioinformatics/btq033. [DOI] [PMC free article] [PubMed] [Google Scholar]
- 32.Orr HA. Fitness and its role in evolutionary genetics. Nat Rev Genet. 2009 Aug;10:531. doi: 10.1038/nrg2603. [DOI] [PMC free article] [PubMed] [Google Scholar]
- 33.Charlesworth B, Charlesworth D. Elements of Evolutionary Genetics. Roberts and Company Publishers; 2010. [Google Scholar]
- 34.Mccullagh P. Generalized Linear-Models. Eur J Oper Res. 1984;16:285. [Google Scholar]
- 35.Minka T. Expectation propagation for approximate Bayesian inference. Proceedings of the Seventeenth conference on Uncertainty in Artificial Intelligence. 2001 [Google Scholar]
- 36.Tibshirani R. Regression shrinkage and selection via the Lasso. J Roy Stat Soc B Met. 1996;58:267. [Google Scholar]
- 37.Saldanha AJ. Java Treeview--extensible visualization of microarray data. Bioinformatics. 2004 Nov 22;20:3246. doi: 10.1093/bioinformatics/bth349. [DOI] [PubMed] [Google Scholar]
- 38.Darty K, Denise A, Ponty Y. VARNA: Interactive drawing and editing of the RNA secondary structure. Bioinformatics. 2009 Aug 1;25:1974. doi: 10.1093/bioinformatics/btp250. [DOI] [PMC free article] [PubMed] [Google Scholar]
- 39.Krzywinski M, et al. Circos: an information aesthetic for comparative genomics. Genome Res. 2009 Sep;19:1639. doi: 10.1101/gr.092759.109. [DOI] [PMC free article] [PubMed] [Google Scholar]
- 40.Smyth RP, et al. Mutational interference mapping experiment (MIME) for studying RNA structure and function. Nat Methods. 2015 Sep;12:866. doi: 10.1038/nmeth.3490. [DOI] [PubMed] [Google Scholar]
- 41.Hofacker IL. Vienna RNA secondary structure server. Nucleic Acids Res. 2003 Jul 1;31:3429. doi: 10.1093/nar/gkg599. [DOI] [PMC free article] [PubMed] [Google Scholar]
Associated Data
This section collects any data citations, data availability statements, or supplementary materials included in this article.
Supplementary Materials
Figures S1-S11
Tables S1-S2


