Abstract
Rheumatoid arthritis (RA) is an autoimmune disease hallmarked by aberrant cellular homeostasis, resulting in hyperactive CD4+ T cells that are more resistant to apoptosis. Both hyperactivation and resistance to apoptosis may contribute to the pathogenicity of these T cells in the autoimmune process. A better knowledge of the mechanisms determining such impaired homeostasis could contribute significantly to both the understanding and the treatment of the disease. Here we investigated whether autophagy, is dysregulated in CD4+ T cells of RA patients, resulting in disturbed T cell homeostasis. We demonstrate that the rate of autophagy is significantly increased in CD4+ T cells from RA patients, and that increased autophagy is also a feature of in vitro activated CD4+ T cells. The increased apoptosis resistance observed in CD4+ T cells from RA patients was significantly reversed upon autophagy inhibition. These mechanisms may contribute to RA pathogenesis, as autophagy inhibition reduced both arthritis incidence and disease severity in a mouse collagen induced arthritis mouse model. Conversely, in Atg5flox/flox-CD4-Cre+ mice, in which all T cells are autophagy-deficient, T cells showed impaired activation and proliferation.
These data provide novel insight into the pathogenesis of RA and underscore the relevance of autophagy as a promising therapeutic target.
Keywords: T cells, Autophagy, Rheumatoid Arthritis, Activation, Apoptosis Resistance
Introduction
Rheumatoid Arthritis (RA) is the most common form of autoimmune arthritis with an incidence of approximately 1% in Western countries [1]. Like other autoimmune diseases, RA is the result of an inappropriate immune response against self. This lack of tolerance is associated with autoreactive T cells that are hyperactive, less susceptible to apoptosis and often resistant to therapy [1]–[4]. Collective evidence indicates that cellular homeostasis is disturbed in T cells from RA patients. Understanding how cellular homeostasis in T cells of these patients can be restored remains an important scientific and medical unmet need.
Autophagy is a highly conserved catabolic process that is crucial for the maintenance of cellular homeostasis. In this process, double-membrane vesicles are formed around cytoplasmic content. These autophagosomes can subsequently fuse with lysosomes allowing degradation of their content, and resulting in free ATP and amino acids that can be used as building blocks for other proteins [5],[6]. A variety of cellular processes have shown to be regulated by autophagy including survival, differentiation, proliferation and activation. There are numerous reports of the importance of autophagy in the innate immune system, but its role in adaptive immunity remains poorly understood [7]. It has been reported that CD4+ T cells can undergo autophagy, although human data are scarce [8],[9].
Since CD4+ T cell homeostasis is disturbed in RA patients and autophagy is a critical mediator of homeostasis we hypothesized that autophagy might be dysregulated in RA. Here we demonstrate that autophagy is unbalanced in activated CD4+ T cells from RA patients, and we propose two mechanisms by which increased autophagy can contribute to RA. In addition we show that autophagy inhibition can reduce arthritis severity in a collagen induced arthritis mouse model. Collectively these data are the first to demonstrate that increased autophagy in activated CD4+ T cells can contribute to RA.
Results
Increased autophagic flux in CD4+ T cells from rheumatoid arthritis (RA) patients compared to healthy controls
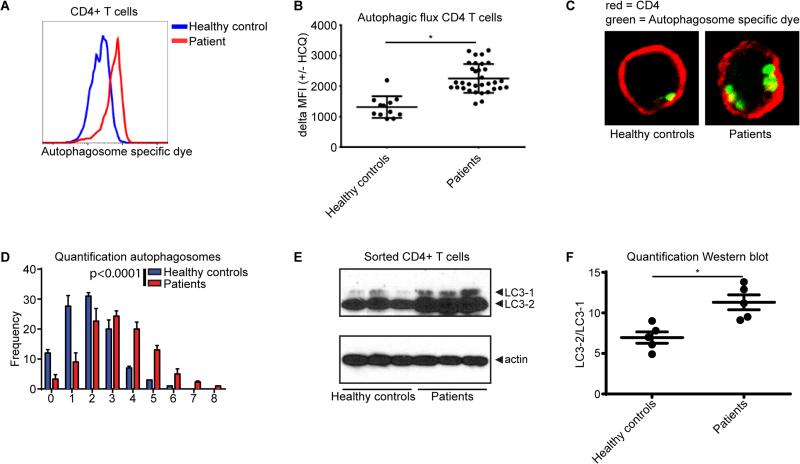
We first aimed to determine whether the rate of autophagy (also known as the autophagic flux) was altered in CD4+ T cells from RA patients. PBMC from healthy controls (n=12) and RA patients (n=33) were cultured in the presence of hydroxychloroquine (HCQ) for 18 hours. HCQ inhibits completion of the autophagic cycle by affecting lysosomal acidification, thereby resulting in an accumulation of the number of autophagosomes [9]. The number of autophagosomes after HCQ treatment (especially when compared to non-treated cells) can thus be used as a measure of the autophagic flux. PBMC were treated with HCQ and autophagy was measured utilizing a Cyto-ID cationic amphiphilic tracer dye that specifically recognizes autophagosomes and can be quantified by flow cytometry [10]. These studies showed that autophagy was significantly increased in CD4+ T cells from RA patients compared to healthy controls (Fig. 1A, Supplementary Fig. 1). No significant correlation was observed with age, gender, or disease scores (Supplementary Fig. 2A-D). Similar differences between RA patients and controls were observed in CD8+ T cells but not in CD19+ B cells (Supplementary Fig. 3A-B). To more specifically analyze the autophagic flux in these cells, we compared the increase in mean fluorescent intensity (MFI) of cells that were or were not treated with HCQ. The autophagic flux was significantly higher in CD4+ T cells from RA patients compared to healthy controls (Fig. 1B). Accordingly, the number of autophagosomes was significantly increased in sorted CD4+ T cells from RA patients compared to healthy controls, when analyzed by confocal microscopy (Fig. 1C, D). To validate these data with an independent technique, sorted CD4+ T cells were first treated with HCQ and then LC3-II, an indicator of autophagosome formation and readout for autophagy activation, was analyzed by Western blot. Again, we observed that autophagy was increased in the CD4+ cells from RA patients compared to healthy controls (Fig. 1E, F).
Figure 1. Autophagic flux in CD4+ T cells from rheumatoid arthritis (RA) patients compared to healthy controls.
(A) RA and control PBMCs cultured in the presence of 10 μM hydroxychloroquine (HCQ) for 18 hours were stained for CD4 and with the Cyto-ID autophagy detection kit and analyzed by flow cytometry. (B) Quantification of the autophagic flux in control and RA CD4+ T cells. PBMCs were cultured in the presence or absence of 10 μM HCQ for 18 hours and stained for CD4 and autophagosomes. The autophagic flux iss depicted as the difference of the mean fluorescent intensity (MFI) +/− HCQ. (C) Sorted CD4+ T cells from RA patients or healthy controls cultured in the presence of 10 μM HCQ for 18 hours. Cells were stained for autophagosomes (green) and CD4 (red). (D) Quantification of the number of autophagosomes per cell. 100 cells were analyzed. (E) Sorted CD4+ T cell form healthy controls or RA patients were treated with 10 μM HCQ for 18 hours. LC3-1 and LC3-2 expression was determined by Western blot. (F) Quantification of the LC3-2/LC3-1 ratio as determined in (E). *p<0.05.
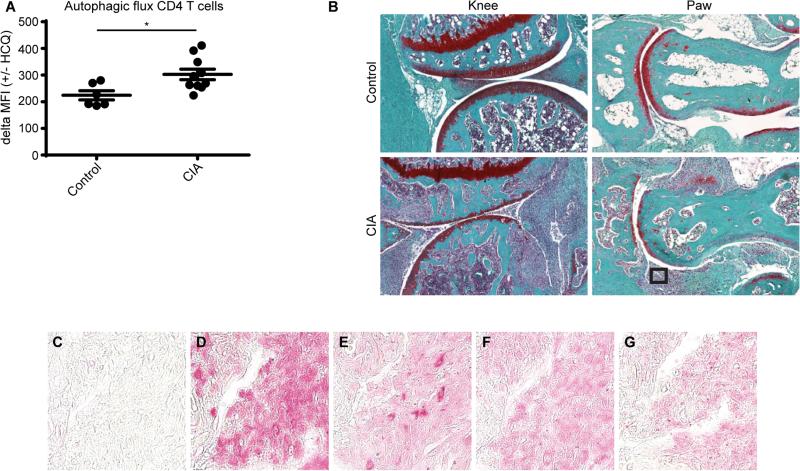
Since we observed that the autophagic flux in CD4+ T cells directly isolated from the blood of RA patients was increased compared to healthy controls we next searched to assess the autophagic process at the site of inflammation in vivo. For this purpose the well-established collagen induced arthritis (CIA) mouse model was used [11]. First, autophagy was assessed in CD4+ cells from the blood of these mice using the autophagosome specific dye Cyto-ID. Similar to our observations in humans, we detected an increased autophagic flux in CD4+ T cells obtained from CIA mice compared to controls (Fig. 2A). To assess the autophagic status at the site of inflammation the mice were sacrificed and the paws were fixed and analyzed by immunohistochemistry. As expected the paws from CIA mice were swollen and displayed a considerable amount of inflammatory cells (Fig. 2B). Analysis of these inflammatory cells revealed that they were also positive LC3, ATG5, and ULK, all of which are important for autophagic process (Fig. 2C-G). Taken together, these data indicate that the autophagic flux is increased in CD4+ T cells from RA patients compared to healthy controls. Furthermore this observation is shared in a mouse arthritis model.
Figure 2. Autophagic flux in a collagen induced arthritis mouse model.
(A) A collagen induced arthritis (CIA) mouse model was used to assess the autophagic flux in CD4+ T cells from the blood. Cells cultured in the presence of 10 μM hydroxychloroquine (HCQ) for 18 hours were stained for CD4 and with the Cyto-ID autophagy detection kit and analyzed by flow cytometry. (B) The knee and paw of control and CIA mice were analyzed by histology after safranin O staining. The square indicates the field of cells depicted in (C-G). (C-G) Immunohistochemistry staining of the cells indicated in (B) for (C) IgG, (D) CD4, (E) LC3, (F) ATG5, (G), ULK1. * p<0.05.
The autophagic flux in CD4+ T cells from RA patients is highest in activated cells
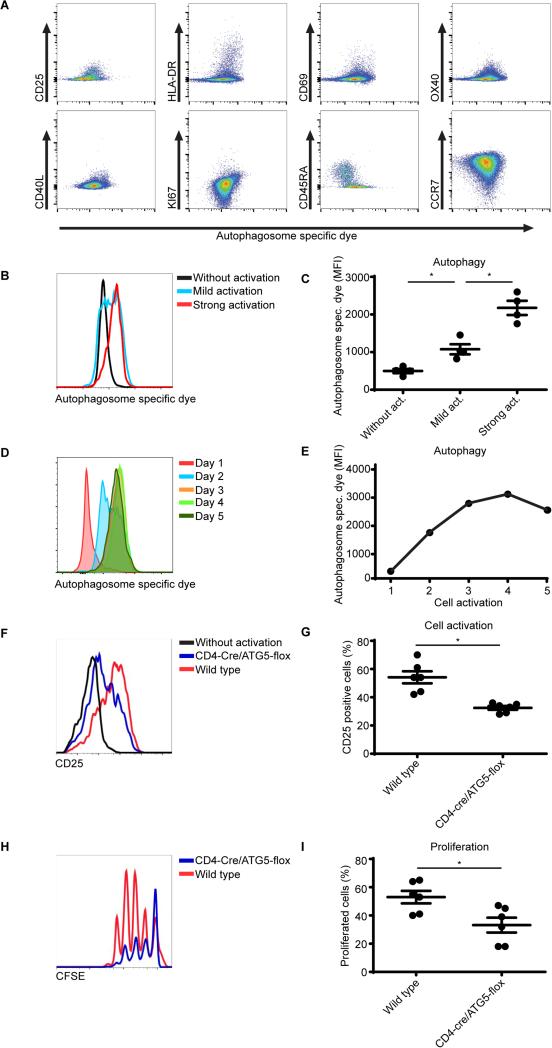
RA is characterized by a pro-inflammatory repertoire of T cells comprising activated CD4+ T cells [1]. Since we observed that autophagy was increased in RA patient CD4+ cells, we next assessed whether autophagy correlates with the activation status of these cells. RA patient CD4+ cells were analyzed for autophagosomes as well as for the presence of markers that are linked with T cell activation including CD25, HLA-DR, CD69, OX40, CD40L, Ki67, CD45RA, and CCR7. As shown in Figure 3A, CD4+ T cells that are positive for CD25, HLA-DR, CD69, OX40, CD40L, Ki67 also show increased autophagy activation. Correspondingly, CCR7 low cells have a high level of autophagy, and expression of the naive T cells marker CD45RA correlates with a low level of autophagy. To further verify the relation between autophagy and T cell activation experimentally, human CD4+ T cells were activated utilizing anti-CD3/28 coated beads and autophagy was analyzed. Indeed autophagy was increased in CD4+ T cells that were activated (Fig. 3B, C). To obtain further knowledge regarding the sequence of autophagy in time after activation, autophagy was assessed every day in activated CD4+ T cells after removal of the aCD3/28 stimulation beads. Here autophagy kept increasing in time with a peak at day 4 after bead removal (Fig. 3D, E, Supplementary Fig. 4A). A similar trend was observed in the CD4+CD25+ subpopulation indicating that this was a global effect for all CD4+T cells (Supplementary Fig. 4B). To further explore the relevance of autophagy in the inflammatory process, CD4+ T cells were isolated from wild-type or Atg5flox/flox-CD4-Cre+ mice, which lack the essential autophagy protein Atg5 and thus are autophagy defective in CD4+ T cells. These T cells were activated by co-culturing them in the presence of antigen presenting cells and anti-CD3, and were subsequently analyzed for CD25 expression as a measure of activation and CFSE dilution as a measure of proliferation. Autophagy deficiency impaired both CD4+ T cell activation and proliferation (Fig. 3F-I). These data suggest that autophagy modulates CD4+ T cell activation and thus provides a mechanism responsible for increased T cell activation in RA patients.
Figure 3. The autophagic flux in activated CD4+ T cells from RA patients.
(A) CD4+ T cells from RA patients were cultured in the presence of 10 μM hydroxychloroquine (HCQ) for 18 hours. Cells were stained for autophagosomes and CD25, HLA-DR, CD69, OX40, CD40L, KI67, CD45RA and CCR7. (B) Sorted CD4 T cells cultured in the presence of anti-CD3/28 coated beads (mild activation 1 bead/5 cells, strong activation 3 beads/1 cell). Autophagosomes were stained and analyzed by flow cytometry (n=4). (C) Quantification of (B). (D, E) PBMCs were activated utilizing aCD3/CD28 coated beads (1:1 ratio) for 24 hours. The beads were then removed and every day autophagy was assessed within the CD4+ T cell population. (F) CD4+CD25− T cells were sorted from the spleen of wild type or CD4-cre/ATG5-flox mice and cultured in the presence of anti-CD3 and antigen presenting cells for 24 hours and CD25 expression was analyzed by flow cytometry (n=6). (G) Quantification of (F), 6 mice per group. (H) CD4+CD25− T cells were sorted from the spleen of wild type or CD4-cre/ATG5-flox mice and cultured in the presence of anti-CD3 and antigen presenting cells for 72 hour. Proliferation was determined by CFSE dilution (n=6). (I) Quantification of (H). * p<0.05.
Inhibition of autophagy reduces activation and apoptosis resistance in RA patient cells
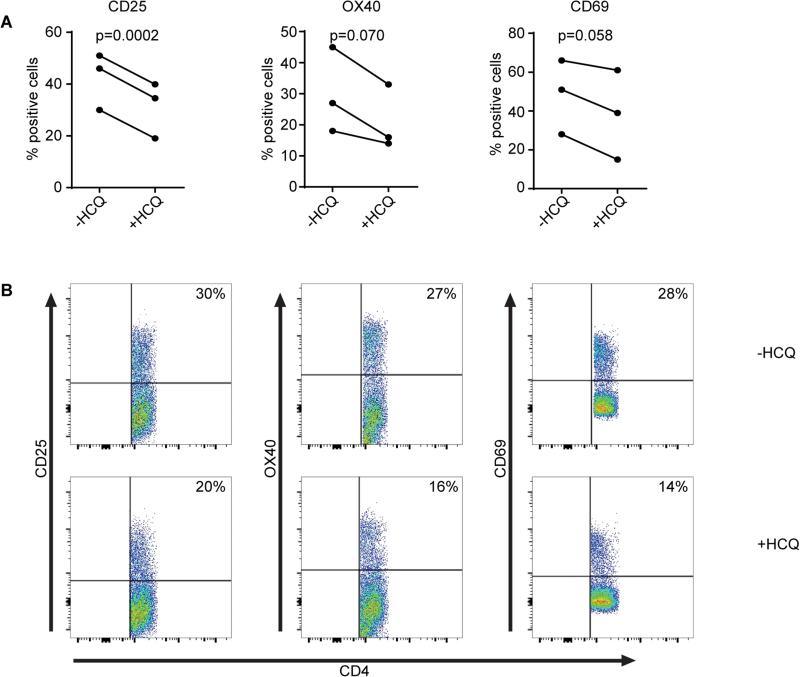
As our data indicated that autophagy modulates T cell activation we next assessed whether inhibition of autophagy, utilizing HCQ, might reduce the activation of T cells from RA patients. Here RA patient T cells were activated and cultured overnight in the presence or absence of HCQ. Subsequently the expression of T cell activation markers CD25, OX40, and CD69 were measured. As indicated in figure 4A-B, the expression of all three activation markers was reduced upon HCQ treatment.
Figure 4. Inhibition of autophagy in RA patient cells.
(A-B) CD4+ T cells from RA patients were cultured in the presence of 10 μM hydroxychloroquine (HCQ) for 18 hours. Cells were stained for autophagosomes and CD25, OX40, and CD69.
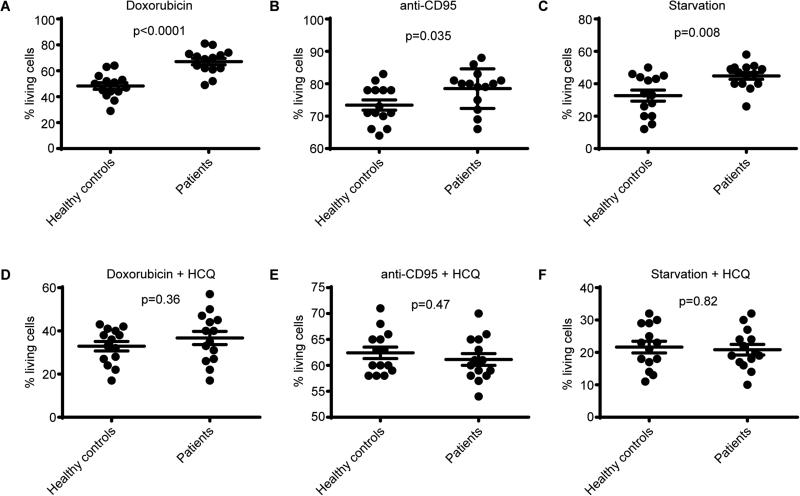
A common observation in RA CD4+ T cells is that they are more resistant to apoptosis [2]–[4]. Since apoptosis normally helps in the termination of infection/inflammation, apoptosis resistance has been proposed as an important mechanism of RA [2]–[4]. Autophagy can function as a survival mechanism by preventing apoptosis [5],[6]. We therefore hypothesized that the increased autophagy in RA CD4+ T cells prevents apoptosis and thereby contributes to RA pathogenesis. To test this hypothesis we first aimed to validate in our system that apoptosis is impaired in cells from RA patients. Indeed apoptosis induction utilizing doxorubicin, anti-CD95, or starvation (0.05% serum) was impaired in RA samples (Fig. 5A-C). To assess whether the protective effect of autophagy was contributing to the differences in apoptosis, the experiment was repeated in the presence of the autophagy inhibitor HCQ. Under treatment with HCQ there was no significant difference in apoptosis between healthy control and RA CD4+ T cells (Fig. 5D-F). These data indicate that the increased autophagic-flux observed in CD4+ T cells from RA patients results in apoptosis resistance and is probably inherent to inflammation.
Figure 5. The effect of autophagy inhibition on apoptosis resistance in RA patient cells.
(A-C) Sorted CD4+ T cells from healthy controls and RA patients were cultured in the presence of doxorubicin, anti-CD95, or starvation (0.05% serum) conditions and apoptosis was determined by Annexin V and PI staining. (D-G) Sorted CD4+ T cells from healthy controls and RA patients were cultured in the presence of hydroxychloroquine (HCQ) in combination with doxorubicin, anti-CD95, or starvation (0.05% serum) conditions and apoptosis was determined by Annexin V and PI staining. * p<0.05 (n=14).
Inhibition of autophagy reduces disease in a CIA mouse model
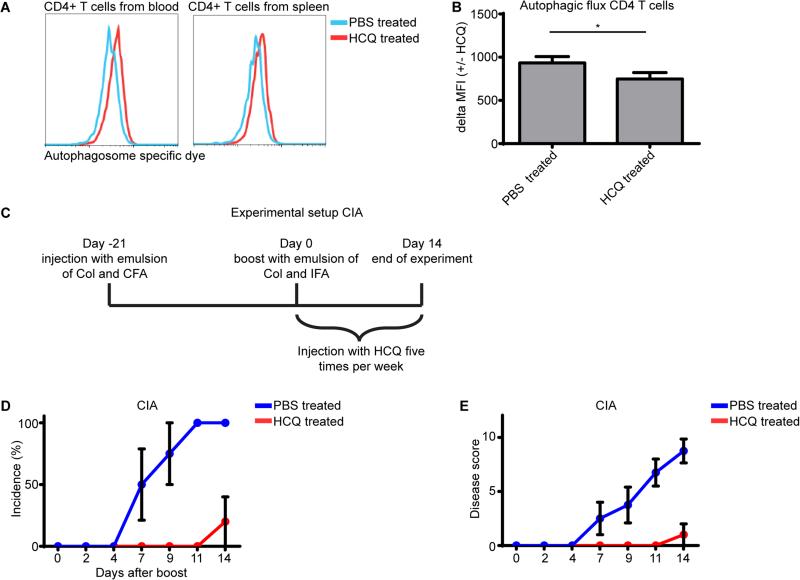
Our data thus far demonstrated that autophagy is increased in CD4+ T cells from RA patients and that increased autophagy can result in T cell activation and apoptosis resistance. We consequently hypothesized that inhibition of autophagy could be a therapeutic strategy for RA treatment. We first tested if treatment with the autophagy inhibitor HCQ could indeed impair autophagy in CD4+ T cells. Male DBA/1 mice were injected with 60 mg/kg HCQ, and sacrificed four hours later and CD4+ T cells from blood and spleen were analyzed for autophagy. The MFI of the autophagy specific dye was increased, thus indicating that the autophagy process was inhibited resulting in an accumulation of autophagosomes (Fig. 6A). To more specifically analyze the autophagic flux in these cells, CD4+ T cells from blood were treated with or without HCQ and stained with the autophagy specific dye. The increase in MFI was again used to determine the autophagic flux. The autophagic flux was significantly lower in CD4+ T cells from mice that were injected with the autophagy inhibitor HCQ, demonstrating that injecting HCQ could indeed reduce autophagy in CD4+ T cells (Fig. 6B). To investigate if autophagy inhibition could also reduce the severity of rheumatoid arthritis in an in vivo model, the collagen induced arthritis (CIA) mouse model was used. Here arthritis was induced and mice were injected 5 times per week with HCQ from the day that they received the collagen boost injection (Fig. 6C). Injecting the autophagy inhibitor HCQ significantly reduced both arthritis incidence and disease score (Fig. 6D, E). These data demonstrate that inhibiting autophagy can potentially provide a novel therapeutic strategy to treat RA patients.
Figure 6. Inhibition of autophagy in a CIA mouse model.
(A) Wild type mice were IP injected with 60mg/kg hydroxychloroquine (HCQ). Four hours later CD4+ T cells from the blood and spleen were stained for autophagosomes and analyzed by flow cytometry. (B) PBMC from mice injected with PBS or HCQ were cultured in the presence of 20 μM hydroxychloroquine for 18 hours and were stained for CD4 and with the Cyto-ID autophagy detection kit and analyzed by flow cytometry. The autophagic flux was depicted as the difference of the mean fluorescent intensity (MFI) +/− HCQ. (n=4) (C) Experimental setup for (D, E). (D, E) Arthritis was induced in mice as described in the materials and method section. After the mice received the boost injection they were injected five times per week with PBS or 60mg/kg HCQ and disease was scored three times per week. CIA, collagen induced arthritis. Col, collagen. CFA, complete Freud's adjuvant. IFA, incomplete Freud's adjuvant. * p<0.05 (n=5).
Discussion
In this study we demonstrated that autophagy is significantly increased in CD4+ T cells of RA patients. We showed that increased autophagy correlates with the activation status of CD4+ T cells. In addition we demonstrated that the increased apoptosis resistance observed in CD4+ T cells from RA patients was significantly reversed upon autophagy inhibition. As both CD4+ T cell activation and apoptosis resistance promote arthritis, autophagy can contribute to disease pathogenesis. Autophagy inhibition could therefore provide a novel therapeutic strategy to reduce both arthritis incidence and disease severity, similar to what we demonstrated in an arthritis mouse model. Our results covenant with a publication where experimental arthritis was suppressed in a hTNFa transgenic mouse that was transplanted with Atg7-deficient bone marrow cells (BMC), compared to control BMC [12]. Here, the authors demonstrated that monocyte to osteoclast differentiation was regulated by autophagy, but the role of T cells was not examined.
The trigger of the increased autophagic flux observed in RA T cells remains to be determined. This will also help to understand whether autophagy is the cause or the consequence of this disease. We demonstrated that T cell activation of human cells results in increased autophagy and that mouse autophagy-deficient T cells are impaired in their activation. Since autophagy is also implicated in T cell survival it is challenging to dissect all these processes and additional research is needed [8].
In order to assess whether the increased autophagic flux observed in the blood of RA patients could also be observed at the site of inflammation, autophagy-related proteins were visualized in infiltrates in the joints of mice with experimental arthritis using immunohistochemistry (Fig. 2). Although the majority of these infiltrates consist of CD4+ T cells and a large population of infiltrating cells are LC3, ATG5 and ULK positive, additional double stainings for various cell markers would be informative to validate that indeed the T cells stain positive for these markers, and assess autophagy in other cell types at the site of inflammation.
One limitation of the present study is that the RA patients and controls are not age and gender matched. Our analyses indicate that autophagy is not correlated with gender or age when assessed in separate cohorts (Supplementary Fig. 2). However, as these correlation analyses are performed on groups of 12 and 34 samples, this sample size is limited.
A crucial point for our observations is that it pertains to experienced, activated T cells in vivo. It was recently reported that the expression of autophagy genes was lower in CD4+ T cells from RA patients compared to healthy controls [13]. Importantly, in contrast to our experimental setup in which freshly drawn total CD4+ cells were measured, Yang and colleagues used only naïve CD4+ T cells that were activated for 48 hour in vitro. This difference in cell populations and activation status is likely responsible for the difference between both studies. Similar differences between results from ex vivo and in vitro experiments have also been described for apoptosis resistance in RA [14].
Interestingly, HCQ is already being used in the clinic to treat various autoimmune diseases including RA [15]. Although HCQ treatment has shown to be beneficial for RA patients, HCQ treatment was demonstrated to only modestly reduce disease scores and only in a subpopulation of RA patients [15]. This discrepancy might be the result of the heterogeneity of the effectors of this disease, where T cells may play a more prominent role in the early phases of disease and autophagy inhibition might have adverse effects on other immune cells. In addition, the mice that we treated in the CIA experiment received a 4-12 times higher dose than the therapeutic dose in patients [16]. In addition, extrapolation of experimental mouse disease models to the human situation has certainly to be made with caution.
Collectively, our data support the concept that autophagy plays an important role in the pathogenesis of RA by providing inflammatory pathogenic T cells with energy and substrates to survive longer and perhaps to resist to therapy. Consequently, the present findings also provide a conceptual framework for therapeutic efforts with alternative approaches aimed at modulating autophagy in RA.
Materials and methods
Autophagy detection
Fluorescence-activated cell sorting
Autophagy was assessed as described previously [9]. In short, PBMCs were cultured in the presence or absence of hydroxychloroquine (HCQ) for 18 hours. Subsequently, cells were stained with Cyto-ID autophagy detection kit (Enzo Life Sciences, Farmingdale, NY) according to the manufacturer's protocol. Here, cells were washed twice and stained with the autophagy specific dye diluted in supplemented culture medium (1:500) at 37°C for 30 minutes. Cells were washed 3 times and analyzed directly by flow cytometry.
Microscopy
Cells were FACS-sorted based on SSC/FSC scattering and CD4+ expression using the ARIA II from Benson Dickinson. CD4+ T cells were stained with the Cyto-ID autophagy detection kit as described above. Cells were then mounted on a coverslip and analysed using a Zeiss LSM 710 confocal microscope (Carl Zeiss) as described previously [17].
Western blot
Western blot analysis was performed as described previously [18]. Cells were FACS-sorted based on SSC/FSC scattering and CD4+ expression using the ARIA II from Benson Dickinson. Sorted CD4+ T cells were lysed in Laemmli buffer (0.12M Tris-HCL, pH 6.8, 4% SDS, 20% glycerol) and boiled for 5 minutes, and the protein concentration was determined. Equal amounts of sample were analyzed by SDS-PAGE, electrophoretically transferred to polyvinylidene difluoride membrane (Millipore), and probed with the respective antibodies. Immune complexes were detected using enhanced chemoluminescence (GE Healthcare).
Histology
Histological analysis was performed as described previously [19]. Knee and paw joints from control and CIA mice were harvested. The joints were fixed in 10% zinc-buffered formalin (Z-Fix; Anatech, Battle Creek, MI) for 24 hours, decalcified in TBD-2 (Shandon, Pittsburgh, PA) for 48 hours, followed by paraffin embedding. Serial sections (4 μm) were cut, and stained with Safranin O-fast green.
Patient material
Peripheral blood was obtained from healthy donors (n=14) under the TSRI Normal Blood Donor Program (IRB-105-611). RA samples were obtained from 34 RA patients (Supplementary Table 1). All protocols were approved by the Scripps and Sanford-Burnham Human Subjects Committees. Human lymphocytes were prepared from heparinized blood using a Ficoll gradient (GE Healthcare, Piscataway, NJ) followed by washing with buffered saline. All samples were frozen in freezing medium containing 19% FCS and 10% DMSO to assure that all samples could be analyzed simultaneously. All samples were collected in compliance to the Declaration of Helsinki.
Immunohistochemistry
Immunohistochemistry analysis of CD4, LC3, ATG5 and ULK1 was performed as previously described [20]. Paraffin-embedded samples were first deparaffinized in the xylene substitute Pro-Par Clearant (Anatech, Battle Creek, MI) and rehydrated in graded ethanol and water. After washing with phosphate buffered saline (PBS), sections were treated with 3% hydrogen peroxide for 10 minutes, washed with PBS and sections were blocked with 5% serum for 30 minutes at room temperature. Primary antibodies (1:100 dilution) were applied and incubated overnight at 4°C. Slides were washed, and sections were incubated with the secondary antibody for 30 minutes at room temperature, and then incubated using the Vectastain ABC-AP kit (Vector Laboratories, Burlingame, CA) for 30 minutes.
Activation and proliferation assay
Human sorted live CD4+ T cells were cultured in the presence of anti-CD3/28 coated beads for 48 hours (mild activation 1 bead/5 cells, strong activation 3 beads/1 cell). Autophagosomes were assessed utilizing the cyto-ID detection kit as described above.
Mouse CD4+CD25− T cells were FACS-sorted from the spleen of wild type or CD4-cre/ATG5-flox mice and cultured in the presence of 1ug/ul coated anti-CD3 and antigen presenting cells (1:1 ratio) for 24 hours and CD25 expression was analyzed by flow cytometry
Mouse CD4+CD25− T cells were FACS-sorted from the spleen of wild type or CD4-cre/ATG5-flox mice, CFSE stained, and cultured in the presence of 1ug/ul coated anti-CD3 and antigen presenting cells (1:1 ratio) for 72 hour. Proliferation was determined by CFSE dilution.
Apoptosis assay
Sorted live CD4+ T cells from healthy controls and RA patients were cultured in the presence of 200 ng/ml doxorubicin, 500 ng/ml anti-CD95, or starvation (0.05% serum) conditions for 48 hours. Apoptosis was determined by Annexin V and PI staining according to the manufacturer's protocol (Becton Dickinson). When gated on all cells, Annexin V and PI negative cells were considered as living. No significant changes in total cell numbers were observed.
Collagen induced arthritis
Arthritis was induced exactly as described by Bevaart et al. [11]. Here male DBA/1 mice were used (5 per group). The experiment was performed twice with comparable results. All animal studies were approved by the Scripps Institutional Animal Care and Use Committee.
Statistical analysis
Hypotheses were tested with 2-tailed t tests in single pairwise comparisons or multiple orthogonal comparisons. ANOVA post hoc tests were used for correction of multiple nonorthogonal comparisons: Dunnett's when multiple conditions were tested against a single control condition; Sidak's when a subset of conditions was selected for pairwise comparisons; and Tukey's when all possible combinations were tested. One-sample 2-tailed t tests were used for comparisons against a fixed value (100%). Dependent samples were analyzed with paired t tests or repeated-measures ANOVA. P values, calculated with Prism (GraphPad, San Diego, CA), are coded by asterisks: <0.05 (*). Statistical difference in Fig 1D, was calculated based on its Poisson distribution as previously described [9].
Supplementary Material
Acknowledgements
J.v.L. is supported by the Dutch Arthritis Foundation and The Netherlands Organization for Scientific Research (NWO). R.S. and M.R. are partially supported by the Bartman Foundation. M.L. is supported by the National Institutes of Health (NIH) (grant no. AG007996). Grant support from NMRC (NMRC/STaR/020/2013, NMRC/MOHIAFCAT2/005/2015, MOHIAFCAT2001, CIRg13nov032 and NMRC MOHIAFCAT1-6003 Grant), Duke-NUS and BMRC (SPF2014/005) is gratefully acknowledged.
Footnotes
Conflict of interest disclosure
The authors declare no commercial or financial conflict of interest.
References
- 1.Scott DL, Wolfe F, Huizinga TWJ. Rheumatoid arthritis. Lancet. 2010;376:1094–108. doi: 10.1016/S0140-6736(10)60826-4. [DOI] [PubMed] [Google Scholar]
- 2.Pope RM. Apoptosis as a therapeutic tool in rheumatoid arthritis. Nat. Rev. Immunol. 2002;2:527–35. doi: 10.1038/nri846. [DOI] [PubMed] [Google Scholar]
- 3.Liu H, Pope RM. The role of apoptosis in rheumatoid arthritis. Curr. Opin. Pharmacol. 2003;3:317–22. doi: 10.1016/s1471-4892(03)00037-7. [DOI] [PubMed] [Google Scholar]
- 4.Eggleton P, Harries LW, Alberigo G, Wordsworth P, Viner N, Haigh R, Donnelly S, et al. Changes in apoptotic gene expression in lymphocytes from rheumatoid arthritis and systemic lupus erythematosus patients compared with healthy lymphocytes. J. Clin. Immunol. 2010;30:649–58. doi: 10.1007/s10875-010-9429-y. [DOI] [PubMed] [Google Scholar]
- 5.Klionsky DJ, Emr SD. Autophagy as a regulated pathway of cellular degradation. Science. 2000;290:1717–21. doi: 10.1126/science.290.5497.1717. [DOI] [PMC free article] [PubMed] [Google Scholar]
- 6.Lum JJ, Bauer DE, Kong M, Harris MH, Li C, Lindsten T, Thompson CB. Growth factor regulation of autophagy and cell survival in the absence of apoptosis. Cell. 2005;120:237–48. doi: 10.1016/j.cell.2004.11.046. [DOI] [PubMed] [Google Scholar]
- 7.Levine B, Mizushima N, Virgin HW. Autophagy in immunity and inflammation. Nature. 2011;469:323–35. doi: 10.1038/nature09782. [DOI] [PMC free article] [PubMed] [Google Scholar]
- 8.Pua HH, Dzhagalov I, Chuck M, Mizushima N, He Y-W. A critical role for the autophagy gene Atg5 in T cell survival and proliferation. J. Exp. Med. 2007;204:25–31. doi: 10.1084/jem.20061303. [DOI] [PMC free article] [PubMed] [Google Scholar]
- 9.van Loosdregt J, Spreafico R, Rossetti M, Prakken BJ, Lotz M, Albani S. Hydroxychloroquine preferentially induces apoptosis of CD45RO+ effector T cells by inhibiting autophagy: a possible mechanism for therapeutic modulation of T cells. J. Allergy Clin. Immunol. 2013;131:1443–6. e1. doi: 10.1016/j.jaci.2013.02.026. [DOI] [PMC free article] [PubMed] [Google Scholar]
- 10.Oeste CL, Seco E, Patton WF, Boya P, Pérez-Sala D. Interactions between autophagic and endo-lysosomal markers in endothelial cells. Histochem. Cell Biol. 2013;139:659–70. doi: 10.1007/s00418-012-1057-6. [DOI] [PubMed] [Google Scholar]
- 11.Bevaart L, Vervoordeldonk MJ, Tak PP. Collagen-induced arthritis in mice. Methods Mol. Biol. 2010;602:181–92. doi: 10.1007/978-1-60761-058-8_11. [DOI] [PubMed] [Google Scholar]
- 12.Lin N-Y, Beyer C, Giessl A, Kireva T, Scholtysek C, Uderhardt S, Munoz LE, et al. Autophagy regulates TNFα-mediated joint destruction in experimental arthritis. Ann. Rheum. Dis. 2013;72:761–8. doi: 10.1136/annrheumdis-2012-201671. [DOI] [PubMed] [Google Scholar]
- 13.Yang Z, Fujii H, Mohan S V, Goronzy JJ, Weyand CM. Phosphofructokinase deficiency impairs ATP generation, autophagy, and redox balance in rheumatoid arthritis T cells. J. Exp. Med. 2013;210:2119–34. doi: 10.1084/jem.20130252. [DOI] [PMC free article] [PubMed] [Google Scholar]
- 14.Peng SL. Fas (CD95)-related apoptosis and rheumatoid arthritis. Rheumatology (Oxford) 2006;45:26–30. doi: 10.1093/rheumatology/kei113. [DOI] [PubMed] [Google Scholar]
- 15.Ben-Zvi I, Kivity S, Langevitz P, Shoenfeld Y. Hydroxychloroquine: from malaria to autoimmunity. Clin. Rev. Allergy Immunol. 2012;42:145–53. doi: 10.1007/s12016-010-8243-x. [DOI] [PMC free article] [PubMed] [Google Scholar]
- 16.Munster T, Gibbs JP, Shen D, Baethge BA, Botstein GR, Caldwell J, Dietz F, et al. Hydroxychloroquine concentration-response relationships in patients with rheumatoid arthritis. Arthritis Rheum. 2002;46:1460–9. doi: 10.1002/art.10307. [DOI] [PubMed] [Google Scholar]
- 17.van Loosdregt J, Fleskens V, Fu J, Brenkman AB, Bekker CPJ, Pals CEGM, Meerding J, et al. Stabilization of the Transcription Factor Foxp3 by the Deubiquitinase USP7 Increases Treg-Cell-Suppressive Capacity. Immunity. 2013;39:259–271. doi: 10.1016/j.immuni.2013.05.018. [DOI] [PMC free article] [PubMed] [Google Scholar]
- 18.van Loosdregt J, Vercoulen Y, Guichelaar T, Gent YYJ, Beekman JM, van Beekum O, Brenkman AB, et al. Regulation of Treg functionality by acetylation- mediated Foxp3 protein stabilization. Blood. 2010;115:965–74. doi: 10.1182/blood-2009-02-207118. [DOI] [PubMed] [Google Scholar]
- 19.Caramés B, Hasegawa A, Taniguchi N, Miyaki S, Blanco FJ, Lotz M. Autophagy activation by rapamycin reduces severity of experimental osteoarthritis. Ann. Rheum. Dis. 2012;71:575–81. doi: 10.1136/annrheumdis-2011-200557. [DOI] [PMC free article] [PubMed] [Google Scholar]
- 20.Caramés B, Taniguchi N, Seino D, Blanco FJ, D'Lima D, Lotz M. Mechanical injury suppresses autophagy regulators and pharmacologic activation of autophagy results in chondroprotection. Arthritis Rheum. 2012;64:1182–92. doi: 10.1002/art.33444. [DOI] [PMC free article] [PubMed] [Google Scholar]
Associated Data
This section collects any data citations, data availability statements, or supplementary materials included in this article.


