Abstract
Despite great promise, combining anti-angiogenic and conventional anti-cancer drugs has produced limited therapeutic benefit in clinical trials, presumably because mechanisms of anti-angiogenic tissue response remain only partially understood. Here we define a new paradigm, in which anti-angiogenic drugs can be used to chemosensitize tumors by targeting the endothelial acid sphingomyelinase (ASMase) signal transduction pathway. We demonstrate that paclitaxel and etoposide, but not cisplatin, confer ASMase-mediated endothelial injury within minutes. This rapid reaction is required for human HCT-116 colon cancer xenograft complete response and growth delay. Whereas VEGF inhibits ASMase, anti-VEGFR2 antibodies de-repress ASMase, enhancing endothelial apoptosis and drug-induced tumor response in asmase+/+, but not in asmase−/−, hosts. Such chemosensitization occurs only if the anti-angiogenic drug is delivered 1–2 hours before chemotherapy, but at no other time prior to or post chemotherapy. Our studies suggest that precisely-timed administration of anti-angiogenic drugs in combination with ASMase-targeting anti-cancer drugs is likely to optimize anti-tumor effects of systemic chemotherapy. This strategy warrants evaluation in future clinical trials.
Keywords: Chemotherapy, Endothelial cells, Anti-angiogenic drugs, Acid sphingomyelinase, Ceramide-rich macrodomains
1. Introduction
The ASMase signaling pathway is a cell membrane stress response [1] involving a specialized secretory isoform of ASMase enriched in endothelial cells 20-fold more than in any other mammalian cell type [2]. Inactive enzyme, stored in cytoplasmic secretory vesicles, translocates precipitously upon physiologic or pathologic stress onto the exophytic plasma membrane layer [1], where it rapidly hydrolyzes sphingomyelin to generate the pro-apoptotic second messenger ceramide [1]. Cell surface ceramide spontaneously coalesces, forming 1–5 micron ceramide-rich macrodomains (CRMs), which serve to cluster signaling molecules to promote transmembrane signaling of apoptotic death. Substantive pre-clinical evidence links endothelial ASMase signaling and induced vascular dysfunction to parenchymal tumor cell injury, which in turn plays a fundamental role in tumor eradication by single dose radiotherapy (SDRT) [3–5]. Critically, while VEGF inhibits ASMase activation, conferring radioresistance, inhibition of VEGF signaling de-represses ASMase, increasing radiosensitivity [5, 6]. ASMase de-repression is transient (for 1–2 hours), presumably because of system counter-regulation. Accordingly, radiosensitization of tumors via ASMase occurs only if anti-angiogenic reagents are provided within 1–2 hours prior to irradiation [5, 6]. Furthermore, prolonged anti-angiogenesis renders ASMase refractory to a subsequent round of anti-VEGF de-repression, sustained until decay of the anti-angiogenic effect re-sets ASMase sensitivity.
Here we explore whether endothelial ASMase signaling constitutes a target for anti-angiogenic chemosensitization in tumors treated with conventional anti-cancer drugs. Anti-angiogenic tumor effects have been extensively explored, conceptualized to either normalize dysfunctional tumor vasculature or to prevent recruitment of circulating endothelial precursors into tumor, aborting hypoxia-driven VEGF-mediated tumor revascularization [7, 8]. These paradigms have dictated the mode of delivery of anti-angiogenic drugs in combination with chemotherapy. Thus, clinical trials invariably have been designed to generate strong anti-angiogenesis irrespective of chemotherapeutic scheduling [9]. Such application protocols do not parallel the time-restricted application of anti-angiogenic drugs necessary for ASMase de-repression. Our data inidcate that synchronized delivery of anti-angiogenic drugs and chemotherapy to de-repress ASMase is required to optimally chemosensitize tumor response in pre-clinical models.
2. Materials and Methods
2.1. Endothelial cell cultures
Bovine Aortic Endothelial Cells (BAEC) were established from the intima of bovine aorta as described [10]. Stock cultures were grown in 100-mm culture dishes in Dulbecco's modified Eagle's medium (DMEM) supplemented with glucose (1 g/liter), 5% heat-inactivated calf serum (CS), penicillin (50 units/ml), and streptomycin (50 µg/ml). Purified human recombinant fibroblast growth factor (bFGF) (1 ng/ml; R&D Systems, Inc., Minneapolis, MN) was added every other day during the phase of exponential growth. After 8–10 days in culture, cells reach confluence and exhibit features of contact-inhibited monolayers. These plateau phase cells were either used for experiments, or further sub-cultured (up to a maximum of 10 times) at a split ratio of 1:8. For sub-culturing, monolayers were dissociated with STV (0.05% trypsin and 0.02% EDTA in PBS) for 2–3 min at 22°C, washed twice in 5% CS-DMEM, and resuspended in DMEM with supplements as above. These mild conditions of trypsinization were sufficient to detach cells but not injure, stimulate, or affect cell functions in a detectable way. Cultures of BAEC were maintained at 37°C in 10% CO2 humidified incubators.
Human coronary artery endothelial cells (HCAEC) were obtained from Clonetics™ Coronary Artery Endothelial Cell Systems (Cambrex Bio Science Inc.). For culturing and sub-culturing of HCAEC, Clonetics cell system components were used: EBM®-2, Endothelial cell Basal Medium-2 with addition of Clonetics EGM-2-MV SingleQuots containing growth supplements (Cambrex) and 50 mg/ml endothelial mitogen (ECGF) (Biomedical Technologies, Inc.). For sub-culturing, monolayers were dissociated with Clonetics® Trypsin/EDTA solution for 2–3 min at 22°C at a split ratio of 1:4 to expand the cell population for experiments. HCAEC cultures were maintained at 37°C in 5% CO2 humidified incubators.
2.2. Apoptosis (In Vitro)
Apoptosis was assessed in vitro by examining morphologic changes in nuclear chromatin. Cells were fixed with 2% paraformaldehyde, washed with PBS and stained with 100 ml of 24 µg/ml bis-benzimide trihydrochloride solution (Hoechst #33258; Sigma-Aldrich, Milwaukee WI) for 10 min. Morphologic changes of nuclear apoptosis including chromatin condensation, segmentation and compaction along the periphery of the nucleus, or appearance of apoptotic bodies were quantified using an Axiovert 200 M Zeiss fluorescence microscope as per [11].
2.3. Ceramide Quantitation
After treatment with either chemotherapeutic or anti-angiogenic drug, cells were placed on ice, washed with cold PBS, and lipids extracted by addition of scraped cells in methanol to an equal volume of chloroform and 0.6 volume of buffered saline/EDTA solution (135 mM NaCl, 4.5 mM KCl, 1.5 mM CaCl2, 0.5 mM MgCl2, 5.6 mM glucose, 10 mM HEPES pH 7.2, 10 mM EDTA). Ceramide level was measured via the Diacylglycerol Kinase reaction, as described [11]. For in vivo ceramide quantification, blood samples were collected from mice at different time points following treatment. Serum was immediately extracted from blood samples by centrifugation and shipped overnight on dry ice to the Lipidomics Shared Resource Facility (Medical University of South Carolina, Charleston, SC, USA) for mass spectrometry (MS) analysis. After extraction, sphingolipids were separated by high performance liquid chromatography, introduced to the electrospray ionization source and then analyzed by double MS using TSQ 7000 triple quadrupole mass spectrometer (Thermo-Fisher Scientific) as described previously [12].
2.4. ASMase Activity Assay
ASMase Activity was quantified using a radioenzymatic assay with [14C-methylcholine] sphingomyelin (Perkin Elmer)[13]. Cell lysates or mice serum samples were incubated with [14C-methylcholine]-sphingomyelin substrate (0.026 mCi/9.5 nmol) in 250 mM sodium acetate, pH 5.0 supplemented with 0.1% Triton X-100 and 1 mM EDTA or 0.1 mM ZnCl. Reactions were terminated after 1 hour with CHCl3:MeOH:1N HCl (100:100:1, v/v/v), and product within the aqueous following Folch extraction was quantified by a Beckman Packard 2200 CA Tricarb scintillation counter.
2.5. CRM detection by confocal microscopy
BAEC were grown on CC2-treated chamber slides (Nalgene, Nunc International Corp., Naperville, USA) and then exposed to etoposide or paclitaxel with or without pre-incubation with nystatin (30 µg/ml, Sigma) for 30 min. BAEC were then washed in cold PBS, fixed for 15 min in fresh-made 2% paraformaldehyde, washed 2× with cold PBS, and blocked with 5% FBS in PBS for 20 min at room temperature. Cells were stained with primary Ab to ceramide, MID 15B4 IgM (1:50 dilution) (Alexis Biochemicals Corporation) for 1 hour at room temperature, washed 3× in PBS, and stained with Texas Red-conjugated secondary antibody (Jackson Immunoresearch Laboratories, Inc.) at 1:500 dilution for 1 hour at room temperature. Nonspecific fluorescence was excluded using isotope control IgM (BD Biosciences). Cells were washed 3×, stained with DAPI and mounted in 0.1% paraphenylenediamine. Fluorescence was detected using a Leica TCS SP2 AOBS 1- and 2-photon laser scanning confocal (DMRXA2 upright stand) microscope. Number of CRMs in membranes of endothelial cells was analyzed using MetaMorph 7.5 software that allowed outlining of regions containing CRMs based on two criteria: 1) CRM size (≥500 nm); 2) Intensity of ceramide staining - a minimal intensity that is considered to be a positive signal for ceramide detection compared to control. CRMs determined by these two criteria were counted in the membrane area and divided by total number of nuclei per image to obtain average number of CRMs per cell. Data are also presented as an integrated intensity of CRMs = ceramide intensity (above background) multiplied by area for each CRM.
2.6. Mice
The asmase+/+ and asmase−/− mice maintained in a SCID background were propagated using heterozygous breeding pairs and genotyped as described [14]. The 6–12 week-old C57BL6/SV129 male mice were purchased from The Jackson Laboratory (Bar Harbor) and were housed at the animal core facility of Memorial Sloan-Kettering Cancer Center. This facility is approved by the American Association for Accreditation of Laboratory Animal Care and is maintained in accordance with the regulations and standards of the United States Department of Agriculture and the Department of Health and Human Services.
2.7. Tumor Models
Human colon tumor (HCT-116) cells were maintained in DMEM containing 10% fetal bovine serum, 100 µg/ml penicillin and 100 µg/ml streptomycin. Cells were grown as monolayers in 75-cm2 culture flasks at 37°C in 5% CO2 humidified incubators. Cells were trypsinized, washed in PBS and diluted in Matrigel/PBS solution (40:60 v/v) for HCT-116 xenografts. Cells (3×10⁶) were injected subcutaneously into the flanks of mice as described [15].
2.8. Chemotherapy
SCIDasmase+/+ and SCIDasmase−/− mice bearing HCT-116 tumors were randomized when tumors reached 50–100 mm3 and treated with two 35 mg/kg etoposide (Novaplus®) intra-peritoneal (i.p.) injections followed by one injection of 50 mg/kg etoposide, for a total of three injections on a bi-weekly schedule. Mice bearing HCT-116 xenografts were also treated with three paclitaxel (Hospira) i.p. injections at doses of 15, 20 and 25 mg/kg on a bi-weekly schedule. Once tumors reached 100–150 mm3, one group of mice were treated intravenously (i.v.) with either DC101 (1600 µg, kindly provided by ImClone) or, control IgG at 1 hour preceding chemotherapy treatment. HCT-116 tumor-bearing mice were treated with i.p. cisplatin at doses of 1, 2, 4, 6 mg/kg (APP Pharmaceuticals, LLC) for a total of three injections on a bi-weekly schedule. Animals were excluded from analyses if tumor volume at staging was less than 45 mm3.
2.9. Tumor Growth Studies
Tumor volume, based on caliper measurements, was calculated daily according to the formula of Kim et al [16].
2.10. Apoptosis (In Vivo)
To evaluate acute endothelial apoptosis, tumor samples were rapidly harvested at specified time points and processed as per [3]. The 5 µm paraffin-embedded sections were stained by TUNEL assay or activated Caspase-3 assay and the monoclonal antibody MECA-32 was used to specifically co-stain endothelial cells (Developmental Studies Hybridoma Bank, developed under the auspices of the NICHD and maintained by The University of Iowa, IA).
3. Results
3.1. Chemotherapy induces ceramide generation via ASMase activation
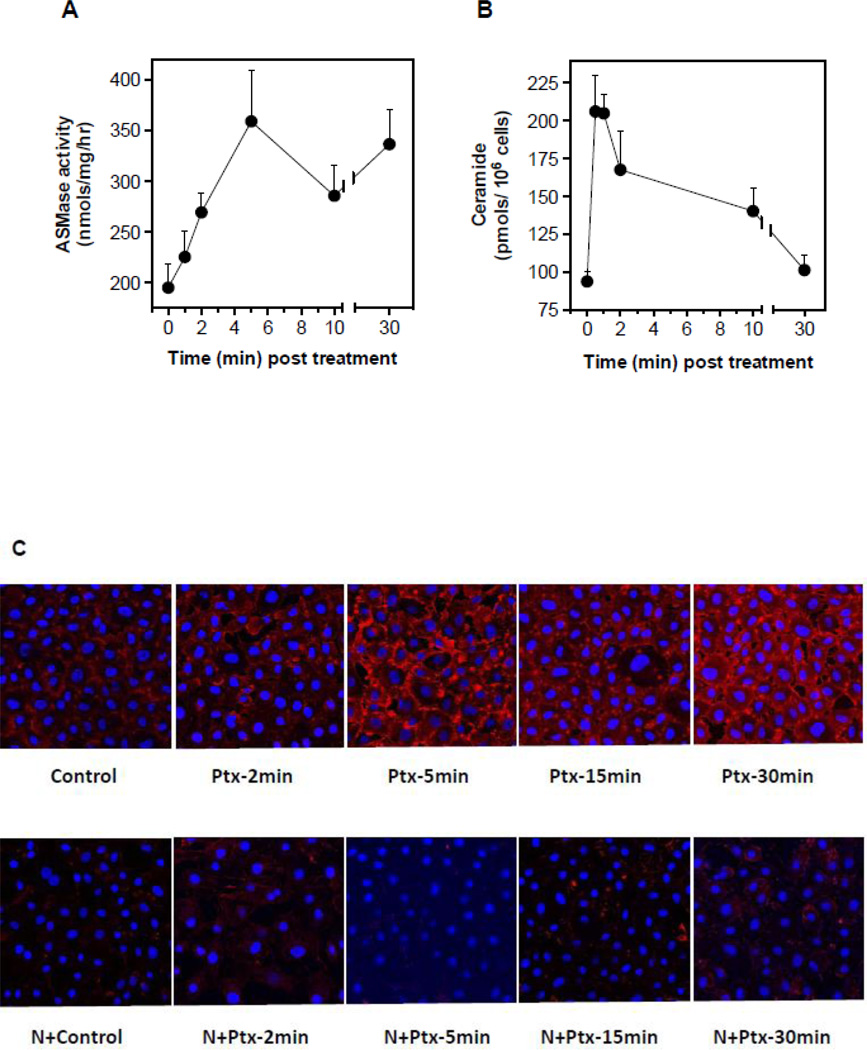
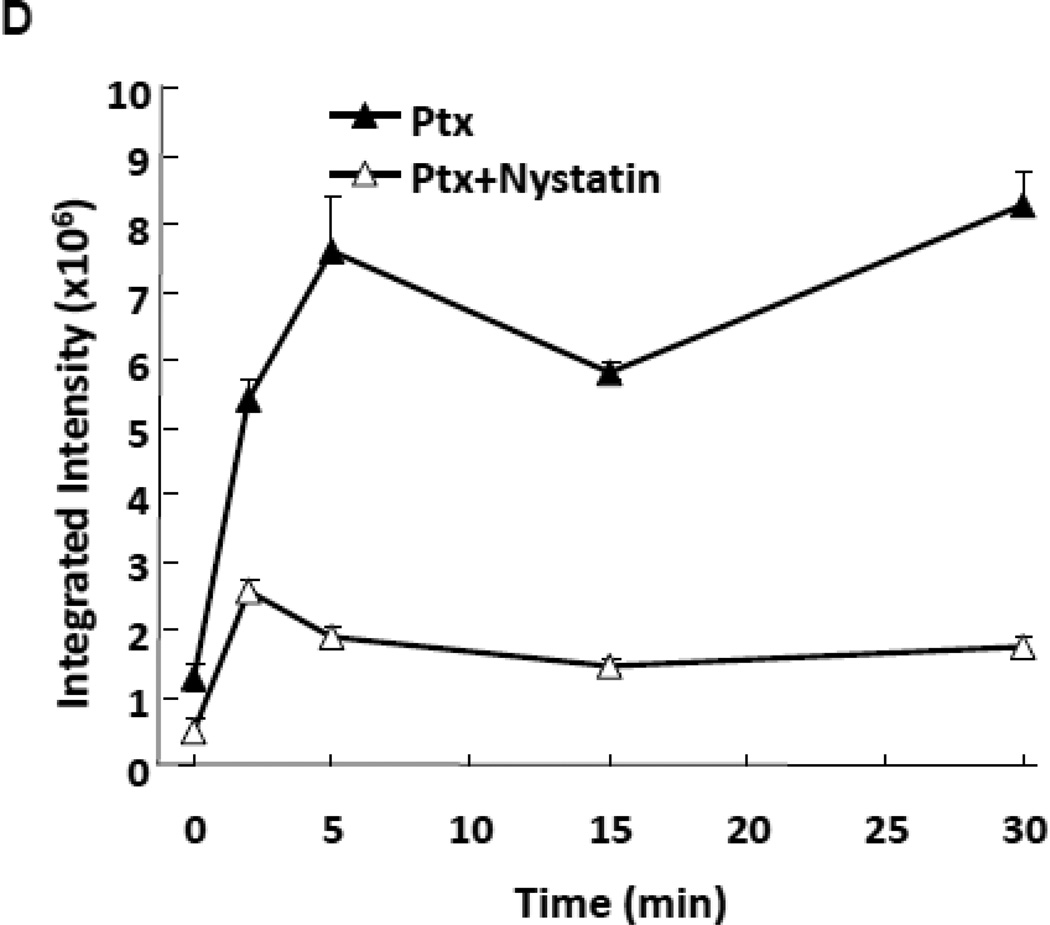
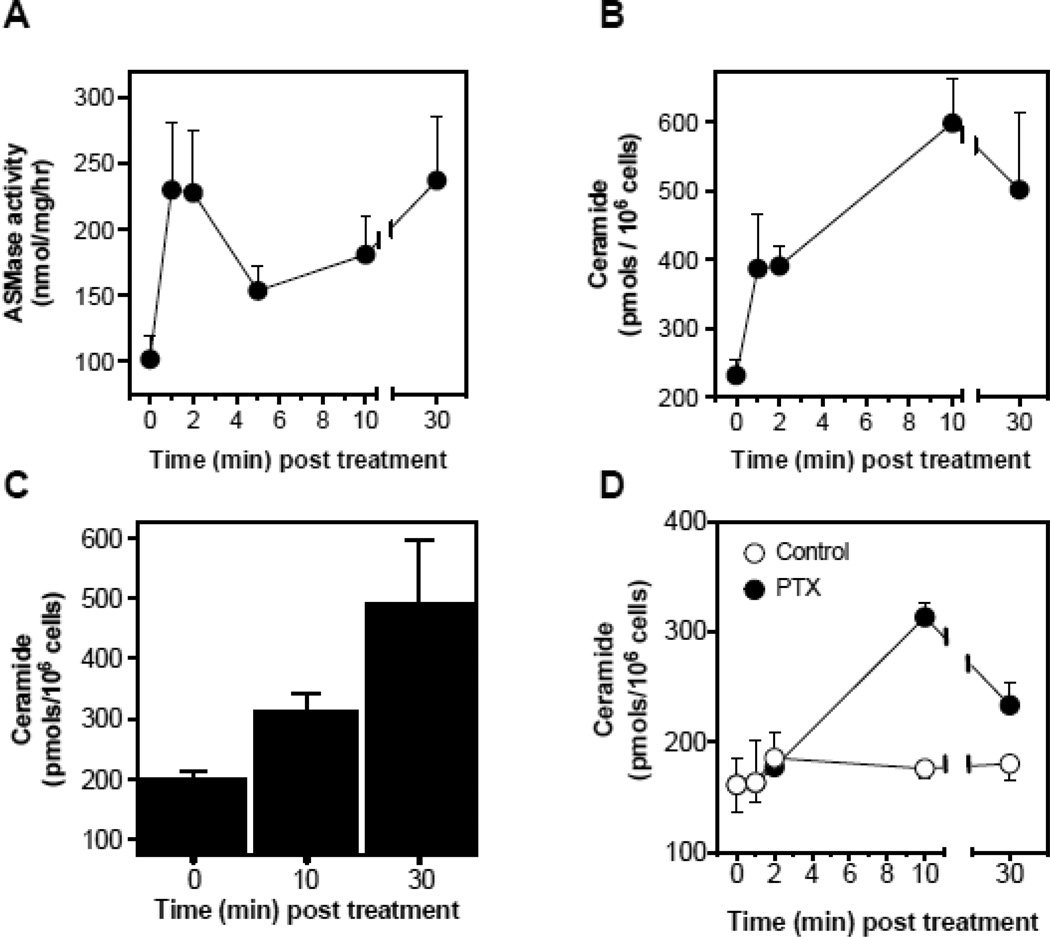
Published reports show that select chemotherapeutic drugs activate ASMase signaling [17, 18], and others cause endothelial cell apoptosis [19], which precedes tumor cell demise. The balance of endothelial cell proliferation and apoptosis is a major determinant in tumor angiogenesis [20]. To test the impact of paclitaxel on ceramide generation in the microvasculature, we treated cultured bovine aortic endothelial cells (BAEC) with paclitaxel (100 nM) and evaluated ASMase activation. Paclitaxel induced ASMase activation by 5 min, with specific activity increasing ~1.8-fold from a baseline of 196±24 to 359±51 nmol/mg/h (p<0.001), an event that persists for 30 min (Fig. 1A). Ceramide generation occurs over the same time frame (Fig. 1B), associated with rapid generation of CRMs. Confocal microscopy images of BAEC monolayers stained with anti-ceramide antibodies, MID 15B4 IgM, (Fig. 1C) detect CRM formation peaking at 5 min (5.8-fold increased signal intensity, p<0.005), which remains elevated for 30 min. In contrast, co-treatment with the cholesterol-depleting agent nystatin, which disrupts sphingomyelin-rich cell surface raft microdomains, thereby inhibiting ASMase targeting of sphingomyelin [21], abrogates CRM formation at all times (p<0.05). Similar responses are observed in BAEC (Fig. 2A,B), and human coronary artery endothelial cells (HCAEC; Fig. 2C) treated with 50 µM etoposide or with 100 nM paclitaxel (Fig. 2D), but not with cisplatin (data not shown). These findings indicate that select chemotherapeutic agents known to target parenchymal tumor DNA (and other non-nuclear targets) also trigger the DNA damage-independent ASMase membranous pathway in endothelial cells.
Figure 1.
ASMase activation and CRMs generation by paclitaxel in cultured endothelium. (A) ASMase activity was quantified in lysates of BAEC at the indicated times after treatment with paclitaxel (100 nM) by radioenzymatic assay using [N-methyl-14C] sphingomyelin as substrate. (B) In parallel, a time-course of ceramide generation was measured using the diacylglycerol kinase assay. (C) BAEC monolayers, exposed to paclitaxel (100 nM) in the absence (upper panel) or presence (lower panel) of 30 µg/mL nystatin (30 min pre-treatment), were co-stained with anti-ceramide antibody (red) and DAPI (blue, to stain nuclei) in order to localize CRMs to plasma membranes by confocal microscopy. (D) The integrated intensity of the CRMs = the sum of the ceramide intensity (above background) multiplied by the area for each CRM. Data (mean±SD) represent triplicate determinations from duplicate experiments each in A, B and D.
Figure 2.
Chemotherapy-induced ASMase activation, ceramide generation and induction of apoptosis in cultured endothelium. (A) In a time-course experiment, ASMase activity was quantified in BAEC after treatment with 50 µM etoposide by radioenzymatic assay using [N-methyl-14C] sphingomyelin as substrate. (B) In parallel, a time-course of ceramide generation in response to etoposide was measured using the diacylglycerol kinase assay in BAEC. (C) Ceramide generation was measured using the diacylglycerol kinase assay at 10 and 30 min after treatment in HCAEC with 50 µM etoposide. (D) Ceramide generation was measured using the diacylglycerol kinase assay at 10 and 30 min after treatment in HCAEC with 100 nM paclitaxel. Data (mean±SD) represent triplicate points from two independent experiments.
3.2. CRM generation signals chemotherapy-induced apoptosis in endothelium
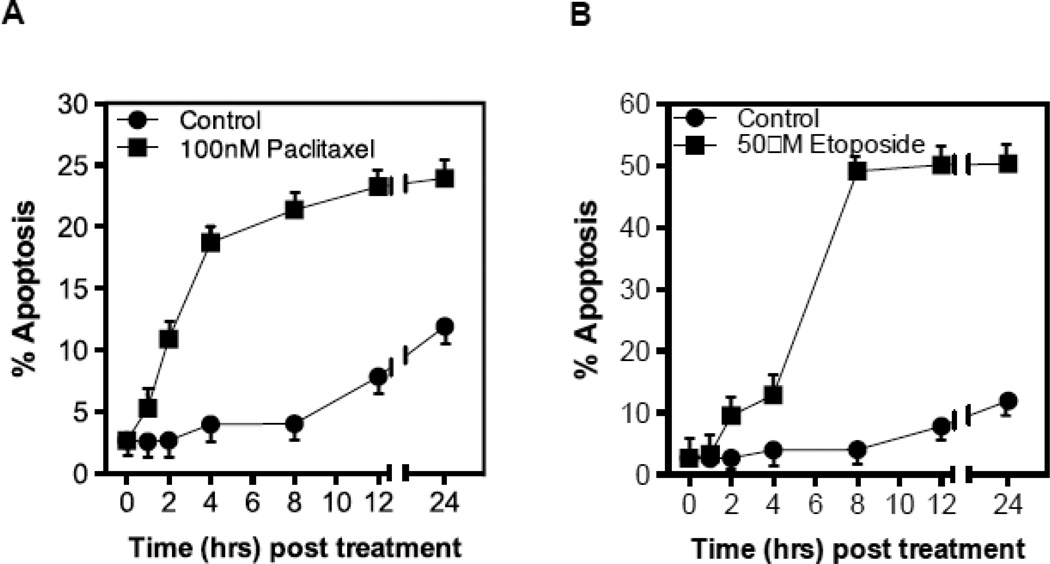
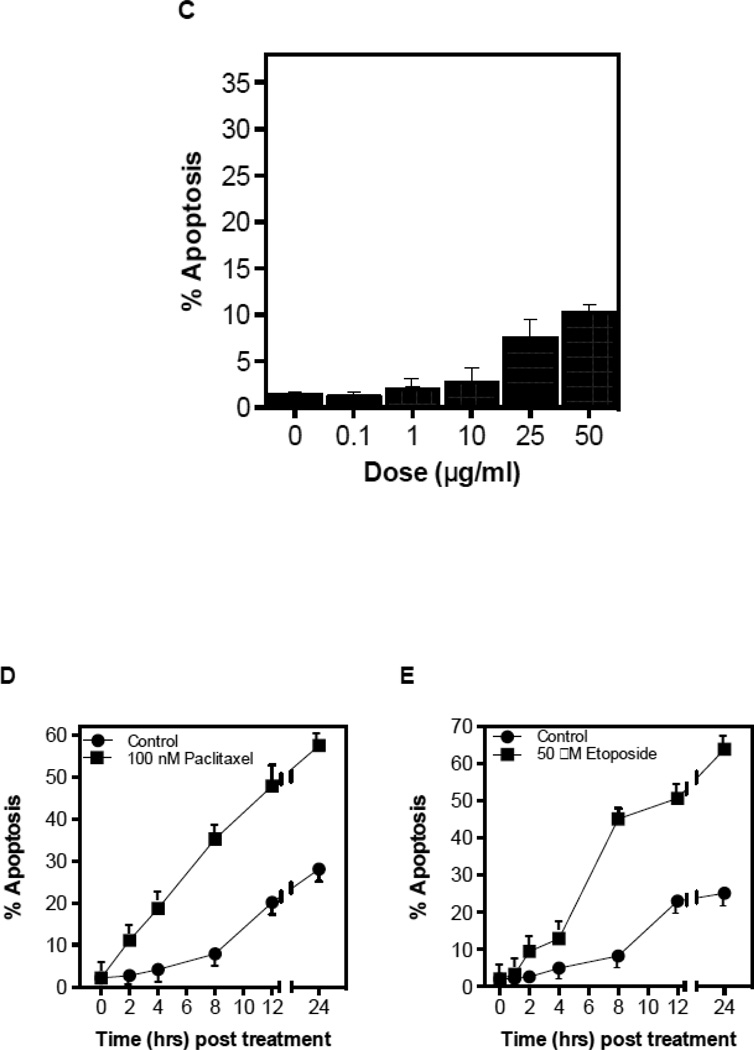
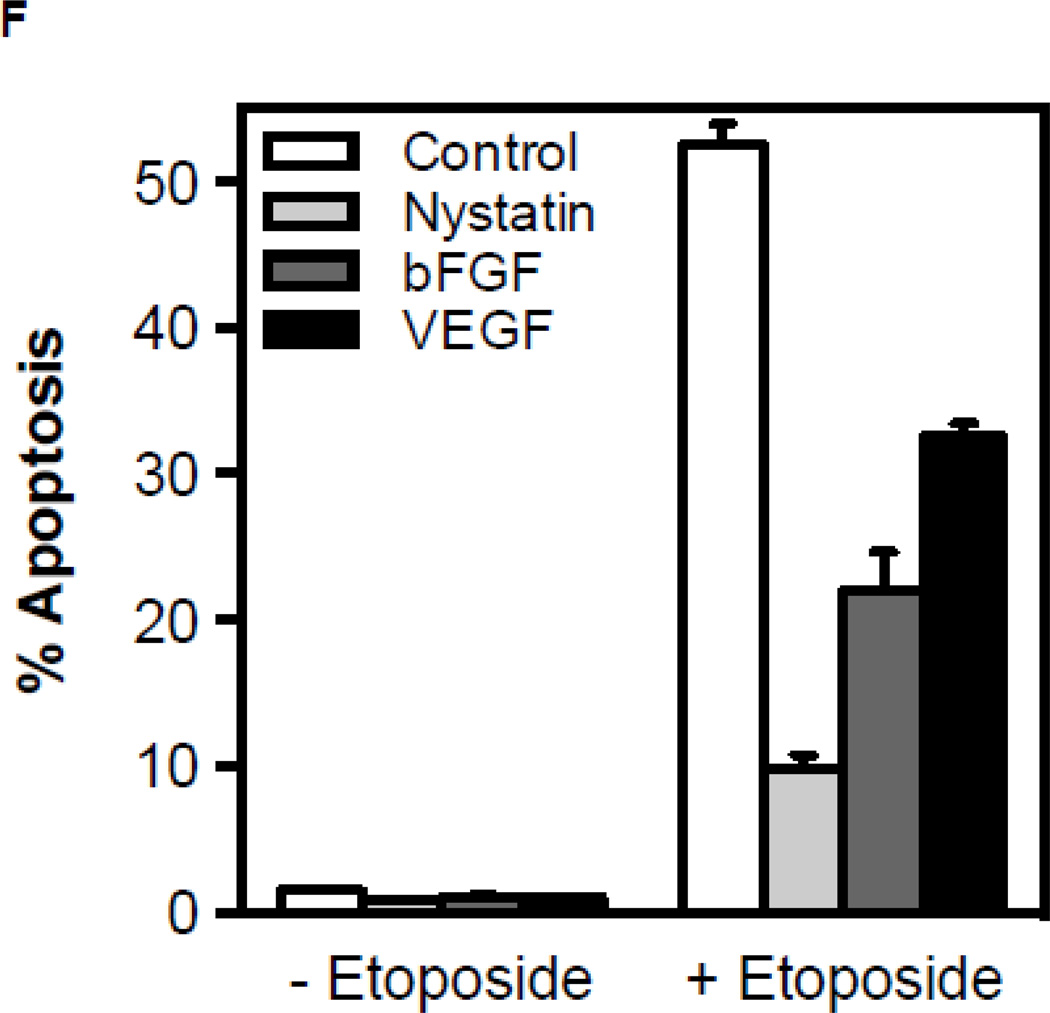
To determine whether chemotherapy-induced ASMase activation in the endothelium coincides with endothelial apoptosis as shown for ionizing radiation in these cells, we measured endothelial apoptosis in vitro and in vivo. Treatment with paclitaxel or etoposide (Figs. 3A,B), but not cisplatin (Fig. 3C), induce rapid apoptosis in BAEC and HCAEC (Fig. 3D,E), beginning as early as 2 hours after drug exposure. Pre-incubation of BAEC with either bFGF (2 ng/ml), VEGF (2 ng/ml), or nystatin (30 µg/ml), all of which prevent CRM generation in endothelium [5, 22, 23], significantly inhibit etoposide-induced apoptosis (Fig. 3F), consistent with the hypothesis that apoptosis is a downstream response on the chemotherapy-induced endothelial ASMase pathway.
Figure 3.
CRM generation signals chemotherapy-induced apoptosis in endothelium. Cultured BAEC were treated with paclitaxel (100 nM) (A) or etoposide (50 µM) (B) and at the indicated times incidence of apoptosis was scored by bis-benzamide trihydrochloride staining. (C) Treatment of BAEC with cisplatin does not lead to endothelial cell dysfunction. BAEC were treated with increasing doses of cisplatin (0.1–50 µM) and apoptosis was detected by bis-benzamide trihydrochloride staining. Paclitaxel and etoposide induce apoptosis in HCAEC. HCAEC were treated with 100 nM paclitaxel (D) or 50 µM etoposide (E) and the incidence of apoptosis was scored at the time points indicated. (F) BAEC were pre-incubated for 30 min with bFGF (2 ng/mL), VEGF (2 ng/mL) or nystatin (30 µg/mL) prior to treatment with etoposide (50 µM), and apoptosis was evaluated after 8 hours. Each value (mean±SD) represents duplicate determinations from three independent experiments.
3.3. Endothelial cell response to chemotherapy is dependent on ASMase activation and ceramide generation in vivo
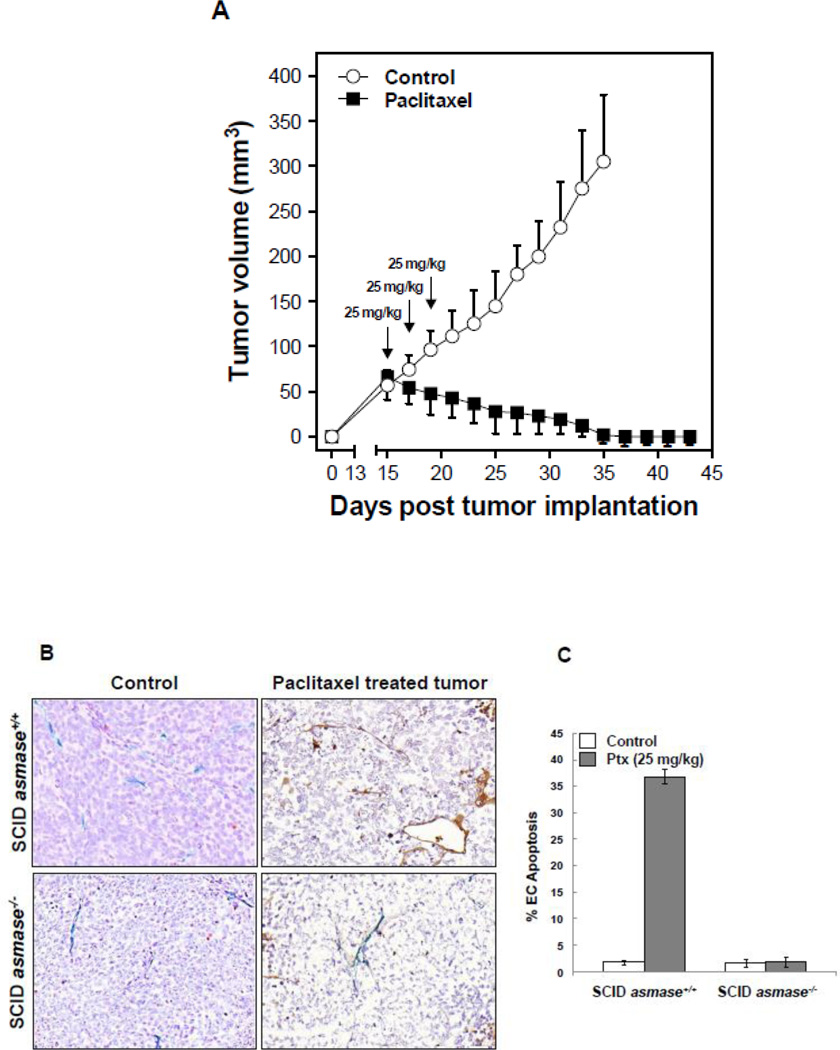
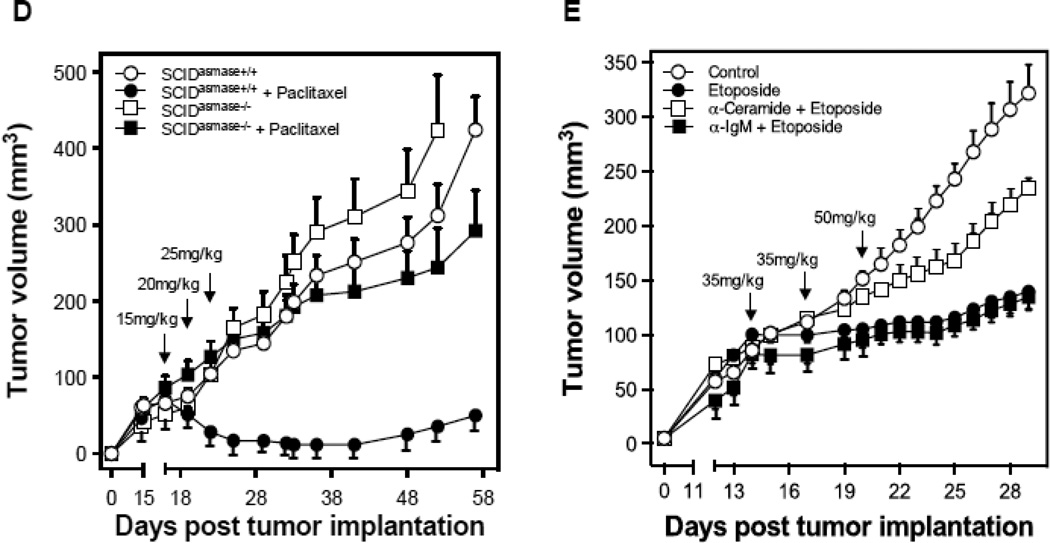
To determine whether tumor response to chemotherapy is dependent on the ASMase/ceramide pathway, we employed the HCT-116 human colorectal cancer xenograft model. Tumors in SCIDasmase+/+ mice, which supply apoptosis-sensitive vasculature, exhibit, upon treatment with a dose of 25 mg/kg paclitaxel, which causes prolonged tumor growth delay (Fig. 4A), rapid endothelial, but not tumor cell, apoptosis (p<0.01 vs. untreated; Fig. 4B,C). This effect was abrogated in tumors in SCIDasmase−/− littermates (p<0.001). Accordingly, HCT-116 xenografts in SCIDasmase+/+ mice treated with a paclitaxel (consecutive 15/20/25 mg/kg q3d) exhibit complete tumor response after 10±1 days, absent in xenografts in SCIDasmase−/− littermates (Fig. 4D; p<0.01).
Figure 4.
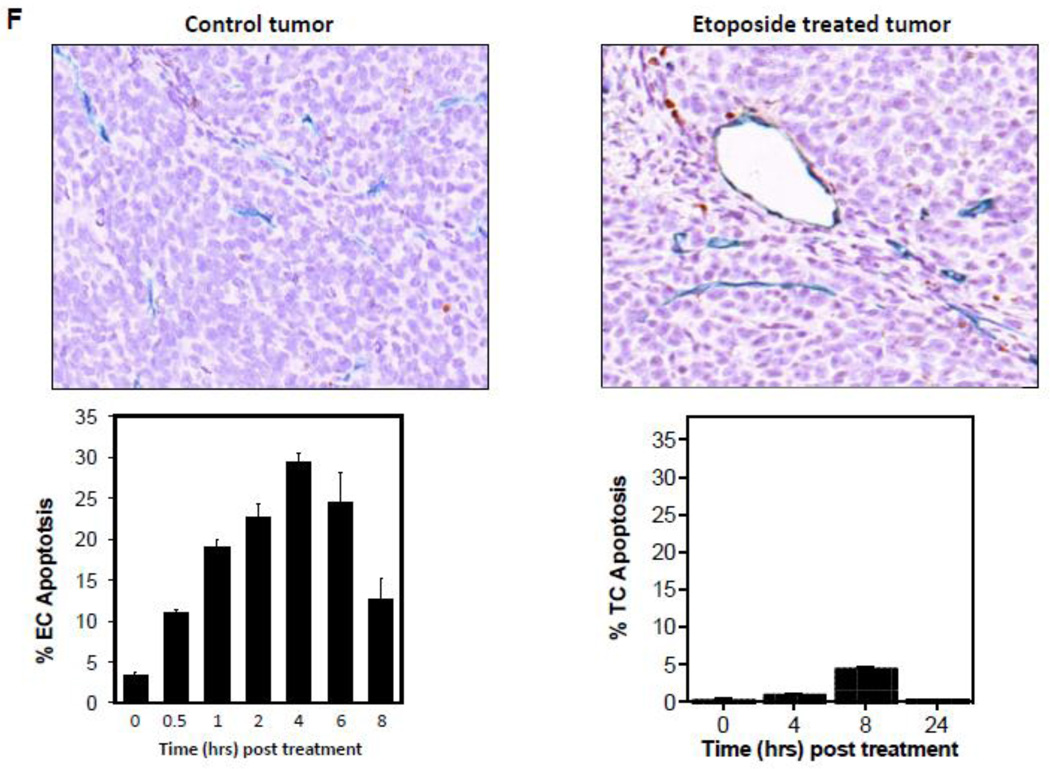
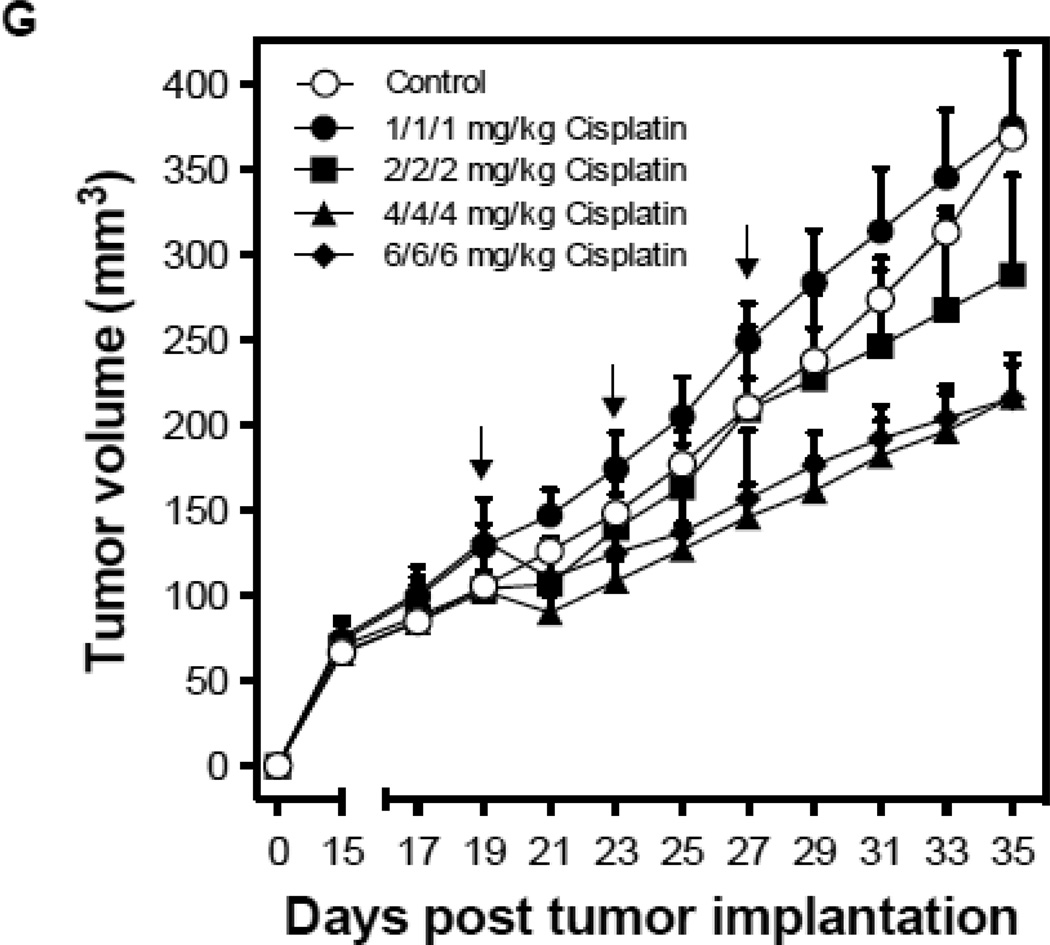
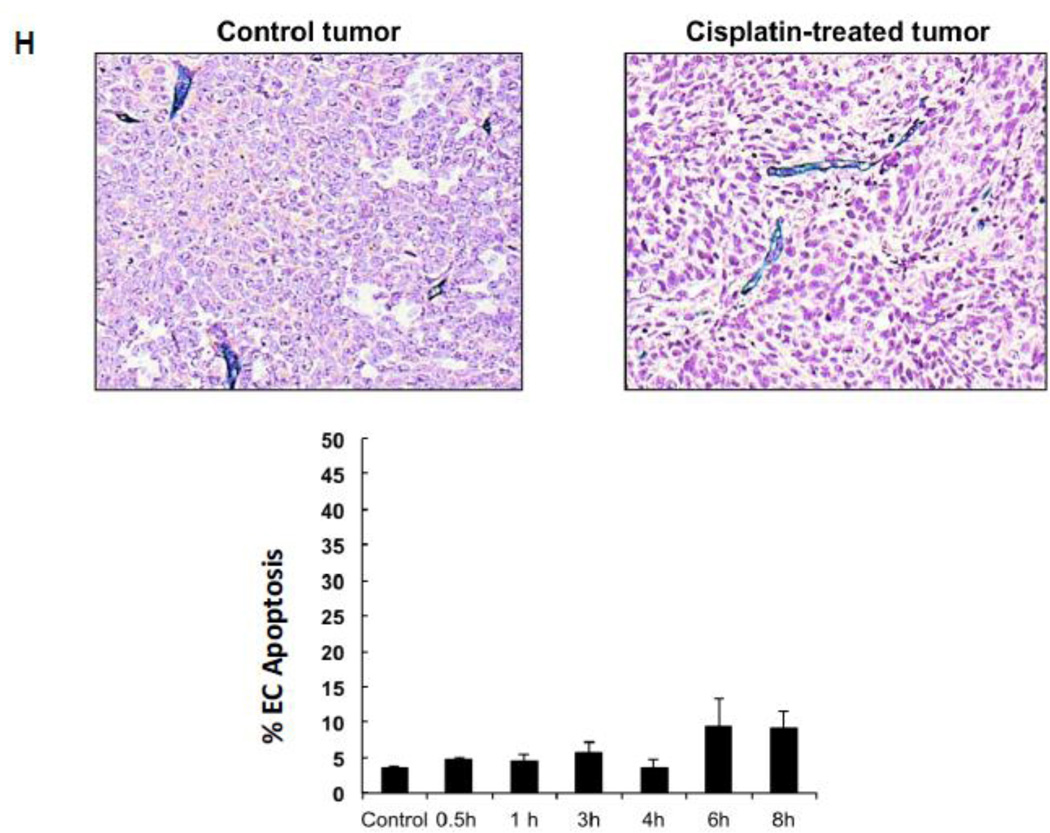
Endothelial cell response to chemotherapy in vivo. (A) Paclitaxel treatment of HCT-116 tumors. 3×10⁶ HCT-116 cells were implanted into the right flank of SCIDasmase+/+ mice. At tumor volumes of 50–70 mm3 mice were treated with paclitaxel (25 mg/kg i.p.) three times. Arrows indicate days of paclitaxel treatment. Data (mean±SD) are collated from 5 mice per group. (B) 3×10⁶ HCT-116 cells were implanted into the right flank of SCIDasmase+/+ or SCIDasmase−/− littermate mice. Fig. 3B shows representative 5-µm histologic tumor sections obtained either from controls (left panel) or at 4 hours after exposure of tumor-bearing mice to a single dose of paclitaxel (25 mg/kg i.p., right panel). Tumors were fixed and double-stained for endothelial surface marker MECA-32 (dark blue plasma membrane) and TUNEL (nuclear red-brown stain). Fig. 4C quantifies endothelial cell apoptosis after single dose paclitaxel. Data (mean±SD) were compiled from 20 fields (400× magnification) from 2–3 tumors. (D) 3×10⁶ HCT-116 cells were implanted into the right flank of SCIDasmase+/+ or SCIDasmase−/− mice. Mice harboring HCT-116 tumors (50–70 mm3) were treated with paclitaxel (15/20/25 mg/kg i.p.) three times biweekly. Arrows indicate days of paclitaxel treatment. Data (mean±SD) are collated from 5 mice per group. (E) SCIDasmase+/+ mice harboring tumors as in (D) were treated with etoposide (35/35/50 mg/kg i.p.) biweekly in the presence of anti-ceramide or isotype control antibody. Arrows indicate days of etoposide treatment. Data (mean±SD) are collated from 5 mice per group. (F) Representative 5 µm-histologic tumor sections, obtained from controls (upper left panel) or 4 hours after exposure to a single dose of etoposide (35 mg/kg i.p., upper right panel), were double-stained for endothelial cell surface marker MECA-32 (blue) and TUNEL (nuclear red-brown stain). Quantification of endothelial (bottom left) and tumor cell (bottom right) apoptosis in HCT-116 tumors occurred at different time points after treatment. Data (mean±SD) were compiled from 20 different fields (400× magnification) at each time point from 2–3 tumors. (G) Lack of cisplatin on HCT-116 tumor growth. 3×10⁶ HCT-116 cells were implanted into the right flank of SCIDasmase+/+ mice and tumor growth measured daily. Mice harboring 50–70 mm3 tumors were treated with 1, 2, 4 or 6 mg/kg cisplatin i.p. three times on a biweekly schedule. Arrows indicate days of treatment. Data (mean±SD) were collated from 5 mice per group. (H) Lack of cisplatin on endothelial apoptosis in HCT-116 tumors. 3×10⁶ HCT-116 cells were implanted into the right flank of SCIDasmase+/+ mice. Representative 5 µm-histologic tumor sections, obtained from controls (upper left panel) or 4 hours after exposure to a single dose of cisplatin (6 mg/kg i.p., upper right panel), were double-stained for endothelial cell surface marker MECA-32 (blue) and TUNEL (nuclear red-brown stain). Quantification of endothelial cell apoptosis in HCT-116 tumors at different time points after treatment as in (bottom center). Data (mean±SD) were compiled from 20 different fields (400× magnification) at each time point from 2–3 tumors.
Etoposide also induced endothelial, but not substantive tumor cell, apoptosis in HCT-116 tumors (Fig. 4F) and conferred statistically significant tumor growth delay (Fig. 4E; 4.6±0.9 mm3/day growth rate after etoposide vs. 15.6±1.6 mm3/day in untreated mice; p<0.05). Both effects were attenuated by intravenous injection of anti-ceramide IgM 1 hour before each etoposide injection (Fig. 4E and data not shown). In contrast, cisplatin, even at the MTD of 3×6 mg/kg, neither induced significant HCT-116 tumor growth delay (Fig. 4G) nor tumor endothelial apoptosis (Fig. 4H). These data suggest engagement of endothelial ASMase/ceramide signaling in parenchymal tumor response might be mandatory for select chemotherapeutic agents.
3.4. Anti-angiogenic therapy sensitizes HCT-116 tumors to chemotherapeutic drugs
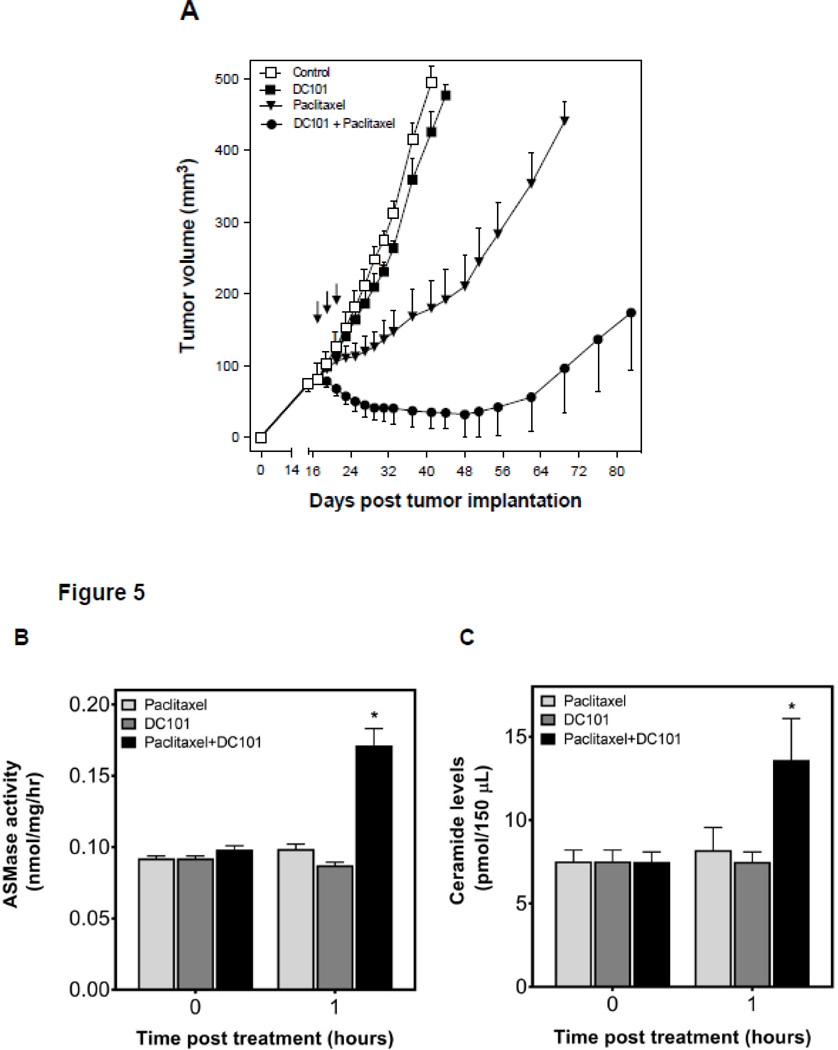
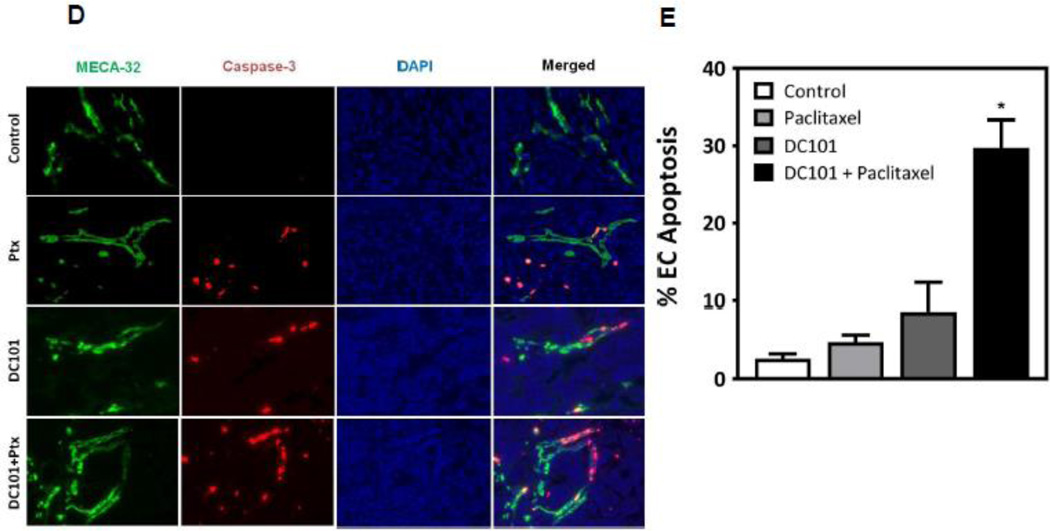
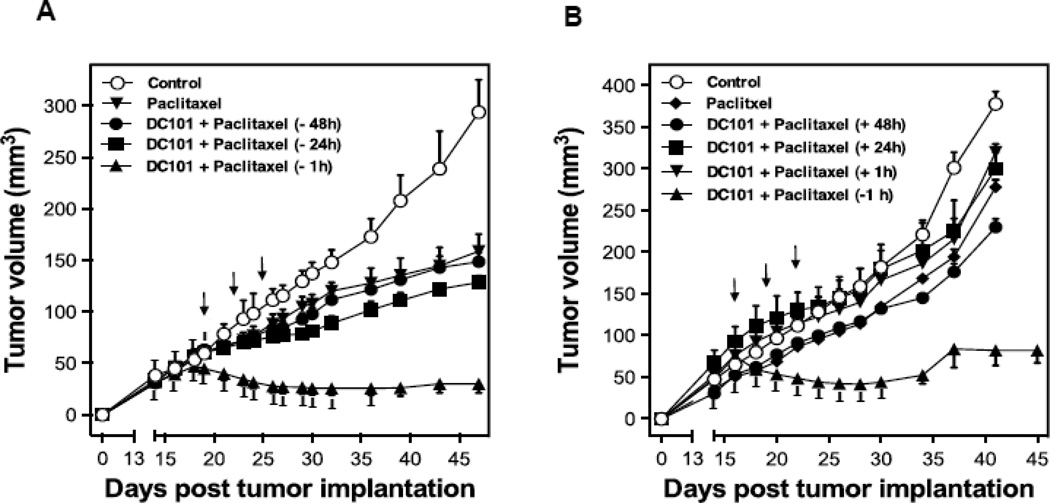
To test the hypothesis that sphingolipid-based use of anti-angiogenic drugs, previously shown by us to radiosensitize endothelial cells via activation of the ASMase/ceramide pathway [5], might also chemosensitize, we designed an additional set of experiments. First, we used the anti-VEGFR2 antibody DC101, previously shown to de-repress endothelial ASMase activity inhibited by VEGF [5], which is ubiquitously produced in tumors via hypoxia-mediated HIF-1α transcriptional activation of angiocrines [5]. HCT-116 tumors in SCIDasmase+/+ mice were only marginally affected by 3×15 mg/kg paclitaxel and modestly by 1600 µg DC101 alone. However, combination of these agents with DC101 preceding paclitaxel by 1 hour, yielded a synergistic effect on tumor response, including 40% complete responses (Fig. 5A). Next, we evaluated the effects of combination of DC101 and paclitaxel on ASMase activity in vivo. HCT-116 bearing mice were treated as described above, and mouse serum was collected at 1 hour and 6 hours after paclitaxel. Neither, DC101 nor, paclitaxel treatment alone increased serum ASMase activity at 1 hour and 6 hours (not shown) post paclitaxel in this mouse model (Fig. 5B) as compared to a baseline control cohorts. Combination of DC101 and paclitaxel induced ASMase activity up to 0.17±0.02 nmol/mg/hr at 1 hour, significantly higher than paclitaxel alone treatment (0.09±0.005 nmol/mg/hr) that was sustained for up to 6 hours (not shown). C16-Ceramide levels in the serum of these mice were significantly elevated in the combination treatment at both 1 hour and 6 hours (not shown) following paclitaxel as compared to paclitaxel alone (Fig. C, 13.6±4.3 and 10.1±1.6 pmol/150 µL vs. 8.2±2.3 and 3.2±1.4 pmol/150 µL), preceding the apoptosis observed in the tumor endothelial cells at 4 hours after the combined treatment. Similarly DC101 was only effective in enhancing tumor endothelial apoptosis when delivered 1 hour prior submaximal paclitaxel (15 mg/kg), an approach that increased apoptosis from 5±1% in response to paclitaxel alone to 30±4% with combined treatment (Fig. 5D and 5E). Note, treatment with DC101 alone generated minimal apoptosis (9±4%) in the tumor endothelial cell compartment. Anti-angiogenic synergism with chemotherapeutic agents depended on synchronized delivery of agents. Importantly, a detailed analysis of the temporal relationship between delivery of anti-angiogenic drug and chemotherapeutic revealed no chemosensitization in response to 3×15 mg/kg paclitaxel if DC101 was injected 3–48 hours prior to paclitaxel (Fig. 6A and not shown) or at any time from 1–48 hours post paclitaxel (Fig. 6B and not shown). These studies define a strict temporal relationship between anti-angiogenic and chemotherapeutic delivery to engage sphingolipid-based chemosensitization, highly similar to what was observed with ionizing radiation [5], optimal with anti-angiogenic drug delivery at 1 hour preceding chemotherapy.
Figure 5.
Anti-angiogenic therapy sensitizes HCT-116 tumors to chemotherapeutics. (A) Anti-angiogenic chemosensitization of HCT-116 tumors in SCIDasmase+/+ mice. Mice harboring tumors were treated with paclitaxel (15/15/15 mg/kg i.p) three times biweekly. DC101 (1.6 mg per mouse i.v.) was delivered 1 hour prior to each paclitaxel treatment. Data (mean±SD) are collated from 5 mice per group. (B) ASMase activity was quantified by radioenzymatic assay using [N-methyl-14C] sphingomyelin as substrate. Mouse serum was collected at 1 hour after treatment with either PBS or DC101 (2.5 mg) followed by paclitaxel (15 mg/kg). (C) In parallel, a time-course of C16-ceramide generation was measured by double mass spectrometry (MS) analysis. (D) SCIDasmase+/+ mice were treated with DC101 1 hour before one dose of 15 mg/kg paclitaxel and 4 hours post treatment, tumors were harvested and tumor endothelial cell apoptosis detected using double fluorescent staining with activated Caspase-3 and MECA-32. (E) Quantification of endothelial cell apoptosis in HCT-116 tumors after different treatments as shown in panel D. Data (mean±SD) were compiled from 20 different fields (400× magnification) at each time point from 3 tumors.
Figure 6.
Impact of timing of anti-angiogenic drug delivery relative to paclitaxel treatment on HCT-116 tumors growth. SCIDasmase+/+ mice harboring tumors were handled as in Figure 5A. DC101 (1.6 mg per mouse i.v.) was provided either before (A) or after (B) paclitaxel treatment. Mice harboring tumors were treated with paclitaxel (15/15/15 mg/kg i.p) three times biweekly. Data (mean±SD) were collated from 5 mice/group.
4. Discussion
Using biochemical and genetic approaches, we previously showed that SDRT, an emerging clinical modality [24, 25], activates the ASMase/ceramide pathway within tumor endothelium, and that ensuing microvascular dysfunction couples to parenchymal tumor cell damage to determine overall tumor response [3–5]. VEGF is a principal antagonist of ASMase/ceramide-driven endothelial cell dysfunction and our prior studies showed that anti-angiogenics, when delivered immediately before radiotherapy, a regimen that optimally de-represses ASMase, can significantly sensitize activation of this pathway. In the current study we extend these concepts to chemotherapy and demonstrate that, in a manner analogous to radiotherapy, certain chemotherapeutic agents also activate the ASMase/ceramide pathway, if principles governing the pharmacodynamics of ASMase activation are obeyed. In addition, modulation of this pathway by anti-angiogenics, can similarly chemosensitize tumor responses. Based on this evidence, we posit that therapies targeted to ASMase signaling, such as anti-VEGF antibodies, may help overcome resistance to cytotoxic therapies by lowering apoptotic threshold of the tumor microvasculature and increasing cytotoxicity. Using molecularly-targeted anti-angiogenic agents in combination with traditional cytotoxic drugs may increase the percentage of patients who achieve disease stabilization and prolonged survival [26].
The importance of ASMase/ceramide signaling in tumor endothelial response was demonstrated in this study using a variety of cytotoxic agents, each with a seemingly unrelated mechanism of action. Etoposide is a topoisomerase II inhibitor which acts by stabilizing topoisomerase-DNA “cleavable complexes,” which are processed into DNA double-strand breaks that are lethal to the cell [27]. Alternately, paclitaxel, a microtubule disrupting agent, binds to microtubules and causes kinetic suppression (stabilization) of microtubule dynamics [28], leading to cell cycle arrest at the mitotic phase. Nevertheless, both etoposide and paclitaxel also induce apoptosis through ASMase activation and increased ceramide production in endothelial cells. This latter phenomenon has been previously demonstrated for etoposide in human glioma cells [17] and primary neuronal cultures [18], and for paclitaxel in human ovarian carcinoma cells [29]. Thus, our data indicate that there is likely more than one mechanism of antitumor activity for these drugs, and that mechanism engaged is cell-type specific. A growing body of evidence indicates that the ASMase/ceramide pathway is a generic mediator of stress, transactivating pathogenesis of tissue damage in multiple models of human disease [30].
In the context of the current study, we show that etoposide and paclitaxel treatment of HCAEC or BAEC induce endothelial apoptosis by ASMase-initiated formation of CRMs. We posit that these agents engage this biology in neo-angiogenic endothelial cells because endothelium display a 20-fold higher ASMase activity relative to other mammalian cells [2, 31], and thus are particularly adept in engaging this biology in response to diverse stresses [11, 22]. While in the current study cisplatin failed to activate endothelial ASMase, it has nonetheless been reported to trigger endothelial apoptosis in microvessels of intestine and thymus of asmase wild type mice, but not littermate mice lacking asmase[32]. The dose of cisplatin used in this latter study was 27 mg/kg, which is 4.5 times higher than the MTD dose used in our studies (6 mg/kg). We speculate that differences in results might be due to ASMase-independent mouse strain sensitivity to cisplatin toxicity, limiting cisplatin dose in SCID mice to below the threshold for ASMase activation. To our knowledge, this is the first report of CRMs in cell monolayers rather than in suspension culture.
The current studies define an alternate mechanism-based use of anti-angiogenic drugs for chemosensitization based on principles of ASMase signal transduction. While the impact of precise temporal anti-angiogenic delivery on chemotherapeutic treatment in pre-clinical models appears encouraging, the extent to which this strategy might chemosensitize human cancer is currently unknown. We propose that if temporal restriction for sphingolipid-based anti-angiogenic chemosensitization can be validated in a randomized clinical trial, it might represent a substantive advance in the way we use anti-angiogenic drugs in cancer therapy.
5. Conclusions
Our results show that certain chemotherapeutic drugs induce ASMase/ceramide-driven reorganization of membrane rafts into large signaling platforms, CRMs, resulting in microvascular dysfunction and consequently tumor-growth delay and complete responses. Furthermore, we show synergy between anti-angiogenic agents and these chemotherapeutic drugs that occurs only when anti-angiogenic agents are delivered immediately prior to chemotherapy, obeying principles of ASMase signal transduction.
Highlights.
Paclitaxel or etoposide induce EC apoptosis via activation of ASMase.
EC dysfunction is required for complete tumor response.
Anti-angiogenics modulate chemotherapy if delivered immediately prior to therapy.
Acknowledgments
We thank Daniel Higginson for help with the discussion, Rodica Stan with the editing and Karen Reede for assistance in preparation of the manuscript. We thank ImClone Systems for their gift of DC101.
Study supported by NIH grants CA105125 (AHF), CA158367 [29] and Core Grant P30 CA008748 (MSKCC).
Abbreviations
- VEGF
vascular endothelial growth factor
- PDGF
platelet derived growth factor
- EC
endothelial cells
- STV
saline-base trypsin versene
- EDTA
Ethylenediaminetetraacetic acid
- FBS
fetal bovine serum
- PBS
phosphate buffered saline
- HEPES
4-(2-hydroxyethyl) piperazine-1-ethanesulfonic acid, N’-(2-hydroxyethyl) piperazine-N’-(2-ethansulfonic acid)
- DAPI
4',6-diamidino-2-phenylindole
- DC101
anti-VEGF receptor 2
- SD
standard deviation
Footnotes
Publisher's Disclaimer: This is a PDF file of an unedited manuscript that has been accepted for publication. As a service to our customers we are providing this early version of the manuscript. The manuscript will undergo copyediting, typesetting, and review of the resulting proof before it is published in its final citable form. Please note that during the production process errors may be discovered which could affect the content, and all legal disclaimers that apply to the journal pertain.
Conflicts of Interest
The authors declare that they have no conflicts of interest.
References
- 1.Stancevic B, Varda-Bloom N, Cheng J, Fuller JD, Rotolo JA, Garcia-Barros M, Feldman R, Rao S, Weichselbaum RR, Harats D, Haimovitz-Friedman A, Fuks Z, Sadelain M, Kolesnick R. PLoS One. 2013;8:e69025. doi: 10.1371/journal.pone.0069025. [DOI] [PMC free article] [PubMed] [Google Scholar]
- 2.Tabas I. Chem Phys Lipids. 1999;102:123–130. doi: 10.1016/s0009-3084(99)00080-8. [DOI] [PubMed] [Google Scholar]
- 3.Garcia-Barros M, Paris F, Cordon-Cardo C, Lyden D, Rafii S, Haimovitz-Friedman A, Fuks Z, Kolesnick R. Science. 2003;300:1155–1159. doi: 10.1126/science.1082504. [DOI] [PubMed] [Google Scholar]
- 4.García-Barros M, Thin TH, Maj J, Cordon-Cardo C, Haimovitz-Friedman A, Fuks Z, Kolesnick R. Cancer Res. 2010;70:8179–8186. doi: 10.1158/0008-5472.CAN-10-1871. [DOI] [PMC free article] [PubMed] [Google Scholar]
- 5.Truman JP, Garcia-Barros M, Kaag M, Hambardzumyan D, Stancevic B, Chan M, Fuks Z, Kolesnick R, Haimovitz-Friedman A. PLoS ONE. 2010;5 doi: 10.1371/annotation/6e222ad5-b175-4a00-9d04-4d120568a897. [DOI] [PMC free article] [PubMed] [Google Scholar]
- 6.Rao SS, Thompson C, Cheng J, Haimovitz-Friedman A, Powell SN, Fuks Z, Kolesnick RN. Radiother Oncol. 2014;111:88–93. doi: 10.1016/j.radonc.2014.02.010. [DOI] [PMC free article] [PubMed] [Google Scholar]
- 7.Kerbel RS. N Engl J Med. 2008;358:2039–2049. doi: 10.1056/NEJMra0706596. [DOI] [PMC free article] [PubMed] [Google Scholar]
- 8.Jain RK. Science. 2005;307:58–62. doi: 10.1126/science.1104819. [DOI] [PubMed] [Google Scholar]
- 9.Kerbel R. The International journal of developmental biology. 2011;55:395–398. doi: 10.1387/ijdb.103217fb. [DOI] [PubMed] [Google Scholar]
- 10.Haimovitz-Friedman A, Vlodavsky I, Chaudhuri A, Witte L, Fuks Z. Cancer Res. 1991;51:2552–2558. [PubMed] [Google Scholar]
- 11.Haimovitz-Friedman A, Kan CC, Ehleiter D, Persaud RS, McLoughlin M, Fuks Z, Kolesnick RN. J Exp Med. 1994;180:525–535. doi: 10.1084/jem.180.2.525. [DOI] [PMC free article] [PubMed] [Google Scholar]
- 12.Separovic D, Semaan L, Tarca AL, Awad Maitah MY, Hanada K, Bielawski J, Villani M, Luberto C. Exp Cell Res. 2008;314:1860–1868. doi: 10.1016/j.yexcr.2008.02.008. [DOI] [PMC free article] [PubMed] [Google Scholar]
- 13.Schissel SL, Schuchman EH, Williams KJ, Tabas I. J Biol Chem. 1996;271:18431–18436. doi: 10.1074/jbc.271.31.18431. [DOI] [PubMed] [Google Scholar]
- 14.Santana P, Peña LA, Haimovitz-Friedman A, Martin S, Green D, McLoughlin M, Cordon-Cardo C, Schuchman EH, Fuks Z, Kolesnick R. Cell. 1996;86:189–199. doi: 10.1016/s0092-8674(00)80091-4. [DOI] [PubMed] [Google Scholar]
- 15.Marshall KM, Matsumoto SS, Holden JA, Concepcion GP, Tasdemir D, Ireland CM, Barrows LR. Biochemical pharmacology. 2003;66:447–458. doi: 10.1016/s0006-2952(03)00209-0. [DOI] [PubMed] [Google Scholar]
- 16.Kim JH, Alfieri AA, Kim SH, Young CW. Cancer Res. 1986;46:1120–1123. [PubMed] [Google Scholar]
- 17.Hara S, Nakashima S, Kiyono T, Sawada M, Yoshimura S, Iwama T, Banno Y, Shinoda J, Sakai N. Cell Death Differ. 2004;11:853–861. doi: 10.1038/sj.cdd.4401428. [DOI] [PubMed] [Google Scholar]
- 18.Toman RE, Movsesyan V, Murthy SK, Milstien S, Spiegel S, Faden AI. Journal of neuroscience research. 2002;68:323–330. doi: 10.1002/jnr.10190. [DOI] [PubMed] [Google Scholar]
- 19.Kim SJ, Kim JS, Kim SW, Brantley E, Yun SJ, He J, Maya M, Zhang F, Wu Q, Lehembre F, Regenass U, Fidler IJ. Neoplasia. 2011;13:167–179. doi: 10.1593/neo.10806. [DOI] [PMC free article] [PubMed] [Google Scholar]
- 20.Folkman J. Semin Cancer Biol. 2003;13:156–167. doi: 10.1016/s1044-579x(02)00133-5. [DOI] [PubMed] [Google Scholar]
- 21.Seideman JH, Stancevic B, Rotolo JA, McDevitt MR, Howell RW, Kolesnick RN, Scheinberg DA. Radiat Res. 2011;176:434–446. doi: 10.1667/rr2472.1. [DOI] [PMC free article] [PubMed] [Google Scholar]
- 22.Paris F, Fuks Z, Capodicci P, Juan G, Ehleiter D, Schwartz JL, Seddon AP, Cordon-Cardo C, Haimovitz-Friedman A. Science. 2001;293:293–297. doi: 10.1126/science.1060191. [DOI] [PubMed] [Google Scholar]
- 23.Rotolo JA, Zhang J, Donepudi M, Lee H, Fuks Z, Kolesnick R. The Journal of Biological Chemistry. 2005;280:26425–26434. doi: 10.1074/jbc.M414569200. [DOI] [PubMed] [Google Scholar]
- 24.Greco C, Zelefsky MJ, Lovelock M, Fuks Z, Hunt M, Rosenzweig K, Zatcky J, Kim B, Yamada Y. Int J Radiat Oncol Biol Phys. 2011;79:1151–1157. doi: 10.1016/j.ijrobp.2009.12.038. [DOI] [PubMed] [Google Scholar]
- 25.Yamada Y, Bilsky MH, Lovelock DM, Venkatraman ES, Toner S, Johnson J, Zatcky J, Zelefsky MJ, Fuks Z. Int J Radiat Oncol Biol Phys. 2008;71:484–490. doi: 10.1016/j.ijrobp.2007.11.046. [DOI] [PubMed] [Google Scholar]
- 26.Chabner BA. Oncologist. 2002;7(Suppl 3):34–41. doi: 10.1634/theoncologist.7-suppl_3-34. [DOI] [PubMed] [Google Scholar]
- 27.Kingma PS, Corbett AH, Burcham PC, Marnett LJ, Osheroff N. J Biol Chem. 1995;270:21441–21444. doi: 10.1074/jbc.270.37.21441. [DOI] [PubMed] [Google Scholar]
- 28.Wang TH, Wang HS, Soong YK. Cancer. 2000;88:2619–2628. doi: 10.1002/1097-0142(20000601)88:11<2619::aid-cncr26>3.0.co;2-j. [DOI] [PubMed] [Google Scholar]
- 29.Prinetti A, Millimaggi D, D'Ascenzo S, Clarkson M, Bettiga A, Chigorno V, Sonnino S, Pavan A, Dolo V. Biochem J. 2006;395:311–318. doi: 10.1042/BJ20051184. [DOI] [PMC free article] [PubMed] [Google Scholar]
- 30.Kolesnick RN. J Biol Chem. 1989;264:11688–11692. [PubMed] [Google Scholar]
- 31.Marathe S, Schissel SL, Yellin MJ, Beatini N, Mintzer R, Williams KJ, Tabas I. J Biol Chem. 1998;273:4081–4088. doi: 10.1074/jbc.273.7.4081. [DOI] [PubMed] [Google Scholar]
- 32.Rebillard A, Rioux-Leclercq N, Muller C, Bellaud P, Jouan F, Meurette O, Jouan E, Vernhet L, Le Quement C, Carpinteiro A, Schenck M, Lagadic-Gossmann D, Gulbins E, Dimanche-Boitrel MT. Oncogene. 2008;27:6590–6595. doi: 10.1038/onc.2008.257. [DOI] [PubMed] [Google Scholar]


