

Abstract
Background and Purpose
Symptomatic hemorrhagic transformation (HT) is the most important complicating factor after treatment with intravenous tissue plasminogen activator. In this study, we used multimodal magnetic resonance imaging to investigate the incidence and severity of reperfusion-based HT in spontaneously hypertensive rats after ischemia/reperfusion.
Methods
Twenty male spontaneously hypertensive rats were subjected to 30 minutes of middle cerebral artery occlusion via the suture model. Diffusion-weighted, T2-weighted, and gradient-echo imaging were performed on days 1, 2, 3, 4, and 7 for longitudinal evaluation of lesion evolution, vasogenic edema, and HT, respectively. Findings on gradient-echo images were classified according to the severity of hemorrhage: no HT; punctate or small petechial hemorrhage (HI-1); confluent petechial hemorrhage (HI-2); hematoma with absent/mild space-occupying effect (PH-1, ≤30% lesion volume); and hematoma with significant space-occupying effect and potential perihematomal edema (PH-2, >30% lesion volume). Histopathologic evaluation of HT was performed after final imaging for comparison with magnetic resonance imaging results.
Results
Final hemorrhage scores based on severity were as follows: HI-1 23.1%, HI-2 30.8%, PH-1 30.8%, and PH-2 15.4%. Similar to clinical observations, only PH-2 was associated with neurologic deterioration and associated weight loss.
Conclusions
This model has a high incidence of parenchymal hematomas (46.2%) and therefore is appropriate for the evaluation of novel therapeutics targeting blood-brain barrier integrity and the reduction of symptomatic HT events (PH-2), as well as those potentially “at risk” for neurologic deterioration (PH-1).
Keywords: stroke, reperfusion, hemorrhagic transformation, parenchymal hematoma, spontaneously hypertensive rats, middle cerebral artery occlusion
Symptomatic intracerebral hemorrhage is a major complication of both spontaneous reperfusion and treatment with intravenous recombinant tissue plasminogen activator (rt-PA).1–4 Even when rt-PA is administered as indicated, 9 of 312 patients (2.9%) will die as a result of hemorrhage secondary to ischemia.1 Reducing the incidence of symptomatic hemorrhage remains the single greatest challenge to extending reperfusion therapy past 3 hours. Secondary analyses of the ECASS-I and ECASS-II trials have shown that parenchymal hematoma type 2 (PH-2) is associated with worse clinical outcome.5–7 Hemorrhagic infarction types 1 and 2 (HI-1, HI-2) instead seem to be related to reperfusion,8 as well as the severity and duration of ischemia.9,10 The impact of asymptomatic hemorrhages (HI-1, HI-2, PH-1) on outcome is still a topic of some debate.
Although clinical studies consider hemorrhagic transformation (HT) in determining the safety and efficacy of therapeutic intervention, the majority of experimental stroke studies do not, and those that do generally use young, healthy animals. The STAIR criteria suggest the use of diseased animals, specifically strains that are diabetic, hypertensive, aged, or hyperglycemic.11 Stroke models with similar incidences of HI and PH are needed to address the effects of reperfusion and rt-PA administration on the occurrence of asymptomatic versus symptomatic hemorrhage.
In the present study, we investigated the incidence and severity of reperfusion-based HT in spontaneously hypertensive (SHR) rats. This particular model, a 30-minute suture reperfusion model, yields a time frame during which some tissue may be considered salvageable with intervention (whether it be reperfusion alone, rt-PA, or other neuroprotective treatment). We hypothesized that the incidence and severity of reperfusion-based HT would be higher in SHR rats, owing to the presence of hypertension, vasculopathy, and alterations in blood-brain barrier (BBB) functionality. Our goals were 3-fold: (1) to monitor lesion evolution and subsequent HT up to 7 days after stroke; (2) to compare these results with those of previous experimental stroke studies; and (3) to examine the similarities and discordances between the experimental and clinical presentations of HT.
Materials and Methods
Experimental HT
Animal Preparation
This study was approved by the institutional animal care and use committee of the National Institute of Neurological Disorders and Stroke, National Institutes of Health (IACUC protocol No. 1225-05). Twenty male SHR (SHR/NCrl, 3 to 4 months old, 300 to 360 g, systolic blood pressure 165 to 185 mm Hg; Charles River Laboratories, White Plains, NY) were anesthetized with isoflurane delivered in a 2:2:1 mixture of breathing-quality air, nitrogen, and oxygen. All animals were subjected to 30 minutes of right middle cerebral artery occlusion (MCAO) via the intraluminal suture model first described by Koizumi et al12 and later modified by Longa et al.13
Postoperative Care
After recovery from anesthesia, all rats were provided free access to standard rat chow and water. Supplemental fruit (apple, orange), Jello, and bacon treats were provided on the cage floor once daily. For the first 3 days after imaging, 30% xylocaine was applied to the surgical sites and rats were administered 10 cc of saline subcutaneously twice daily.
Magnetic Resonance Imaging
Serial magnetic resonance imaging (MRI) was performed with a Bruker Biospin 7.0-T/30-cm imaging spectrometer on days 1, 2, 3, 4, and 7 after MCAO. Diffusion-weighted, echo-planar imaging and T2-weighted imaging were performed for longitudinal evaluation of lesion evolution and vasogenic edema. Gradient-echo imaging (GRE) was performed for longitudinal evaluation of HT. After acquisition of a localizer tripilot, the front edge of the slice package was set at the intersection of the brain and olfactory bulb. Twelve 1.5-mm-thick slices were acquired with a field of view of 25.6×25.6 mm2. For diffusion-weighted, echo-planar imaging, matrix size=96×96; repetition time (TR)/echo time (TE)=6200 ms/46 ms; Δ=13 ms; δ=4 ms; b values=0, 250, 500, 750, and 1000 s/mm2 (acquired for all 3 principle directions x, y, and z); and number of excitations=4. For T2-weighted imaging, matrix=128×128; TR=2000 ms; TE=15, 30, 45, 60, 75, 90, 105, and 120 ms; number of excitations=1. For the first GRE, matrix=256×256; TR/TE=300 ms/12 ms; flip angle=30°; and number of excitations=1. These parameters yielded an in-plane resolution of 267 μm for diffusion-weighted, echo-planar imaging, 200 μm for T2-weighted imaging, and 100 μm for GRE. Two additional sets of GRE images were acquired at higher through-plane resolutions to increase the accuracy of HT identification and scoring. For the second GRE, there were 18 1.0-mm-thick slices; matrix=256×256; TR/TE=350 ms/12 ms; and number of excitations=2. For the third GRE, there were 18 0.5-mm-thick slices; matrix=256×256; TR/TE=350 ms/12 ms; and number of excitations=4. Total scan time was ≈20 minutes.
Inclusion/Exclusion Criteria
Animals were excluded for the presence of subarachnoid hemorrhage on day-1 GRE images or T2 lesion volumes <50 mm3 (without cortical involvement). Both were considered strongly suggestive of surgical error due to perforation of the MCA/ACA bifurcation or incomplete MCAO.
Neurologic Scoring and Functional Assessment
Activity, appearance, gait, appetite, hydration, and weight were monitored on days 1, 2, 3, 4, and 7 after MCAO. General neurologic scoring was performed according to a modification of the scoring method developed by Menzies et al,14 in which 0=no neurologic deficit, 1=failure to extend left forepaw fully, 2=contralateral circling after tail pull, 3=falling to the left and/or spontaneous contralateral circling, 4=inactive or moribund, and 5=dead.
Volume Measurements
Image reconstruction was performed with Paravision’s image processing and display software (XTip). Image analysis and parameter map production (apparent diffusion coefficient, T2) were performed with the use of routines written in IDL (Research Systems Inc, Boulder, Colo). Lesion volumes were manually drawn with T2 parameter maps. HT volumes were manually drawn with GRE images. To correct for edema, the ipsilateral (right) and contralateral (left) hemispheres were compared [edema=(ipsilateral−contralateral)/contralateral].
MRI-Based HT Scoring
Each HT type was classified according to the ECASS I and II definitions,2,3 in which HI is a petechial (HI-1) or confluent (HI-2) hemorrhage occupying a portion of the ischemic lesion and PH is a homogeneous region of blood with a mild space-occupying effect (PH-1, ≤30% lesion volume) or severe displacement of brain tissue with a significant space-occupying effect and perihematomal edema (PH-2, >30% lesion volume).
Hematoxylin-Eosin–Based HT Scoring
In a subset of animals (n=10) after imaging on day 7, standard hematoxylin-eosin staining was performed for visual assessment and scoring of HT. Images (10× to 20×) were acquired with use of an Axioplan light microscope (Carl Zeiss Microimaging GmbH, Berlin, Germany) and Metamorph 7 software (Molecular Devices, Downingtown, Pa). Long-axis diameter measurements and semiquantitative scoring were performed by a blinded observer. A 5-point scoring system, a modification of that developed previously by Brinker et al,15 was used. Bleeds were scored according to evidence of (1) microscopic single diapedesis of blood, (2) microscopic multiple diapedeses of blood, (3) macroscopic non–space-occupying hemorrhage, (4) macroscopic hemorrhage with mild space-occupying effect, and (5) macroscopic hemorrhage with significant space-occupying effect. Microscopic and macroscopic refer to initial visual identification of bleeds requiring or not requiring magnification, respectively.
Statistical Analysis
Data are presented as mean±SD (range). Normality was tested with the Shapiro-Wilk and Kolmogorov-Smirnov tests. Because the data involved a small number of subjects or were determined to be nonnormal, all analyses were performed with nonparametric methods. Changes in MRI measurements (lesion volume, HT volume) and physiologic variables (neurologic score, weight) versus time were investigated. For within-group analyses, Friedman’s test for repeated measures and Mann-Whitney tests for comparison of independent samples were used. For between-group analyses, the Kruskal-Wallis test was used as an alternative to the 1-way between-group ANOVA.
Results
Experimental HT
All animals (n=20) were imaged for 1-day follow-up. Two were excluded for the presence of subarachnoid hemorrhage, and 5 were excluded for volumes <50 mm3. Volumes <50 mm3 lacking cortical involvement are indicative of incomplete MCAO. This generally occurs because of improper suture placement and occlusion of the anterior choroidal artery versus that of the MCA.16 All remaining animals (n=13) met the inclusion criteria and were included in the study, yielding a MCAO success rate of 65%. The number of animals imaged successfully on a time point–by–time point basis was as follows: 1 day, n=13; 2 days, n=12; 3 days, n=11; 4 days, n=10; and 7 days, n=13. Nine of the 13 animals had all 5 imaging time points. The mean times until 1-, 2-, 3-, 4-, and 7-day scans were 26±5 (18–24), 50±4 (43–58), 72±5 (60–75), 102±9 (91–119), and 174±21 (135–204) hours, respectively.
Figure 1 diagrams the MRI-based lesion evolution and associated HT for all animals. Details of the HT measurements are provided in Table 1. HT occurred in 3 of 13 (23.1%) animals by day 1, in 6 of 13 (46.2%) animals by day 2, in 11 of 13 (84.6%) animals by day 3, in 12 of 13 (92.3%) animals by day 4, and in all 13 (100%) animals by day 7 after ischemia/reperfusion. HT total volume increased significantly from 0.64±1.23 mm3 on day 1 to 2.16±2.40 mm3 on day 3 (P<0.05), with a progressive increase to 8.38±11.88 mm3 by day 4 (P<0.01) and to 12.40±18.19 mm3 by day 7 (P<0.01). This formation of HT was concomitant with reperfusion and the formation of vasogenic edema, as seen by an increase in lesion volume from days 1 to 2 (P<0.01). Resolution of vasogenic edema occurred between days 4 and 7, with lesion volumes returning to their day-1 values (P=0.397).
Figure 1.
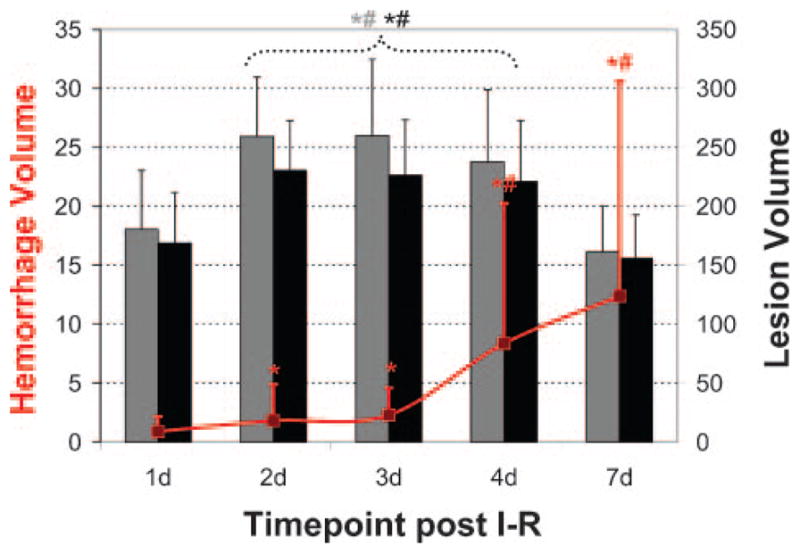
Lesion evolution and associated HT after ischemia/reperfusion. HT occurred in 3 of 13 (23.1%), 6 of 13 (46.2%), 11 of 13 (84.6%), 12 of 13 (92.3%), and 13 of 13 (100%) animals by days 1, 2, 3, 4, and 7, respectively, after ischemia/reperfusion. Hemorrhage volume increased significantly with time (P<0.01) and was concomitant with an increase in lesion volume from days 1 to 2 (P<0.01). Resolution of vasogenic edema occurred between days 4 and 7, with lesion volumes returning to their day-1 values (P=0.397). Red line indicates hemorrhage volume; gray bars, uncorrected lesion volumes; and black bars, corrected lesion volumes. *Significance with P<0.01 (Friedman test). #Significance with P<0.01 (Mann-Whitney test).
Table 1.
MRI-Based HT Evolution
| Time, d | Animals, No. | Total HT Volume, mm3
|
HT Score, %
|
|||||
|---|---|---|---|---|---|---|---|---|
| Mean±SD | Median (Range) | HI-1 | HI-2 | PH-1 | PH-2 | Total | ||
| 1 | 13 | 0.64±1.23* | 0.0 (0.0–3.05) | 15.4 | 0 | 7.7 | 0 | 23.1 |
| 2 | 12 | 1.24±3.11* | 0.0 (0.0–10.85) | 30.8 | 7.7 | 7.7 | 0 | 46.2 |
| 3 | 11 | 2.16±2.40* | 1.26 (0.0–8.31) | 38.5 | 38.5 | 7.7 | 0 | 84.6 |
| 4 | 10 | 8.38±11.88*† | 5.43 (1.76–41.27) | 23.1 | 38.5 | 15.4 | 15.4 | 92.3 |
| 7 | 13 | 12.40±18.19*† | 6.23 (2.18–64.32) | 23.1 | 30.8 | 30.8 | 15.4 | 100.0 |
Significance with P<0.01 (Friedman test, n=9).
Significance with P<0.01 (Mann-Whitney test, n=9–13).
Animals had multiple bleeds with varying levels of severity. From the initial identification of HT through day 7, 5 of 13 (38.5%) hemorrhages remained unchanged according to their first ECASS I/II classification, whereas 8 of 13 (61.5%) progressed to a more severe category. Five initially classified as HI-1 progressed: 3 to HI-2, 1 to PH-1, and 1 to PH-2. Two initially classified as HI-2 progressed, both to PH-1. One initially classified as PH-1 progressed to PH-2. By day 7, all animals exhibited evidence of punctate or small petechial hemorrhage (HI-1). Final hemorrhage scores based on severity were HI-1 23.1%, HI-2 30.8%, PH-1 30.8%, and PH-2 15.4%.
Examples of reperfusion-based HT are shown in Figure 2, with the specifics of the histopathologic HT scoring provided in Table 2. All animals had single diapedesis (score 1) or multiple diapedeses (score 2) of blood. These types of hemorrhages were small, with diameters of 78±59 μm and 232±126 μm, respectively. Only identifiable with further magnification (10× to 20×), they could be referred to as “microscopic.” These hemorrhages could also be considered punctate or petechial, similar to the clinical identification of microbleeds and HI-1. On GRE images they appeared hypointense and were generally confined to a single imaging slice. HI-1 hemorrhages occurred most frequently along the lesion periphery. In contrast, macroscopic hemorrhages (score 3 to 5) occurred in 8 of 10 animals (80%) and were primarily located central to the infarct. These were easily identified on the slices without magnification, having diameters of 0.641±0.253, 0.935±0.453, and 4.278±1.060 mm, respectively. These hemorrhages (score 3 to 5) are similar to the clinical identification of HI-2, PH-1, and PH-2. Macroscopic non–space-occupying hemorrhage (score 3, HI-2) showed extensive bleeding but no displacement of tissue. On GRE images these had a patchy, heterogeneous appearance with a coverage over 1 to several imaging slices. Macroscopic hemorrhages with a mild to severe space-occupying effect (score 4 to 5; PH-1, PH-2) had clear boundaries between their edges and surrounding tissue. Hemorrhages with a severe space-occupying effect (score 5, PH-2) had tissue displacement and midline shift evident on both GRE images and histopathology. For PH-2 hemorrhages, perihematomal edema was visible on T2-weighted and diffusion-weighted images (data not shown).
Figure 2.
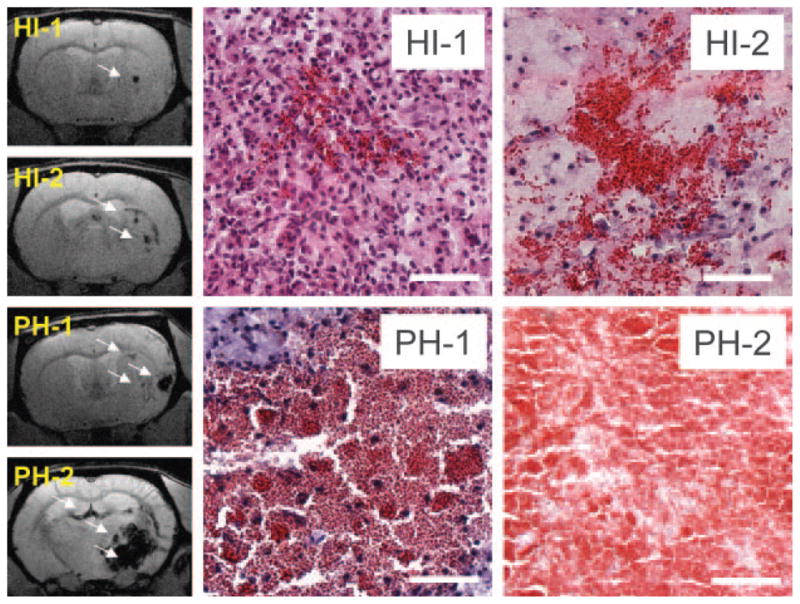
Experimental HT: examples of HI and PH. Left side shows GRE images. Bleeds are hypointense (arrows). Right side shows images of hematoxylineosin–stained tissue. Bleeds are red; surrounding tissue is blue (nuclei) or pink (cytoplasm). Scale=200 μm. HI-1 was punctate or petechial and occurred most frequently along the lesion periphery. These hemorrhages involved single (score 1) or multiple (score 2) diapedeses of blood. HI-2 was macroscopic (score 3) and located primarily within the infarct core. PH-1 was macroscopic, occupying ≤30% of total lesion volume, with an absent or a mild space-occupying effect (score 4). PH-2 was macroscopic, occupying >30% of total lesion volume, with a significant space-occupying effect and displacement of surrounding tissue (score 5).
Table 2.
Hematoxylin and Eosin–Based HT Characterization, Day 7 (n=10 Animals)
| Score | Long-Axis Diameter, mm
|
Final Score | Clinical Corollary | |
|---|---|---|---|---|
| Mean±SD | Median (Range) | |||
| 1 | 0.078±0.059* | 0.058 (0.017–0.250) | 0% | Microbleed, HI-1 |
| 2 | 0.232±0.126* | 0.191 (0.059–0.477) | 20% | HI-1 |
| 3 | 0.641±0.253* | 0.658 (0.228–1.220) | 60% | HI-2 |
| 4 | 0.935±0.453* | 0.893 (0.475–2.043) | 10% | PH-1 |
| 5 | 4.278±1.060* | 4.079 (3.265–5.690) | 10% | PH-2 |
Significance with P<0.01 (Kruskal-Wallis test).
Neurologic outcome was favorable (score 0 to 2) in 12 of 13 animals (92.3%) and poor in 1 of 13 (7.7%) animals. These findings are shown in Figure 3A. Animals with HI-1, HI-2, or PH-1 had minor neurologic deficits (score 2 or less) that did not change significantly with time. One of 2 (50%) animals with PH-2 worsened neurologically, from a score of 2.5 (minor circling, falling to the left) on day 1 to a score of 4 (moribund) by day 3. This neurologic deterioration was accompanied by progressive weight loss through day 7, as shown in Figure 3B.
Figure 3.

Neurologic deterioration and concomitant weight loss are associated with PH-2. Animals with HI-1, HI-2, or PH-1 had minor neurologic deficits (score 2 or less) that did not change significantly with time. One of 2 with PH-2 worsened neurologically, from a score of 2.5 (minor circling, falling to the left) on day 1 to a score of 4 (moribund) by day 3. This neurologic deterioration was accompanied by progressive weight loss. Bars indicates HI-1 (white), HI-2 (light gray), PH-1 (dark gray), and PH-2 (black).
Discussion
HT is a natural process occurring during stroke progression.17 After ischemia, a persistent reduction in blood flow causes depletion of oxygen, failure of cellular membranes, and resultant cytotoxic edema. As part of the inflammatory response, the upregulation of cytokines and activation of matrix metalloproteinases induce endothelial dysfunction.18,19 Reperfusion of already leaky capillaries with severely reduced structural integrity only exacerbates injury to the endothelium. This progressive breakdown of the BBB causes the formation of vasogenic edema, increasing the risk of diapedesis of blood and subsequent HT.17,20
Similar to clinical findings,5–7,9,10 we found that only PH-2 was associated with neurologic deterioration and worse outcome. Although all animals had evidence of hemorrhagic infarction (HI), these less severe hemorrhages did not result in an appreciable decline in the animals’ neurologic scores and were thus considered asymptomatic. Prior animal studies with either the suture21,22 or embolic15,23,24 model reported high incidences (18.3% to 92.3%, median=66.7%) of petechial hemorrhages in their untreated controls. Similarly, in non–rt-PA patients, HI occurred in the range of 9.1% to 36.5%.2,3,5–7,9 Pathologic examination of brain tissue from stroke patients who died of brain herniation or other complicating factors consistently showed the presence of HI.25,26 It should not be surprising that autopsy reports have higher rates of HI (up to 71%), given the limitations in image resolution and the differences in sensitivity of MRI and computed tomography for detection of small hemorrhages. These results indicate that HI is probably a natural occurrence after ischemia, with diapedesis of blood from small capillaries/venules and bleeding from leptomeningeal collaterals.15,17 HI may also be related to a positive outcome, potentially indicative of successful reperfusion after administration of rt-PA.8,10
The cause of PH, on the other hand, is most likely due to rupture of a major artery.27 Bleeding from a primary rupture in combination with the acute inflammatory response may then secondarily disrupt surrounding vessels. Extensive bleeding of this kind results in displacement of brain tissue, formation of perihematomal edema, and neurologic decline. In some instances, complicating factors such as midline shift and brain herniation from massive edema result in death. PH has been related to infarct size,7–9 with a higher incidence in cases of delayed reperfusion.8,9,15,22,24,28
In contrast to studies that reported minimal macroscopic hemorrhage in untreated animals after 30 to 60 minutes of ischemia/reperfusion,21,23,29 we found that the 30-minute MCA suture occlusion model in SHR rats had a high incidence (77.0%) of macroscopic hemorrhages. A significant fraction of these were of the parenchymal type, 30.8% PH-1 and 15.4% PH-2. Clinical studies have also reported instances of PH at rates of 1.8% to 13.2% and of 9.6% to 26.5% in non–rt-PA– and rt-PA–treated patients, respectively.2,3,5,7–10 Of these, 0.6% to 8.9% were symptomatic. Regardless of the lower rates of PH in patients with early reperfusion,8,9 hemorrhagic complications remain an issue. PH-2 is the only type of hemorrhage associated with clinical deterioration; therefore, an understanding of its cause and how to prevent it is desperately needed.
Hypertension may be the key. Chronic hypertension results in vascular remodeling (hypertrophy, eutrophy).30 This yields an increase in vascular resistance and wall sheer rates, as well as decreased vascular compliance.31 Despite the poor understanding of the genetic underpinnings of the SHR rat, this hypertensive strain tends to have larger ischemic lesions, increased vasogenic edema, BBB disruption, and subsequent HT compared with its normotensive counterpart (Wistar-Kyoto rats).28,32 This is consistent with reports suggesting that PH is more common in stroke patients with a history of hypertension.6,33
Our results indicate that even in the case of a “short” (30 minutes) ischemic insult, animals will develop HT by day 7. All animals exhibited evidence of HI, with a high incidence of PH, either asymptomatic (PH-1) or symptomatic (PH-2). The higher HI and PH rates in our experimental model are most likely a result of increased susceptibility to infarction in the SHR strain.30–32 Additionally, the suture MCAO model is roughly equivalent to a full M1 occlusion. Lesion progression is extremely rapid, with disappearance of the penumbral tissue by 2 hours in normotensive and as early as 1 hour in hypertensive rats. Those clinical studies with evaluation of HI and PH rates included a variety of stroke subtypes and varying levels of severity, not just M1 occlusions.2,3,5,7–10 To make a direct comparison between the findings of this study and the rates of reperfusion-associated HT in the clinical setting, a subpopulation of stroke patients with M1 occlusions and spontaneous reperfusion would be necessary.
We found that the majority of HT (92.3%) occurred between days 1 and 4 after ischemia/reperfusion. It is important to note that if we had stopped at the typically used 24-hour end point,22,29 many HT events (76.9%) would have been missed entirely. Although stopping at 24 hours may permit detection of a positive outcome, typically defined as a reduction in lesion volume or an improvement in neurologic score, it is not appropriate for assessing HT as an adverse event. Unfortunately, most experimental studies emphasize therapeutic efficacy without any consideration of HT. Clinical studies, however, place high importance on both therapeutic efficacy as well as safety. Clinical HT can occur as late as 1 week after stroke,1–4 consistent with the experimental findings of this study. Given the potential for the delayed development of HT, longer follow-ups are essential for preclinical trials. We believe this experimental model of HT and a minimum follow-up of 1 week may be used for the evaluation of both therapeutic efficacy and HT events.
In summary, this study confirmed that only PH-2 is associated with neurologic deterioration and worse outcome. This model had a high incidence of parenchymal hematomas (46.2%) and therefore, is appropriate for the evaluation of novel therapeutics targeting BBB integrity and the reduction of symptomatic HT events (PH-2), as well as those potentially “at risk” for neurologic deterioration (PH-1).
Acknowledgments
The authors would like to thank Christl A. Ruetzler, BA, for assistance in histologic imaging and analysis and Yongshan Mou, MD, for assistance in performing the transcardial perfusion-fixations.
Source of Funding
This research was supported by the Division of Intramural Research of the National Institute of Neurological Disorders and Stroke, National Institutes of Health, Bethesda, Md.
Footnotes
Part of this work was presented at the 15th annual meeting of the International Society of Magnetic Resonance in Medicine, Berlin, Germany, May 19–25, 2007.
Disclosures
None.
References
- 1.Tissue plasminogen activator for acute ischemic stroke: the National Institute of Neurological Disorders and Stroke rt-PA stroke study group. N Engl J Med. 1995;333:1581–1587. doi: 10.1056/NEJM199512143332401. [DOI] [PubMed] [Google Scholar]
- 2.Hacke W, Kaste M, Fieschi C, Toni D, Lesaffre E, von Kummer R, Boysen G, Bluhmki E, Hoxter G, Mahagne MH, et al. Intravenous thrombolysis with recombinant tissue plasminogen activator for acute hemispheric stroke: the European Cooperative Acute Stroke Study (ECASS) JAMA. 1995;274:1017–1025. [PubMed] [Google Scholar]
- 3.Hacke W, Kaste M, Fieschi C, von Kummer R, Davalos A, Meier D, Larrue V, Bluhmki E, Davis S, Donnan G, Schneider D, Diez-Tejedor E, Trouillas P. Randomised double-blind placebo-controlled trial of thrombolytic therapy with intravenous alteplase in acute ischaemic stroke (ECASS II). Second European-Australasian acute stroke study investigators. Lancet. 1998;352:1245–1251. doi: 10.1016/s0140-6736(98)08020-9. [DOI] [PubMed] [Google Scholar]
- 4.Clark WM, Wissman S, Albers GW, Jhamandas JH, Madden KP, Hamilton S. Recombinant tissue-type plasminogen activator (alteplase) for ischemic stroke 3 to 5 hours after symptom onset: the Atlantis study: a randomized controlled trial. Alteplase thrombolysis for acute noninterventional therapy in ischemic stroke. JAMA. 1999;282:2019–2026. doi: 10.1001/jama.282.21.2019. [DOI] [PubMed] [Google Scholar]
- 5.Fiorelli M, Bastianello S, von Kummer R, del Zoppo GJ, Larrue V, Lesaffre E, Ringleb AP, Lorenzano S, Manelfe C, Bozzao L. Hemorrhagic transformation within 36 hours of a cerebral infarct: relationships with early clinical deterioration and 3-month outcome in the European cooperative acute stroke study I (ECASS I) cohort. Stroke. 1999;30:2280–2284. doi: 10.1161/01.str.30.11.2280. [DOI] [PubMed] [Google Scholar]
- 6.Larrue V, von Kummer RR, Muller A, Bluhmki E. Risk factors for severe hemorrhagic transformation in ischemic stroke patients treated with recombinant tissue plasminogen activator: a secondary analysis of the European-Australasian acute stroke study (ECASS II) Stroke. 2001;32:438–441. doi: 10.1161/01.str.32.2.438. [DOI] [PubMed] [Google Scholar]
- 7.Berger C, Fiorelli M, Steiner T, Schabitz WR, Bozzao L, Bluhmki E, Hacke W, von Kummer R. Hemorrhagic transformation of ischemic brain tissue: asymptomatic or symptomatic? Stroke. 2001;32:1330–1335. doi: 10.1161/01.str.32.6.1330. [DOI] [PubMed] [Google Scholar]
- 8.Molina CA, Alvarez-Sabin J, Montaner J, Abilleira S, Arenillas JF, Coscojuela P, Romero F, Codina A. Thrombolysis-related hemorrhagic infarction: a marker of early reperfusion, reduced infarct size, and improved outcome in patients with proximal middle cerebral artery occlusion. Stroke. 2002;33:1551–1556. doi: 10.1161/01.str.0000016323.13456.e5. [DOI] [PubMed] [Google Scholar]
- 9.Molina CA, Montaner J, Abilleira S, Ibarra B, Romero F, Arenillas JF, Alvarez-Sabin J. Timing of spontaneous recanalization and risk of hemorrhagic transformation in acute cardioembolic stroke. Stroke. 2001;32:1079–1084. doi: 10.1161/01.str.32.5.1079. [DOI] [PubMed] [Google Scholar]
- 10.Thomalla G, Sobesky J, Kohrmann M, Fiebach JB, Fiehler J, Zaro Weber O, Kruetzelmann A, Kucinski T, Rosenkranz M, Rother J, Schellinger PD. Two tales: hemorrhagic transformation but not parenchymal hemorrhage after thrombolysis is related to severity and duration of ischemia: MRI study of acute stroke patients treated with intravenous tissue plasminogen activator within 6 hours. Stroke. 2007;38:313–318. doi: 10.1161/01.STR.0000254565.51807.22. [DOI] [PubMed] [Google Scholar]
- 11.Recommendations for standards regarding preclinical neuroprotective and restorative drug development. Stroke. 1999;30:2752–2758. doi: 10.1161/01.str.30.12.2752. [DOI] [PubMed] [Google Scholar]
- 12.Koizumi J, Yoshida Y, Nakazawa T, Ooneda G. Experimental studies of ischemic brain edema. I. A new experimental model of cerebral embolism in rats in which recirculation can be introduced in the ischemic area. Jpn J Stroke. 1986;8:1–8. [Google Scholar]
- 13.Longa EZ, Weinstein PR, Carlson S, Cummins R. Reversible middle cerebral artery occlusion without craniectomy in rats. Stroke. 1989;20:84–91. doi: 10.1161/01.str.20.1.84. [DOI] [PubMed] [Google Scholar]
- 14.Menzies SA, Hoff JT, Betz AL. Middle cerebral artery occlusion in rats: a neurological and pathological evaluation of a reproducible model. Neurosurgery. 1992;31:100–106. doi: 10.1227/00006123-199207000-00014. discussion 106–107. [DOI] [PubMed] [Google Scholar]
- 15.Brinker G, Pillekamp F, Hossmann KA. Brain hemorrhages after rt-PA treatment of embolic stroke in spontaneously hypertensive rats. Neuroreport. 1999;10:1943–1946. doi: 10.1097/00001756-199906230-00027. [DOI] [PubMed] [Google Scholar]
- 16.Gerriets T, Stolz E, Walberer M, Muller C, Rottger C, Kluge A, Kaps M, Fisher M, Bachmann G. Complications and pitfalls in rat stroke models for middle cerebral artery occlusion: a comparison between the suture and the macrosphere model using magnetic resonance angiography. Stroke. 2004;35:2372–2377. doi: 10.1161/01.STR.0000142134.37512.a7. [DOI] [PubMed] [Google Scholar]
- 17.Simard JM, Kent TA, Chen M, Tarasov KV, Gerzanich V. Brain oedema in focal ischaemia: molecular pathophysiology and theoretical implications. Lancet Neurol. 2007;6:258–268. doi: 10.1016/S1474-4422(07)70055-8. [DOI] [PMC free article] [PubMed] [Google Scholar]
- 18.Romanic AM, White RF, Arleth AJ, Ohlstein EH, Barone FC. Matrix metalloproteinase expression increases after cerebral focal ischemia in rats: inhibition of matrix metalloproteinase-9 reduces infarct size. Stroke. 1998;29:1020–1030. doi: 10.1161/01.str.29.5.1020. [DOI] [PubMed] [Google Scholar]
- 19.Yang Y, Estrada EY, Thompson JF, Liu W, Rosenberg GA. Matrix metalloproteinase-mediated disruption of tight junction proteins in cerebral vessels is reversed by synthetic matrix metalloproteinase inhibitor in focal ischemia in rat. J Cereb Blood Flow Metab. 2007;27:697–709. doi: 10.1038/sj.jcbfm.9600375. [DOI] [PubMed] [Google Scholar]
- 20.Dijkhuizen RM, Asahi M, Wu O, Rosen BR, Lo EH. Delayed rt-PA treatment in a rat embolic stroke model: diagnosis and prognosis of ischemic injury and hemorrhagic transformation with magnetic resonance imaging. J Cereb Blood Flow Metab. 2001;21:964–971. doi: 10.1097/00004647-200108000-00009. [DOI] [PubMed] [Google Scholar]
- 21.Neumann-Haefelin T, Kastrup A, de Crespigny A, Ringer TM, Sun GH, Yenari MA, Moseley ME. MRI of subacute hemorrhagic transformation in the rat suture occlusion model. Neuroreport. 2001;12:309–311. doi: 10.1097/00001756-200102120-00025. [DOI] [PubMed] [Google Scholar]
- 22.Fagan SC, Garcia JH. Hemorrhagic transformation in focal cerebral ischemia: influence of time to artery reopening and tissue plasminogen activator. Pharmacotherapy. 1999;19:139–142. doi: 10.1592/phco.19.3.139.30932. [DOI] [PubMed] [Google Scholar]
- 23.Zhang RL, Chopp M, Zhang ZG, Divine G. Early (1 h) administration of tissue plasminogen activator reduces infarct volume without increasing hemorrhagic transformation after focal cerebral embolization in rats. J Neurol Sci. 1998;160:1–8. doi: 10.1016/s0022-510x(98)00155-5. [DOI] [PubMed] [Google Scholar]
- 24.Neumann-Haefelin C, Brinker G, Uhlenkuken U, Pillekamp F, Hossmann KA, Hoehn M. Prediction of hemorrhagic transformation after thrombolytic therapy of clot embolism: an MRI investigation in rat brain. Stroke. 2002;33:1392–1398. doi: 10.1161/01.str.0000014619.59851.65. [DOI] [PubMed] [Google Scholar]
- 25.Fisher M, Adams RD. Observations on brain embolism with special reference to the mechanism of hemorrhagic infarction. J Neuropathol Exp Neurol. 1951;10:92–94. [PubMed] [Google Scholar]
- 26.Jorgensen L, Torvik A. Ischaemic cerebrovascular diseases in an autopsy series, 2: prevalence, location, pathogenesis, and clinical course of cerebral infarcts. J Neurol Sci. 1969;9:285–320. doi: 10.1016/0022-510x(69)90078-1. [DOI] [PubMed] [Google Scholar]
- 27.Fisher CM. Pathological observations in hypertensive cerebral hemorrhage. J Neuropathol Exp Neurol. 1971;30:536–550. doi: 10.1097/00005072-197107000-00015. [DOI] [PubMed] [Google Scholar]
- 28.Asahi M, Asahi K, Wang X, Lo EH. Reduction of tissue plasminogen activator-induced hemorrhage and brain injury by free radical spin trapping after embolic focal cerebral ischemia in rats. J Cereb Blood Flow Metab. 2000;20:452–457. doi: 10.1097/00004647-200003000-00002. [DOI] [PubMed] [Google Scholar]
- 29.Gautier S, Petrault O, Gele P, Laprais M, Bastide M, Bauters A, Deplanque D, Jude B, Caron J, Bordet R. Involvement of thrombolysis in recombinant tissue plasminogen activator–induced cerebral hemorrhages and effect on infarct volume and postischemic endothelial function. Stroke. 2003;34:2975–2979. doi: 10.1161/01.STR.0000101914.62066.7B. [DOI] [PubMed] [Google Scholar]
- 30.Yamakawa H, Jezova M, Ando H, Saavedra JM. Normalization of endothelial and inducible nitric oxide synthase expression in brain microvessels of spontaneously hypertensive rats by angiotensin II AT1 receptor inhibition. J Cereb Blood Flow Metab. 2003;23:371–380. doi: 10.1097/01.WCB.0000047369.05600.03. [DOI] [PubMed] [Google Scholar]
- 31.Tuttle JL, Sanders BM, Burkhart HM, Fath SW, Kerr KA, Watson WC, Herring BP, Dalsing MC, Unthank JL. Impaired collateral artery development in spontaneously hypertensive rats. Microcirculation. 2002;9:343–351. doi: 10.1038/sj.mn.7800151. [DOI] [PubMed] [Google Scholar]
- 32.Barone FC, Price WJ, White RF, Willette RN, Feuerstein GZ. Genetic hypertension and increased susceptibility to cerebral ischemia. Neurosci Biobehav Rev. 1992;16:219–233. doi: 10.1016/s0149-7634(05)80182-4. [DOI] [PubMed] [Google Scholar]
- 33.Levy DE, Brott TG, Haley EC, Jr, Marler JR, Sheppard GL, Barsan W, Broderick JP. Factors related to intracranial hematoma formation in patients receiving tissue-type plasminogen activator for acute ischemic stroke. Stroke. 1994;25:291–297. doi: 10.1161/01.str.25.2.291. [DOI] [PubMed] [Google Scholar]