Abstract
Human induced pluripotent stem cell-derived cardiomyocytes (hiPSC-CM) and higher throughput platforms have emerged as potential tools to advance cardiac drug safety screening. This study evaluated the use of high bandwidth photometry applied to voltage-sensitive fluorescent dyes (VSDs) to assess drug-induced changes in action potential characteristics of spontaneously active hiPSC-CM. Human iPSC-CM from 2 commercial sources (Cor.4U and iCell Cardiomyocytes) were stained with the VSD di-4-ANEPPS and placed in a specialized photometry system that simultaneously monitors 2 wavebands of emitted fluorescence, allowing ratiometric measurement of membrane voltage. Signals were acquired at 10 kHz and analyzed using custom software. Action potential duration (APD) values were normally distributed in cardiomyocytes (CMC) from both sources though the mean and variance differed significantly (APD90: 229 ± 15 ms vs 427 ± 49 ms [mean ± SD, P < 0.01]; average spontaneous cycle length: 0.99 ± 0.02 s vs 1.47 ± 0.35 s [mean ± SD, P < 0.01], Cor.4U vs iCell CMC, respectively). The 10–90% rise time of the AP (Trise) was ∼6 ms and was normally distributed when expressed as 1/ in both cell preparations. Both cell types showed a rate dependence analogous to that of adult human cardiac cells. Furthermore, nifedipine, ranolazine, and E4031 had similar effects on cardiomyocyte electrophysiology in both cell types. However, ranolazine and E4031 induced early after depolarization-like events and high intrinsic firing rates at lower concentrations in iCell CMC. These data show that VSDs provide a minimally invasive, quantitative, and accurate method to assess hiPSC-CM electrophysiology and detect subtle drug-induced effects for drug safety screening while highlighting a need to standardize experimental protocols across preparations.
Keywords: methods, human induced pluripotent stem cell-derived cardiomyocytes, stem cells, action potential duration, voltage sensitive dye, drug screening
Improving the efficiency of drug development, while minimizing mid-to-late stage compound attrition, is a continuous focus of the pharmaceutical industry. A key component of these efforts involves early screening for cardiovascular liabilities, including delayed ventricular repolarization, a recognized surrogate marker for Torsade de Pointes (TdP) proarrhythmia. Since 2005, the International Conference on Harmonization’s (ICH) guideline S7B has driven the preclinical in vitro and in vivo assays used to assess cardiac liability during the drug discovery process. This guideline focuses on the potential for delayed repolarization and includes integrated risk assessments based on in vitro inhibition of the rapid component of the delayed inward rectifier (IKr, ie, hERG block) and in vivo QT measurements (ICH, 2005). Although the S7B guidelines (and the clinical counterpart E14) have been effective in preventing the withdrawal of new drugs from the marketplace due to TdP, the emphasis on screening for IKr current block, without considering the integrated effects of drugs on the multiple cardiac currents that define cardiac repolarization and excitability, has likely led to the unwarranted attrition of novel drug candidates (De Ponti et al., 2002).
Thus, a group of recognized cardiac safety experts (Cardiac Safety Research Consortium [CSRC], the Health and Environmental Sciences Institute [HESI], the US Food and Drug Administration [FDA] and other key opinion leaders) have proposed a new paradigm to assess the clinical potential for TdP risk. The group’s proposal, known as the Comprehensive in vitro Proarrhythmia Assay (CiPA) initiative, provides a multimodal approach to identifying proarrhythmic risk and takes advantage of advances in available cell systems and technologies. The CiPA initiative proposes cardiovascular screening based on functional responses to multiple cardiac ion channel currents coupled with in silico reconstructions that model drug effect on cardiac electrophysiology. These integrated effects are then to be confirmed through the use of human induced pluripotent stem cell-derived cardiomyocytes (hiPSC-CM) (Fermini et al., 2016; Sager et al., 2014), which offer a potential new tool to examine the effects of compounds on cardiac electrical activity. Indeed, perforated and whole cell patch clamp techniques have shown that hiPSC-CM demonstrate individual ionic currents and overall action potential (Bett et al., 2013) electrophysiology that are similar to human heart in terms of ionic currents such as IKr but with reduced expression of other currents (eg, the inward rectifier IK1) (Honda et al., 2011; Jonsson et al., 2012; Ma et al., 2011).
There are multiple commercial and academic sources of hiPSC-CM created using differing techniques and source materials. While their electrophysiology appears superficially similar, there will be differences in the electrical behavior that may determine the overall response to a drug. Therefore, it is important to develop techniques that allow routine characterization of the electrophysiology of different preparations to facilitate comparisons across different studies. Various approaches are available for this task. While considered the “gold standard” approach, single cell patch clamp electrophysiology is slow and technically demanding. Extracellular recordings obtained through multielectrode arrays (MEA) provide a measure of both the rate of electrical activity and the timing of repolarization, but lack information regarding morphological changes in the configuration of the AP and the actual end of repolarization; changes in both of these parameters are key components to understanding drug effects. In contrast, transmembrane voltage signals obtained using voltage-sensing optical techniques provides an efficient approach to assess the electrophysiological characteristics of hiPSC-CM at both baseline and following the addition of drug. Furthermore, voltage-sensitive fluorescent indicators have previously been used to accurately monitor electrical activity in cardiac cells (Dempsey et al., 2016; Klimas et al., 2016), and this capability offers significant potential when applied to monitoring electrical activity in hiPSC-CM. This combination of instrument plus indicator offers a robust platform on which to advance the use of hiPSC-CM within the proposed guidelines of CiPA.
The aim of the current study was to demonstrate the utility of the voltage-sensitive dye approach to characterize the baseline electrophysiology of spontaneously active hiPSC-CM and in particular determine the sensitivity of the technique to detect changes in depolarization and repolarization phases of the action potential. Using the voltage-sensitive fluorescent indicator di-4-ANEPPS in a medium/high throughput, multiwell screening platform (CellOPTIQ), we compared the electrophysiological characteristics of 2 commercially available hiPSC-CM cell lines, both of which are thought to represent a stable paradigm of human-derived cardiomyocytes. Cellular electrophysiology was assessed under baseline conditions and the relationship between rate (spontaneous or stimulated) and action potential duration (APD) was quantified. The effects of 3 drugs with known cardiac consequences (nifedipine, ranolazine, and E4031) were assessed across these commercially available cardiomyocyte preparations to demonstrate the ability to detect subtle but important differences in electrophysiological responses using the VSD approach. Our results demonstrate the feasibility of obtaining high resolution assessments using optical techniques to assess the electrophysiological effects of drugs on hiPSC-CM during compound discovery and in support of the CiPA paradigm.
EXPERIMENTAL PROCEDURE
Human induced pluripotent stem cell-derived cardiomyocyte cell culture
Cryopreserved hiPSC-CM (Cor.4U [Axiogenesis AG, Cologne, Germany] and iCell Cardiomyocytes [Cellular Dynamics International, Madison, WI]) were kept in liquid nitrogen until culture according to the instructions provided by the respective manufacturers; all studies were conducted using one batch of cells from either manufacturer. In both cases, the cells were cultured in 96-well glass-bottomed plates (MatTek, Ashland, Massachusetts) coated with fibronectin (10 µg/ml in PBS supplemented with Ca2+ and Mg2+) (Sigma, St. Louis, Missouri) in a humidified incubator at 37 °C for 3h. Cells were plated in approximately half of the wells for practical convenience and experimental timing. The cell density for Cor.4U and iCell Cardiomyocytes (iCell CMC) was 78,000 cells/cm2 (25,000 cells/well). The subsequent maintenance protocols followed manufacturer’s instructions and used the corresponding maintenance media (Cor.4U-maintenance media; iCell Cardiomyocytes Maintenance media). Experiments were performed between days 4–8 (Cor.4U) or days 10–15 (iCell CMC) as recommended by the manufacturers. Prior to beginning an experiment, cells were washed in serum-free media (SF media), the composition of which differed for the 2 cells types. Cor.4U cells were exposed to BMCC media (Axiogenesis); iCell CMC were washed in DMEM (Gibco, ThermoFisher Scientific, UK) supplemented with 10 mM galactose and 10mM sodium pyruvate. In both preparations, all wells showed regularly contracting layers of cells after plating and waiting the prerequisite number of days. Exclusion criteria were based in spontaneous rate limits in that only cells beating with a cycle length in the range of 0.5–5 s were deemed suitable for the study; based on these criteria, there were no exclusions from the study.
Transmembrane potential signals from hiPSC-CM using voltage sensitive dyes
Both sources of hiPSC-CM were loaded with 6 μM di-4-ANEPPS (Biotium, Hayward, California) in the above listed SF media for 1 min at room temperature. Cell cultures were then washed in indicator-free SF media and maintained in an incubator for 2 h before experimentation. The multiwell plate was placed in the environmentally controlled stage incubator (37 °C, 5% CO2, water-saturated air atmosphere) (Okolab Inc, Burlingame, California) of the CellOPTIQ platform (Clyde Biosciences Ltd, Glasgow, Scotland). The di-4-ANEPPS fluorescence signal was recorded from a 0.2 mm × 0.2 mm area using a 40× (NA 0.6) objective lens. Excitation wavelength was 470 ± 10 nm using a light-emitting diode (LED), and emitted light was collected by 2 photomultipliers (PMTs) at 510–560 nm and 590–650 nm, respectively. LED, PMT, associated power supplies, and amplifiers were supplied by Cairn Research Ltd (Kent UK). The 2 channels of fluorescence signals were digitized at 10 kHz, and the ratio of fluorescence (short wavelength/long wavelength) was used to assess the time course of the transmembrane potential independent of cell movement (Knisley et al., 2000). The di-4-ANEPPS staining and AP signals were retained for up to 6 h after initial treatment.
Drugs were supplied by Sigma Chemical Co. (St Louis, Missouri) and their identity and concentration were blinded from the laboratory personnel for the duration of the experiments and subsequent analysis. Baseline spontaneous electrical activity was recorded by capturing a 20 s segment of fluorescent signal prior to compound addition. Drugs were tested at 4 concentrations with matched vehicle controls for each concentration. A 20 s recording was then taken 30 min after exposure to the drug or vehicle with only one concentration applied/well. Offline analysis was performed using proprietary software (CellOPTIQ). The following (averaged) parameters were obtained from the AP recordings of 4 independent replicates: cycle length (CL, Hz); rise time (Trise, ms) between 10 and 90% of the AP amplitude, and AP durations (APD, ms) from 10% to 90% repolarization at 10% intervals.
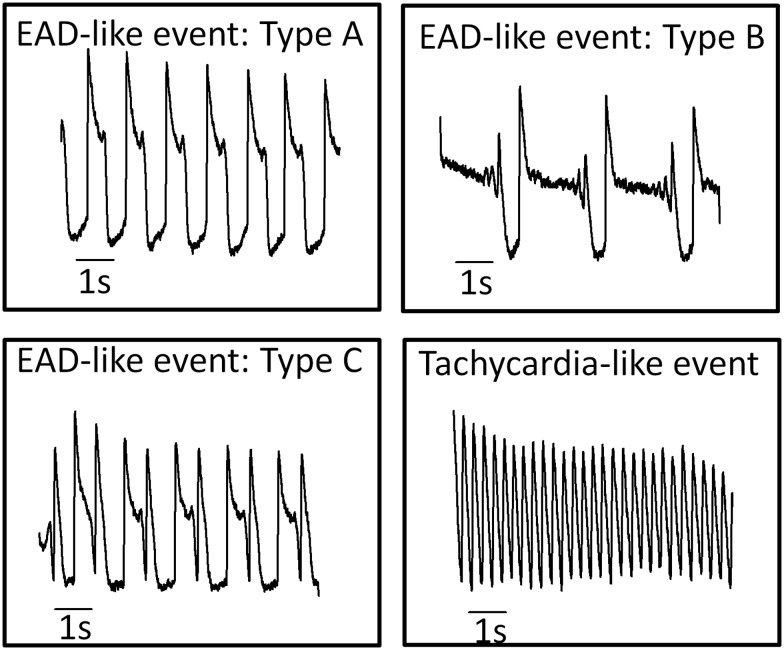
Frequently drugs caused changes in AP shape and spontaneous rate that were reminiscent of arrhythmias observed in whole hearts. For the purposes of discussion, these events are termed “cellular arrhythmias” to emphasize that they are not necessarily equivalent to arrhythmic events in the whole heart since the cellular/sub-cellular basis for these arrhythmia-like events in 2D cultures of hiPSC-CM is unclear. The observed trigger-like events recorded in this study were categorized based on the general waveform shape and timing of the trigger following the criteria shown in Figure 1. Analysis of cellular arrhythmias consisted of classifying and measuring the incidence of the early after depolarization-like (EAD) events (Types A, B, and C). Conversion to rapid spontaneous rates (tachycardia-like events) or drug-induced quiescence was also recorded.
FIG. 1.
Classification of “cellular arrhythmias”. Exemplar records of EAD-like events recorded from hiPSC-CM with distinct characteristics. Type A events are single transient depolarizations during the plateau phase of the AP. Type B events are oscillating or multiple depolarizing events during the plateau phase. Type C events are rapid depolarizing events during the late repolarization phase of the AP. Tachycardia-like events are sustained high frequency spontaneous activity (>2 Hz).
Field stimulation of hiPSC-CM
In separate experiments to assess the rate dependence of AP characteristics, cardiomyocytes were field stimulated using graphite electrodes (15 V, 2 ms pulse ∼ 50% above threshold) at a fixed rate using a MyoPacer (IonOptix Corp, Dublin, Ireland) in a 35 mm glass-bottomed Petri dish (MatTek). A silicone insert (Ibidi, Thistle Scientific Ltd, UK) was used within the 35 mm glass-bottomed Petri dish to minimize the number of cells per plate.
Data analysis and statistics
Kolmogorov–Smirnov tests were used to determine whether the data were normally distributed based on a least-squares fit to a normal function (Origin version 9, OriginLab Corp., Northampton, Massachusetts). Statistical analysis was performed using Dunnett's test following ANOVA to allow the comparison of a number of treatments with a single control. Statistical significance was designated as *P < .05, **P < .01, ***P < .001, ****P < .0001. The relationship between APD90 and CL or diastolic interval was fit to single or double exponential functions (Origin version 9).
RESULTS
Baseline Electrophysiological Characteristics of Cor.4U and iCell Cardiomyocytes Obtained Using Voltage-Sensitive Dyes
Baseline AP tracings from monolayers of spontaneously beating Cor.4U and iCell CMC are shown in Figure 2A as ∼9 s segments of fluorescence ratio signals (left panels) and as the averaged signals from 20 s recordings (right panels). Figure 2B shows histograms of data derived from approximately 160 separate 20 s traces of fluorescence ratio recordings from separate wells in each cell type (n = 4 plates of ∼40 wells/plate). The histograms of CL values, APD90, and diastolic interval (DI = CL – APD90) were fitted with a Gaussian function to illustrate that all 3 parameters were normally distributed for both cell types (Fig. 2B). Cor.4U cells (n = 161 wells) exhibited a spontaneous CL of 0.99 ± 0.02 s, an APD90 of 229 ± 15 ms with a CoV of 0.065, and a DI of 0.76 ± 0.13 s. iCell CMC (n = 159 wells) exhibited a CL of 1.47 ± 0.35 s, an APD90 of 427 ± 49 ms with a CoV of 0.166, and a DI of 1.07 ± 0.44 s. When comparing a subgroup of cells from both cell preparations across a common restricted range of CL values (0.8–1.2 s), the mean APD values were shorter in the Cor.4U group (mean APD ± SD: 234 ± 13 ms, n = 62) than the iCell CMC group (mean APD ± SD: 396 ± 26 ms, n = 22) but the CoV was similar (SD/mean 0.055 vs 0.066). The same result is obtained when using comparable ranges of DI (data not shown). None of the AP complexes displayed EAD-like signals or very high spontaneous rates (>2 Hz) under baseline conditions.
FIG. 2.
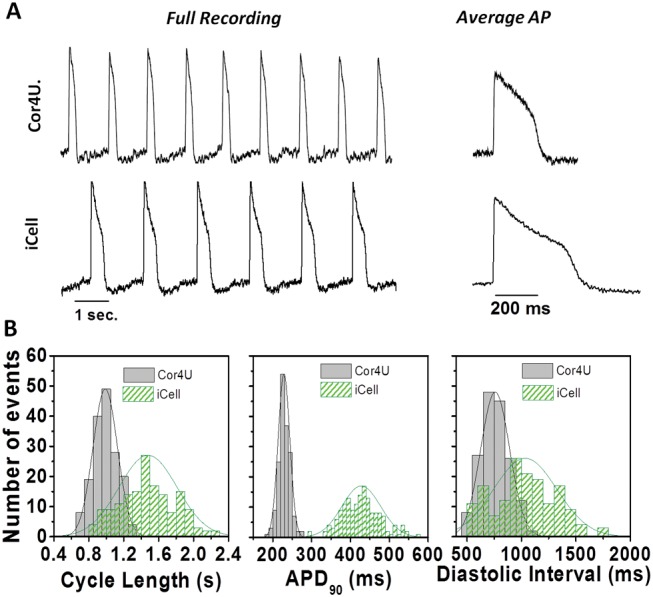
Baseline electrophysiological properties. Baseline action potential properties of Cor.4U cardiomyocytes (n = 168) and iCell Cardiomyocytes (n = 160) using the voltage-sensitive dye di-4-ANEPPS in combination with the optical platform CellOPTIQ. (A) Representative recordings of spontaneous activity in cellular monolayers in Cor.4U cells (upper panel) and iCell Cardiomyocytes (lower panel). Averaged APs from each cell population are also shown (right panels). (B) Histograms showing the distribution of values measured from individual wells from iCell Cardiomyocytes (n = 159) and Cor.4U cardiomyocytes (n = 161) along with the best-fit normal distribution and the associated mean and standard deviation values for the following parameters: (i) cycle length: iCell Cardiomyocytes = 1.5 ± 0.5 s; Cor.4U = 0.99 ± 0.14 s. (ii) APD90: iCell Cardiomyocytes = 427 ± 49; Cor.4U = 229 ± 15 ms. (iii) diastolic interval: iCell Cardiomyocytes = 1.07 ± 0.44 s; Cor.4U = 0.76 ± 0.13 s.
Rate Dependent Changes in APD
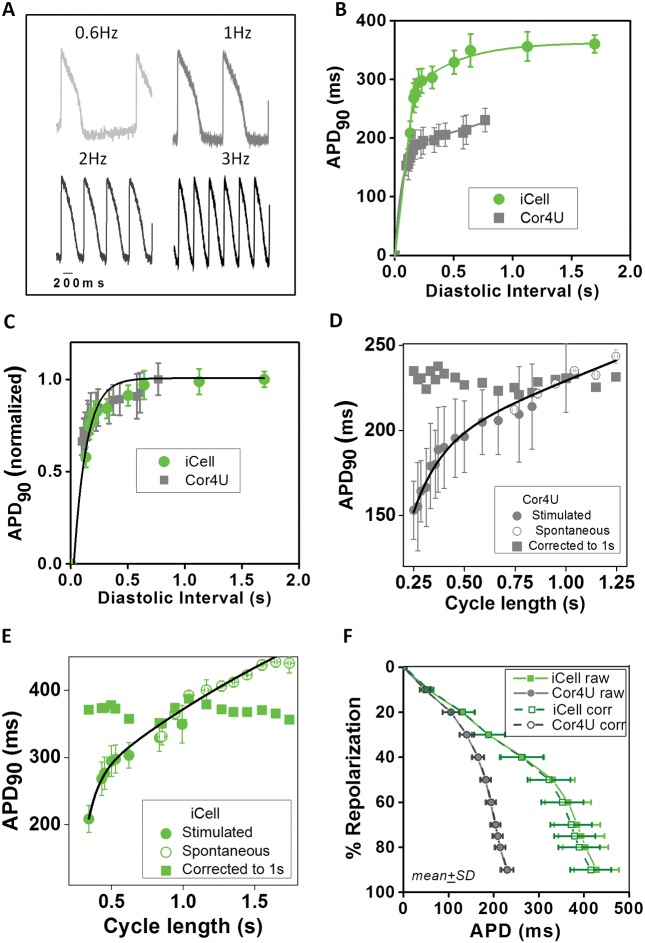
The dependence of APD on CL (and DI) was measured across cardiomyocytes. Figure 3A shows representative fluorescence ratio recordings from iCell CMC exposed to increasing field stimulation rates of 0.6, 1, 2, and 3 Hz. The relationship between DI and APD90 across cardiomyocytes is shown in Figure 3B (mean data and the best fit exponential curve). Figure 3C shows the relationship between APD and DI for hiPSC-CM after normalizing the APD90 to the maximum value. As shown in Figure 3C, the 2 data sets show considerable overlap. Over this limited range of DI values the data could be fit to a single exponential function with a rate constant (tau) equal to approximately 0.12 s−1 (Cor.4U tau = 0.119 ± 0.006 s−1; iCell CMC tau = 0.12 ± 0.012 s−1). A comparable relationship was observed with APD30 (Cor.4U tau = 0.118 ± 0.004 s−1; iCell CMC tau = 0.109 ± 0.03 s−1) and APD60 (Cor.4U tau = 0.103 ± 0.022 s−1; iCell CMC tau = 0.11 ± 0.012 s−1). This data indicates that decreased DI causes a parallel decrease in APD across the complete repolarization phase of the AP with sensitivity similar to that observed in adult ventricular cardiomyocytes (O'Hara et al., 2011).
FIG. 3.
Rate dependence of action potential duration. (A) Example AP signals from iCell Cardiomyocytes in response to field stimulation at 0.6, 1, 2, and 3 Hz. (B) Mean APD90 (±SEM, n = 10) data describing the rate dependence of APD90 based on recordings from Cor.4U (grey points) and iCell (green points) cardiomyocytes in response to the range of stimulation rates described above. The solid lines through the data are a best-fit single exponential fits to the data: APD = APD0 [1 − exp (DI/tau)], where APD0 is the APD at maximum diastolic interval (DI). (C) Normalization of APD90 values are shown in panel B relative to APDmax at the longest DI. Solid line is the best-fit exponential: APD = 1 − exp(DI/0.12). (D) Relationship between average (±SD) of APD90 and cycle length (CL) during stimulation (solid circles) and during spontaneous activity (open circles) in Cor.4U cells. The solid line is the best-fit double exponential function: APD90 = APD0 + A1.exp (CL − CL0)/tau1 + A2.exp (CL − CL0)/tau2; where APD0 = 1.28 s, CL0 = 0.007, A1 = −1.45, tau1 = 0.0013, A2 = −1069, tau2 = 0.021; r2 = 0.93, P < .01. (E) Relationship between average (±SD) of APD90 and CL during stimulation (solid circles) and during spontaneous activity (open circles) in iCell Cardiomyocytes. The solid line is the best-fit double exponential function: APD90 = APD0+A1.exp (CL − CL0)/tau1 + A2.exp (CL − CL0)/tau2; where APD0 = 0.745, CL0 = 0.780, A1 = −0.177, t1 = 0.0007;A2 = −404.9, tau2 = 0.0027; r2 = 0.95 P<.01. (F) Average baseline repolarization profile for the 2 cell types corrected for differences in spontaneous rates (mean ± SD).
Figure 3D and E are plots of stimulated and spontaneous values of APD90 versus CL. The data from spontaneous records were taken from 100 ms bins across the range of spontaneous rates. The solid line is the best fit to a double exponential function for both data sets. This function was subsequently used to correct all the APD data obtained from hiPSC-CM in this study to that of a constant CL of 1 s. Correction of the APD90 values to a CL of 1 s predicted an APD90 of 229 ± 13 s for Cor.4U cells and an APD90 of 370 ± 30 s for iCell CMC. Using this correction, the CoV for APD90 was reduced when compared to uncorrected spontaneous recordings for both Cor.4U and iCell CMC (CoV = 0.056 vs 0.081, Cor.4U vs iCell CMC, respectively). These relationships were used to correct the complete range of APD values (10–90%) for the changes in spontaneous CL (see Supplementary Material online).
The average repolarization profile across cardiomyocytes is shown in Figure 3F, highlighting the ability of VSDs to detect subtle differences in AP morphology. The longer APDs observed in iCell CMC are due to a prolonged plateau phase (phase 2) of the AP. The curves described by points joined by dotted lines are the calculated average repolarization values corrected to a 1 s CL based on the relationships described in Figure 3B. After correction for the different intrinsic rates, the repolarization time course during AP plateau remained significantly slower in iCell CMC than in Cor.4U cells. The repolarization profile of the 2 cell types diverged at 20% of amplitude with Cor.4U cells repolarizing more rapidly until reaching approximately 70% of amplitude. Terminal repolarization (70–90%) was comparable in both cell types. A summary of the baseline AP characteristics is shown in a table in the Supplementary Material online.
AP Rise Time Characteristics
Figure 4A shows the distribution of AP rise times (Trise) from the 2 cardiomyocyte preparations. Rise time values showed a skewed (non-normal) distribution about a median value of approximately 5 ms. Previous work has shown a direct relationship between conduction velocity and (dV/dt)max2 (Berecki et al., 2010). Since Trise is inversely related to dV/dt, a more appropriate upstroke velocity index (UVI) is the quantity 1/(). UVI was normally distributed in both cell types (Fig. 4B) and showed similar values for both cell types (0.024 ± 0.01 ms−2 and 0.029 ± 0.09 ms−2 for Cor.4U and iCell CMC, respectively).
FIG. 4.
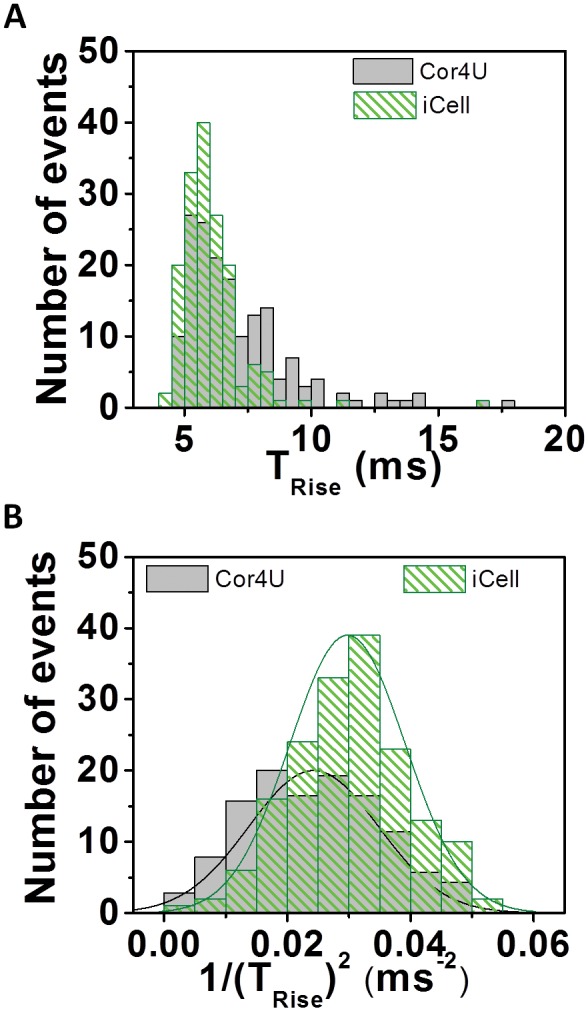
Action potential rise time characteristics. (A) Trise distribution profile from averaged recordings of di-4-ANEPPS ratio recordings from Cor.4U (n = 168) and iCell Cardiomyocytes (n = 160). Results expressed as median ± SD. iCell Cardiomyocytes = 5.7 ± 1.3 ms; Cor.4U = 6.45 ± 2.2 ms. Transforming the data to UVI (1/Trise)2 results in a normal distribution of the data. Results expressed as mean ± SD. iCell Cardiomyocytes = 0.029 ± 0.01 ms−1; Cor.4U = 0.024 ± 0.01 ms−1. (B) Indicated mean and standard deviation values are based on the best fit normal distribution.
Effects of Drugs on hiPSC-CM Electrophysiology
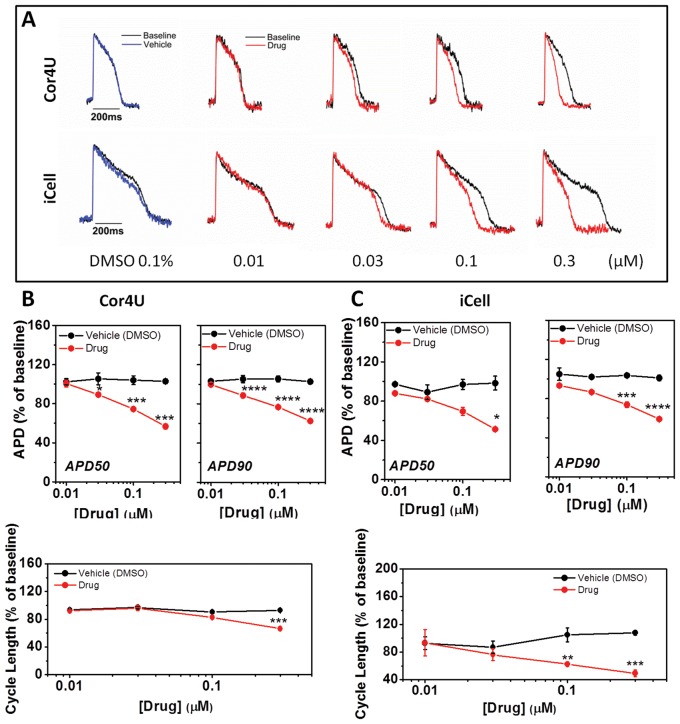
The individual records show that the calcium channel blocker nifedipine (0.01–0.3 μM) caused a dose-dependent shortening of APD in both cardiomyocyte populations (Fig. 5A). The average data, expressed as a change in the APD50, APD90, and CL, were plotted against concentration to show the relative effect of nifedipine on the 2 cell lines. The highest concentration of nifedipine caused a comparable decrease in APD50 and APD90 in both groups. Furthermore, nifedipine shortened the CL in both cell types (Fig. 5B and C, lower panels). However, the effects of lower concentrations of nifedipine on APD (50 and 90) did not reach significance in iCell CMC. There were no significant effects of nifedipine on the upstroke (UVI) of the AP in either cell type (data not shown).
FIG. 5.
Effect of nifedipine on action potential characteristics. (A) Example recordings from cells exposed to nifedipine. (B) The average relative (±SD, n = 4) change of APD50, APD90, and CL in response to nifedipine in Cor.4U cells with values corrected for differences in spontaneous rate. (C) Relative change of APD50, APD90, and CL in response to nifedipine in iCell Cardiomyocytes with values corrected for differences in spontaneous rate.
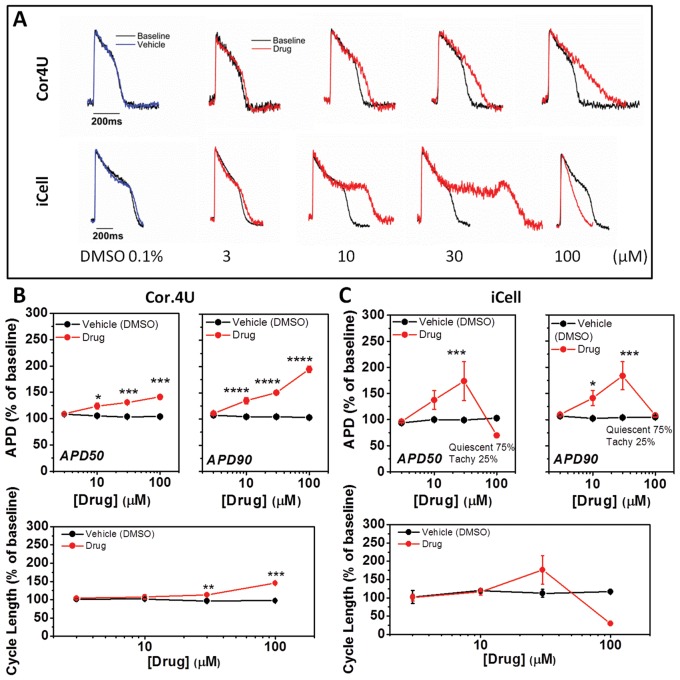
Next, we examined the effect of the late sodium current inhibitor ranolazine on the AP characteristics. Inhibition of late sodium current would be expected to shorten the AP, but the individual records show that increasing concentrations (3–100 μM) of ranolazine caused a dose-dependent increase only in APD in both Cor.4U and iCell CMC (Fig. 6). On average, Cor.4U cells displayed a significant dose-dependent lengthening of the AP based on APD50 and APD90 as well as a lengthening of the CL at 10, 30, and 100 μM ranolazine (Fig. 6A and B). At higher concentrations, no phases of rapid intrinsic rate were observed in Cor.4U cells. In iCell CMC, the response to ranolazine showed a similar trend; 30 μM ranolazine significantly increased the APD90 (Fig. 6C) and 100 μM inhibited spontaneous activity in 3 of 4 wells and also caused brief, frequent APs (>2 Hz) in the other well (Fig. 6A), these are labeled as “Tachy” in Figure 6C. There were no significant effects of ranolazine on the upstroke (UVI) of the AP at concentrations that did not affect intrinsic rate (≤30 μM) (data not shown).
FIG. 6.
Effect of ranolazine on action potential characteristics. (A) Example recordings from cells exposed to ranolazine. (B) The average relative (±SD, n = 4) change of APD50, APD90, and CL in response to ranolazine in Cor.4U cells with values corrected for differences in spontaneous rate. (C) Relative change of APD50, APD90, and CL in response to ranolazine in iCell Cardiomyocytes with values corrected for differences in spontaneous rate. Note in some instances SD limits were obscured by point size.
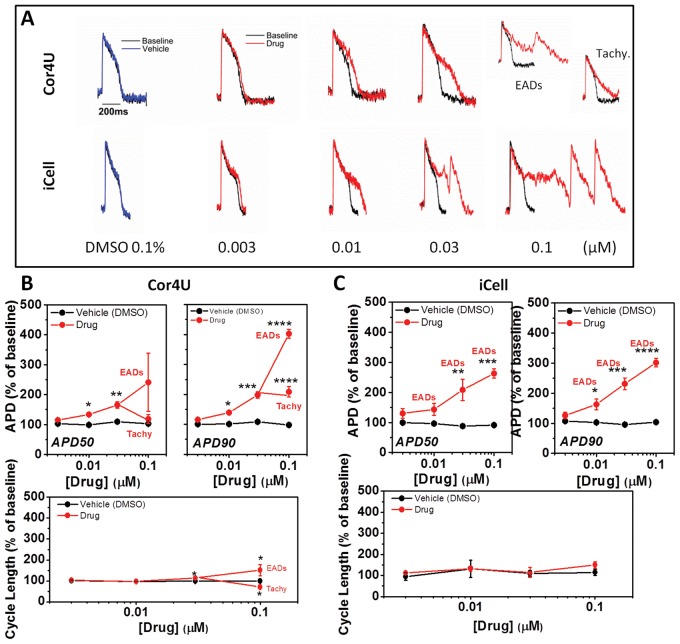
As shown in Figure 7A, the 2 cell types exhibited similar sensitivities towards E4031 at low drug concentrations (0.003 and 0.01 μM), which, on average, significantly prolonged APD90 to approximately 150 and 200% of control values in Cor.4U and iCell CMC, respectively (Fig. 7B and C). At higher concentrations (0.03 and 0.1 μM), iCell CMC exhibited EAD-like events (ie, secondary depolarizing events during the plateau phase of the AP). In one well, the drug caused a sustained increase in rate to above 2 Hz. EAD-like events were observed in Cor.4U cells only at the highest concentration (0.1 μM) of E4031. There were no significant effects of E4031 on the upstroke (UVI) of the AP (data not shown) or induction of quiescence of spontaneous rate in either iCELL CMC or Cor.4U cells.
FIG. 7.
Effect of E4031 on action potential characteristics. (A) Example recordings from cells exposed to E4031. (B) The average relative (±SD, n = 4) change of APD50, APD90, and CL in response to E4031 in Cor.4U cells with values corrected for differences in spontaneous rate. (C) Relative change of APD50, APD90, and CL in response to E4031 in iCell Cardiomyocytes with values corrected for differences in spontaneous rate. Note in some instances SD limits are obscured by point size.
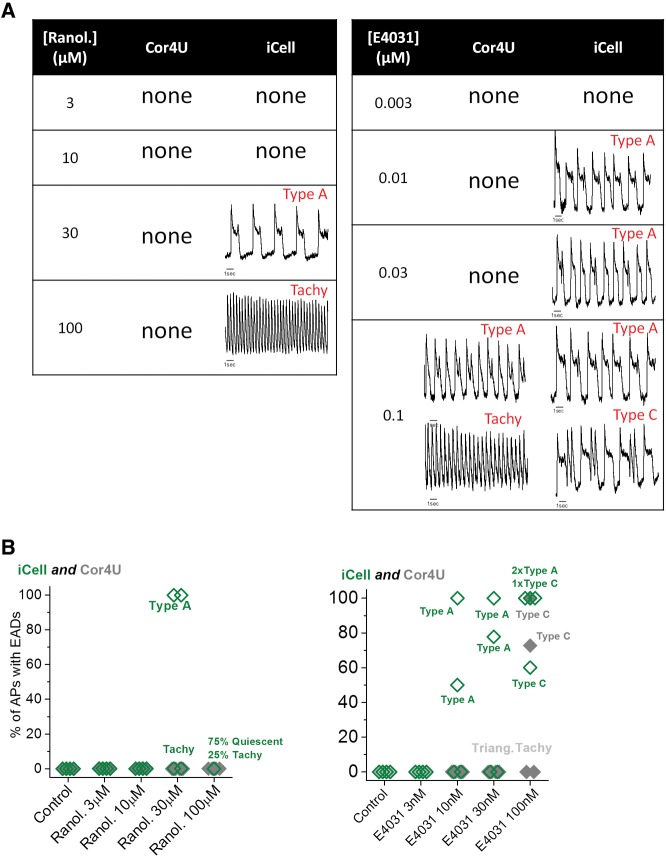
Figure 8 summarizes all 3 drug responses for the 2 cell types by displaying the average repolarization profiles corrected to a 1 s CL assuming the drugs have no marked rate dependence to their action (see Supplementary Material online). The diagram illustrates that, despite differences in their initial repolarization profile, the overall effects of the drugs were similar in both cell lines. Nifedipine shortened all phases of repolarization to a similar extent, while ranolazine and E4031 prolonged the late phase of the AP with the involvement of EAD-like behavior, generating voltage transients that started during the AP plateau. A summary of the arrhythmia-like events and rate changes developed by the 2 cell types in response to ranolazine and E4031 is shown in Figure 9. A range of EAD-like behavior was observed and categorized into 2 types of responses: “type A” EADs are single rapid depolarizing events during phase 2 (plateau) of the AP, and “type C” EADs are a rapid depolarization late in the repolarization phase (phase 3). Since arrhythmic events did not occur at each AP, the percentage of APs with EAD-like events was plotted. Furthermore, some traces displayed both type A and type C complexes. Abrupt increases in the intrinsic rate to >2 Hz also occurred as an arrhythmic-like event in hiPSC-CM; these events were labeled as “Tachy”, and examples are shown in Figure 9A for both drugs. Figure 9B compares the relative incidence of both types of arrhythmic events for ranolazine and E4031. Type A and Tachy arrhythmias were evident in iCell CMC at 30 μM ranolazine, while the cells were either electrically quiescent or displaying a high intrinsic rate of APs (Tachy) at 100 μM. Ranolazine did not elicit cellular arrhythmias in Cor.4U cells even at the highest concentration tested (100 μM). E4031 elicited EAD-like events in some wells of iCell CMC at 10 nM and with a higher incidence at 30 nM. With 100 nM E4031, iCell CMC displayed Tachy-like behavior and 2 forms of EAD behavior (Type A & C, Fig. 1). In contrast, Cor.4U cells displayed EAD-like and Tachy-like behavior only at 100 nM E4031. The rise time of the AP was not significantly altered by any drug used in this study at concentrations that did not display EAD-like or Tachy-like arrhythmias.
FIG. 8.
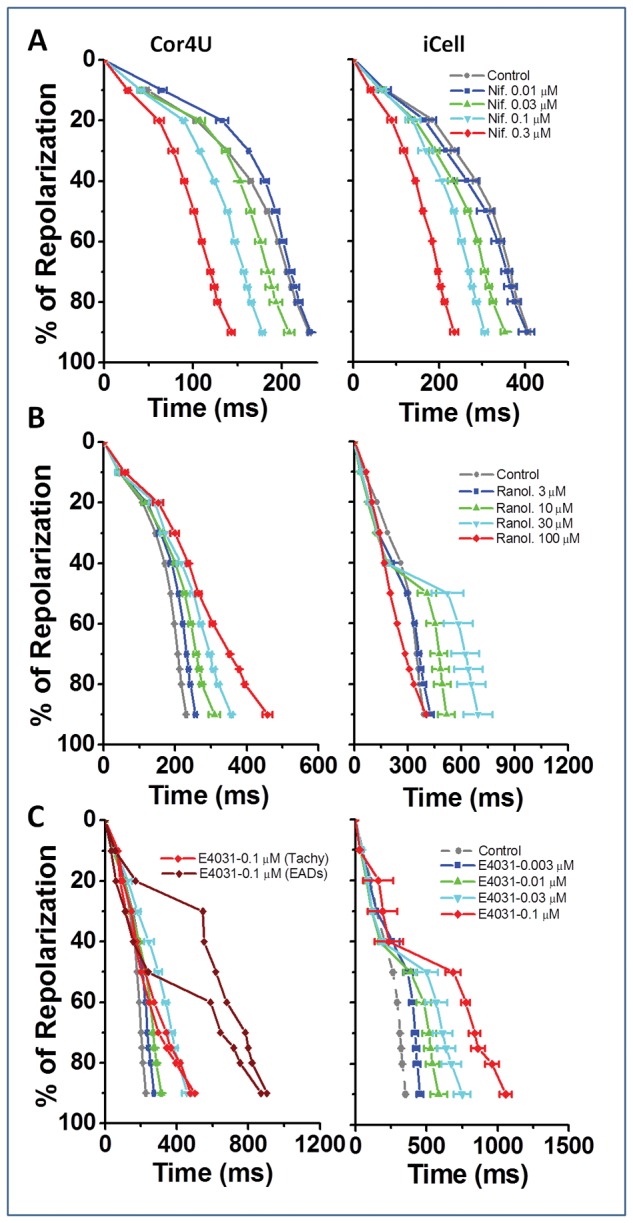
Repolarization profiles (nifedipine, ranolazine, and E4031). Average rate corrected repolarization profiles for Cor.4U and iCell Cardiomyocytes in response to increasing concentrations of (i) nifedipine, (ii) ranolazine, and (iii) E4031 (mean ± SD, n = 4).
FIG. 9.
Incidence of cellular arrhythmias (Ranolazine and E4031). Summary of the presence, incidence, and type of cellular arrhythmias observed in Cor.4U and iCell Cardiomyocytes following ranolazine and E4031. (A) Presence and type of cellular arrhythmia (with exemplars). (B) Plot of drug concentration versus incidence of cellular arrhythmia with each point representing incidence in 20 s recording from a single well.
DISCUSSION
This study examines the use of the VSD di-4-ANEPPS to record changes in the membrane potential of hiPSC-CM from 2 commercial sources. The data demonstrate the feasibility of high bandwidth photometry applied to a multiwell plate format for reporting cellular electrical activity of cultured cardiomyocytes and for detecting drug-induced changes in cardiomyocyte electrophysiology. Furthermore, the data show that the VSD technology is sensitive and robust enough to quantify differences pre- and post-drug application. The subsequent analysis provides additional details on varying types of cellular arrhythmias, describes techniques for optimizing assay sensitivity, and underscores the utility of detecting changes in ventricular repolarization and depolarization.
Whereas the di-4-ANEPPS signals recorded from Cor.4U and iCell CMC exhibited distinct electrophysiological characteristics, the APD and CL values recorded from different culture wells were similar and showed a variability that was normally distributed in both cell types. The mean APD and spontaneous CL values (and associated coefficients of variation [CoV]) recorded in iCell CMC were significantly greater than those of Cor.4U cells whereas the time for the AP upstroke was similar in both cell types. The explanation for the difference in the mean APD and CL between the 2 cell types is unknown but may be due to: (i) differences in the type, magnitude, and kinetics of the ionic conductances present in the dominant cardiomyocyte subtypes between the 2 cell lines (Paci et al., 2013); (ii) differences in the range of cell types within the culture (Bett et al., 2013; Du et al., 2015; Scheel et al., 2014); and (iii) differences in the composition of the incubation medium. As data do not exist to allow for comparison between iCell CMC and Cor.4U cells for these parameters, the differences between the electrophysiological phenotypes (including differences in the AP plateau) is unclear and the potential difference in the range of cardiac cell types in the 2 sources cannot be determined. In addition, the current studies were conducted using different proprietary incubation media as recommended by the respective manufacturers. Since the composition of these solutions is not published, small differences in extracellular potassium, sodium, magnesium, and calcium ions, pH, or glucose may contribute to the observed differences in APD and CL. Thus, quantifying the relationship between APD parameters and CL would allow correction for changes purely associated with rate caused either by altered baseline rate or by drug-induced changes and, therefore, would improve the ability to resolve changes in mean APD.
The rate dependence of APD90 approximates to an exponential decay when examined at DI values less than 1 s. The APD90 measurements for iCell CMC (370 ms) and Cor.4U cells (220 ms) at the longer DI values do not approximate the APD90 value reported for human ventricle (300 ms) (O'Hara et al., 2011). Despite this difference between hiPSC-CM and adult ventricle in maximum APD90, the shape of the rate dependence of APD was similar (Fig. 3C), suggesting that although maximum APD values in both cell types are different from adult human cardiac cells, the relative sensitivity of the time-dependent processes underlying the rate dependence of the APD are similar. The variation of APD with CL in both stimulated and spontaneously active cells across a large range of CL values allowed the development of a rate correction formula that applied across a wide range of CLs. After correction, the CoV of APD90 was reduced for both Cor.4U and iCell CMC when compared to uncorrected spontaneous recordings; after rate correction, iCell CMC CoV was comparable to Cor.4U cells (0.08 vs 0.05).
When assessing the utility of VSDs to quantify drug-induced changes in cardiomyocyte electrophysiology, Cor.4U and iCell CMC demonstrated the expected responses to 3 cardio-active compounds. The L-type calcium channel (ICa,L) blocker nifedipine caused dose-dependent shortening of the APD and a decrease in the intrinsic CL. Therefore, these data reflect the well-established effect of shortening of the ventricular APD in response to ICa,L block that is seen across multiple mammalian species (Coraboeuf and Nargeot, 1993) and in hiPSC-CM (Peng et al., 2010) as well as the ability of VSDs to detect and quantify such changes. The relative effects on APD at equivalent concentrations of the drug were comparable in both cell types. Furthermore, the IC50 of nifedipine to the isolated channel is 0.2–0.3 μM (Peng et al., 2010), which is comparable to the maximum concentration used in the study. Indeed, 0.3 μM nifedipine shortened APD90 to approximately 50% of control values in both cell types. This sensitivity is also in line with estimates of the effective therapeutic plasma concentration (ETPC) of nifedipine (3–8 nM) (Redfern et al., 2003).
Ranolazine blocks the late sodium current [INa(late)] with an IC50 of 7 μM in a heterologously expressed human LQT3 mutant sodium channel system (Rajamani et al., 2009) and an IC50 of 6.5 μM in failing isolated canine ventricular myocytes (Undrovinas et al., 2006). Higher ranolazine concentrations inhibit the rapidly inactivating potassium conductance (IKr), ICa,L, and the slowly inactivating potassium conductance (IKs) (Schram et al., 2004; Song et al., 2004). In vitro, ranolazine does not affect the APD of dog or human ventricular papillary muscles while it significantly shortened APD in canine Purkinje fibers (Szel et al., 2011). Clinically, ranolazine slightly prolongs the QT interval in healthy subjects (Vicente et al., 2015) and in patients with angina (Chaitman, 2004). Therefore, while inhibition of INa(late) alone would be expected to shorten APD, neither cardiomyocyte preparation we studied showed APD shortening at the approximate ETPC (0.6–5 μM) (Lu et al., 2015), which is qualitatively consistent with clinical ECG findings. It is possible that the less polarized resting membrane potentials of hiPSC-CM (compared to adult heart) leads to inactivation of a significant amount of both early and late INa components, potentially minimizing the magnitude of INa(late) during the plateau. The mechanisms responsible for the complex cellular proarrhythmia observed with some myocytes at supratherapeutic exposures of ranolazine are unclear.
The selective IKr blocker E4031 appeared to have qualitatively similar effects on the APD in iCell CMC and Cor.4U cells. As with ranolazine, VSDs were able to distinguish between multiple EAD-like events, which were evident at lower concentrations of E4031 in iCell CMC. The IC50 for block of IKr (current) by E4031 is approximately 10 nM (Zhou et al., 1998), the concentration that elicits APD prolongation to approximately140% of control in both cell types in this study.
In summary, both Cor.4U and iCell CMC showed similar responses to each drug: the relative effects of nidefipine on APD10–90% are similar despite the differences in baseline APD; ICa,L block caused a shortening of APD from the earliest phase (phase 2) of repolarization; and IKr inhibition with either ranolazine or E4031 prolonged APD in the late phase of repolarization, consistent with the role of IKr in phase 3 repolarization in the adult ventricular myocyte (Gintant, 2000). Both cardiomyocyte populations showed cellular arrhythmias in the presence of hERG channel blockers; the high variability of the late repolarization phase in these recordings, particularly from iCell CMC, was caused by the presence of AP complexes with variable and prolonged plateau phases without overt EADs. These data reflect similar results reported both in adult hearts (Thomsen et al., 2006) and hiPSC-CM (Jonsson et al., 2010), showing that inhibition of IKr under conditions of a longer APD generates a higher incidence of arrhythmic events, although this has yet to be systematically studied in hiPSC-CM. EAD-like events occurred across cardiomyocytes when APD90 values exceeded approximately 500 ms. These APD90 values were observed only at the highest concentrations of ranolazine and E4031 in Cor.4U cells whereas an APD90 of greater than 500 ms was achieved at considerably lower concentrations of ranolazine and E4031 in iCell CMC. The differences in drug response in the 2 hiPSC-CM sources are comparable to differences observed in heart cells from different small animal models and highlight the need to calibrate electrophysiological responses with known standards. Further, these observed differences in responses are useful to define assay sensitivity and place results in context of clinical findings and do not reflect on the utility of either myocyte preparation.
These results demonstrate that the VSD platform offers an alternative to glass microelectrode and MEA techniques in the detection of cardiotoxic effects and testing of novel lead compounds (Kraushaar et al., 2012). They further demonstrate that quantitative differences exist between hiPSC-CMs from different sources and that resulting data must be interpreted and benchmarked in accordance with the characteristics of a particular cell source. The VSD approach is similar to glass microelectrode studies in that it provides details on effects throughout repolarization as manifest by changes in morphology of the AP (eg, APD30, APD60, and APD90) (Peng et al., 2010; Scheel et al., 2014) and APD triangulation, a recognized hallmark of proarrhythmia (Hondeghem, 1994); thus, providing a more detailed assessment of repolarization instability as compared to MEA techniques. Furthermore, being able to resolve the plateau phase directly in VSD signals makes detection and identification of EAD-like events easier than with MEA signals, which adds value in assessing proarrhythmic liabilities in the evolving CiPA paradigm. Overall, the simplicity of optical measurements with VSDs provides a medium-to-high throughput technology that allows for the use of hiPSC-CM to aid in drug discovery and improves early detection of potential cardiac liability in compound development.
Supplementary Material
ACKNOWLEDGMENTS
The manuscript was prepared with medical writing support from K.R. Doherty, MS.
FUNDING
Clyde Biosciences Ltd and AbbVie (USA). Maria P. Hortigon-Vinagre and Victor Zamora are recipients of a postdoctoral fellowship from Fundacion Alfonso Martin Escudero, Spain.
SUPPLEMENTARY DATA
Supplementary data are available online at http://toxsci.oxfordjournals.org/.
REFERENCES
- Berecki G., Wilders R., de Jonge B., van Ginneken A. C., Verkerk A. O. (2010). Re-Evaluation of the action potential upstroke velocity as a measure of the Na+ current in cardiac myocytes at physiological conditions. PLoS One 5, e15772.. [DOI] [PMC free article] [PubMed] [Google Scholar]
- Bett G. C., Kaplan A. D., Lis A., Cimato T. R., Tzanakakis E. S., Zhou Q., Morales M. J., Rasmusson R. L. (2013). Electronic “Expression” of the inward rectifier in cardiocytes derived from human-induced pluripotent stem cells. Heart Rhythm 10, 1903–1910. [DOI] [PMC free article] [PubMed] [Google Scholar]
- Chaitman B. R. (2004). Efficacy and safety of a metabolic modulator drug in chronic stable angina: review of evidence from clinical trials. J. Cardiovasc. Pharmacol. Ther. 9 Suppl 1, S47–S64. [DOI] [PubMed] [Google Scholar]
- Coraboeuf E., Nargeot J. (1993). Electrophysiology of Human Cardiac Cells. Cardiovasc. Res. 27, 1713–1725. [DOI] [PubMed] [Google Scholar]
- De Ponti F., Poluzzi E., Cavalli A., Recanatini M., Montanaro N. (2002). Safety of non-antiarrhythmic drugs that prolong the Qt interval or induce torsade de pointes: an overview. Drug Saf. 25, 263–286. [DOI] [PubMed] [Google Scholar]
- Dempsey G. T., Chaudhary K. W., Atwater N., Nguyen C., Brown B. S., McNeish J. D., Cohen A. E., Kralj J. M. (2016). Cardiotoxicity screening with simultaneous optogenetic pacing, voltage imaging and calcium imaging. J. Pharmacol. Toxicol. Methods. doi: 10.1016/j.vascn.2016.05.003. [DOI] [PubMed] [Google Scholar]
- Du D. T., Hellen N., Kane C., Terracciano C. M. (2015). Action potential morphology of human induced pluripotent stem cell-derived cardiomyocytes does not predict cardiac chamber specificity and is dependent on cell density. Biophys. J. 108, 1–4. [DOI] [PMC free article] [PubMed] [Google Scholar]
- Fermini B., Hancox J. C., Abi-Gerges N., Bridgland-Taylor M., Chaudhary K. W., Colatsky T., Correll K., Crumb W., Damiano B., Erdemli G., et al. (2016). A new perspective in the field of cardiac safety testing through the comprehensive in vitro proarrhythmia assay paradigm. J. Biomol. Screen 21, 1–11. [DOI] [PubMed] [Google Scholar]
- Gintant G. A. (2000). Characterization and functional consequences of delayed rectifier current transient in ventricular repolarization. Am. J. Physiol. Heart Circ. Physiol. 278, H806–H817. [DOI] [PubMed] [Google Scholar]
- Honda M., Kiyokawa J., Tabo M., Inoue T. (2011). Electrophysiological characterization of cardiomyocytes derived from human induced pluripotent stem cells. J. Pharmacol. Sci. 117, 149–159. [DOI] [PubMed] [Google Scholar]
- Hondeghem L. M. (1994). Computer aided development of antiarrhythmic agents with class iiia properties. J. Cardiovasc. Electrophysiol. 5, 711–721. [DOI] [PubMed] [Google Scholar]
- ICH (2005). S7b, the Nonclinical Evaluation of the Potential for Delayed Ventricular Repolarization (Qt Prolongation) by Human Pharmaceuticals. Available at: http://www.ich.org/fileadmin/Public_Web_Site/ICH_Products/Guidelines/Safety/S7B/Step4/S7B_Guideline.pdf. Accessed 2016. [PubMed]
- Jonsson M. K., Duker G., Tropp C., Andersson B., Sartipy P., Vos M. A., van Veen T. A. (2010). Quantified proarrhythmic potential of selected human embryonic stem cell-derived cardiomyocytes. Stem Cell Res. 4, 189–200. [DOI] [PubMed] [Google Scholar]
- Jonsson M. K., Vos M. A., Mirams G. R., Duker G., Sartipy P., de Boer T. P., van Veen T. A. (2012). Application of human stem cell-derived cardiomyocytes in safety pharmacology requires caution beyond herg. J. Mol. Cell Cardiol. 52, 998–1008. [DOI] [PubMed] [Google Scholar]
- Klimas A., Ambrosi C. M., Yu J., Williams J. C., Bien H., Entcheva E. (2016). Optodyce as an automated system for high-throughput all-optical dynamic cardiac electrophysiology. Nat. Commun. 7, 11542.. [DOI] [PMC free article] [PubMed] [Google Scholar]
- Knisley S. B., Justice R. K., Kong W., Johnson P. L. (2000). Ratiometry of transmembrane voltage-sensitive fluorescent dye emission in hearts. Am. J. Physiol. Heart Circ. Physiol. 279, H1421–H1433. [DOI] [PubMed] [Google Scholar]
- Kraushaar U., Meyer T., Hess D., Gepstein L., Mummery C. L., Braam S. R., Guenther E. (2012). Cardiac safety pharmacology: from human Ether-a-Gogo related gene channel block towards induced pluripotent stem cell based disease models. Expert Opin. Drug Saf. 11, 285–298. [DOI] [PubMed] [Google Scholar]
- Lu H. R., Whittaker R., Price J. H., Vega R., Pfeiffer E. R., Cerignoli F., Towart R., Gallacher D. J. (2015). High throughput measurement of Ca++ dynamics in human stem cell-derived cardiomyocytes by kinetic image cytometery: a cardiac risk assessment characterization using a large panel of cardioactive and inactive compounds. Toxicol. Sci. 148, 503–516. [DOI] [PubMed] [Google Scholar]
- Ma J., Guo L., Fiene S. J., Anson B. D., Thomson J. A., Kamp T. J., Kolaja K. L., Swanson B. J., January C. T. (2011). High purity human-induced pluripotent stem cell-derived cardiomyocytes: electrophysiological properties of action potentials and ionic currents. Am. J. Physiol. Heart Circ. Physiol. 301, H2006–H2017. [DOI] [PMC free article] [PubMed] [Google Scholar]
- O'Hara T., Virag L., Varro A., Rudy Y. (2011). Simulation of the undiseased human cardiac ventricular action potential: model formulation and experimental validation. PLoS Comput. Biol. 7, e1002061.. [DOI] [PMC free article] [PubMed] [Google Scholar]
- Paci M., Hyttinen J., Aalto-Setala K., Severi S. (2013). Computational models of ventricular- and atrial-like human induced pluripotent stem cell derived cardiomyocytes. Ann. Biomed. Eng. 41, 2334–2348. [DOI] [PubMed] [Google Scholar]
- Peng S., Lacerda A. E., Kirsch G. E., Brown A. M., Bruening-Wright A. (2010). The action potential and comparative pharmacology of stem cell-derived human cardiomyocytes. J. Pharmacol. Toxicol. Methods 61, 277–286. [DOI] [PubMed] [Google Scholar]
- Rajamani S., El-Bizri N., Shryock J. C., Makielski J. C., Belardinelli L. (2009). Use-dependent block of cardiac late Na(+) current by ranolazine. Heart Rhythm 6, 1625–1631. [DOI] [PMC free article] [PubMed] [Google Scholar]
- Redfern W. S., Carlsson L., Davis A. S., Lynch W. G., MacKenzie I., Palethorpe S., Siegl P. K., Strang I., Sullivan A. T., Wallis R., et al. (2003). Relationships between preclinical cardiac electrophysiology, clinical Qt interval prolongation and torsade de pointes for a broad range of drugs: evidence for a provisional safety margin in drug development. Cardiovasc Res. 58, 32–45. [DOI] [PubMed] [Google Scholar]
- Sager P. T., Gintant G., Turner J. R., Pettit S., Stockbridge N. (2014). Rechanneling the cardiac proarrhythmia safety paradigm: a meeting report from the cardiac safety research consortium. Am. Heart J. 167, 292–300. [DOI] [PubMed] [Google Scholar]
- Scheel O., Frech S., Amuzescu B., Eisfeld J., Lin K. H., Knott T. (2014). Action potential characterization of human induced pluripotent stem cell-derived cardiomyocytes using automated patch-clamp technology. Assay Drug Dev. Technol. 12, 457–469. [DOI] [PubMed] [Google Scholar]
- Schram G., Zhang L., Derakhchan K., Ehrlich J. R., Belardinelli L., Nattel S. (2004). Ranolazine: ion-channel-blocking actions and in vivo electrophysiological effects. Br. J. Pharmacol. 142, 1300–1308. [DOI] [PMC free article] [PubMed] [Google Scholar]
- Song Y., Shryock J. C., Wu L., Belardinelli L. (2004). Antagonism by ranolazine of the pro-arrhythmic effects of increasing late ina in guinea pig ventricular myocytes. J. Cardiovasc. Pharmacol. 44, 192–199. [DOI] [PubMed] [Google Scholar]
- Szel T., Koncz I., Jost N., Baczko I., Husti Z., Virag L., Bussek A., Wettwer E., Ravens U., Papp J. G., and., et al. (2011). Class I/B antiarrhythmic property of ranolazine, a novel antianginal agent, in dog and human cardiac preparations. Eur. J. Pharmacol. 662, 31–39. [DOI] [PubMed] [Google Scholar]
- Thomsen M. B., Volders P. G., Beekman J. D., Matz J., Vos M. A. (2006). Beat-to-beat variability of repolarization determines proarrhythmic outcome in dogs susceptible to drug-induced torsades de pointes. J. Am. Coll. Cardiol. 48, 1268–1276. [DOI] [PubMed] [Google Scholar]
- Undrovinas A. I., Belardinelli L., Undrovinas N. A., Sabbah H. N. (2006). Ranolazine improves abnormal repolarization and contraction in left ventricular myocytes of dogs with heart failure by inhibiting late sodium current. J. Cardiovasc. Electrophysiol. 17 Suppl 1, S169–s177. [DOI] [PMC free article] [PubMed] [Google Scholar]
- Vicente J., Johannesen L., Mason J. W., Crumb W. J., Pueyo E., Stockbridge N., Strauss D. G. (2015). Comprehensive T wave morphology assessment in a randomized clinical study of dofetilide, quinidine, ranolazine, and verapamil. J. Am. Heart Assoc. 4, [DOI] [PMC free article] [PubMed] [Google Scholar]
- Zhou Z., Gong Q., Ye B., Fan Z., Makielski J. C., Robertson G. A., January C. T. (1998). Properties of Herg channels stably expressed in Hek 293 cells studied at physiological temperature. Biophys. J. 74, 230–241. [DOI] [PMC free article] [PubMed] [Google Scholar]
Associated Data
This section collects any data citations, data availability statements, or supplementary materials included in this article.


