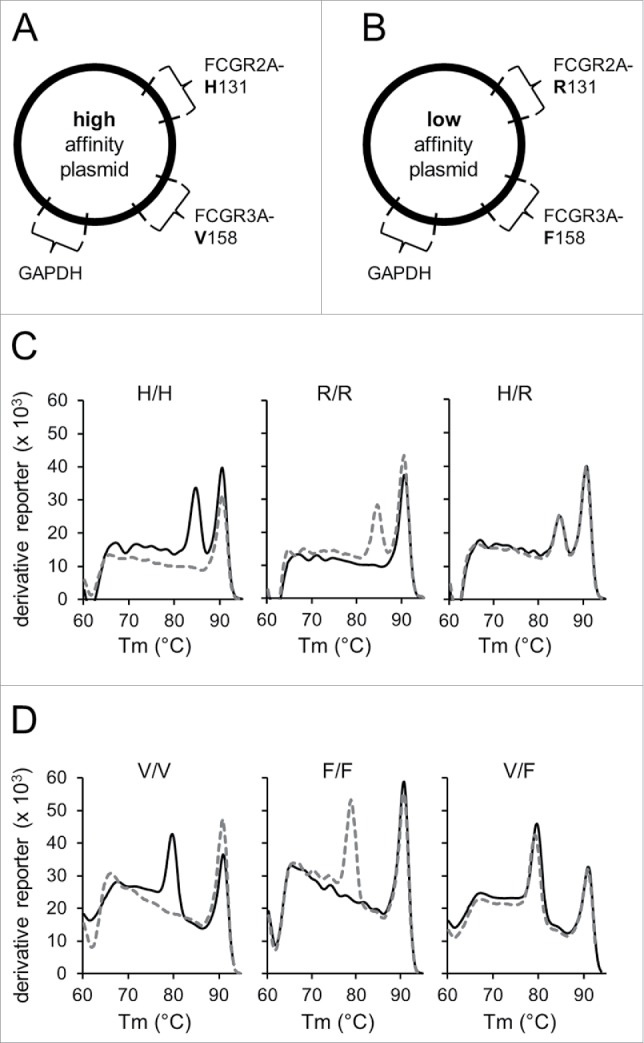
Figure 1.

Establishment of the validated identification of FCGR polymorphisms. To validate analysis of FCGR polymorphisms, two control plasmids containing DNA sequences encoding for either FCGR2A-131H and FCGR3A-158V alleles (“high-affinity plasmid”; A) or FCGR2A-131R and FCGR3A-158F alleles (“low-affinity plasmid”; B) were generated and used as PCR templates in addition to patient samples. The plasmid encoding for high-affinity alleles was used for amplification with low- and high-affinity specific primers and thereby served as positive and negative control, respectively. Conversely, the plasmid carrying low-affinity alleles were utilized as positive and negative control for amplification with primers for low- and high-affinity polymorphisms, respectively. Due to similar Tm of allele-specific PCR products each allele was examined separately. Moreover, DNA sequences encoding for GAPDH were integrated into both plasmids and used as internal control for further assay precision. Only GAPDH-positive runs that showed amplification of the positive control and lack of amplification of the negative control of the respective allele-specific fragments were used for further data analysis. To determine FCGR polymorphisms in 2A (high-affinity allele 131H (H) and low-affinity allele 131R (R)) and 3A genes (high-affinity allele 158V (V) and low-affinity allele 158F (F)), allele-specific PCR followed by post-amplification melting-curve analysis was performed. To obtain melting-curves, the derivative reporter was plotted against the melting temperature (Tm) of PCR products. Representative melting-curves for possible genotypes of FCGR2A (C) and -3A (D) are shown in combination with GAPDH used as internal control. Black solid lines represent melting curves derived from reactions containing high affinity and gray dashed lines from reactions containing low-affinity primers. Tm of FCGR2A and -3A allele-specific amplicons were at 85°C and 80°C, respectively. GAPDH control amplicons showed a Tm of 91°C. Identification of FCGR genotypes H/H, R/R and H/R for 2A (C) and V/V, F/F and V/F for 3A (D) was realized using amplicon specific Tm profiles. Experiments were performed in duplicates. The derivative reporter was calculated as follows: change of SYBR Green I dye fluorescence/change of temperature.
