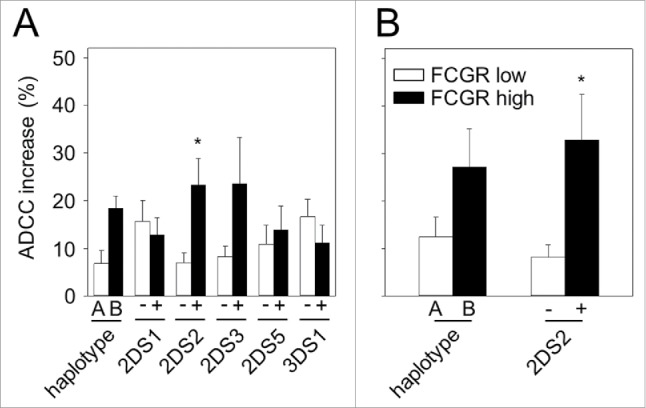
Figure 4.

Impact of KIRs with or without FCGR2A and -3A genotypes on patient-specific ADCC. ADCC was analyzed prior to start (baseline; day 1) and on day 8 of long-term infusion of ch14.18/CHO. ADCC increase was calculated according to the formula: day 8 ADCC – baseline ADCC. (A) Patients harboring two haplotypes A (n = 17) or patients with the presence of the single activating KIR 2DS1 (n = 20), 2DS2 (n = 26), 2DS3 (n = 14), 2DS5 (n = 15) and 3DS1 genotype (n = 18) were compared to those who had haplotype B (n = 36) or missed the respective activating KIR (n = 33, 27, 38, 37 and n = 35, respectively). Patients with A/A genotype showed 1.3-fold increase (10.85 ± 3 vs. 8.19 ± 2%) and patients harboring haplotype B showed 2.4-fold increase (25.13 ± 3% vs. 10.26 ± 4% baseline). Following ADCC increases were found in patients with single activating KIR and those who were negative for respective activating KIR: 2.1- vs. 2.1-fold for 2DS1 (19.36 ± 3% vs. 9.13 ± 3% and 21.29 ± 5% vs. 10.17 ± 2%, respectively), 3.1- vs. 1.3-fold for 2DS2 (29.80 ± 5% vs. 9.70 ± 3% and 12.44 ± 2% vs. 9.50 ± 2%, respectively), 2.6- vs. 1.4-fold for 2DS3 (34.86 ± 10% vs. 13.63 ± 5% and 15.31 ± 2% vs. 10.62 ± 2%, respectively), 2.2- vs. 1.2-fold for 2DS5 (19.83 ± 5% vs. 8.86 ± 4% and 20.85 ± 5% vs. 17.05 ± 4%, respectively) and 1.5- vs. 2.7-fold for 3DS1(19.27 ± 3% vs. 12.82 ± 4% and 21.30 ± 5% vs. 7.93 ± 4%, respectively). (B) Impact of combined FCGR2A and -3A low- (white column) and high-affinity genotype (black column) with haplotype A or B (n = 12 and 15, respectively) and the presence or absence of the activating KIR 2DS2 on ADCC (n = 12 and 19, respectively). Increase of ADCC was evaluated in four patient cohorts: low-affinity FCGR2A and -3A + haplotype A, high-affinity FCGR2A and -3A + haplotype B (2.0- vs. 4.7-fold change (14.02 ± 4% vs. 7.06 ± % and 31.85 ± 8% vs. 6.78 ± 2%)), low-affinity FCGR2A and -3A + absence of 2DS2 and high-affinity FCGR2A and -3A + presence of 2DS2 (1.6- vs. 6.3-fold change (14.84 ± 3% vs. 9.11 ± 3% and 37.21 ± 9% vs. 5.91 ± 2%)). Data are shown as mean values ± SEM of experiments performed in triplicate. (A) Mann–Whitney rank sum test; *p = 0.011 vs. 2DS2-negative patients. (B) Mann–Whitney rank sum test; *p = 0.016 vs. combined FCGR2A and -3A low affinity + absence of 2DS2 group.
