

ABSTRACT
Dysfunctional intratumoral immune reactions are shaped by complex networks of cytokines (including chemokines), and how the cytokinome landscape coordinates with tumors has not been systematically investigated. Using high-dimensional datasets of cancer specimens, we explored the transcript abundance, biomarker potential, and prognostic impact of local cytokines across 19 tumor types. We found that most cytokines are highly locally dysregulated (p = 0.024), revealing spatiotemporal pattern of local cytokines in the development of cancers. In addition, we noted the significant downregulation of CCL14 and CXCL12 in 9 and 10 cancer types, respectively, implying their crucial roles in tumor pathogenesis. We also found that cytokines showed significantly higher specificity properties compared to other protein-coding genes (PCGs) in primary tumor specimens (p << 0.001), indicating that tissue context remains an issue when considering cancer cytokinomes. Finally, we linked concentrations of local cytokines to patient survival. Our results thus provide a panoramic view of pan-cancer cytokinomes, which highlights tumor type specificity of cancer-related cytokines and their impacts on disease prognosis.
KEYWORDS: Cytokinome landscape, cytokines and chemokines, drug-target enrichment, pan-cancer analysis, survival analysis, transcription profiles
Abbreviations
- BLCA
urothelial bladder cancer
- BMP
bone morphogenetic protein
- BRCA
breast cancer
- CESC
cervical cancer
- COAD
colon adenocarcinoma
- CSF
colony stimulating factor
- DLBC
diffuse large B-cell lymphoma
- FDR
false discovery rate
- FoE
fold of enrichment
- GBM
glioblastoma multiforme
- HNSC
heck and neck squamous cell carcinoma
- IFN
interferon
- IL
interleukin
- JS
Jensen–Shannon
- KIRC
clear cell kidney sarcoma
- KIRP
papillary kidney carcinoma
- LGG
lower grade glioma
- LIHC
liver hepatocellular carcinoma
- LUAD
lung adenocarcinoma
- LUSC
lung squamous cell carcinoma
- OV
ovarian serous cystadenocarcinoma
- PAAD
pancreatic ductal adenocarcinoma
- PCG
protein-coding gene
- PPI
protein–protein interaction
- PRAD
prostate adenocarcinoma
- READ
rectal adenocarcinoma
- TCGA
The Cancer Genome Atlas
- TGF
transforming growth factor
- THCA
papillary thyroid carcinoma
- TNF
tumor necrosis factor
- TPM
transcript-per-million
- TTD
Therapeutic Target Database
- UCEC
uterine corpus endometrial carcinoma
Introduction
Cytokines (including chemokines) are some of the most important components within the tumor microenvironment, and are involved in the intricate crosstalk between tumor cells and tumor-infiltrating innate and adaptive immune cells.1,2 In particular, these genes participate in specific cellular processes and tumor-related responses including regulation of proliferation, differentiation, activation and inhibition of immune cells,3 recruitment of immune cells to local inflammatory sites,4 enhancement of tumor recognition by immune cells,5 cancer inhibition and eradication,6 infiltration of immune cells in local tumor masses,7 promotion of tumor immunoediting,8 and facilitation of tumor invasion and metastasis.9,10 Although the roles of cytokines and cytokine receptors have been widely investigated, a need remains for systematic analyses of the roles of cytokines across human cancers.
To comprehensively investigate the intricate expression profiles of cytokines across human cancers, integrative computational biology approaches are essential for depicting cytokinome transcription landscape. The Cancer Genome Atlas (TCGA) project has generated comprehensive genomic data sets of human cancers. Using the large-scale genomic datasets exemplified by the TCGA database, the interaction between complex networks of cytokines and cancer phenotypes can be explored.
In this study, we performed multiplatform integrative analysis of alterations of 261 cytokines and cytokine receptors across 19 human cancer types. Using these comprehensive analysis, we characterized the expression profiles of tumor local cytokines and identified the correlations between aberrations of intratumoral cytokines and clinical responses.
Results
Summary of experimental design
In this study, we performed a comprehensive investigation of cytokines' expression profiles (RNA-seq) across human cancers (Fig. 1A, urothelial bladder cancer (BLCA), breast cancer (BRCA), cervical cancer (CESC), colon adenocarcinoma (COAD), diffuse large B-cell lymphoma (DLBC), glioblastoma multiforme (GBM), head and neck squamous cell carcinoma (HNSC), clear cell kidney sarcoma (KIRC), papillary kidney carcinoma (KIRP), lower grade glioma (LGG), liver hepatocellular carcinoma (LIHC), lung adenocarcinoma (LUAD), lung squamous cell carcinoma (LUSC), ovarian serous cystadenocarcinoma (OV), pancreatic ductal adenocarcinoma (PAAD), prostate adenocarcinoma (PRAD), rectal adenocarcinoma (READ), papillary thyroid carcinoma (THCA), and uterine corpus endometrial carcinoma (UCEC)). We first characterized the local dysregulation (tumor vs. normal) and stage specificity (late-stage vs. early-stage) properties of 261 cytokines and cytokine-related genes in 19 cancer types. Then, we assessed the potential clinical implication of these cytokines from several facets including specific expression pattern across cancers, drug-target enrichment, and prognostic ability.
Figure 1.
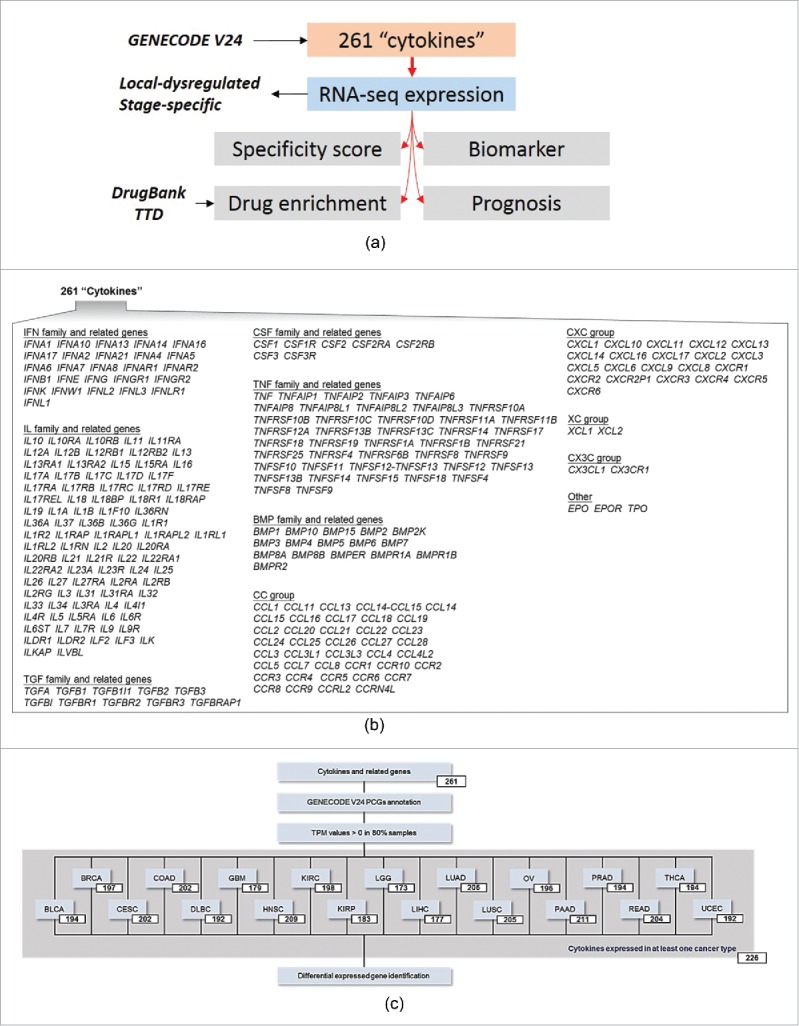
Study design and cytokines included. (A) Schematic showing comprehensive analysis of cytokine gene dysregulations in human cancers. (B) Schematic showing 261 cytokines and cytokine receptors included in this study. (C) Selected cytokines for downstream analysis in a given cancer type.
To study local cytokine expression profiles in human cancers, we focused on a gene set containing 261 cytokines (Fig. 1B, the interferon (IFN) family, interleukin (IL) family, transforming growth factor (TGF) superfamily, colony stimulating factor (CSF) family, tumor necrosis factor (TNF) family, and bone morphogenetic protein (BMP) family), chemokines (CC group, CXC group, C group, and CX3C group), and other related genes. For each cancer type, two filters were applied for downstream analyses; the first selected only cytokines that were annotated as PCGs according to the GENECODE V24 database; the second eliminated any transcript for which the transcripts-per-million (TPM) expression value was equal to 0 in the above 20% of specimens. As shown in Fig. 1C, 167 (63.99%) cytokines were commonly detected in all 19 cancer types, and 226 (86.59%) cytokines were detected in at least one cancer type (Fig. 1C).
Characterization of local-dysregulated cytokines
Using RNA-sequencing data from 7242 TCGA primary tumor specimens and 634 normal tissues (Fig. S1), a computational biology pipeline was established to characterize the spatiotemporal dynamics of these cytokines across cancers. We compared differences in cytokine levels in primary tumors and normal tissues by analyzing 12 cancer types for which the number of corresponding normal specimens was >15. As shown in Fig. 2A, we identified 300 local-dysregulated cytokines from 12 cancer types (Fig. 2A, Table S1). On average, 12.63% of cytokines were locally dysregulated compared to their counterparts (Fig. 2B). In comparison with other PCGs analyzed by the same approach, we found that percentages of local-dysregulated cytokines were significantly higher than that of other PCGs (6.60% on average, p = 0.024, Fig. 2B, Table S2). Based on these results, expressions of CCL14 and CXCL12 were significantly dysregulated in 9 and 10 cancer types, respectively. While further comparing local-dysregulated cytokines with other PCGs, we found no difference between sharing distributions of up- and down-regulated genes across different cancers (Fig. S2).
Figure 2.

Local dysregulated cytokines. (A) Heatmaps of local-dysregulated cytokines in 7 cancer types. Genes were sorted according to log-multiples of change. (B) Bar plots showing percentages of all, upregulated, and downregulated local-dysregulated cytokines and other protein-coding genes (PCGs).
Characterization of stage-specific cytokines
We further characterized expression levels of cytokines in different pathological stages (early and late stages) in 12 cancers (Fig. S3). However, cytokines showed stage specificity in only seven cancers, including BLCA, COAD, KIRC, KIRP, LIHC, LUAD, and THCA (Fig. 3A, Table S3). We found no significantly higher or lower patterns of percentages of dysregulated cytokines than that of other PCGs (Fig. 3B, Table S4). In addition, the percentages of stage-specific cytokines were similar to those of other PCGs (p = 0.724). We noted that two cancers (KIRC (48.99%) and KIRP (34.97%)) contained high percentages of stage-specific cytokines and other PCGs. By comparing sharing patterns across cancers, we found that stage-specific cytokines were highly cancer-specific, with around 70% of cytokines being significantly up- or down-regulated in specific late-stage tumors (Fig. S4).
Figure 3.

Stage-specific cytokines. (A) Heatmaps of stage-specific cytokines in 12 cancer types. Genes were sorted according to log-multiples of change. (B) Bar plots showing percentages of all, upregulated, and downregulated stage-specific cytokines and other protein-coding genes (PCGs).
Specificity score analysis revealing tissue specificity of cytokines across human cancers
Aided by volcano plots for the roles of cytokines (Fig. 4A, tumor vs. normal), we found that 5.19% and 7.57% of cytokines were significantly up- and down-regulated in tumors, respectively, with log-multiples of change of >1.5. However, the perturbation of expression levels of stage-specific cytokines (Fig. 4B, late-stage vs. early-stage) was relatively small compared to locally dysregulated cytokines, with almost all log-multiples of change of stage-specific cytokines being <1.5 across cancers.
Figure 4.

Potential of cytokines as specific biomarker in human cancers. (A) Volcano plot of local-dysregulated cytokines. Each dot represents one cytokine in a given tumor type. Cytokines with a false discovery rate (FDR) of <0.05 and log-multiple of change of >1.5 are colored red (downregulated) and blue (upregulated), respectively. (B) Volcano plot of stage-specific cytokines. (C) Distributions of maximal normal-tumor specificity scores calculated for each gene across TCGA cancer types for cytokines and other protein-coding genes (PCGs). (D) Bar plots depicting differences between percentages of genes with specificity scores of >0.45 for cytokines and other PCGs.
To further identify the value of cytokines as biomarkers in human cancers, we adopted Jensen–Shannon (JS) divergence scoring analysis for each gene to characterize the specificity of cytokine expression patterns across human cancers. Importantly, we found that expressions of cytokines demonstrated significantly higher specificity across primary tissues and normal tissues across cancers than other PCGs (p < 2.2 × 10⁻¹⁶, Fig. 4C, Table S5). Results also indicated that cytokines showed larger extents of expression variations not only across normal-tumor tissues, but also across different cancer types compared to other PCGs. In addition, as shown in Fig. 4D, JS scores of 0.45 (p < 2.2 × 10⁻¹⁶) can significantly discriminate the specificity of cytokines and other PCGs (Fig. 4D).
Cytokine abundances are a specific biomarker in human cancers
To verify the above observations, we then applied an unsupervised agglomerative hierarchical clustering approach based on cytokine genes. Our results indicated that expression signatures of cytokines were differentiated between primary tumors and normal tissues in most cancers, except for BLCA and PAAD (Fig. 5). In those cancer types, expressions of cytokines were homogeneous in adjacent normal tissues, compared to the relatively diverse expression patterns in primary tumors. The results suggested that local cytokine expression profiles were able to exploit specific and informative biomarkers to determine the tumor origin and to provide preliminary pathological diagnostic information.
Figure 5.
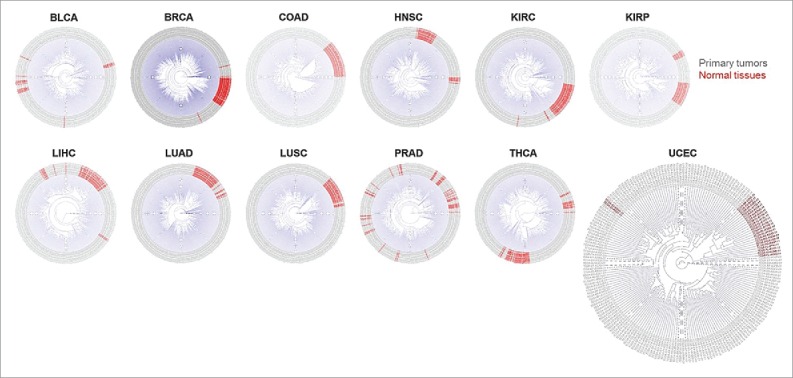
Dendrograms showing the hierarchical clustering effect of cytokines across primary tissues and normal tissues within each cancer type.
Clinical implications of cytokines across human cancers
To assess the prognostic predictive value of local cytokines, we conducted retrospective survival analysis using a multivariate Cox proportional hazards model. For each cancer type, the prognostic value of each cytokine was quantified. Furthermore, we conducted a random effects meta-analysis to evaluate the pan-cancer prognostic value of the cytokine. We found that 22 cytokines were highly expressed in all cancers and showed independent significance in at least four cancer types (Table S6). In addition, 53 cytokines showed significant pan-cancer prognostic ability (Table 1).
Table 1.
53 cytokines with significant prognostic ability using meta-analysis
| Gene | Effect sizea | SEb | 95% CIc | PCombined |
|---|---|---|---|---|
| TGFBI | 1.154 | 1.029 | 1.091∼1.221 | 5.54E-7 |
| CXCL5 | 1.095 | 1.019 | 1.055∼1.136 | 1.52E-6 |
| IL11 | 1.219 | 1.043 | 1.123∼1.325 | 2.67E-6 |
| IL6 | 1.089 | 1.020 | 1.048∼1.133 | 1.80E-5 |
| CXCL8 | 1.087 | 1.022 | 1.042∼1.134 | 0.0001121 |
| IL12B | 0.513 | 1.192 | 0.364∼0.724 | 0.0001433 |
| CCL20 | 1.058 | 1.015 | 1.027∼1.090 | 0.0002029 |
| TNFRSF1A | 1.290 | 1.071 | 1.128∼1.475 | 0.0002045 |
| BMP1 | 1.256 | 1.064 | 1.113∼1.417 | 0.0002165 |
| IL15RA | 1.202 | 1.054 | 1.083∼1.333 | 0.0005361 |
| CXCL6 | 1.077 | 1.022 | 1.032∼1.123 | 0.0007075 |
| TNFSF4 | 1.139 | 1.041 | 1.054∼1.232 | 0.0010786 |
| TGFB1 | 1.191 | 1.056 | 1.072∼1.324 | 0.0011939 |
| IL13RA2 | 1.071 | 1.022 | 1.025∼1.119 | 0.0020229 |
| TNFAIP8L3 | 1.127 | 1.039 | 1.044∼1.216 | 0.0020482 |
| IL1RAP | 1.174 | 1.054 | 1.060∼1.301 | 0.0021221 |
| IL1R1 | 1.083 | 1.027 | 1.029∼1.140 | 0.0022202 |
| TNFAIP6 | 1.134 | 1.043 | 1.044∼1.233 | 0.0030150 |
| CCL15 | 0.898 | 1.038 | 0.835∼0.965 | 0.0034074 |
| CSF1 | 1.101 | 1.035 | 1.029∼1.178 | 0.0050726 |
| CCR1 | 1.123 | 1.044 | 1.032∼1.222 | 0.0068695 |
| ILVBL | 0.808 | 1.083 | 0.691∼0.944 | 0.0071975 |
| IL1A | 1.270 | 1.096 | 1.061∼1.519 | 0.0090645 |
| IL20RB | 1.136 | 1.050 | 1.032∼1.251 | 0.0092615 |
| TGFBR1 | 1.222 | 1.080 | 1.050∼1.421 | 0.0095997 |
| TNFRSF12A | 1.147 | 1.055 | 1.034∼1.274 | 0.0098576 |
| CXCL3 | 1.073 | 1.028 | 1.016∼1.133 | 0.0114950 |
| CSF3 | 1.068 | 1.026 | 1.015∼1.124 | 0.0118949 |
| EPO | 1.111 | 1.043 | 1.022∼1.208 | 0.0131039 |
| CCR3 | 1.268 | 1.101 | 1.051∼1.529 | 0.0133497 |
| TGFB3 | 1.079 | 1.031 | 1.015∼1.146 | 0.0146064 |
| TNFSF13B | 1.077 | 1.032 | 1.013∼1.145 | 0.0171241 |
| IL15 | 1.081 | 1.035 | 1.011∼1.155 | 0.0225527 |
| IL1R2 | 1.069 | 1.030 | 1.009∼1.132 | 0.0227041 |
| TNFSF9 | 1.070 | 1.030 | 1.009∼1.134 | 0.0227782 |
| TNFRSF10B | 1.103 | 1.044 | 1.013∼1.201 | 0.0239134 |
| TNFRSF6B | 1.084 | 1.036 | 1.011∼1.163 | 0.0242927 |
| TNFRSF10D | 1.126 | 1.055 | 1.015∼1.250 | 0.0253293 |
| IL13RA1 | 1.151 | 1.065 | 1.018∼1.302 | 0.0253324 |
| IL31RA | 1.452 | 1.182 | 1.047∼2.015 | 0.0255012 |
| TGFB2 | 1.117 | 1.052 | 1.012∼1.233 | 0.0275131 |
| CSF1R | 1.061 | 1.028 | 1.005∼1.120 | 0.0314867 |
| BMP8A | 1.083 | 1.038 | 1.007∼1.165 | 0.0328111 |
| TNFRSF8 | 1.154 | 1.071 | 1.009∼1.320 | 0.0367800 |
| IL10RB | 1.188 | 1.086 | 1.010∼1.398 | 0.0375985 |
| TGFB1I1 | 1.080 | 1.038 | 1.004∼1.160 | 0.0377958 |
| IL10 | 1.163 | 1.076 | 1.010∼1.344 | 0.0402630 |
| IL4R | 1.111 | 1.053 | 1.004∼1.231 | 0.0422493 |
| BMP3 | 0.941 | 1.030 | 0.888∼0.998 | 0.0424723 |
| CCL22 | 0.914 | 1.046 | 0.837∼0.997 | 0.0436662 |
| IL2RA | 1.084 | 1.041 | 1.001∼1.173 | 0.0461385 |
| CXCL1 | 1.043 | 1.022 | 1.000∼1.087 | 0.0480829 |
| TNFSF14 | 1.147 | 1.072 | 1.000∼1.314 | 0.0495488 |
Effect-size estimated by combining all cancer types using meta-analysis;
Standard error;
Confidence intervals.
Next, we sought to validate the prognostic ability of local cytokines by conducting meta-analysis of 261 cytokines from 12 publically available BRCA data sets. As shown in the Table 2, 27 cytokines possessed significant prognostic potential for BRCA patients with distant metastasis (Table 2). Notably, TGFBI (effect size = 1.19 (1.11∼1.27), p = 4.06 × 10⁻⁷), TNFAIP6 (effect size = 1.14 (1.05∼1.24), p = 0.001), and BMP1 (effect size = 1.25 (1.08∼1.47), p = 0.002) which reached pan-cancer significance were also identified to be significantly correlated with BRCA prognosis.
Table 2.
Prognostic-related cytokines in breast cancers
| Gene | Effect sizea | 95% CIb | PCombined |
|---|---|---|---|
| TGFBI | 1.187 | 1.111∼1.269 | 4.06E-7 |
| CXCL13 | 0.915 | 0.882∼0.949 | 1.82E-6 |
| IFNW1 | 6.045 | 2.673∼13.670 | 1.55E-5 |
| CCL19 | 0.909 | 0.862∼0.958 | 0.000334 |
| IL27RA | 0.746 | 0.633∼0.879 | 0.000477 |
| CCR3 | 1.815 | 1.294∼2.546 | 0.000557 |
| IL1RL2 | 1.804 | 1.278∼2.548 | 0.000806 |
| CXCL9 | 0.925 | 0.883∼0.968 | 0.000814 |
| IL2RG | 0.825 | 0.736∼0.926 | 0.00107 |
| IL2RB | 0.828 | 0.739∼0.928 | 0.001135 |
| TNFAIP6 | 1.142 | 1.054∼1.236 | 0.001148 |
| IL17RB | 0.928 | 0.885∼0.972 | 0.001656 |
| CXCR6 | 0.747 | 0.622∼0.896 | 0.001693 |
| IL32 | 0.860 | 0.782∼0.946 | 0.001879 |
| IL19 | 1.271 | 1.092∼1.478 | 0.001902 |
| TGFB1I1 | 1.227 | 1.078∼1.396 | 0.001981 |
| TNFRSF14 | 0.702 | 0.561∼0.879 | 0.002039 |
| CCR7 | 0.839 | 0.750∼0.938 | 0.002068 |
| BMP1 | 1.246 | 1.082∼1.435 | 0.002215 |
| IL13RA1 | 1.264 | 1.086∼1.472 | 0.002449 |
| TNFRSF17 | 0.890 | 0.824∼0.961 | 0.002991 |
| CCL27 | 1.447 | 1.130∼1.853 | 0.003398 |
| IL10 | 1.684 | 1.185∼2.394 | 0.003636 |
| IL16 | 0.762 | 0.634∼0.916 | 0.003842 |
| TNFAIP2 | 0.875 | 0.798∼0.958 | 0.004034 |
| CCL4 | 0.857 | 0.771∼0.953 | 0.004485 |
| IL1RN | 1.079 | 1.024∼1.138 | 0.004544 |
Effect-size estimated by combining all cancer types using meta-analysis;
Confidence intervals.
We then conducted a drug-target enrichment analysis11 to evaluate the drug-targeting potential of prognostic-related cytokines. We selected cytokines that showed significant prognostic predictive ability in at least two cancer types. Then, the 157 (60.15%) prioritized cytokines were used to assess the fold of enrichment (FoE) by evaluating the significant overlap with 143 cancer-related drug-target genes annotated from DrugBank12 and the Therapeutic Target Database (TTD).13 Results demonstrated that a prioritized cytokine gene set significantly overlapped with cancer-related drug target genes, with a FoE of 1.34 (p = 0.046, Figs. 6A and B). Hence, we provided empirical evidence to support the idea that the human cancer cytokinome is a valuable resource for therapeutic development and drug repositioning (Fig. 6C).
Figure 6.
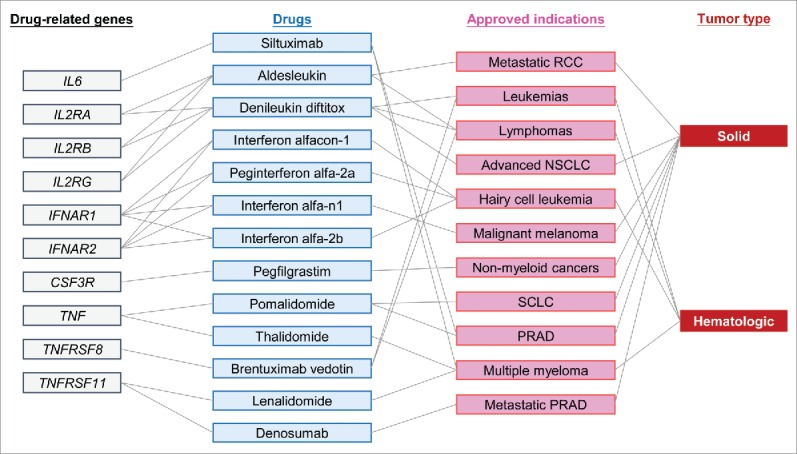
Drug enrichment analysis of cytokines. (A) Schematic showing enrichment of prioritized prognostic-related cytokines in 143 approved drug-related gene targets using information form DrugBank and the Therapeutic Target Database. (B) Enrichment plot showing significant enrichment of prioritized prognostic-related cytokines in an approved drug-related gene set. (C) Figure showing relationships among drug-related genes, approved drugs, approved indications, and tumor types identified by a drug-target enrichment analysis.
Discussion
Inflammatory microenvironments are consistent components in human cancers,14 and tumor-associated cytokines (including chemokines) intricately participate in all immune responses.3 Interactions of local cytokines and chemokines with tumors are essential for comprehending the defense against tumors. Using pan-cancer data from TCGA, we characterized the spatiotemporal dynamic context of local cytokines in human cancers. Our results provided a perspective of the cytokinome landscape within tumors, and further revealed the value of the clinical utility of cytokines in cancer prognosis and therapeutics.
In this integrative study, we addressed several questions. First, what is the presence or absence of cytokine patterns across human cancers? Second, which local cytokines critically influence patient's survival? Third, can information about the spatiotemporal patterns of local cytokines be applied to find new therapeutics in different cancers? We found that cytokine reactions in human cancers were individually described, regardless of the cytokine (including chemokines) or tumor type.15,16 However, a systematic model to depict cytokines in tumors is still lacking. This comprehensive analysis of local cytokines in tumors provides a panoramic view of cytokine interactions across human cancers.
By assessing spatiotemporal dynamics of cytokines across human cancers, we found that 51.1% of locally dysregulated cytokines were cancer-specific. In addition, cytokines that showed stage specificity were surprisingly cancer type-specific, with ∼70% of these stage-specific cytokines only being found in one cancer type. Furthermore, the tumor specificity score analysis also revealed striking cancer type-specific properties of cytokines. In agreement with previous study,17 our results suggested that cytokine profiles were associated with tumor histology, and therefore provided an insight that tissue context must be considered when assessing the tumor cytokinome. In a systematic review, Lippitz et al. reported a consistent cytokine reaction pattern (including IL1, IL2, IL4, IL5, IL6, IL8, IL10, IL12, IL15, IL17, IL18, TNFα, TGFβ, IFNG, MIF, and CXCR4) in tumor patients, which was independent of the tumor histology across 307 published clinical studies.6 In this present study, we disclosed distinct cytokine reaction patterns across tumor histology types using a TCGA pan-cancer transcriptomic study of 261 cytokine and cytokine receptor genes. We therefore noted that these integrative approaches can provide new insights into cytokinome patterns across human cancers. Furthermore, our data also provided evidence that nearly half of cytokines (48.9%) were found to be commonly dysregulated in at least two cancer types, exemplified by downregulation of CCL4 and CXCL12 in primary tumor tissues. These findings are consistent with Lippitz's work that there were some common cytokine perturbation features that were independent of cancer types.
Since local cytokine levels (at least some specific cytokine patterns) were reported to be significantly associated with patients' prognosis,6,16,18,19 we retrospectively conducted a cancer-specific and pan-cancer survival analysis to identify correlations between cytokine concentrations and the overall survival of cancer patients. Furthermore, we showed that cytokines prioritized by their prognostic potential were enriched in drug-related genes.
There are some limitations that may confine our results. First, the genetic predisposition factors that regulate cytokine expression need to be further elucidated. In addition, the interaction between cytokine expression, immune infiltrates, and cancer cells was not characterized, which requires future research to clarify it.
In summary, we present the strength of correlations and relationships between local cytokines and tumors in a synthetic and sophisticated fashion. These integrative works across human cancers may overcome challenges caused by complex interactions among cytokines.20 Our data highlights the power of systems biology approaches to delineate the pan-cancer cytokine landscape, and represent an improvement on characterization of coordination among local cytokines and tumor cells in human cancers. Our works also suggest the validity of using a pan-cancer systems biology approach to prioritize cytokines for drug development and cancer immunotherapy. In light of the fact that cytokines are important mediators that have been linked to cancer therapy, our results identify histologic contexts and local cytokine profiles as rational therapeutic targets for drug discovery.
Materials and methods
Defining the cytokinome gene set
We investigated 261 genes including cytokines (26 IFN family and IFN-related molecules, 92 IL family and IL-related molecules, 10 TGF superfamily and TGF-related molecules, seven CSF family and CSF-related molecules, 42 TNF family and TNF-related molecules, and 16 BMP family and BMP-related molecules) and chemokines (40 CC chemokines and related molecules, 21 CXC chemokines and related molecules, 2 C chemokines and related molecules, and 2 CX3C chemokines and related molecules) and miscellaneous cytokines (i.e., EPO, EPOR, TPO).
Studied tumor types
We selected 19 tumor types from TCGA for this study, including 18 solid tumor types (BLCA,21 BRCA,22 CESC, COAD,23 GBM,24 HNSC,25 KIRC,26 KIRP,27 LGG,28 LIHC, LUAD,29 LUSC,30 OV,31 PAAD, PRAD,32 READ,23 THCA,33 and UCEC34) and one hematologic tumor type (diffuse large-B cell lymphoma (DLBC)). In several downstream analyses, we included as many tumor types as possible, limited by the availability of different data types.
Clinical information
Clinical data for each tumor type were downloaded using the “DownloadClinicalData” function in the TCGA-Assembler package. We further extracted the age, gender, and overall survival time of 19 tumor types, pathological clinical stage (which was only available for 12 cancer types, including BLCA, BRCA, COAD, HNSC, KIRC, KIRP, LIHC, LUAD, LUSC, PAAD, READ, and THCA), and BRCA molecular subtype information for downstream analyses.
RNA-sequencing-based messenger (m)RNA transcript data and preprocessing
Expression data of mRNA (TCGA RNA-sequencing vers. 2) for 19 tumor types were downloaded and processed using the “DownloadRNASeqData” and “ProcessRNASeqData” functions implemented in the TCGA-Assembler package, including only primary tumor (TP) and normal adjacent tissue (NT) data. For mRNA transcript data, expression values were multiplied by 1e6 to compute the TPM value for downstream analyses. For each cancer type, we further applied two filters for downstream analyses: the first selected only cytokines that were annotated as PCGs according to the GENECODE V24 database; the second eliminated any transcript for which the TPM expression value was equal to 0 in the above top 20% of specimens. We further identified outliers by calculating signed, weighted biweight midcorrelations across samples in each tumor type, and arbitrarily excluded samples that were more than five standard deviations above the mean connectivity.
Annotation of protein-coding genes (PCGs)
GENECODE PCG annotation vers. 24 information was downloaded from the official website: http://www.gencodegenes.org/. The PCG was defined as a gene that contained protein annotation, resulting in 18,960 unique genes.
Identification of differentially expressed genes across normal-tumor parts and pathological stage
After quality control and sample sanitization, protein-coding cytokines and other PCGs were subjected to differentially expressed gene (DEG) identification. For each tumor type, we used a moderated t-test implemented in the limma package35 to identify significant genes. In detail, we identified local-dysregulated cytokines by comparing expression levels of protein-coding cytokines across primary tumors and tumor-adjacent normal tissues. To ensure the power of detection, we included 12 cancer types which had more than 15 available normal samples, including BLCA, BRCA, COAD, HNSC, KIRC, KIRP, LIHC, LUAD, LUSC, PRAD, THCA, and UCEC. We defined cytokines that met the criteria of an FDR of <0.05 and log-multiple of change of >1.5 as a locally dysregulated cytokine. On the other hand, we identified stage-specific cytokines by comparing early-stage primary tumors to late-stage primary tumors. The stages of primary tumors were defined using pathological tumor stage clinical information; we defined pathological stages I and II as early stage and stages III and IV as late stage. We included 12 tumor types (BLCA, BRCA, COAD, HNSC, KIRC, KIRP, LIHC, LUAD, LUSC, PAAD, READ, and THCA) for which pathological tumor stage information was available. In consideration that the log-multiples of change of cytokines were relatively small across these cancers, we defined cytokines with an FDR of <0.05 as stage-specific cytokines. The heatmaps of significant genes were visualized using the ComplexHeatmap package.
Specificity score analysis
We quantified similarities among a gene's expression patterns across tissues using a specificity score adopted from Yan et al.36 The specificity score of each gene was calculated as follows. First, we calculated the average value (as measured in TPM) of a gene from all specimens in each tumor type or subtype. Then, the value of these average values was divided by the sum across tumor types or subtypes, which could be used to measure the propensity of gene expression in the various cancer types or subtypes. Based on the idea of a complete cancer type-specific or subtype-specific expression, we further constructed matrices that contained a value of 1 in corresponding tissue order, while all other values were 0 to represent perfect tissue-specificity. The number of matrices was equal to the number of tumor types or subtypes. Then, distances between a gene's expression profile across tumor types or subtypes and the perfect tumor-specific matrices were calculated using the JS divergence equation, by adding 10∼300 to each value while calculating Shannon entropy to prevent logging 0. Finally, the specificity score of each gene was calculated by the minimum value of (1—JS) values. The calculated specificity score ranged 0∼1, with larger values representing a higher degree of specificity of expression in one or more tumor types or subtypes. Distributions of JS specificity scores of cytokines and other PCGs were compared using the Kolmogorov–Smirnov test.
Unsupervised agglomerative hierarchical clustering analysis
Clusters were identified using the following parameters: distmethod = “euclidean” and hclustmethod = “average,” and dendrograms were visualized in polar type using the ape package.37
Survival analysis and meta-analysis
For each cancer type, correlations between 226 cytokines (that were expressed in at least one cancer type) and patients' overall survival were calculated using a Cox-proportional hazard model implemented in the survival and rms packages by introducing age and gender as covariates. Hazard ratios (HRs) were calculated from Cox-regression coefficients, and 95% confidence intervals (CIs) of the HRs were also estimated.
We further conducted a meta-analysis via a linear model as implemented in the metafor package. A random effects model was chosen, as it accounted for effect size heterogeneity among cancer types. In addition, the restricted maximum likelihood method was used to predict the random effect variance component (REVC) as it limited the α-error to around 5%.
Validation of prognostic potential of 261 cytokines in breast cancer
We collected 12 primary BRCA datasets (including GSE2034, GSE2603, GSE5327, GSE6532 (GPL96), GSE6532 (GPL570), GSE7390, GSE11121, GSE12276, GSE46928, GSE17705, GSE20685, and GSE25066), which comprised of 2,593 samples with distant metastasis annotation. All data sets were normalized using GCRMA algorithm.38 For each dataset with distant metastasis-free survival (DMFS) available, we adopted Cox-proportional hazard model by adjusting cancer grade to calculate prognostic significance of 261 cytokines. For each data set without DMFS data available, we conducted logistic regression test by adjusting cancer grade to assess the prognostic significance of 261 cytokines. The effect sizes of 261 cytokines were further meta-analyzed using random effects model to obtain combined statistics (effect size, 95% confidence intervals, and p value) of prognostic ability of each cytokine.
Drug-related target enrichment analysis
Information on drug target genes was obtained from the DrugBank database12 and TTD.13 We selected drug target genes based on several criteria: related to or targeted by approved drugs, and approved indications based on human orthologues. We further extracted cancer-related drugs manually by indications and combined data from the DrugBank and TTD using in-house R script. To assess the significance of enrichment of a defined gene set in the drug-related gene set, we conducted an enrichment analysis using a method proposed by Okada et al.11 Briefly, the FoE of overlapping defined gene sets to gene targets by drugs approved for cancer indications and all drug target genes was assessed by a 10,000-permutation procedure.
Statistical analysis
We used R (http://www.r-project.org/ and http://cran.r-project.org/) and Bioconductor (http://www.bioconductor.org/) to perform all statistical analyses.
Supplementary Material
Disclosure of potential conflicts of interest
No potential conflicts of interest were disclosed.
Funding
This work was supported by grants from the Ministry of Health and Welfare (MOHW105-TDU-B-212-134007), from the National Science Council (MOST 104-2320-B-038-016; MOST 105-2628-B-038 -001 -MY4), and from Taipei Medical University, Taiwan, ROC (12310-0223).
Author contributions
H.S.C.W and W.C.C designed the experiments. H.S.C.W analyzed the data. H.S.C.W, W.C.C., and W.C.H wrote the manuscript. H.S.C.W, C.M.C, W.C.H, X.L, and W.C.C. contributed to the manuscript preparation. W.C.C and W.C.H supervised the project.
References
- 1.Melief CJ, Finn OJ. Cancer immunology. Curr Opin Immunol 2011; 23:234-6; PMID:21292460; http://dx.doi.org/ 10.1016/j.coi.2011.01.003 [DOI] [PubMed] [Google Scholar]
- 2.Gajewski TF, Schreiber H, Fu YX. Innate and adaptive immune cells in the tumor microenvironment. Nat Immunol 2013; 14:1014-22; PMID:24048123; http://dx.doi.org/ 10.1038/ni.2703 [DOI] [PMC free article] [PubMed] [Google Scholar]
- 3.Dranoff G. Cytokines in cancer pathogenesis and cancer therapy. Nat Rev Cancer 2004; 4:11-22; PMID:14708024; http://dx.doi.org/ 10.1038/nrc1252 [DOI] [PubMed] [Google Scholar]
- 4.Wang D, Dubois RN, Richmond A. The role of chemokines in intestinal inflammation and cancer. Curr Opin Pharmacol 2009; 9:688-96; PMID:19734090; http://dx.doi.org/ 10.1016/j.coph.2009.08.003 [DOI] [PMC free article] [PubMed] [Google Scholar]
- 5.Gonzalez-Navajas JM, Lee J, David M, Raz E. Immunomodulatory functions of type I interferons. Nat Rev Immunol 2012; 12:125-35; PMID:22222875; http://dx.doi.org/ 10.1038/nri3133 [DOI] [PMC free article] [PubMed] [Google Scholar]
- 6.Lippitz BE. Cytokine patterns in patients with cancer: a systematic review. Lancet Oncol 2013; 14:e218-28; PMID:23639322; http://dx.doi.org/ 10.1016/S1470-2045(12)70582-X [DOI] [PubMed] [Google Scholar]
- 7.Wang E, Panelli MC, Monsurro V, Marincola FM. A global approach to tumor immunology. Cell Mol Immunol 2004; 1:256-65; PMID:16225768 [PubMed] [Google Scholar]
- 8.Schreiber RD, Old LJ, Smyth MJ. Cancer immunoediting: integrating immunity's roles in cancer suppression and promotion. Science 2011; 331:1565-70; PMID:21436444; http://dx.doi.org/ 10.1126/science.1203486 [DOI] [PubMed] [Google Scholar]
- 9.Bonecchi R, Locati M, Mantovani A. Chemokines and cancer: a fatal attraction. Cancer Cell 2011; 19:434-5; PMID:21481784; http://dx.doi.org/ 10.1016/j.ccr.2011.03.017 [DOI] [PubMed] [Google Scholar]
- 10.Gabrilovich D. Fatal attraction: How macrophages participate in tumor metastases. J Exp Med 2015; 212:976; PMID:26122939; http://dx.doi.org/ 10.1084/jem.2127insight1 [DOI] [PMC free article] [PubMed] [Google Scholar]
- 11.Okada Y, Wu D, Trynka G, Raj T, Terao C, Ikari K, Kochi Y, Ohmura K, Suzuki A, Yoshida S et al.. Genetics of rheumatoid arthritis contributes to biology and drug discovery. Nature 2014; 506:376-81; PMID:24390342; http://dx.doi.org/ 10.1038/nature12873 [DOI] [PMC free article] [PubMed] [Google Scholar]
- 12.Wishart DS, Knox C, Guo AC, Cheng D, Shrivastava S, Tzur D, Gautam B, Hassanali M. DrugBank: a knowledgebase for drugs, drug actions and drug targets. Nucleic Acids Res 2008; 36:D901-6; PMID:18048412; http://dx.doi.org/ 10.1093/nar/gkm958 [DOI] [PMC free article] [PubMed] [Google Scholar]
- 13.Chen X, Ji ZL, Chen YZ. TTD: Therapeutic target database. Nucleic Acids Res 2002; 30:412-5; PMID:11752352; http://dx.doi.org/ 10.1093/nar/30.1.412 [DOI] [PMC free article] [PubMed] [Google Scholar]
- 14.Hanahan D, Weinberg RA. Hallmarks of cancer: the next generation. Cell 2011; 144:646-74; PMID:21376230; http://dx.doi.org/ 10.1016/j.cell.2011.02.013 [DOI] [PubMed] [Google Scholar]
- 15.Capone F, Guerriero E, Colonna G, Maio P, Mangia A, Marfella R, Paolisso G, Izzo F, Potenza N, Tomeo L et al.. The cytokinome profile in patients with hepatocellular carcinoma and Type 2 diabetes. PLoS One 2015; 10 e0134594; PMID:26226632; http://dx.doi.org/ 10.1371/journal.pone.0134594 [DOI] [PMC free article] [PubMed] [Google Scholar]
- 16.Mlecnik B, Bindea G, Angell HK, Sasso MS, Obenauf AC, Fredriksen T, Lafontaine L, Bilocq AM, Kirilovsky A, Tosolini M. et al.. Functional network pipeline reveals genetic determinants associated with in situ lymphocyte proliferation and survival of cancer patients. Sci Transl Med 2014; 6:228ra37; PMID:24648340; http://dx.doi.org/24949964 10.1126/scitranslmed.3007240 [DOI] [PubMed] [Google Scholar]
- 17.Cohen RL, Settleman J. From cancer genomics to precision oncology-tissue's still an issue. Cell 2014; 157:1509-14; PMID:24949964; http://dx.doi.org/ 10.1016/j.cell.2014.05.027 [DOI] [PubMed] [Google Scholar]
- 18.Paradkar PH, Joshi JV, Mertia PN, Agashe SV, Vaidya RA. Role of cytokines in genesis, progression and prognosis of cervical cancer. Asian Pac J Cancer Prev 2014; 15:3851-64; PMID:24935564; http://dx.doi.org/ 10.7314/APJCP.2014.15.9.3851 [DOI] [PubMed] [Google Scholar]
- 19.Bindea G, Mlecnik B, Tosolini M, Kirilovsky A, Waldner M, Obenauf AC, Angell H, Fredriksen T, Lafontaine L, Berger A et al.. Spatiotemporal dynamics of intratumoral immune cells reveal the immune landscape in human cancer. Immunity 2013; 39:782-95; PMID:24138885; http://dx.doi.org/ 10.1016/j.immuni.2013.10.003 [DOI] [PubMed] [Google Scholar]
- 20.Costantini S, Castello G, Colonna G. Human Cytokinome: a new challenge for systems biology. Bioinformation 2010; 5:166-7; PMID:21364780; http://dx.doi.org/ 10.6026/97320630005166 [DOI] [PMC free article] [PubMed] [Google Scholar]
- 21.Cancer Genome Atlas Research, N . Comprehensive molecular characterization of urothelial bladder carcinoma. Nature 2014; 507:315-22; PMID:24476821; http://dx.doi.org/ 10.1038/nature12965 [DOI] [PMC free article] [PubMed] [Google Scholar]
- 22.Cancer Genome Atlas, N . Comprehensive molecular portraits of human breast tumours. Nature 2012; 490 61-70; PMID:23000897; http://dx.doi.org/ 10.1038/nature11412 [DOI] [PMC free article] [PubMed] [Google Scholar]
- 23.Cancer Genome Atlas, N . Comprehensive molecular characterization of human colon and rectal cancer. Nature 2012; 487:330-7; PMID:22810696; http://dx.doi.org/ 10.1038/nature11252 [DOI] [PMC free article] [PubMed] [Google Scholar]
- 24.Brennan CW, Verhaak RG, McKenna A, Campos B, Noushmehr H, Salama SR, Zheng S, Chakravarty D, Sanborn JZ, Berman SH et al.. The somatic genomic landscape of glioblastoma. Cell 2013; 155 462-77; PMID:24120142; http://dx.doi.org/ 10.1016/j.cell.2013.09.034 [DOI] [PMC free article] [PubMed] [Google Scholar]
- 25.Cancer Genome Atlas, N . Comprehensive genomic characterization of head and neck squamous cell carcinomas. Nature 2015; 517 576-82; PMID:25631445; http://dx.doi.org/ 10.1038/nature14129 [DOI] [PMC free article] [PubMed] [Google Scholar]
- 26.Cancer Genome Atlas Research, N . Comprehensive molecular characterization of clear cell renal cell carcinoma. Nature 2013; 499:43-9; PMID:23792563; http://dx.doi.org/ 10.1038/nature12222 [DOI] [PMC free article] [PubMed] [Google Scholar]
- 27.Cancer Genome Atlas Research, N, Linehan WM, Spellman PT, Ricketts CJ, Creighton CJ, Fei SS, Davis C, Wheeler DA, Murray BA, Schmidt L et al.. Comprehensive molecular characterization of papillary renal-cell carcinoma. N Engl J Med 2016; 374:135-45; PMID:26536169; http://dx.doi.org/ 10.1056/NEJMoa1505917 [DOI] [PMC free article] [PubMed] [Google Scholar]
- 28.Cancer Genome Atlas Research, N. Brat DJ, Verhaak RG, Aldape KD, Yung WK, Salama SR, Cooper LA, Rheinbay E, Miller CR, Vitucci M et al.. Comprehensive, integrative genomic analysis of diffuse lower-grade gliomas. N Engl J Med 2015; 372:2481-98; PMID:26061751; http://dx.doi.org/ 10.1056/NEJMoa1402121 [DOI] [PMC free article] [PubMed] [Google Scholar]
- 29.Cancer Genome Atlas Research, N . Comprehensive molecular profiling of lung adenocarcinoma. Nature 2014; 511:543-50; PMID:25079552; http://dx.doi.org/ 10.1038/nature13385 [DOI] [PMC free article] [PubMed] [Google Scholar]
- 30.Cancer Genome Atlas Research, N . Comprehensive genomic characterization of squamous cell lung cancers. Nature 2012; 489:519-25; PMID:22960745; http://dx.doi.org/ 10.1038/nature11404 [DOI] [PMC free article] [PubMed] [Google Scholar]
- 31.Cancer Genome Atlas Research, N . Integrated genomic analyses of ovarian carcinoma. Nature 2011; 474:609-15; PMID:21720365; http://dx.doi.org/ 10.1038/nature10166 [DOI] [PMC free article] [PubMed] [Google Scholar]
- 32.Cancer Genome Atlas Research, N . The molecular taxonomy of primary prostate cancer. Cell 2015; 163:1011-25; PMID:26544944; http://dx.doi.org/ 10.1016/j.cell.2015.10.025 [DOI] [PMC free article] [PubMed] [Google Scholar]
- 33.Cancer Genome Atlas Research, N . Integrated genomic characterization of papillary thyroid carcinoma. Cell 2014; 159:676-90; PMID:25417114; http://dx.doi.org/ 10.1016/j.cell.2014.09.050 [DOI] [PMC free article] [PubMed] [Google Scholar]
- 34.Cancer Genome Atlas Research, N. Kandoth C, Schultz N, Cherniack AD, Akbani R, Liu Y, Shen H, Robertson AG, Pashtan I, Shen R et al.. Integrated genomic characterization of endometrial carcinoma. Nature 2013; 497:67-73; PMID:23636398; http://dx.doi.org/ 10.1038/nature12113 [DOI] [PMC free article] [PubMed] [Google Scholar]
- 35.Ritchie ME, Phipson B, Wu D, Hu Y, Law CW, Shi W, Smyth GK. limma powers differential expression analyses for RNA-sequencing and microarray studies. Nucleic Acids Res 2015; 43:e47; PMID:25605792; http://dx.doi.org/ 10.1093/nar/gkv007 [DOI] [PMC free article] [PubMed] [Google Scholar]
- 36.Yan X, Hu Z, Feng Y, Hu X, Yuan J, Zhao SD, Zhang Y, Yang L, Shan W, He Q et al.. Comprehensive genomic characterization of long non-coding RNAs across human cancers. Cancer Cell 2015; 28:529-40; PMID:26461095; http://dx.doi.org/ 10.1016/j.ccell.2015.09.006 [DOI] [PMC free article] [PubMed] [Google Scholar]
- 37.Paradis E, Claude J, Strimmer K. APE: Analyses of phylogenetics and evolution in R language. Bioinformatics 2004; 20:289-90; PMID:14734327; http://dx.doi.org/ 10.1093/bioinformatics/btg412 [DOI] [PubMed] [Google Scholar]
- 38.Gharaibeh RZ, Fodor AA, Gibas CJ. Background correction using dinucleotide affinities improves the performance of GCRMA. BMC Bioinformatics 2008; 9:452; PMID:18947404; http://dx.doi.org/ 10.1186/1471-2105-9-452 [DOI] [PMC free article] [PubMed] [Google Scholar]
Associated Data
This section collects any data citations, data availability statements, or supplementary materials included in this article.