

ABSTRACT
It is becoming increasingly clear that tumor-associated neutrophils (TANs) play an important role in cancer biology, through direct impact on tumor growth and by recruitment of other cells types into the tumor. The function of neutrophils in cancer has been the subject of seemingly contradicting reports, pointing toward a dual role played by TANs in tumor progression. The existence of multiple neutrophil subsets, as well as phenotypic modulation of the neutrophils by various factors in the tumor microenvironment, has been shown. TGFβ plays a significant role in the determination of neutrophils' phenotype, by shifting the balance from an antitumor (N1) toward a more permissive (N2) phenotype. The full range of mechanisms responsible for the pro- vs. antitumor effects of TANs has not yet been elucidated. Therefore, the ability to identify the different neutrophil subpopulations in the tumor is critical in order to understand TANs evolution and contribution throughout tumor progression. Using a transcriptomic approach, we identified alternations in gene expression profile following TGFβ inhibition. We show that N1 and N2 TANs represent distinct subpopulations with different transcriptional signatures and both differ from naive bone marrow neutrophils. The analysis highlights a clear difference in pathways involved in neutrophil function such as cytoskeletal organization and antigen presentation, as well as alterations in chemokine profile, eventually affecting their effect on tumor cells and tumor growth. These data highlights several potential new pathways and mechanisms by which neutrophils can influence both the tumor cells and the adaptive immune system.
KEYWORDS: Chemokines, lung cancer, mesothelioma, transcriptomics, tumor-associated neutrophils
Introduction
Tumor immunosuppression is modulated via secretion of inhibitory cytokines as well as the recruitment of specific cell types to the tumor microenvironment.1,2 The phenotype of the myeloid cells (neutrophils and macrophages), which represent a key part of this immunosuppressive network, may be altered by the tumor microenvironment to support tumor growth.3-5 Despite growing evidence for the presence of multiple neutrophils subpopulations in cancer6,7, the role of neutrophils in tumor growth and metastatic progression has not yet been fully elucidated.8-10 Whereas several studies have provided evidence for neutrophils with pro-tumor functions such as promoting tumor angiogenesis11, tumor cell dissemination, and metastatic seeding in distant organs12-14, others have shown the existence of neutrophils with antitumor and anti-metastatic functions.15-20 These seemingly conflicting reports over the function of neutrophils in cancer is likely due to the existence of multiple neutrophil subsets21,22; a tumor promoting or N2 phenotype and an tumor-inhibitory or N1 phenotype. Interestingly, it has been proposed that there can be phenotypic or functional plasticity, where neutrophils infiltrating a tumor are modulated by cues present in the tumor environment.23 This has been well exemplified by recent works showing that TANs can be modulated and polarized toward an N1 phenotype by type-1 interferons24-26 or a pro-tumorigenic (N2) phenotype by the presence of TGFβ7 as demonstrated by the observation that systemic inhibition of TGFβ using a specific Alk5 kinase inhibitor called SM16 in mice caused a shift toward a pro-inflammatory and antitumor phenotype (N1).
Similarly to tumor-associated macrophages (TAMs), N2 TANs can exert their effect by secreting pro-tumor factors and by affecting other cells of the immune system in an immunosuppressive manner, for example, by inducing T-cell tolerance.7,27 Accordingly, depletion of N2-polarized TANs inhibits tumor growth and metastasis6,28 and reduces the level of immunosuppression in the tumor microenvironment, allowing for increased activity of CD8+ cytotoxic T-lymphocytes (CTL).7 In contrast, in the presence of type-I IFNs or absence of TGFβ, TANs display an antitumor N1 phenotype with increased tumor cytotoxicity, high neutrophil extracellular traps (NETs) expression, high ICAM1, and TNF-α expression.9,24,26
Using transcriptomic analysis29, we have previously shown that N2-polarized TANs display a dramatically different transcriptomic profile than both myeloid-derived suppressor cells (G-MDSCs) and naive bone marrow neutrophils (BMN), including the expression of a wide range of cytokines (CCL17, CCL2, CCL5). By secreting CCL17, TANs were further shown to recruit regulatory T-cells to the tumor site, thus inducing immunologic self-tolerance and impaired immune response to tumor cells.30 Conversely, inhibition of TGFβ-driven N2-polarization was shown to promote TANs' expression of cytokines such as CCL3 and TNFα, further attracting CD8+ T cells to the tumor site.
Since no definitive markers discriminating between pro-tumor (N2) and antitumor (N1) neutrophils have yet been established, the identification of neutrophils subsets in the tumor remains a challenge, limiting our understanding of the evolution TANs and their specific contribution throughout tumor progression.23 The purpose of this study was to gain a deeper understanding of N1 and N2 TANs' polarization states using a transcriptomics approach and to identify the genes and pathways modified following their polarization, resulting into their opposite anti or pro-tumor effect. We examined which pathways and gene-groups varied among these two populations of neutrophils and performed a detailed analysis of pathways related to the main functions of neutrophils, such as phagocytosis, antigen presentation, and specific immune effects, as well as response to stress and structural genes. Our data reveal a significant difference in chemokine/cytokine signature between N2 and N1 TANs, which might further help understanding the chemotaxis forces and role of neutrophils in tumor. Finally, we examined the differential functional effects of N1 and N2 neutrophils on tumor growth, finding that the overall N1 signature is cytotoxic to tumor cells, whereas N2 neutrophils contribute to tumor growth.
Results
Hierarchical clustering of neutrophils
BMN and TAN from control mice (N2 TAN) or mice where TGFβ function was blocked with SM16 (N1 TAN) mice were isolated and whole murine genome mRNA expression profiles of the three different groups were performed. As a first step, gene probes were filtered as described above, resulting in 16,077 informative genes that were significantly different between either two of the three groups (p < 0.05, FDR = 3%). Hierarchical clustering (Fig. 1A) and principal component analysis (PCA) (Fig. 1B) showed that following TGFβ blockade, the N1 neutrophils showed a distinct profile compared to neutrophils from tumors of untreated mice (N2 TAN) and both demonstrated a separate profile from BMN. N1 and N2 TANs were more highly related to each other than to the BMN.
Figure 1.
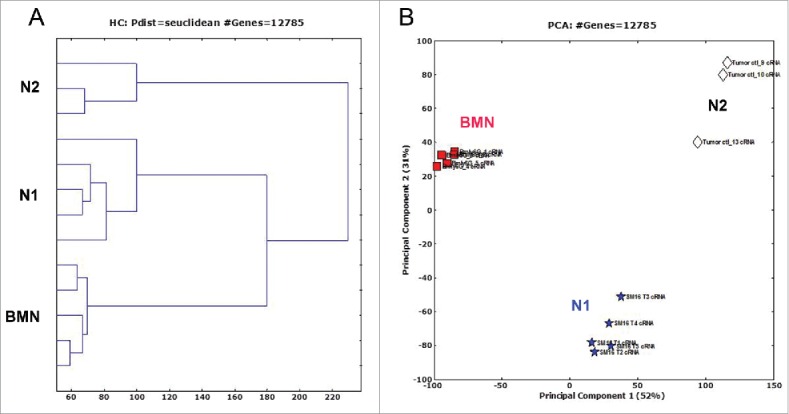
Hierarchical clustering (A) and principal component analysis (PCA) (B) of bone marrow naive neutrophils (BMN, □), tumor-associated neutrophils (N2 TANs, ⋄) and TANs following treatment with SM16 (N1 TANs, ☆), showing that the three neutrophils subpopulations display distinct transcriptomic profiles.
Genome-wide RNA expression profiles
Whole murine genome RNA expression profiles of TANs from the SM16-treated mice (N1) and control groups (N2) were compared to each other and to BMN to discern more specific differences.
When compared to BMN, we found the expression of 135 genes to be significantly altered in N1 and N2 by more than 30-fold (Fig. 2). As previously described29 and as we expected, the TANs had a very different signature than the BMN. We therefore focused on differences between the N1 and N2 cells.
Figure 2.

Heatmap of the 135 genes showing strongest alteration, with fold change higher than 30, between BMN, N1 and N2 subpopulations of neutrophils. Red – upregulation; blue – downregulation; white – no change from mean.
In a direct comparison between N1 and N2 TANs, we found 9,206 genes that were significantly different (p < 0.05, FDR = 2%). The fold changes were larger than 1.7 in 3,324 of the genes. Of these genes, 1,578 were upregulated and 1,746 downregulated in N2 TANs compared to N1 TANs. In order to further compare these differences, heatmaps of the genes most changed between the two groups were prepared. Fig. 3 shows a heatmap including all genes with a fold change of 10 or higher between samples. One hundred and thirty six (136) genes showed downregulation in N2 TANs compared to N1 TANs and only two upregulated in N2—the chemokine CCL17 and Gpr114 (see Table S1 for the list of genes).
Figure 3.
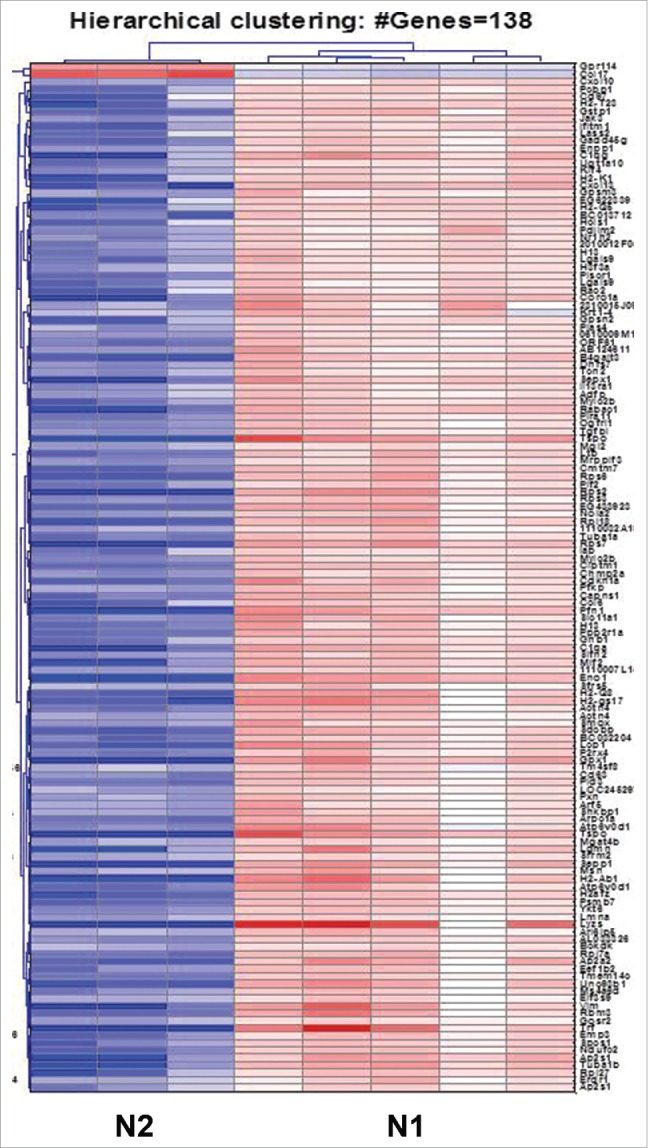
Heatmap of the 138 genes showing strongest alteration, with fold change higher than 10, between the N1 and N2 groups of neutrophils. The N1 TANs exhibit a markedly different signature compared to N2, with 136 genes upregulated and 2 genes downregulated with a fold change ≥ 10. (Red – upregulation; blue – downregulation; white – no change from mean). The list of genes is given in Table S1.
Evaluation of pathways and gene groups differences
In order to link genes to specific pathways, we evaluated key pathways and gene groups using Genomica (genomica.weizmann.ac.il) and Kegg pathway analyses (http://www.genome.jp/kegg/). Fig. 4 summarizes the main differences between the two populations, N1 and N2 TANs, as found with the Genomica program. We further directly evaluated pathways and gene groups related to describe neutrophil functions and activities. The overall expression levels comparing N1 to N2 and to BMN in both Genomica, Kegg and manually, is summarized in Table 1. These changes are described below in more detail.
Figure 4.
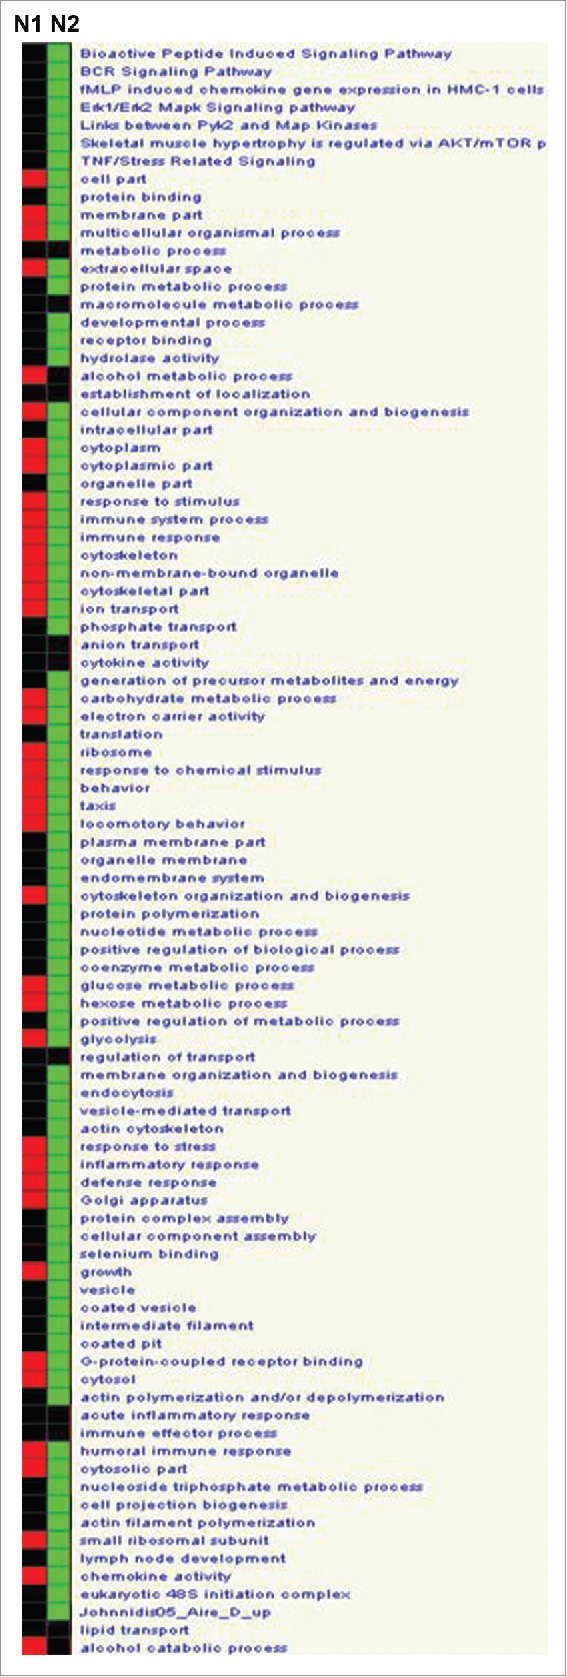
Analysis of pathways and gene groups using Genomica, comparing tumor-associated neutrophils (N2) to TANs following treatment with SM16 (N1). All N1 and N2 samples were evaluated individually for changes in the different pathways, and marked as positive change when ≥ 3 genes were significantly changed to the same direction. Groups were then compared to each other (p < 0.05, corrected). Red – upregulation; green – downregulation; black – no change from mean.
Table 1.
Summary of the relative changes in pathways and gene groups between naive bone marrow neutrophils (BMN), non-treated tumor neutrophils (N2) and following TGFβ inhibition with SM16 (N1).
| Neutrophil Function | BMN | N2 | N1 | ||
|---|---|---|---|---|---|
| Structural genes | Cytoskeleton | + | − | + | |
| Actin polymerization | ++ | + | ++ | ||
| Response to stress | TLRs | + | +/− | + | |
| Respiratory burst | ++ | +/− | +/− | ||
| Granule Proteins | Primary | ++ | − | − | |
| Secondary | ++ | − | − | ||
| Tertiary | +++ | ++ | ++ | ||
| Vesicle formation | Receptor-mediated phagocytosis | +++ | + | +++ | |
| Endocytosis | +/− | +/− | +/− | ||
| Apoptosis | Whole group | + | + | + | |
| NFkB anti-apoptotic | ++ | +/− | +/− | ||
| Inflammatory response | Whole group | − | ++ | +++ | |
| Antigen processing and presentation | − | ++ | +++ | ||
| Cytokine activity | − | ++ | ++ | ||
| Chemokine activity | − | +++ | +++ | ||
Pathways and gene groups were evaluated by the Genomica software, KEGG, and manually from the literature. The data of each neutrophils function evaluated for each population of neutrophils is presented.
(−) Most genes in the pathway/group were at background levels.
(+/−) Some genes of the pathway/group were upregulated and other downregulated.
(+) A related pathway/group was upregulated (Genomica), or some (>10 %) of the genes in the group were upregulated (manually).
(++) A related pathway/group was upregulated (Genomica), and/or a significant portion (>30 %) of the genes in the group were upregulated (manually).
(+++) A prominent upregulation of genes in the group/pathway (>50 %) was noted.
Cytoskeletal organization
Pathways related to cytoskeleton organization and biogenesis were upregulated in N1 TANs compared to N2 TANs. Many genes involved in actin binding and polymerization (e.g., Actn4, Arpc, Raf-1, LCP-1, Pfn-1) and focal adhesion assembly (Pxn, Msn) were elevated by more than 10-fold following TGFβ inhibition.
Granules proteins
Although BMN showed a generally higher expression of granule-related proteins than the N1 and N2 TANs, no changes were observed in the expression levels of granule-related genes from primary (Mpo, Elastase, CathepsinG), secondary (Lactoferrin, Stomatin, Gelatinase, MMP8), or tertiary (MMP9, Pglyrp, Pfc) structures, between N1 and N2 TANs.
Phagocytosis
Many genes related to phagosome formation and maturation were highly upregulated in N1 vs. N2 TANs. These included mRNAs for membrane-associated proteins (e.g., Tap, Sec61, Lamp2, Nramp1), microtubule-associated proteins (Coronin, Vamp2), as well as many phagocytic signaling pathway-related enzymes (Syk, Ptk2, PIK32, Pld2, cathepsin). Various receptors reported to be associated with phagosomes and neutrophils secretory vesicles (Borregaard 2007), including the Fcγ receptors CD32, CD16, the complement receptor CR3 (CD18), and C-lectin receptors (Mrc1, CD209), INFγR1 (CD119), TREM-1, and TNFR1 were also upregulated in N1.
Respiratory burst
The analysis of NADPH-oxidase-related genes involving fMLP, TLR, and PMA-stimulated respiratory burst showed no significant alterations between N1 and N2 subpopulations.
Immune response
There were several gene groups and pathways associated with immune response which showed significant differences between N1 and N2 subpopulations. Compared to N2, N1 TANs showed general upregulation of pathways related to immune responses and processes as a whole (Fig. 4), including inflammatory responses, cytokine activity, and chemotaxis.
Antigen processing and presentation
We found downregulation in pathways related to the role of neutrophils as antigen-presenting cells (APCs) to be a major change in N2 compared to N1. Remarkably, upregulation of MHC class-I-related loci in N1 TANs represented 6 out of the 138 most affected genes, all with a fold change larger than 10. On the other hand, MHC class-II-related genes showed little change at the mRNA level between N1 and N2. Interestingly, TAP1, calreticulin, and tapasin, which are involved in peptide loading and secretory processes, were also upregulated in N1 TANs. In addition, the lysosomal ATPase (Atp6v0d1) subunit and the lysosomal protease Legumain (Lgmn) were two of the strongest upregulated genes in this array (by 20- and 30-fold upregulation in N1, respectively), compared to N2 TANs.
Chemokines and cytokines
Although BMN displayed overall low expression levels of chemokines, chemokine genes were highly upregulated in both N1 and N2 TAN. Interestingly, some of the most prominent alterations in mRNA expression comparing N1 and N2 neutrophil populations were in chemokine gene expression (Fig. 5A). Out of the 25 chemokines tested, the expression level of 12 chemokines showed significant alterations by more than 2-fold in N1 compared to N2, with four of them (CXCL10, CXCL13, CCL17, and CCL6) different by more than 10-fold (Fig. 5B). These changes included a striking downregulation in N1 of chemoattractant for Treg-cells (CCL17), whose functional activity we have previously demonstrated30, as well as downregulation of chemokines involved in chemoattraction of neutrophils (CXCL1) and monocytes (CXCL14). In contrast, chemokines associated with B cells (CXCL13) and macrophages (e.g., CCL2, CXCL10, and CCL7) attraction were upregulated in N1. Although both N2 and N1 showed higher TNFα expression levels compared to BMN, TNFα message expression was highly upregulated in N1. IFNβ and IL6 mRNA, on the other hand, seemed to be expressed only in N2.
Figure 5.
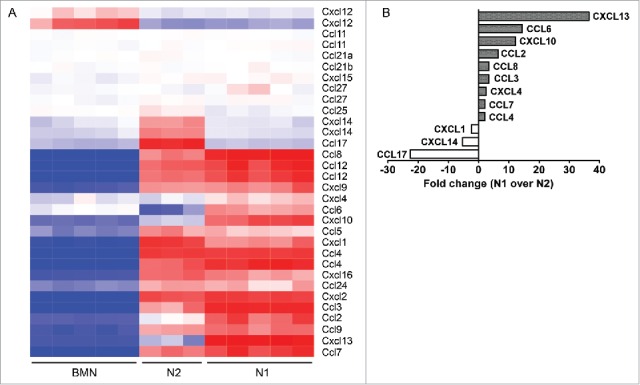
(A) Heatmap comparing the expression of 26 chemokines in the three groups of neutrophils – bone marrow naive neutrophils (BMN), tumor-associated neutrophils (N2 TANs), and following SM16 treatment (N1). Red – upregulation; blue – downregulation; white – no change from mean. (B) Summary of the chemokines most highly altered in N1 vs. N2, with a fold change higher than 2.
Signaling pathway components
We found that 21 out of the 741 genes with expression levels increased by more than 3-fold in N1 TANs were related to chemokine signaling pathways. These included the chemokine receptor CCR5, Gβγ subunit (Gnb1), IκB, STAT (Stat2), JAK (Jak2 and Jak3), Rac (Rac1 and Rac2), Raf-1, ERK (Erk1 and Ekr2), and PTK2. Some cytokine receptors such as IL13Ra and IL15Ra displayed higher expression levels in N1, whereas the expression of IL8RA, IL7R, and IL18R (involved in activation and recruitment of neutrophils) was found to be higher in N2.
Validation of gene array results by RT-PCR and ELISA
Most microarray results are now highly accurate, especially for highly regulated genes, and differences between microarray- and PCR-generated data occur mostly in the amplitude of the detected expression change. Nevertheless, we conducted real-time PCR validation of some of the gene expression changes between N1 and N2 TANs seen in the array (Fig. 6). In addition, we validated some of the genes using cells from animals bearing a different cell line, the lung cancer LKR line (in a different mouse strain). In general, the RT-PCR results were highly consistent with the microarray data, with a strong upregulation of N1 markers following SM16 treatment, in both AB12 and LKR models. Part of the validation was done prior to the transcriptomic analysis and has been previously published31. We further confirmed the protein levels of several cytokines and chemokines that were changed between N1 and N2 TANs (Fig. 7) by ELISA of conditioned media, and showed similar changes in the levels of proteins between the two populations in the chemokines and cytokines examined.
Figure 6.
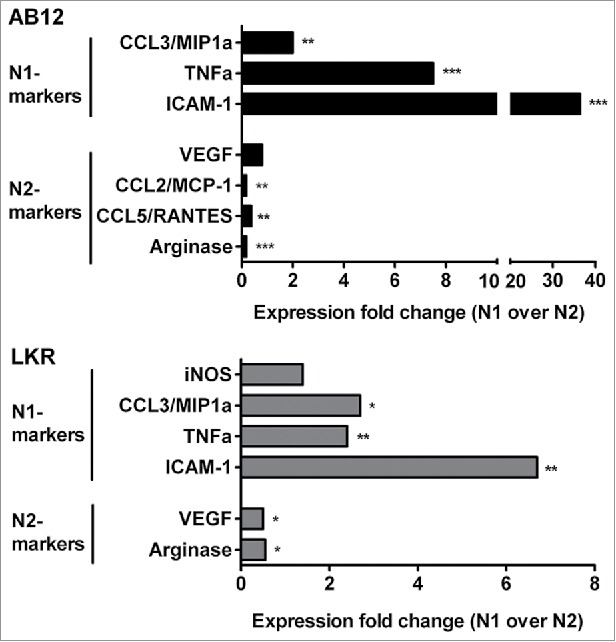
Gene expression for N1 and N2 markers in N1 TANs (following SM16 treatment) compared to N2 (N2 expression level =1). Selected results from the microchip array were confirmed using real-time RT-PCR in isolated tumor-associated neutrophils (TAN) from flank tumors of two separate tumor cell lines – the mesothelioma cell line AB12, and the non-small cell lung cancer LKR cell line. *p < 0.05; **p < 0.01; ***p < 0.001.
Figure 7.
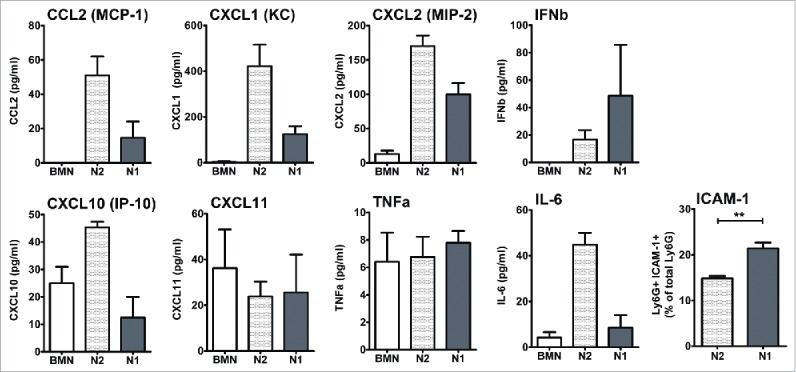
Validation of some of the cytokines' expression profiles found in the array at the protein level. Isolated neutrophils were incubated overnight and levels of chemokines and cytokines in medium was evaluated by ELISA. Percentage of TANs expressing the pro-inflammatory marker ICAM1 was evaluated by flow cytometry.
N1 TANs induce tumor cells apoptosis and delay in vivo tumor growth
In order to assess the N1 antitumor properties following anti-TGFβ intervention, we first tested whether N1 TANs display cytotoxic capacities toward tumor cells. Isolated TANs were co-cultured at varying ratios with luciferase-labeled AB12 tumor cells, and the number of viable tumor cells was determined after 24 h. N2 TANs from untreated mice were found to be non-cytotoxic up to a ratio of 20:1 (neutrophils to tumor cell), whereas N1 TANs isolated from the SM16-treated mice showed significantly killing at that ratio (Fig. 8A).
Figure 8.
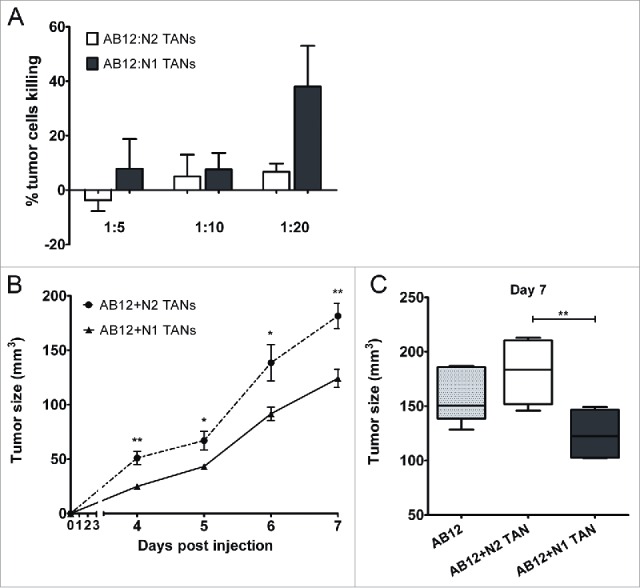
N1 TANs present antitumor properties. (A) Ly6G+ cells isolated from AB12 tumors from control (N2) and SM16-treated animals (N1) (n = 5–7 for each group) were co-cultured with AB12-luciferase cells at ratios of 1:5, 1:10 or 1:20 (tumor cells:TANs). The graph summarizes the percentage of tumor cell killing ± SEM at each ratio of co-culture at 24 h (n = 4–6). (B) In a Modified Winn Assay, AB12 tumor cells were injected together with N1 or N2 TANs (n = 6 in each group) and tumor growth was measured regularly. N1 TANs significantly impaired tumor growth and tumor size remained significantly low relative to N2 until the end of the experiment (day 7). (C) AB12 tumor cells injected alone had an intermediate growth compare to co-injection with either N1 or N2 TANs.
In addition, in order to test the impact of N1 vs. N2 TANs on tumor growth, AB12 tumor cells were injected to the flank of the mice, alone or in combination with either N1 or N2 TANs. Tumor size was then measured on a regular basis (Fig. 8B). The injection of N2 TANs with the tumor cells resulted in increased tumor growth compared to co-injection with N1 TANs that inhibited tumor growth (Fig. 8B). Interestingly tumor cells without TAN had an intermediate growth compare to co-injection with TANs, i.e., somewhat faster that mixture with N1 TAN and somewhat slower growth than in the mixture with N2 TANs (Fig. 8C).
Discussion
The immune system acts to protect the host against a wide variety of threats. However, in the context of cancer, immune cells exhibit functional plasticity, and undergo a dramatic phenotypic change, then regarded as “alternatively activated,” acting to promote tumor growth and progression.23 There has been extensive efforts to identify potential mechanisms through which neutrophils affect (contribute or impair) cancer progression10,32, and in particular via the orchestration of recruitment and activation of distinct immune cell types to the tumor site.33-36
TGFβ, available at high concentrations at the primary tumor microenvironment, was demonstrated to lead to the accumulation of N2-polarized pro-tumor neutrophils in the tumor, whereas TGFβ blockade7 as well as type-I IFN26 shift the balance toward a more antitumor (N1) phenotype.
In this study, we have employed transcriptomic analysis in order to compare the gene expression profile and characterize the genes and pathways mostly alternated between N1 and N2 neutrophils. The main finding of our unbiased pathways analysis is the existence of a general downregulation in the N2 TANs of genes involved in immune-related functions such as antigen-presentation, immune responses, and chemokines profiles. Other differences between these two neutrophils subpopulations were noted as well.
N2 TANs showed a relative downregulation of gene expression related to cytoskeleton organization and actin polymerization, compared to BMN and N1 TANs. It has been proposed that early in tumor development, TANs which demonstrate a more cytotoxic profile (therefore N1 polarized) are found primarily at the periphery of the tumor. Only at later stages of tumor progression, are neutrophils found inside the tumor.31 It is therefore possible that, following infiltration into the center of the tumor, TANs downregulate their activity related to cytoskeletal organization, losing their ability to leave the tumor microenvironment.
The production by neutrophils of remarkable amounts of ROS and RNS species such as O2− and NO, through the activity of phagocyte NADPH oxidase and nitric oxide synthase (NOS), has been considered to function primarily in host defense as antimicrobial factors. In the context of cancer, ROS associated with infiltrating neutrophils may play a tumor-promoting role during carcinogenesis by exerting genotoxic effects37 (likely by contributing to DNA damage and genetic instability). However, once the tumor is established, ROS could either have antitumor effects by direct cytotoxicity38 or pro-tumor effects by inhibiting other immune cells (i.e., CD8+ T cells), leading to alteration of immune-mediated antitumor effects. To make matters more complicated, it has been suggested that ROS production, via a mechanism involving Lyn and NADPH-oxidase activation, is responsible for the characteristic rapid spontaneous apoptosis in neutrophils.39 Interestingly, our preliminary data shows that tumor neutrophils survive longer than circulating or bone-marrow-derived neutrophils. Our study surprisingly revealed a general downregulation in the expression of granule- and respiratory burst- related genes in N1 and N2 TANs compared to BMN, and gene expression levels did not appear different between N2 and N1 TANs. This is in contrast to previous studies showing higher production of NO and H2O2 production in TANs isolated at early stages of the tumor (suggested to be more N1 proned).31 In view of the fact that the levels of ROS released by cells are the product of the regulation of production vs. catalysis (by enzymes such as superoxide dismutases-SODs), the mRNA levels may not reflect the differences in ROS production between these two subpopulations. Further studies will be needed in order to assess a regulatory change in ROS production by N1 vs. N2.
Many integrins and membrane receptors associated with secretory vesicles were strongly upregulated in N1 TANs compared to N2. The intracellular compartments termed “secretory vesicles,” which are triggered to fuse with the plasma membrane in response to alterations in intracellular calcium, provide a structural basis for the transition of the neutrophil from a cell with few receptors on its surface (therefore with minimal responsiveness) to a highly responsive cell.40 IFNγR1, also called CD119, is for example, one of the receptors found to be expressed in BMN and N1 but strongly downregulated in N2. IFNγ is a potent modulator of neutrophil functions. Recent studies have demonstrated that treatment of PMN with IFNγ elicits a variety of responses, including differential gene expression, increased production of reactive oxygen species, and enhanced expression of surface markers.41 Andzinski et al.26 have recently demonstrated that in the presence of IFNγ tumor-neutrophils tend to express typical N1 markers, suggesting that this receptor may be an important player in the plasticity of tumor-related neutrophils. Downregulation of CD119 (IFNγR1) in neutrophils has been shown to impair the secretion of the IFNγ-inducible chemokines IP-10/CXCL10 and MIG/CXCL9 in infected neutrophils in a model of infection.42 The upregulation of IFNγR1 in N1 TANs could also be an example of modulation in N1 responsiveness to environmental cues, such as IFNγ released by cytotoxic T-cells.
Many genes related to the immune system were modified when comparing N1 to N2 TANs, with most (but not all) of them upregulated in N1 TANs. One area of potential importance in modulating the immune response is antigen presentation. Our results show that the expression of many genes related to antigen presentation, especially those related to MHC class I, are strongly upregulated in N1 TANs. Accumulating data from the last decade shows that neutrophils can participate in MHC class I and class II restricted antigen presentation, being capable of collecting and cleaving antigens, forming complexes with MHC molecules, expressing co-stimulatory molecules, and inducing T-cell differentiation.43,44 It has also been reported that neutrophils can express co-stimulatory molecules such as CD80 and CD86, as well as the DC marker CD83.45 This has led some to propose that PMN cells are able to trans-differentiate into DC-like cells under appropriate stimulatory conditions. Interestingly, the co-stimulatory molecules CD80, CD83, and CD86 were upregulated in both N1 and N2 TANs compared to BMN, but only CD83 revealed a slight upregulation in N2s compared to N1.
The presence of higher expression levels of MHC class-I antigen presentation-related genes in N1 is consistent with reports that TANs isolated from early tumors preferentially recruit and mediate the activation of cytotoxic CD8+ T cells.7,20 N2 neutrophils, on the other hand, have been suggested to prime a Th1- and Th17-acquired immune response via expression of the MHC class II.43
Youn et al.46 recently found that compared to peritoneal neutrophils isolated from naive mice, splenic G-MDSCs of tumor-bearing mice displayed downregulation in gene expression and pathways linked to immune responses involving antigen-presentation through MHC class II, as well as multiple cytokines signaling pathways. Multiple studies have shown the ability of neutrophils to acquire potent APC capabilities and cross-present antigens to T cells.44 The impact of neutrophils on the function of T cells has been suggested in vitro and in vivo in various models of infection and cancer20,27,30,47, and the overall activation status of immune cells within tumors is likely to be orchestrated by a combination of signals including chemokines/cytokines.33,48
One of the most prominent differences that we found among N1 and N2 was a significant difference in their cytokines and chemokines signature (Figs. 5 and 7), supporting the notion that tumor neutrophils play an important role in the recruitment of immunocytes and in the balance between activation and suppression of the immune system. Although N2 TANs have been reported to favor the recruitment of T-regs within the tumor, we also find N2 TANs expressed TGFbeta, IL-6, and IL-23, a combination of cytokines which has been suggested to promote Th17 priming.49,50 Interestingly, whereas Th17 cells' contribution to inflammation has been well established, their role in tumor immunity has been debated, with multiple reports showing either pro-inflammatory or regulatory properties depending on additional cues the Th17 cells encounter from the environment.51
N1 TANs expressed higher levels of the message for the pro-inflammatory cytokines IL-12 and TNF-α, together with various T cell- and macrophages- attracting chemokines (CXCL10, CCL7, CCL2, and CCL3). CCL17 and CXCL14 were the two chemokines that were the most downregulated in N1 TANs compared to N2. Whereas CCL17 has been shown to attract T-regs30, CXCL14 possesses chemoattractive activity for activated macrophages, immature dendritic cells, and natural killer NK cells. The clinical importance of this chemokine as a regulator of immunocytes recruitment should be further investigated.
Altogether, our results on the up and downregulation of chemokines in these two neutrophil subpopulations reinforce an emerging view of TANs as active orchestrators of innate and adaptive immunity. Our data is also consistent with the suggestion that a potential source for chemokines inside the tumor originate from the intratumoral TANs, which constitute a notable percentage of tumor immune cells.
TGFβ-blockade in mice using SM16 was previously demonstrated7 to result in higher tumor cytotoxicity by the intratumoral CD11b+ population, which correlates with an increase in H2O2 production. Following TGFβ blockade, the neutrophilic Ly6G+ fraction was found significantly increased at the expense of the macrophages faction and TANs were demonstrated to be the main contributors to the observed direct cytotoxicity toward tumor cells. In line with these findings, we show here that following anti-TGFβ treatment, isolated TANs present direct cytotoxicity toward tumor cells and delay in vivo tumor growth, demonstrating antitumor properties (N1).
Our study was performed in one type of tumor only, i.e., the mesothelioma cell line AB12, it is therefore possible to argue that the gene expression characteristics presented here are representative of the TANs recruited to this tumor type only. Some of the transcriptomics results were confirmed in a different cell line, the non-small cell lung cancer LKR. However, further analyses will be needed in order to establish the generalization of our data to other tumor systems.
The interpretation of the changes in the phenotype of TANs during tumor progression still represents a challenge. It should be noted that when specifically comparing N1 TANs to BMN, one need to take in consideration that TGFβ-blockade might have affected the profile of bone marrow naive cells as well. Interestingly, there was no effect of TGFβ-blockade on the percentage of total splenic myeloid cells (CD11b+), splenic granulocytic fraction (Ly6G+), or monocytic fraction (Ly6C+) in tumor-bearing mice (Fig. S1). It appears therefore that the anti-TGFβ intervention itself does not change the production rate of precursor cells but rather changes the phenotype of the neutrophils, the local chemoattraction forces, and/or the intratumoral polarization of neutrophils.
The origin of the neutrophils in the tumor microenvironment and the question of whether neutrophils' polarization occurs outside the tumor or following their infiltration inside the tumor microenvironment still remain unanswered. It is possible, for example, that N2 and N1 TANs originate from different circulating neutrophil subpopulations which display some permissive vs. cytotoxic properties, respectively, already in the circulation, as described by us and others.21,52 Alternatively, it is possible that their functional polarization will occur after their infiltration to the tumor micro-environment and result from the various cues present in the tumor (such as TGFβ). It remains therefore to be determined from which “naive” pool(s) TANs are recruited to the tumor (bone marrow/blood pool or splenic G-MDSC), what are the factors modulating their polarization, and when does this polarization occur (in the circulation or within the tumor). When comparing splenic G-MDSCs isolated from tumor-bearing mice to peritoneal neutrophils of naive mice, Youn et al.46 showed that these two cell types are morphologically and phenotypically similar (based on cellular markers) and yet have distinct transcriptional profile and functional activity. They proposed that in the context of cancer, G-MDSCs halt their transition into neutrophils and acquire instead immune-suppressive features. Gregory and Houghton35 argued that changes in TAN resulted from an alternation in state of activation rather than a switch into a unique transcriptional program. Our data suggests that some distinctive transcriptional changes do occur in the phenotypic switch of tumor-neutrophils. Borregaard et al.53 suggested that circulating neutrophils display two profiles of transcriptional and protein synthetic activities—one in the bone marrow and the second upon migration into tissues, resulting mainly in the secretion of cytokines and chemokines. We have previously shown that N2-polarized TANs display dramatically different transcription programs than both BMN and G-MDSC, supporting the notion that TAN are not “tissue-based G-MDSC,” but are rather a distinct subpopulation of neutrophils.29 Although this study does not provide an answer about the origin of each neutrophil population, our current findings, as well as previously published results21, suggest that they are more than two profiles of neutrophils, representing several subpopulations. Further analysis of the transcriptomics and characteristics of BMN, splenic and/or blood precursor cells (CD11b+ Ly6G+) following anti-TGFβ treatment will be needed in order to fully understand the possible changes in the general phenotype of myeloid precursor cells and the forces promoting the presence of N1 vs. N2 TANs in the tumor.
In contrast to circulating neutrophils, the depiction TANs immuno-editing in human cancer patients remains an extremely challenging task. Individuals at various stages of the disease do not routinely go through tumor extraction or biopsies, and will most probably go through chemotherapy and radiation therapy first. Although immunohistochemistry works have been able to relate between the presence of tumor neutrophils and prognostics, and many human tumors over-express TGFβ, clinical data from patients over the nature and function of human TANs is still very minimal. In addition, due to the lack of specific markers, a functional characterization of N1 and N2 TANs in human patients is still missing. Recently, Eruslanov et al.20 have demonstrated TANs isolated from human early stage lung cancer produce pro-inflammatory factors such as MCP1, IL8, and IL6 and stimulate T cell response. These findings are in line with previous work showing that TANs from early tumors (in mouse models) present stronger pro-inflammatory profile whereas they acquire stronger permissive profile with tumor progression.31
Although the exact characterization and identification of N1 and N2 subsets in human tumors has yet to be achieved, in our recent publication21, we identified three distinct neutrophil populations in the circulation of human patients during cancer progression, dividing them into high-density neutrophils (HDN) which demonstrate mature phenotype and low-density neutrophils (LDN) which can be further separated into mature and immature subpopulations. While mature HDNs present cytotoxic capacity toward tumor cells, mature LDN showed suppressive properties usually associated with MDSC. Although the presence of these circulating subpopulation holds true in human as well in mice models, the fate and the phenotype of neutrophils upon entrance into the human tumor micro-environment is still to be studied.
In conclusion, we show that BMN, N1, and N2 TANs are three distinct subpopulations with different transcriptional signatures. A large number of genes and pathways were found alternated following TGFβ inhibition, with a general upregulation for pathways related to immune response in N1 TANs. N2 TANs showed specific expression signature, distinct from N1 and BMN, in genes related to neutrophil immune function in pathways such as antigen presentation and chemokine/cytokine profile. As specific markers discriminating between pro- and antitumor neutrophils have yet to be identified, the isolation and phenotyping of these neutrophil populations is still not possible without interventions such as IFNβ or anti-TGFb treatments.7,24 The identification of characteristic markers will allow in the future the specific isolation of these neutrophils subpopulations directly from the developing tumor without the need of such manipulations. Importantly, although we have described differences between early and late-tumor TANs, there was no exact similarity to the N1-N2 polarization.31 Our data shed light on the multiple alternations which altogether determine the phenotype and activation state of each subpopulation, ultimately driving their anti vs. pro-tumor function. Our findings also highlight several potential new pathways by which neutrophils can influence both the tumor cells and the tumor-related adaptive immune system, and may support future investigations on the functional role and contribution of the different TAN subpopulations in tumor growth and progression.
Materials and methods
Animals ethics statement
Mice were purchased from Taconic Labs (Germantown, NY), and Jackson Labs (Bar Harbor, ME). This study was carried out in accordance with the recommendations in the Guide for the Care and Use of Laboratory Animals of the National Institutes of Health. The protocol was approved by the Committee on the Ethics of Animal Experiments of the University of Pennsylvania (Permit Number: 80-2606).
Cell lines and animal tumor models
The murine malignant mesothelioma cell line, AB12 was derived from an asbestos-induced tumor in a Balb/C mouse. The murine lung cancer line LKR was derived from an explant of a pulmonary tumor from an activated Kras G12D mutant mouse that had been induced in an F1 hybrid of 129Sv.J and C57BL/6.7
Balb/c and B6/129 mice were injected on the right flank with 1 × 10⁶ AB12 or LKR tumor cells, respectively. The flank tumors were allowed to reach an average size of 300–500 mm3 (approximately 15–21 d), before neutrophils were isolated as described below.
SM16, a TGF-β receptor kinase inhibitor
The chemical structure and biochemical characteristics of SM16, a 430 MW ALK4/ALK5 kinase inhibitor produced by Biogen Idec, has been previously published.54 As described previously7, SM16 was formulated into chow at a dose of 0.45 g/kg of chow55,56, and tumor-bearing mice were treated with SM16 or control chow ad libitum for 5 d. Neutrophils isolated from tumors of mice treated with SM16 were designated as N1 TAN.
Isolation of neutrophils from tumors and bone marrow
TANs—After reaching a size of 250–300 mm3, tumors were harvested, minced, and digested with 2 mg/mL DNaseI (Sigma, 10104159) and 4 mg/mL collagenase type IV (Sigma 5138) at 37°C for 1 h. Whole tumor stroma was then centrifuged at 1200 rpm for 10 min at room temperature and cells were then stained using anti-CD11b antibody (BD Bioscience, 564454). CD11b+ cells were then isolated using magnetic beads (Miltenyi Biotec, Germany) per manufacturer's instructions. The isolated fraction of CD11b+ cells was then stained with Ly6G-PE antibodies (BD Biosciences, 551461) and CD11b+/Ly6G+ cells (TAN) were further isolated through using Beckman—Coulter EPICS Elite ESP FACS Sorter (Fullerton, CA). In all samples used, a purity of above 85% neutrophils was achieved.
Bone marrow naive neutrophils (BMN) were harvested from non-tumor bearing mice. Mice were euthanized, and bone marrow was harvested by flushing the femurs and tibias with HBSS media. Cells were then separated by centrifugation (rpm, min, RT) over a three-layer discontinuous Percoll gradient as previously described.57
Gene microarray
mRNA from each of the three subgroups (3–7 samples per group) was isolated using RNEasy Kit (Qiagen, 74104). Samples were processed as BMN, N2 TAN, and N1 TAN, and hybridized to the Illumina mouse genome bead arrays. Raw data was processed by Bead Studio v.3.0 software. Expression levels were exported for signal and negative control probes. The set of negative control probes was used to calculate average background level for further filtering and background subtraction steps. Average values of the signal probe expression data for the 5 BMN, 5 N1, and 3 N2 sample arrays were used as a base for normalization and all the arrays were quantile-normalized against this base, and filtered to remove non-informative probes. A probe was called non-informative if it had detection p value >0.05 in all samples or if the maximal ratio between expression values of each two samples was lower than 1.2.
The microarray data complies with the MIAME guidelines, and the data will be deposited in a publicly available database, upon acceptance.
RNA isolation and real-time, reverse transcription-PCR
RNA from BMN and TANs with or without SM16 treatment (N1 and N2 TANs, respectively) was isolated as described above. For each group, a pool of RNA was created by adding the same amount of RNA from each of the samples within the group. Absorbance at 260/280 nanometers for mRNA purity at a ratio above 1.9 was achieved for all samples used. cDNA was made from each pool, RNA levels were normalized to β-actin levels, and quantification of gene expression levels was performed. Differences in gene expression were determined by comparing the number of PCR cycles required to achieve a threshold of fluorescent activity above background during the exponential phase of the reaction. Normalization was performed by the simultaneous amplification of β-actin for each sample. Each sample was run in quadruplicate and the experiment was repeated at least once. Primer sequences are given in Table S2.
Protein validation
In order to validate some of the RNA data at the protein level, neutrophils were isolated as described above. 4 × 10⁶ neutrophils were then plated in a well of a 12-well plate, and covered with 1 mL of medium. After 24 h, the supernatant was collected, centrifuged at 1200 rpm, 10 min, 4 C, and stored at −80°C until cytokine levels measured. The level of different proteins was evaluated using ELISA sets for IL6 (BD Biosciences, 555240), and CCL2/MCP1 (BD Biosciences, 555260), and Duoset ELISAs for CCL1 (R&D Systems, DY845), CXCL11 (R&D Systems, DY572), CXCL2/MIP2 (R&D Systems, DY452), TNFalpha (R&D Systems, DY410), and CXCL10/IP10 (R&D Systems, DY466).
In order to evaluate expression of ICAM1 in TANs, isolated N1 and N2 TANs were re-suspended in flow cytometry buffer (PBS supplemented with 2% FCS and 0.01% sodium azide), blocked with “Fc blocker” (CD16/CD32, BD Biosciences,553142) and stained with FITC-Ly6G (BD Biosciences, 551460) and PE-ICAM-1 (BD Biosciences, 553253) antibodies or matched isotype controls (all from BD Biosciences). Immunostained cells were then analyzed with LSRII flow cytometry (BD Biosciences) using FlowJo software (Ashland, OR).
Evaluation of tumor cytotoxicity by immune cell subsets
In order to evaluate tumor cytotoxicity of N1 and N2 TANs, we used an AB12 mesothelioma-cell line transfected with a luciferase reporter (AB12-Luc). AB12-Luc cells were plated in 96-well plates and the N1 or N2 TANs subsets were co-cultured with the tumor cells at a ratio of one tumor cell to 5, 10, or 20 neutrophils. After 24 h, non-adherent cells were washed away with PBS, the number of surviving cells was evaluated using the dual luciferase reporter assay system (Promega, Madison WI), and the percentage of killing was calculated.
WINN assay
N1 and N2 TANs were first isolated from AB12 tumors of tumor-bearing control or anti-TGFβ antibody 1D11 treated mice. TANs were then injected with AB12 tumor cells into Balb/c mice in various combinations. The mice were divided into three groups (n = 6 to 7) and injected subcutaneously on the right flank. The first group was injected 1 × 10⁶ AB12 cells; a second group was injected with a mixture containing 1 × 10⁶ AB12 cells and 1 × 10⁶ N1 TANs (ratio of 1:1); a third group was injected with a mixture containing 1 × 10⁶ AB12 cells and 1 × 10⁶ N2 TANs (ratio of 1:1). Tumor size was measured every day using a caliper and calculated according to the formula [length × width2 × 3.14 /6] (mm3).
Statistical analyses
Gene array data was filtered following quantile normalization as described above. Hierarchical clustering was done for evaluation of similarity between samples in the same group, followed by PCA analysis. To compare genes that are different between at least two of the groups, we used one-sided ANOVA on the quantile normalization data with appropriate post hoc testing.
Genomica software (http://genomica.weizmaBMN.ac.il/) was used to identify enrichment patterns of experimental signatures associated with the different neutrophils groups.29,58,59 We evaluated about 2,300 pathways and gene groups based on the suggested “mouse GO” and “mouse Biocarta” murine gene repositories. Data were log2 transformed and mean centered. Genes whose expression was 2-fold or greater than the mean expression level were scored. Enrichment of over-expressed or under-expressed genes that belong to each tested gene signature was calculated using a hypergeometric test and a false discovery rate (FDR) calculation to account for multiple hypothesis testing. (p < 0.05, FDR < 0.05). The fraction of samples showing significant enrichment for a particular gene signature in each group (BM/N2/N1) was calculated.
Heatmaps for lists of genes were composed using two-way hierarchical clustering with normalized Euclidean distance to cluster samples and Spearman correlation distance to cluster genes, with the genes ordered accordingly. When the three samples were compared, the fold change was calculated as the group with the highest mean expression versus the group with the lowest mean expression. For some specific neutrophilic functions, we manually evaluated the specific changes of genes.
For the RT-PCR evaluations, comparing differences between two groups (N1 and N2 TANs), we used unpaired Students' t-tests. Differences were considered significant when p < 0.05.
Supplementary Material
Disclosure of potential conflicts of interest
No potential conflicts of interest were disclosed.
Funding
This work was supported by a grant from the Chief Scientist of the Israel Ministry of Health (ZGF), by the Israel Lung Association (ZGF) and by a National Cancer Institution grant PO1 CA 66726 (SMA).
ORCID
Wenhwai Horng http://orcid.org/0000-0002-1490-1470
References
- 1.Joyce JA, Pollard JW. Microenvironmental regulation of metastasis. Nat Rev Cancer 2009; 9:239-52; PMID:19279573; http://dx.doi.org/ 10.1038/nrc2618 [DOI] [PMC free article] [PubMed] [Google Scholar]
- 2.Polyak K, Haviv I, Campbell IG. Co-evolution of tumor cells and their microenvironment. Trends Genet 2009; 25:30-8; PMID:19054589; http://dx.doi.org/ 10.1016/j.tig.2008.10.012 [DOI] [PubMed] [Google Scholar]
- 3.Lewis CE, Pollard JW. Distinct role of macrophages in different tumor microenvironments. Cancer Res 2006; 66:605-12; PMID:16423985; http://dx.doi.org/ 10.1158/0008-5472.CAN-05-4005 [DOI] [PubMed] [Google Scholar]
- 4.Mantovani A, Cassatella MA, Costantini C, Jaillon S. Neutrophils in the activation and regulation of innate and adaptive immunity. Nat Rev Immunol 2011; 11:519-31; PMID:21785456; http://dx.doi.org/ 10.1038/nri3024 [DOI] [PubMed] [Google Scholar]
- 5.Galdiero MR, Garlanda C, Jaillon S, Marone G, Mantovani A. Tumor associated macrophages and neutrophils in tumor progression. J Cell Physiol 2013; 228:1404-12; PMID:23065796; http://dx.doi.org/ 10.1002/jcp.24260 [DOI] [PubMed] [Google Scholar]
- 6.Pekarek LA, Starr BA, Toledano AY, Schreiber H. Inhibition of tumor growth by elimination of granulocytes. J Exp Med 1995; 181:435-40; PMID:7807024; http://dx.doi.org/ 10.1084/jem.181.1.435 [DOI] [PMC free article] [PubMed] [Google Scholar]
- 7.Fridlender ZG, Sun J, Kim S, Kapoor V, Cheng G, Ling L, Worthen GS, Albelda SM. Polarization of tumor-associated neutrophil phenotype by TGF-beta: “N1” versus “N2” TAN. Cancer Cell 2009; 16:183-94; PMID:19732719; http://dx.doi.org/ 10.1016/j.ccr.2009.06.017 [DOI] [PMC free article] [PubMed] [Google Scholar]
- 8.Piccard H, Muschel RJ, Opdenakker G. On the dual roles and polarized phenotypes of neutrophils in tumor development and progression. Crit Rev Oncol Hematol 2011; 82:296-309; PMID:21798756; http://dx.doi.org/ 10.1016/j.critrevonc.2011.06.004 [DOI] [PubMed] [Google Scholar]
- 9.Granot Z, Jablonska J. Distinct functions of neutrophil in cancer and its regulation. Mediators Inflamm 2015; 2015:701067; PMID:26648665; http://dx.doi.org/ 10.1155/2015/701067 [DOI] [PMC free article] [PubMed] [Google Scholar]
- 10.Powell DR, Huttenlocher A. Neutrophils in the tumor microenvironment. Trends Immunol 2015; 37:41-52; PMID:26700397; http://dx.doi.org/ 10.1016/j.it.2015.11.008 [DOI] [PMC free article] [PubMed] [Google Scholar]
- 11.Nozawa H, Chiu C, Hanahan D. Infiltrating neutrophils mediate the initial angiogenic switch in a mouse model of multistage carcinogenesis. Proc Natl Acad Sci U S A 2006; 103:12493-8; PMID:16891410; http://dx.doi.org/ 10.1073/pnas.0601807103 [DOI] [PMC free article] [PubMed] [Google Scholar]
- 12.De Larco JE, Wuertz BR, Furcht LT. The potential role of neutrophils in promoting the metastatic phenotype of tumors releasing interleukin-8. Clin Cancer Res 2004; 10:4895-900; PMID:15297389; http://dx.doi.org/ 10.1158/1078-0432.CCR-03-0760 [DOI] [PubMed] [Google Scholar]
- 13.Kowanetz M, Wu X, Lee J, Tan M, Hagenbeek T, Qu X, Yu L, Ross J, Korsisaari N, Cao T et al.. Granulocyte-colony stimulating factor promotes lung metastasis through mobilization of Ly6G+Ly6C+ granulocytes. Proc Natl Acad Sci U S A 2010; 107:21248-55; PMID:21081700; http://dx.doi.org/ 10.1073/pnas.1015855107 [DOI] [PMC free article] [PubMed] [Google Scholar]
- 14.Wculek SK, Malanchi I. Neutrophils support lung colonization of metastasis-initiating breast cancer cells. Nature 2015; 528:413-7; PMID:26649828; http://dx.doi.org/ 10.1038/nature16140 [DOI] [PMC free article] [PubMed] [Google Scholar]
- 15.Colombo MP, Lombardi L, Stoppacciaro A, Melani C, Parenza M, Bottazzi B, Parmiani G. Granulocyte colony-stimulating factor (G-CSF) gene transduction in murine adenocarcinoma drives neutrophil-mediated tumor inhibition in vivo. Neutrophils discriminate between G-CSF-producing and G-CSF-nonproducing tumor cells. J Immunol 1992; 149:113-9; PMID:1376745 [PubMed] [Google Scholar]
- 16.Ishihara Y, Fujii T, Iijima H, Saito K, Matsunaga K. The role of neutrophils as cytotoxic cells in lung metastasis: suppression of tumor cell metastasis by a biological response modifier (PSK). In Vivo 1998; 12:175-82; PMID:9627799 [PubMed] [Google Scholar]
- 17.Hicks AM, Riedlinger G, Willingham MC, Alexander-Miller MA, Von Kap-Herr C, Pettenati MJ, Sanders AM, Weir HM, Du W, Kim J et al.. Transferable anticancer innate immunity in spontaneous regression/complete resistance mice. Proc Natl Acad Sci U S A 2006; 103:7753-8; PMID:16682640; http://dx.doi.org/ 10.1073/pnas.0602382103 [DOI] [PMC free article] [PubMed] [Google Scholar]
- 18.Granot Z, Henke E, Comen EA, King TA, Norton L, Benezra R. Tumor entrained neutrophils inhibit seeding in the premetastatic lung. Cancer Cell 2011; 20:300-14; PMID:21907922; http://dx.doi.org/ 10.1016/j.ccr.2011.08.012 [DOI] [PMC free article] [PubMed] [Google Scholar]
- 19.Lopez-Lago MA, Posner S, Thodima VJ, Molina AM, Motzer RJ, Chaganti RS. Neutrophil chemokines secreted by tumor cells mount a lung antimetastatic response during renal cell carcinoma progression. Oncogene 2013; 32:1752-60; PMID:22665059; http://dx.doi.org/ 10.1038/onc.2012.201 [DOI] [PMC free article] [PubMed] [Google Scholar]
- 20.Eruslanov EB, Bhojnagarwala PS, Quatromoni JG, Stephen TL, Ranganathan A, Deshpande C, Akimova T, Vachani A, Litzky L, Hancock WW et al.. Tumor-associated neutrophils stimulate T cell responses in early-stage human lung cancer. J Clin Invest 2014; 124:5466-80; PMID:25384214; http://dx.doi.org/ 10.1172/JCI77053 [DOI] [PMC free article] [PubMed] [Google Scholar]
- 21.Sagiv JY, Michaeli J, Assi S, Mishalian I, Kisos H, Levy L, Damti P, Lumbroso D, Polyansky L, Sionov RV et al.. Phenotypic diversity and plasticity in circulating neutrophil subpopulations in cancer. Cell Rep 2015; 10:562-73; PMID:25620698; http://dx.doi.org/ 10.1016/j.celrep.2014.12.039 [DOI] [PubMed] [Google Scholar]
- 22.Sionov RV, Fridlender ZG, Granot Z. The multifaceted roles neutrophils play in the tumor microenvironment. Cancer Microenviron 2015; 8:125-58; PMID:24895166; http://dx.doi.org/ 10.1007/s12307-014-0147-5 [DOI] [PMC free article] [PubMed] [Google Scholar]
- 23.Granot Z, Fridlender ZG. Plasticity beyond cancer cells and the “immunosuppressive switch”. Cancer Res 2015; 75:4441-5; PMID:26475869; http://dx.doi.org/ 10.1158/0008-5472.CAN-15-1502 [DOI] [PubMed] [Google Scholar]
- 24.Andzinski L, Wu CF, Lienenklaus S, Kroger A, Weiss S, Jablonska J. Delayed apoptosis of tumor associated neutrophils in the absence of endogenous IFN-beta. Int J Cancer 2015; 136:572-83; PMID:24806531; http://dx.doi.org/ 10.1002/ijc.28957 [DOI] [PubMed] [Google Scholar]
- 25.Wu CF, Andzinski L, Kasnitz N, Kroger A, Klawonn F, Lienenklaus S, Weiss S, Jablonska J. The lack of type I interferon induces neutrophil-mediated pre-metastatic niche formation in the mouse lung. Int J Cancer 2015; 137:837-47; PMID:25604426; http://dx.doi.org/ 10.1002/ijc.29444 [DOI] [PubMed] [Google Scholar]
- 26.Andzinski L, Kasnitz N, Stahnke S, Wu CF, Gereke M, von Kockritz-Blickwede M, Schilling B, Brandau S, Weiss S, Jablonska J. Type I IFNs induce anti-tumor polarization of tumor associated neutrophils in mice and human. Int J Cancer 2016; 138:1982-93; PMID:26619320; http://dx.doi.org/ 10.1002/ijc.29945 [DOI] [PubMed] [Google Scholar]
- 27.Kusmartsev S, Nagaraj S, Gabrilovich DI. Tumor-associated CD8+ T cell tolerance induced by bone marrow-derived immature myeloid cells. J Immunol 2005; 175:4583-92; PMID:16177103; http://dx.doi.org/ 10.4049/jimmunol.175.7.4583 [DOI] [PMC free article] [PubMed] [Google Scholar]
- 28.Tazawa H, Okada F, Kobayashi T, Tada M, Mori Y, Une Y, Sendo F, Kobayashi M, Hosokawa M. Infiltration of neutrophils is required for acquisition of metastatic phenotype of benign murine fibrosarcoma cells: implication of inflammation-associated carcinogenesis and tumor progression. Am J Pathol 2003; 163:2221-32; PMID:14633597; http://dx.doi.org/ 10.1016/S0002-9440(10)63580-8 [DOI] [PMC free article] [PubMed] [Google Scholar]
- 29.Fridlender ZG, Sun J, Mishalian I, Singhal S, Cheng G, Kapoor V, Horng W, Fridlender G, Bayuh R, Worthen GS et al.. Transcriptomic analysis comparing tumor-associated neutrophils with granulocytic myeloid-derived suppressor cells and normal neutrophils. PLoS One 2012; 7:e31524; PMID:22348096; http://dx.doi.org/ 10.1371/journal.pone.0031524 [DOI] [PMC free article] [PubMed] [Google Scholar]
- 30.Mishalian I, Bayuh R, Eruslanov E, Michaeli J, Levy L, Zolotarov L, Singhal S, Albelda SM, Granot Z, Fridlender ZG. Neutrophils recruit regulatory T-cells into tumors via secretion of CCL17–a new mechanism of impaired antitumor immunity. Int J Cancer 2014; 135:1178-86; PMID:24501019; http://dx.doi.org/ 10.1002/ijc.28770 [DOI] [PubMed] [Google Scholar]
- 31.Mishalian I, Bayuh R, Levy L, Zolotarov L, Michaeli J, Fridlender ZG. Tumor-associated neutrophils (TAN) develop pro-tumorigenic properties during tumor progression. Cancer Immunol Immunother 2013; 62:1745-56; PMID:24092389; http://dx.doi.org/ 10.1007/s00262-013-1476-9 [DOI] [PMC free article] [PubMed] [Google Scholar]
- 32.Tuting T, de Visser KE. How neutrophils promote metastasis. Science 2016; 352:145-6; PMID:27124439; http://dx.doi.org/ 10.1126/science.aaf7300 [DOI] [PubMed] [Google Scholar]
- 33.Scapini P, Lapinet-Vera JA, Gasperini S, Calzetti F, Bazzoni F, Cassatella MA. The neutrophil as a cellular source of chemokines. Immunol Rev 2000; 177:195-203; PMID:11138776; http://dx.doi.org/ 10.1034/j.1600-065X.2000.17706.x [DOI] [PubMed] [Google Scholar]
- 34.Gabrilovich DI, Nagaraj S. Myeloid-derived suppressor cells as regulators of the immune system. Nat Rev Immunol 2009; 9:162-74; PMID:19197294; http://dx.doi.org/ 10.1038/nri2506 [DOI] [PMC free article] [PubMed] [Google Scholar]
- 35.Gregory AD, Houghton AM. Tumor-associated neutrophils: new targets for cancer therapy. Cancer Res 2011; 71:2411-6; PMID:21427354; http://dx.doi.org/ 10.1158/0008-5472.CAN-10-2583 [DOI] [PubMed] [Google Scholar]
- 36.Tecchio C, Micheletti A, Cassatella MA. Neutrophil-derived cytokines: facts beyond expression. Front Immunol 2014; 5:508; PMID:25374568; http://dx.doi.org/ 10.3389/fimmu.2014.00508 [DOI] [PMC free article] [PubMed] [Google Scholar]
- 37.Gungor N, Knaapen AM, Munnia A, Peluso M, Haenen GR, Chiu RK, Godschalk RW, van Schooten FJ. Genotoxic effects of neutrophils and hypochlorous acid. Mutagenesis 2009; 25:149-54; PMID:19892774; http://dx.doi.org/ 10.1093/mutage/gep053 [DOI] [PubMed] [Google Scholar]
- 38.Dallegri F, Ottonello L, Ballestrero A, Dapino P, Ferrando F, Patrone F, Sacchetti C. Tumor cell lysis by activated human neutrophils: analysis of neutrophil-delivered oxidative attack and role of leukocyte function-associated antigen 1. Inflammation 1991; 15:15-30; PMID:1647368; http://dx.doi.org/ 10.1007/BF00917906 [DOI] [PubMed] [Google Scholar]
- 39.Gardai S, Whitlock BB, Helgason C, Ambruso D, Fadok V, Bratton D, Henson PM. Activation of SHIP by NADPH oxidase-stimulated Lyn leads to enhanced apoptosis in neutrophils. J Biol Chem 2002; 277:5236-46; PMID:11724799; http://dx.doi.org/ 10.1074/jbc.M110005200 [DOI] [PubMed] [Google Scholar]
- 40.Faurschou M, Borregaard N. Neutrophil granules and secretory vesicles in inflammation. Microbes Infect 2003; 5:1317-27; PMID:14613775; http://dx.doi.org/ 10.1016/j.micinf.2003.09.008 [DOI] [PubMed] [Google Scholar]
- 41.Ellis TN, Beaman BL. Interferon-gamma activation of polymorphonuclear neutrophil function. Immunology 2004; 112:2-12; PMID:15096178; http://dx.doi.org/ 10.1111/j.1365-2567.2004.01849.x [DOI] [PMC free article] [PubMed] [Google Scholar]
- 42.Bussmeyer U, Sarkar A, Broszat K, Ludemann T, Moller S, van Zandbergen G, Bogdan C, Behnen M, Dumler JS, von Loewenich FD et al.. Impairment of gamma interferon signaling in human neutrophils infected with Anaplasma phagocytophilum. Infect Immun 2010; 78:358-63; PMID:19858302; http://dx.doi.org/ 10.1128/IAI.01005-09 [DOI] [PMC free article] [PubMed] [Google Scholar]
- 43.Abi Abdallah DS, Egan CE, Butcher BA, Denkers EY. Mouse neutrophils are professional antigen-presenting cells programmed to instruct Th1 and Th17 T-cell differentiation. Int Immunol 2011; 23:317-26; PMID:21422151; http://dx.doi.org/ 10.1093/intimm/dxr007 [DOI] [PMC free article] [PubMed] [Google Scholar]
- 44.Takashima A, Yao Y. Neutrophil plasticity: acquisition of phenotype and functionality of antigen-presenting cell. J Leukoc Biol 2015; 98:489-96; PMID:25632045; http://dx.doi.org/ 10.1189/jlb.1MR1014-502R [DOI] [PubMed] [Google Scholar]
- 45.Iking-Konert C, Cseko C, Wagner C, Stegmaier S, Andrassy K, Hansch GM. Transdifferentiation of polymorphonuclear neutrophils: acquisition of CD83 and other functional characteristics of dendritic cells. J Mol Med (Berl) 2001; 79:464-74; PMID:11511977; http://dx.doi.org/ 10.1007/s001090100237 [DOI] [PubMed] [Google Scholar]
- 46.Youn JI, Collazo M, Shalova IN, Biswas SK, Gabrilovich DI. Characterization of the nature of granulocytic myeloid-derived suppressor cells in tumor-bearing mice. J Leukoc Biol 2012; 91:167-81; PMID:21954284; http://dx.doi.org/ 10.1189/jlb.0311177 [DOI] [PMC free article] [PubMed] [Google Scholar]
- 47.Tvinnereim AR, Hamilton SE, Harty JT. Neutrophil involvement in cross-priming CD8+ T cell responses to bacterial antigens. J Immunol 2004; 173:1994-2002; PMID:15265934; http://dx.doi.org/ 10.4049/jimmunol.173.3.1994 [DOI] [PubMed] [Google Scholar]
- 48.Di Carlo E, Forni G, Lollini P, Colombo MP, Modesti A, Musiani P. The intriguing role of polymorphonuclear neutrophils in antitumor reactions. Blood 2001; 97:339-45; PMID:11154206; http://dx.doi.org/ 10.1182/blood.V97.2.339 [DOI] [PubMed] [Google Scholar]
- 49.Bettelli E, Carrier Y, Gao W, Korn T, Strom TB, Oukka M, Weiner HL, Kuchroo VK. Reciprocal developmental pathways for the generation of pathogenic effector TH17 and regulatory T cells. Nature 2006; 441:235-8; PMID:16648838; http://dx.doi.org/ 10.1038/nature04753 [DOI] [PubMed] [Google Scholar]
- 50.Zhou L, Ivanov II, Spolski R, Min R, Shenderov K, Egawa T, Levy DE, Leonard WJ, Littman DR. IL-6 programs T(H)-17 cell differentiation by promoting sequential engagement of the IL-21 and IL-23 pathways. Nat Immunol 2007; 8:967-74; PMID:17581537; http://dx.doi.org/ 10.1038/ni1488 [DOI] [PubMed] [Google Scholar]
- 51.Bailey SR, Nelson MH, Himes RA, Li Z, Mehrotra S, Paulos CM. Th17 cells in cancer: the ultimate identity crisis. Front Immunol 2014; 5:276; PMID:24987392; http://dx.doi.org/ 10.3389/fimmu.2014.00276 [DOI] [PMC free article] [PubMed] [Google Scholar]
- 52.Moses K, Klein JC, Männ L, Klingberg A, Gunzer M, Brandau S. Survival of residual neutrophils and accelerated myelopoiesis limit the efficacy of antibody-mediated depletion of Ly-6G+ cells in tumor-bearing mice. J Leukoc Biol 2016; 99:811-23; PMID:26819319; http://dx.doi.org/ 10.1189/jlb.1HI0715-289R [DOI] [PubMed] [Google Scholar]
- 53.Borregaard N, Sorensen OE, Theilgaard-Monch K. Neutrophil granules: a library of innate immunity proteins. Trends Immunol 2007; 28:340-5; PMID:17627888; http://dx.doi.org/ 10.1016/j.it.2007.06.002 [DOI] [PubMed] [Google Scholar]
- 54.Fu K, Corbley MJ, Sun L, Friedman JE, Shan F, Papadatos JL, Costa D, Lutterodt F, Sweigard H, Bowes S et al.. SM16, an orally active TGF-beta type I receptor inhibitor prevents myofibroblast induction and vascular fibrosis in the rat carotid injury model. Arterioscler Thromb Vasc Biol 2008; 28:665-71; PMID:18202322; http://dx.doi.org/ 10.1161/ATVBAHA.107.158030 [DOI] [PubMed] [Google Scholar]
- 55.Suzuki E, Kim S, Cheung HK, Corbley MJ, Zhang X, Sun L, Shan F, Singh J, Lee WC, Albelda SM et al.. A novel small-molecule inhibitor of transforming growth factor beta type I receptor kinase (SM16) inhibits murine mesothelioma tumor growth in vivo and prevents tumor recurrence after surgical resection. Cancer Res 2007; 67:2351-9; PMID:17332368; http://dx.doi.org/ 10.1158/0008-5472.CAN-06-2389 [DOI] [PubMed] [Google Scholar]
- 56.Kim S, Buchlis G, Fridlender ZG, Sun J, Kapoor V, Cheng G, Haas A, Cheung HK, Zhang X, Corbley M et al.. Systemic blockade of transforming growth factor-beta signaling augments the efficacy of immunogene therapy. Cancer Res 2008; 68:10247-56; PMID:19074893; http://dx.doi.org/ 10.1158/0008-5472.CAN-08-1494 [DOI] [PMC free article] [PubMed] [Google Scholar]
- 57.Nick JA, Young SK, Brown KK, Avdi NJ, Arndt PG, Suratt BT, Janes MS, Henson PM, Worthen GS. Role of p38 mitogen-activated protein kinase in a murine model of pulmonary inflammation. J Immunol 2000; 164:2151-9; PMID:10657669; http://dx.doi.org/ 10.4049/jimmunol.164.4.2151 [DOI] [PubMed] [Google Scholar]
- 58.Ben-Porath I, Thomson MW, Carey VJ, Ge R, Bell GW, Regev A, Weinberg RA. An embryonic stem cell-like gene expression signature in poorly differentiated aggressive human tumors. Nat Genet 2008; 40:499-507; PMID:18443585; http://dx.doi.org/ 10.1038/ng.127 [DOI] [PMC free article] [PubMed] [Google Scholar]
- 59.Carretero J, Shimamura T, Rikova K, Jackson AL, Wilkerson MD, Borgman CL, Buttarazzi MS, Sanofsky BA, McNamara KL, Brandstetter KA et al.. Integrative genomic and proteomic analyses identify targets for Lkb1-deficient metastatic lung tumors. Cancer Cell 2010; 17:547-59; PMID:20541700; http://dx.doi.org/ 10.1016/j.ccr.2010.04.026 [DOI] [PMC free article] [PubMed] [Google Scholar]
Associated Data
This section collects any data citations, data availability statements, or supplementary materials included in this article.