
Figure 4.
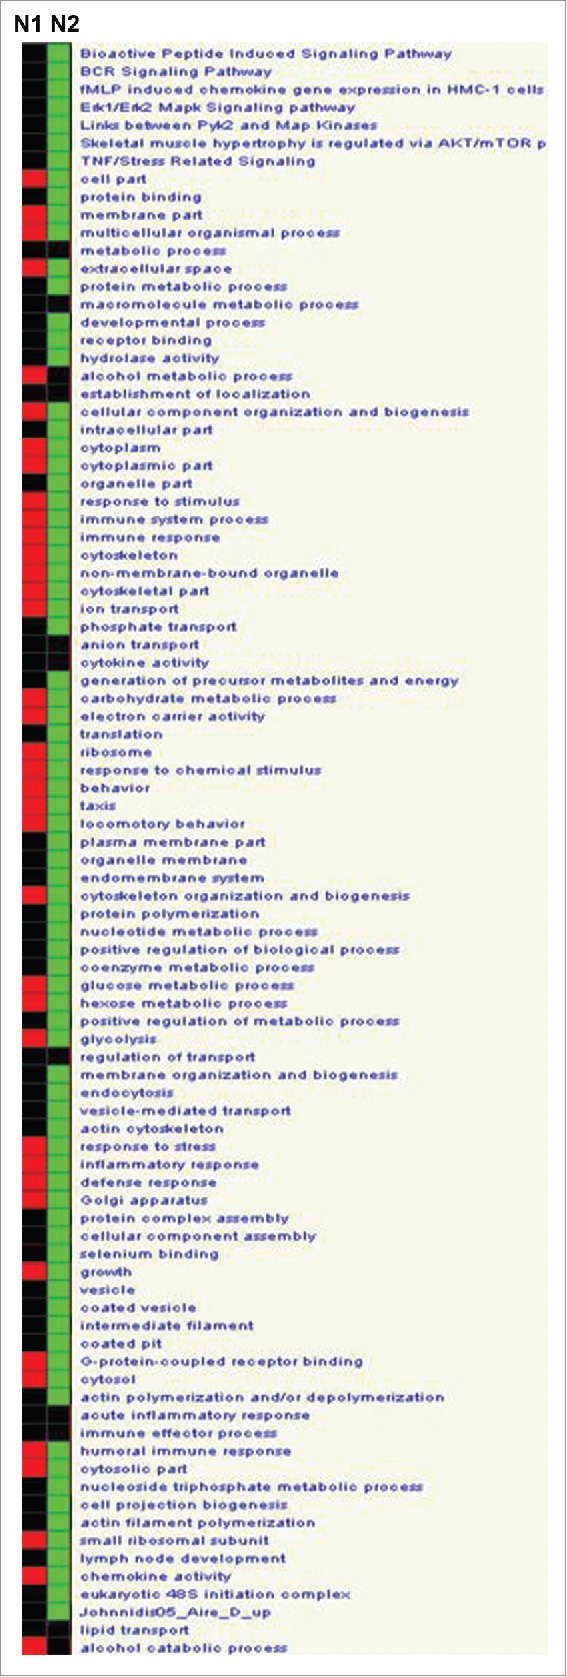
Analysis of pathways and gene groups using Genomica, comparing tumor-associated neutrophils (N2) to TANs following treatment with SM16 (N1). All N1 and N2 samples were evaluated individually for changes in the different pathways, and marked as positive change when ≥ 3 genes were significantly changed to the same direction. Groups were then compared to each other (p < 0.05, corrected). Red – upregulation; green – downregulation; black – no change from mean.