Abstract
A tryptic digest generated from Xenopus laevis fertilized embryos was fractionated by reversed phase liquid chromatography. One set of 30 fractions was analyzed by 100-min CZE-ESI-MS/MS separations (50 hr total instrument time), and a second set of 15 fractions was analyzed by 3-hr UPLC-ESI-MS/MS separations (45 hr total instrument time). CZE-MS/MS produced 70% as many protein IDs (4,134 vs. 5,787) and 60% as many peptide IDs (22,535 vs. 36,848) as UPLC-MS/MS with similar instrument time (50 h vs. 45 h) but with 50 times smaller total consumed sample amount (1.5 μg vs. 75 μg). Surprisingly, CZE generated peaks that were 25% more intense than UPLC for peptides that were identified by both techniques, despite the 50-fold lower loading amount; this high sensitivity reflects the efficient ionization produced by the electrokinetically-pumped nanospray interface used in CZE. This report is the first comparison of CZE-MS/MS and UPLC-MS/MS for large-scale eukaryotic proteomic analysis. The numbers of protein and peptide identifications produced by CZE-ESI-MS/MS approach those produced by UPLC-MS/MS, but with nearly two orders of magnitude lower sample amounts.
Keywords: Bottom-up proteomics, Xenopus laevis, CZE-ESI-MZ/MZ, UPLC-ESI-MS/MS, electrokinetically driven sheath flow CZE-MS interface
1 Introduction
Bottom-up proteomics is widely used for characterization of complex protein samples [1,2]. In this approach, proteins are first digested to peptides. These peptides are then separated, followed by analysis with tandem mass spectrometry (MS/MS) and identification and quantification via database searching [3,4].
Reversed phase liquid chromatography (RPLC) – electrospray ionization (ESI) – tandem mass spectrometry (MS/MS) is commonly used for analysis of peptides in bottom-up proteomics [5-8]. RPLC is compatible with ESI-MS/MS, provides large loading capacity, and generates high resolving power for peptide separations. For example, Iwasaki et al. coupled a 350 cm long monolithic silica-C18 capillary column to an LTQ-Orbitrap mass spectrometer for analysis of the E. coli proteome; 2,602 protein groups and 22,196 peptides were identified during a 41 hour chromatographic gradient [9].
Despite the convincing performance of RPLC-ESI-MS/MS for bottom-up proteomics, there is evidence showing that RPLC-ESI-MS/MS is biased against small and hydrophilic peptides [10]. RPLC columns require re-equilibrium between separations, which slows sample throughput. RPLC instrumentation is relatively expensive and can suffer from reliability issues. We believe that there is value in exploring alternative separation technologies for bottom-up proteomics.
Capillary zone electrophoresis (CZE) is a potential alternative. In CZE, analytes are separated within a buffer-filled fused silica capillary under the influence of an electric field. With the development of improved CZE-ESI-MS/MS interfaces [11-16], CZE-ESIMS/MS has attracted increasing attention for MS-based proteomics.
There are at least four advantages of CZE compared with RPLC. First, CZE can provide faster and more efficient separations than RPLC. Second, the orthogonal separation mechanisms of CZE and RPLC could produce complementary analyte identification. Third, CZE consistently provides superior performance for mass limited samples. Finally, CZE instrumentation is relatively simple and inexpensive, consisting of an autosampler, fused silica capillary, high voltage power supply, and electrospray ionization interface.
Nevertheless, traditional CZE also has significant disadvantages compared with RPLC. First, the fast separation of conventional CZE-ESI-MS/MS limits the number of acquired mass spectra per run, which prevents deep analysis of complex samples in a single separation. Second, the loading capacity of conventional CZE is 1-3 orders of magnitude smaller than RPLC, which limits identification of trace components in complex samples.
There has been a significant effort from a few groups to address the limitations of CZE for bottom-up proteomics. Sample prefractionation has been employed before CZE-ESI-MS/MS analysis to improve peptide and protein group identifications. Prefractionation has performed using either online [17-18] or offline [19] methods. In general, online fractionation has higher sensitivity than offline because of reduced sample loss. However, the resolving power of online fractionation is usually poorer because the separation conditions in prefractionation step must be compatible with subsequent CZE separations.
In a venerable example of on-line prefractionation, the Yates group employed online solid-phase microextraction (SPME) to separate a peptide mixture of a 75-protein complex from the yeast ribosome into eleven fractions. Each fraction was subsequently analyzed with a 30 min CZE-MS/MS separation [17]. The 5.5 h MS-based analysis generated 66 protein IDs. A recent paper from the Yates group reported an improved method using online SPME prefractionation and transient isotachophoresis CZE-MS/MS to analyze a prokaryote protein mixture [18]. In total, 2,341 peptides and 548 proteins were identified in duplicate runs of a Pyrococcus furiosus tryptic digest, with a total MS analysis time of around 350 min.
We have used CZE to analyze the secretome of M. marinum by both CZE and ultra-performance liquid chromatography (UPLC) [10]. Those setups were designed to have the same MS analysis time and sample loadings. The CZE analysis employed offline RPLC to generate 11 fractions, and each fraction was analyzed in a fast CZE separation. The UPLC analysis employed triplicate 1 h separations. These two methods identified comparable numbers of protein and peptide identifications, but with modest concordance between the methods.
A recent publication employed CZE and prefractionation to perform quantitative analysis of the yeast proteome using stable isotope labeling by amino acids in cell culture (SILAC). The resulting peptides were loaded onto an RPLC system to generate 182 fractions, and these fractions were analyzed with a CE-MS system. That system quantified 3,272 proteins and 28,538 peptides, which required over seven days of continuous mass spectrometry time [20], and produced the largest dataset generated by CZE-MS at that time.
There has also been a significant effort to increase the number of identifications in single shot CZE analysis. For example, 1,250 peptides were identified by an improved CZE-ESI-MS/MS setup from E.coli tryptic digest in a single-shot (50 min) CZE-ESI-MS/MS analysis [21]. We also coupled a commercialized auto-sampler (PrinCE, Netherlands) to a mass spectrometer by a nanospray interface to perform automated sequential CZE-ESI-MS/MS analysis [22]. The reproducibility of this system was evaluated by eight sequential injections over 8 h, and demonstrated excellent reproducibility in migration time and peak area. We collaborated with the Coon group to couple the second-generation electrokinetically pumped sheath-flow nanospray interface and a linear polyacrylamide (LPA)-coated separation capillary to an Orbitrap Fusion mass spectrometer [23]. In a single shot analysis, over 2,100 proteins and 10,000 peptides were identified from the HeLa proteome within a 90 cm separation window, which produced roughly an order of magnitude improvement in the number of IDs compared with earlier single-shot CZE-ESI-MS/MS studies.
In this manuscript, we report the use of CZE-ESI-MS/MS for the qualitative analysis of the Xenopus laevis proteome, which is a common model organism for the study of early vertebrate development. Fertilized Xenopus laevis eggs were lysed, and proteins were digested with trypsin and separated by RPLC. 30 fractions were obtained and used for subsequent CZE-ESI-MS/MS analyses. Peptides were separated in a 90 cm long LPA–coated capillary (50 μm id, 150 μm od), and transferred into LTQ-Orbitrap Velos mass spectrometer through a third-generation electrokinetically pumped sheath-flow nanospray interface. A set of 15 fractions generated from the same sample were analyzed in parallel using UPLC-ESI-MS/MS and the same mass spectrometer.
2 Materials and methods
2.1 Materials and reagents
Xenopus laevis was purchased from Nasco (Fort Atkinson, WI). Mammalian Cell-PE LB™ buffer was purchased from G-Biosciences (St. Louis, MO). Complete, mini protease inhibitor cocktail (provided in EASYpacks) was purchased from Roche (Indianapolis, IN). Bovine pancreas TPCK-treated trypsin, urea, ammonium bicarbonate (NH4HCO3), dithiothreitol (DTT), iodoacetamide (IAA), acrylamide, ammonium persulfate, 3-(trimethoxysilyl) propyl methacrylate were purchased from Sigma-Aldrich (St. Louis, MO). Acetic acid, hydrofluoric acid (HF), trifluoroacetic acid (TFA), acetonitrile (ACN) were purchased from Fisher Scientific (Pittsburgh, PA). Methanol and water were purchased from Honeywell Burdick and Jackson (Wicklow, Ireland). Microcon-30 kDa centrifugal filter unit with ultracel- 30 membrane was purchased from EMD Millipore (Darmstadt, Germany). Fused silica capillary (50 μm i.d., 365 μm o.d.) was purchased from Polymicro Technologies (Phoenix, AZ).
2.2 Egg collection and processing
All animal procedures were performed according to protocols approved by the University of Notre Dame Institutional Animal Care and Use Committee. Fertilized Xenopus laevis eggs (50 eggs in total) were collected into an Eppendorf tube. The egg culture buffer was removed, 800 μL mammalian Cell-PE LB™ buffer with complete protease inhibitor was added, and the Eppendorf tube was placed on a vortex mixer to preliminarily lyse the eggs for 1 min. A PowerGen™ Model 125 homogenizer (Fisher Scientific) was then placed in the Eppendorf tube to homogenize the eggs on ice for 1 min, and a Branson Sonifier 250 (VWR Scientific) was used to sonicate the eggs on ice for 10 min in order to completely lyse the eggs. The lysate was centrifuged at 10,000 g for 10 min. Three layers, containing lipids (top layer), proteins (middle layer), and pellet (bottom layer), were obtained. The protein layer was collected and transferred to a fresh Eppendorf tube, and the protein concentration was measured by the bicinchoninic acid (BCA) method. Ice-cold acetone was added into protein solution and the mixture was kept in −20 °C overnight, followed by centrifuging at 10,000 g for 15 min. After removing the supernatant, the protein pellet was washed with ice-cold acetone again to remove the cell culture medium and lysis buffer. After centrifuging, the pellet was kept in a fume hood at room temperature for ~ 5 min to dry.
A filter-aided protein digestion protocol was employed that is similar to a recently published protocol [24]. A 1 mg dried protein pellet was dissolved in 320 μL 8 M urea and denatured at 37 °C for 1 h, followed by protein reduction in 20 mM DTT at 37 °C for 1 h and protein alkylation in 50 mM IAA at room temperature for 30 min in the dark. The treated protein solution was transferred to a Microcon-30 kDa centrifugal filter unit with ultracel-30 membrane and centrifuged at 14,000 g for 10 min. 100 μL 8 M urea was added to the filter unit, followed by centrifugation at 14,000 g for 10 min. This step was repeated twice. Then, 100 μL of 50 mM NH4HCO3 was added to the filter unit, followed by centrifugation at 14,000 g for 10 min. This step was also repeated twice. Another 40 μL NH4HCO3 with trypsin (enzyme to protein ratio 1:30) was added to the filter unit, followed by mixing at 600 rpm for 1 min. The filter unit was incubated in a water bath at 37 °C overnight. The filter unit was then separated from the filtrate collection tube, and another filtrate collection tube was assembled with the filter. The reassembled filter unit was centrifuged at 14,000 g for 10 min, followed by addition of 40 μL NH4HCO3 and centrifugation at 14,000 g for 10 min. This step was repeated twice to transfer the tryptic digest into the filtrate collection tube. Then the filter was removed, and 1 μL formic acid was added to the tryptic digests solution to quench digestion.
2.3 RPLC prefractionation for subsequent CZE analysis
An offline RPLC system (Agilent ZORBAX SB-C18, 5 μm, 4.6 mm × 150 mm) was used for peptide prefractionation. 600 μg tryptic digest was loaded onto the RPLC column. Solvent A (0.1% (v/v) TFA in water) and solvent B (0.1% (v/v) TFA and 98% (v/v) ACN in water) were used as mobile phases. The gradient profile was as follows: 0-8 min, 2% B; 8-10 min, 2-10% B; 10-65 min, 10-30% B; 65-68, 30-85% B; 68-78, 85% B; 78-79, 85-2% B; 79-90, 2% B. Peptides were separated and eluted at a constant flow rate of 1 mL/min. Fractions were collected every minute from 10 to 69 min. From those 60 preliminary fractions, fraction 1 and fraction 31 were pooled, fraction 2 and fraction 32 were pooled, and so forth [25]. The resulting 30 fractions were lyophilized and stored at − 20 °C.
2.4 RPLC prefractionation for subsequent UPLC analysis
400 μg tryptic digests were loaded onto the RPLC column for peptide prefractionation. Solvent A (20 mM NH4HCO3 in water, pH 9.0) and solvent B (80% (v/v) ACN in water) were mobile phases. The gradient profile was: 0-10 min, 2% B; 10-11 min, 2-10% B; 10-68 min, 10-40% B; 68-71, 40-80% B; 71-72, 80-100% B; 72-90, 100% B; 91-102, 2% Peptides were separated and eluted at a constant flow rate of 1 mL/min. Fractions were collected every minute from 10 to 69 min. From those 60 preliminary fractions, fraction 1 and fraction 31 were combined; fraction 2 and fraction 32 were combined, and so forth. The resulting 30 fractions were lyophilized and then dissolved in 20 μL 0.1% (v/v) FA and 2% (v/v) ACN. These 30 fractions were further combined into 15 pooled fractions based on the above rule. The pooled fractions were acidified by addition of 12 μL 20% (v/v) FA. Each pooled fraction was loaded onto C-18 spin column (Waters, Milford, MA) to desalt the sample. The elution buffer for this spin column was 80% (v/v) ACN and 0.1% (v/v) FA. Finally, the eluted fractions were lyophilized and stored at − 20 °C.
2.5 Capillary linear polyacrylamide (LPA) coating
The interior of a fused silica capillary (~100 cm length, 50 μm i.d., 365 μm o.d.) was coated with LPA using a published protocol [26]. Briefly, the capillary was flushed with 1 M hydrochloric acid for 30 min, followed by water for 10 min, 1 M sodium hydroxide for 30 min, water for 10 min, and methanol for 30 min. Then the capillary was flush with nitrogen for 4 hour ensuring the capillary was completely dry. The capillary was treated with 50% (v/v) 3-(trimethoxysilyl) propyl methacrylate in methanol for 10 min, sealed at both ends, and incubated at room temperature for 24 h. The capillary was flushed with methanol for 20 min and nitrogen for 4 h.
40 mg acrylamide was dissolved in 1 mL water, and 2 μL 5% (w/v) ammonium persulfate was added to the 500 μL acrylamide solution. After vortexing for 30 s, the mixture was degassed by nitrogen for 3 min. Then the mixture was manually pumped into the pre-treated capillary, and incubated at 50 °C for 30 min with both ends sealed. Finally, the capillary was flushed with water to wash away unbounded polymer. One end of the LPA-coated capillary was immersed in hydrofluoric acid for 90 min to etch its outer diameter to ~60 μm. The capillary was then trimmed into 90 cm. The coated capillary was stored at room temperature.
2.6 CZE-ESI-MS/MS
The CZE system was similar to a previous instrument [23]. The 1.8 kV electrospray voltage was provided by a Spellman CZE 1000R high-voltage power supply (Hauppauge, NY). Electrospray was generated by a third generation electrokinetically pumped sheath flow interface [27]. The electrospray emitter was a borosilicate glass capillary (1.0 mm o.d., 0.75 mm i.d., 10 cm), pulled by a Sutter instrument P-1000 flaming/brown micropipette puller (Novato, CA). The emitter diameter was around 25-35 μm. The sheath buffer was 10% (v/v) methanol with 0. 5% (v/v) formic acid.
Each of the pooled RPLC fractions was redissolved in 20 μL loading buffer containing 35% (v/v) ACN and 65% (v/v) 0.1% (v/v) formic acid. The separation background electrolyte (BGE) was 5% (v/v) acetic acid. A PrinCE auto-sampler (Prince Technologies B.V., Netherlands) was used to provide sequentially sample injections as well as separation voltage control (300 V/cm). Sample was injected into the capillary by applying 250 mbar pressure for 10 s, controlled by the auto-sampler.
An LTQ-Orbitrap Velos mass spectrometer (Thermo Fisher Scientific) was employed as the detector. Full mass spectra scans were acquired by the Orbitrap within the m/z range from 350 to 1500 with 60,000 mass resolution (at m/z 400). The number of microscan was 1 and the maximum injection time was 500 ms. To generate tandem spectra, the twenty most intense peaks whose charge state was larger than 2 were isolated and fragmented in the collision-induced dissociation (CID) cell with 35% normalized collision energy, and the maximum injection time was 100 ms. Dynamic exclusion was set to 60 s.
2.7 UPLC-ESI-MS/MS
A nanoACQUITY ultra-performance chromatographic system with a UPLC BEH 120 C18 column (Waters, 1.7 μm, 100 μm × 100 mm, column temperature 40 °C) was coupled to an LTQ-Orbitrap Velos mass spectrometer. Each fraction was redissolved in 10 μL 2% (v/v) ACN and 0.1% (v/v) FA. Solvent A (0.1% (v/v) FA in water) and solvent B (0.1% (v/v) FA in ACN) served as mobile phases. The gradient profile was as follow: 0-10 min, 2% B; 10-11 min, 2-8% B; 11-152 min, 8-30% B; 152-154, 30-80% B; 154-164, 80% B; 164-165, 80-2% B; 165-180, 2% B. The flow rate was as follow: 1 μL/min, 0-11 min; 0.7 μL/min, 11-154 min; 0.7 μL/min, 154-180 min. The sample injection volume was 2 μL. The applied electrospray voltage was 1.5 kV, and the MS parameters were the same as those used for CZE-ESI-MS/MS.
2.8 Data analysis
Database searching of raw files was performed with MaxQuant version 1.5.2.8 with the Andromeda search engine [28] against the Xenopus laevis database derived from mRNA data [29]. The database searching parameters included full tryptic digestion, up to two missed cleavages, first search peptide tolerance 20 ppm, main search peptide tolerance 6 ppm, and fragment mass tolerance 0.5 Da. Carbamidomethylation (C) was set as fixed modification, while acetylation (K and protein N-term), oxidation (M) and deamidation (NQ) were set as variable modifications. False discovery rate (FDR) was set to 0.1 for both protein and peptide identifications.
3 Result and discussion
3.1 Optimization of loading amount in CZE-ESI-MS/MS
The loading capacity of CZE-ESI-MS/MS is typically 1 - 3 orders of magnitude smaller than that of UPLC-ESI-MS/MS. Several online concentration methods, such as dynamic pH junction and stacking, have been used to increase sample loading amounts [30, 31]. In this experiment, ACN was added to the sample matrix to generate stacking conditions for online concentration. However, if the injection amount exceeded a threshold, precipitation and bubbles were observed within the separation capillary, resulting in unstable currents and poor separation performance. In an early single-shot E. coli analysis [21], the length of injection plug was 5 cm, which was ~5% of the separation capillary volume. This large injection amount worked well for single-shot E. coli analysis. In contrast, we noticed that stable separation currents could not be maintained during CZE analysis of some Xenopus fractions with similar sample injection amounts. We believe that the large injection amount was related to this instability. This instability was alleviated by decreasing the injection plug length from 5 cm to 2.5 cm. We observed stable separation currents in all analyses using this loading amount.
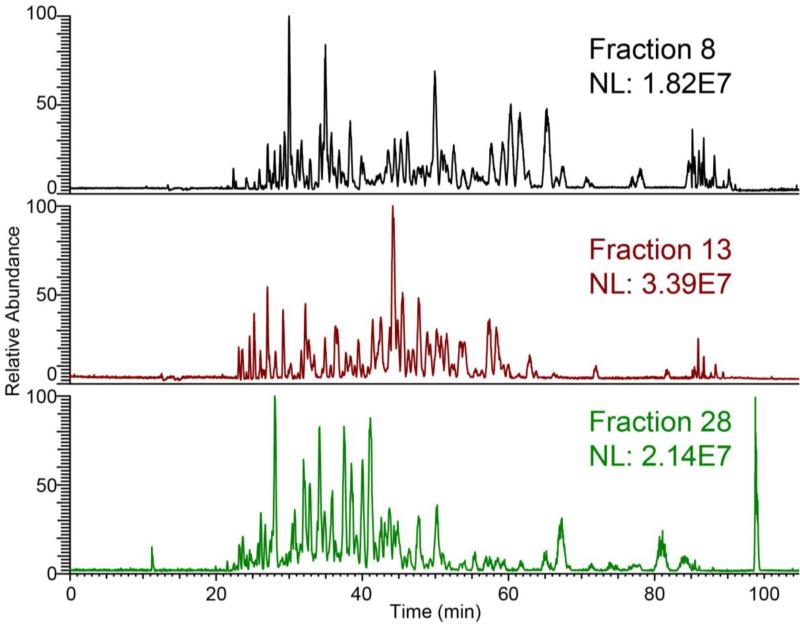
The CZE separation demonstrated a reasonably wide separation window from 20 to 80 min, Figure 1, which is similar to our high-resolution single shot analysis of the HeLa proteome [23].
Figure 1.
Three base peak electropherograms of CZE-ESI-MS/MS for Xenopus laevis
3.2 CZE coupled with offline prefractionation
In this manuscript, a tryptic digest from fertilized Xenopus laevis eggs was fractionated using a RPLC system. This sample is challenging because a large portion (~90 % by weight) of the early-stage embryo is yolk [24]. We used a urea-based filter aided sample preparation method. The digest was separated into 30 fractions by RPLC under acidic conditions and subsequent analysis using CZE-ESI-MS/MS. In each CZE run, 50 nL sample (~50 ng) was injected into the CZE capillary, corresponding to ~2.5% of the capillary volume. Each CZE-ESI-MS/MS analysis was 100 min in duration, and the total MS-based analysis time was 50 h. The raw files were subjected to MaxQuant (version 1.5.2.8) for database searching, which generated 4,134 protein IDs and 22,535 peptide IDs. Protein identification efficiency was 83 IDs/h. This result is the largest number of protein identifications by CZE-ESI-MS/MS reported to date. Peptide and protein information is provided in supporting information.
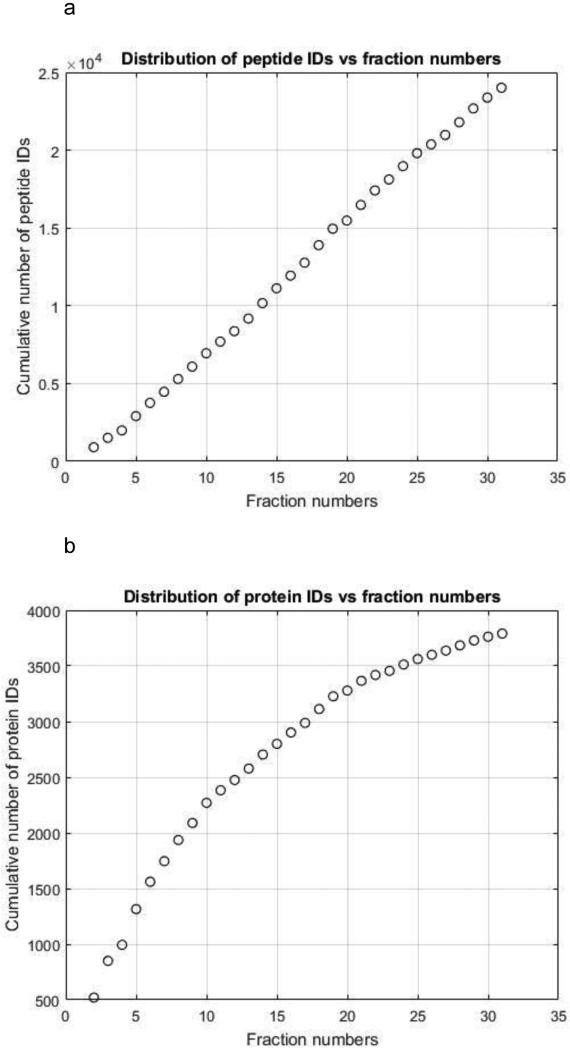
Figure 2a presents the cumulative distribution of unique peptide identifications in the CZE fractions. The plot increases roughly linearly, and the increase of identified unique peptide numbers in each fraction varied from 500 to 1,100. This result suggests that the fractions didn't have significant overlap, and the fractionation conditions produced a good balance between the separation performance and fraction numbers. The cumulative distribution of unique protein identifications began to saturate for later fractions, Figure 2b, and it is clear that further optimization of the prefractionation conditions will lead to deeper coverage. Similar results are observed for UPLC analysis, Supporting Information Figure S1.
Figure 2.
The cumulative distribution of peptide (A) and protein (B) IDs vs. fraction number.
3.3 Comparison of CZE-ESI-MS/MS with UPLC-ESI-MS/MS
We performed an UPLC-based analysis of the same sample, using the same LTQ-Orbitrap Velos mass spectrometer and a similar total analysis time, using high pH RPLC for fractionation; the high pH fractionation is orthogonal to the acidic UPLC separation used for MS/MS analysis. More importantly, the UPLC analysis employed ~5 μg sample loading for each run, which was 100 times larger than the loading amount used in the CZE-ESI-MS/MS system. Table 1 compares the protein and peptide identification results for these two methods. CZE-ESI-MS/MS generated ~2/3 of the number of IDs as UPLC-ESI-MS/MS (4,134 vs 5,787 proteins, 22,535 vs 36,848 peptides), despite the two-orders of magnitude difference in mass loading used in the experiments.
Table 1.
Identification results of CZE-ESI-MS/MS and UPLC-ESI-MS/MS for Xenopus laevis tryptic digests
| Totally injected sample weight (μg) | Proteins | Peptides | MS-based Analysis time (h) | |
|---|---|---|---|---|
| CZE-ESI-MS/MS | 1.5 | 4,134 | 22,535 | 50 |
| UPLC-ESI-MS/MS | 75 | 5,787 | 36,848 | 45 |
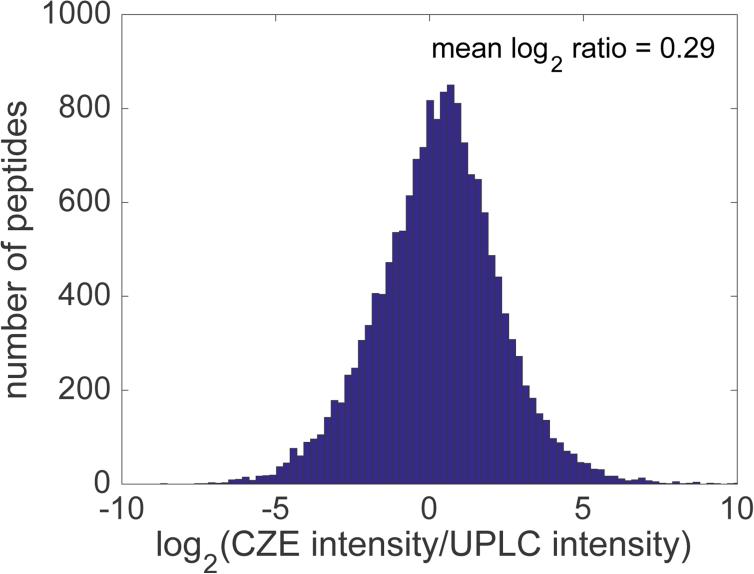
Surprisingly, CZE-ESI-MS generated slightly higher peak intensities than UPLC-ESI-MS for peptides that were identified in common, Figure 3. This figure presents the log2 ratio of peak intensities; log ratios larger than zero correspond to peptides whose CZE-ESI-MS peak intensities were higher than UPLC-ESI-MS. The mean of the log2 ratio distribution is 0.29 and the median is 0.35; CZE-ESI-MS generated peaks that were 25% higher than the intensity of UPLC-ESI-MS, despite the two-order of magnitude larger sample loadings employed in UPLC-ESI-MS (1.5 μg vs 75 μg). This result demonstrates the high efficiency of the electrokinetically-pumped nanospray interface used to couple CZE with the mass spectrometer.
Figure 3.
The distribution of ratios of intensities of peptides identified both by CZE-ESI-MS/MS and UPLC-ESI-MS/MS.
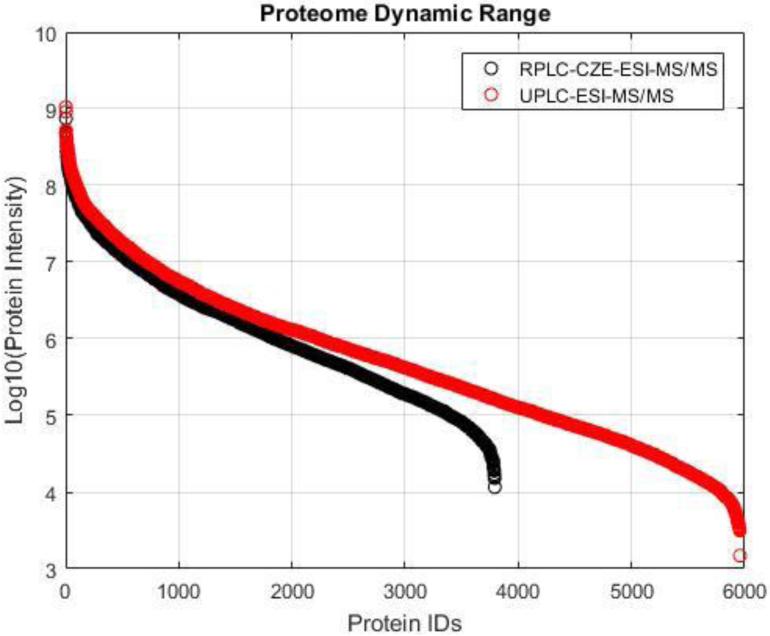
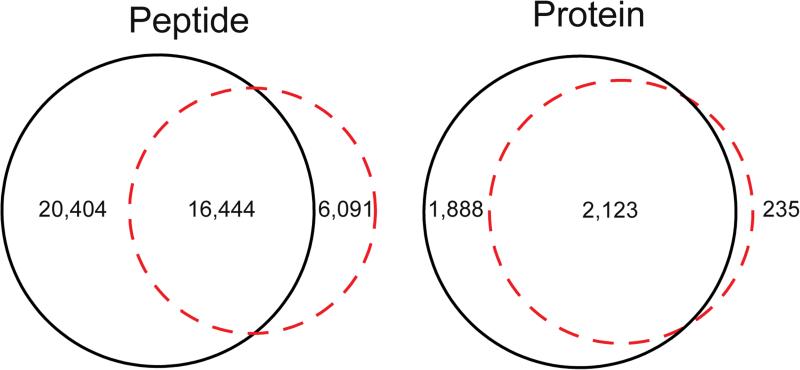
The dynamic ranges of CZE-ESI-MS/MS and UPLC-ESI-MS/MS were also evaluated, Figure 4. The dynamic range of CZE-ESI-MS/MS was ~5 orders of magnitude, which was roughly half an order of magnitude lower than that of UPLC-ESI-MS/MS. We finally characterized the overlap of peptides and protein identifications between CZE-ESI-MS/MS and UPLC-ESI-MS/MS, Figure 5. The results were more complementary on the peptide level than at the protein level. This result is similar to previous reports [10, 21].
Figure 4.
Proteome dynamic range distribution of CZE-ESI-MS/MS and UPLC-ESI-MS/MS
Figure 5.
Overlap of peptide and protein identifications between CZE-ESI-MS/MS (red dashed) and UPLC-ESI-MS/MS (solid black).
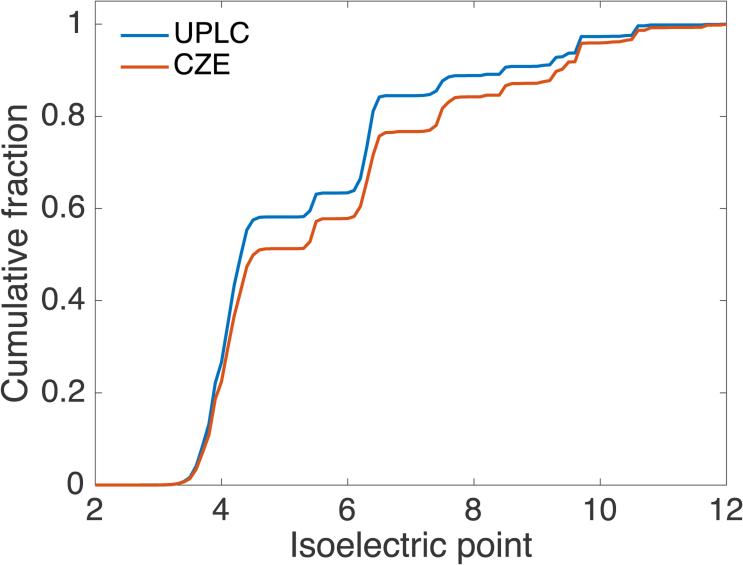
We investigated a few properties of peptides identified by the two techniques. The peptide length distributions were similar for CZE and UPLC (data not shown). However, there was a striking difference in the peptide pI distributions, Figure 6. The percentage of basic peptides was approximately 20% in UPLC-ESI-MS/MS, while the percentage of basic peptides is around 30% in CZE-ESI-MS/MS. These peptides carry two or more positive charges in the acidic background electrolyte, and had relatively high mobility.
Figure 6.
Cumulative isoelectric point distributions of peptides identified by CZE and UPLC
4 Concluding remarks
The improvement in performance of CZE-ESI-MS/MS for bottom-up proteomics has been extraordinary rapid. In 2011, this group reported the identification of 344 peptides and 140 proteins from the secretome of M. marinum, which was prefractionated by HPLC to obtain 11 fractions. Each fraction was subjected to a 15 min CZE-ESI-MS/MS analysis time [10]. In 2014, over 10,000 peptides were identified from the HeLa proteome by using single-shot CZE-ESI-MS/MS with a state-of-the-art mass spectrometer [23]. In 2015, 3,272 quantified protein IDs and 28,538 quantified peptide IDs were generated from a CZE-MS system using RPLC to prefractionate SILAC-labeled yeast peptides into 182 fractions in a 182-hour analysis [20]. In this manuscript, we now report more than 4,100 protein IDs and 22,000 peptide IDs using a 50 h analysis time. This manuscript also demonstrates that CZE-ESi-MS/MS can generate 2/3 of the number of protein and peptide IDs as nano-HPLC-ESI-MS/MS when analyzing the same complex eukaryotic proteome digest using the same mass spectrometer and the same instrument time.
This manuscript does not use CZE-ESI-MS/MS for a comprehensive analysis of the Xenopus proteome, and we present no data on replicate analyses. Instead, we are interested in a comparison of the performance of CZE- and nano-HPLC-ESI-MS/MS for analysis of this complex proteome. Future work will explore the use of CZE-ESI-MS/MS for that comprehensive proteomic analysis.
The performance of CZE-ESI-MS/MS should benefit from further improvements in sample preparation and prefractionation, further optimization of the separation conditions, and further improvements in the sheath-flow nanospray interface and optimization of mass spectrometer parameters. If so, CZE-ESI-MS/MS will be a powerful alternative to UPLC-ESI-MS/MS in large-scale bottom-up proteomic analyses.
Supplementary Material
Acknowledgements
We thank Dr. William Boggess in the Notre Dame Mass Spectrometry and Proteomics Facility for his help with this project. We also thank Professor Paul Huber for his support and encouragement in this project. This work was funded by a grant from the National Institutes of Health (R01GM096767).
References
- 1.Mann M, Kulak NA, Nagaraj N, Cox J. The coming age of complete, accurate, and ubiquitous proteomes. Mol. Cell. 2013;49:583–590. doi: 10.1016/j.molcel.2013.01.029. [DOI] [PubMed] [Google Scholar]
- 2.Zhang Y, Fonslow BR, Shan B, Baek MC, Yates JR., III. Protein analysis by shotgun/bottom-up proteomics. Chem. Rev. 2013;113:2343–2394. doi: 10.1021/cr3003533. [DOI] [PMC free article] [PubMed] [Google Scholar]
- 3.Gygi SP, Rist B, Gerber SA, Turecek F, Gelb MH, Aebersold R. Quantitative analysis of complex protein mixtures using isotope-coded affinity tags. Nat. Biotechnol. 1999;17:994–999. doi: 10.1038/13690. [DOI] [PubMed] [Google Scholar]
- 4.Chait BT. Mass spectrometry: bottom-up or top-down? Science. 2006;314:65–66. doi: 10.1126/science.1133987. [DOI] [PubMed] [Google Scholar]
- 5.Profrock D. Progress and possible applications of miniaturised separation techniques and elemental mass spectrometry for quantitative, heteroatom-tagged proteomics. Anal. Bioanal. Chem. 2010;398:2383–2401. doi: 10.1007/s00216-010-3901-7. [DOI] [PubMed] [Google Scholar]
- 6.Aebersold R, Goodlett DR. Mass spectrometry in proteomics. Chem. Rev. 2001;101:269–295. doi: 10.1021/cr990076h. [DOI] [PubMed] [Google Scholar]
- 7.Aebersold R, Mann M. Mass spectrometry-based proteomics. Nature. 2003;422:198–207. doi: 10.1038/nature01511. [DOI] [PubMed] [Google Scholar]
- 8.Plumb R, Rainville P, Potts W, Johnson K, Gika E, Wilson I. Application of ultra performance liquid chromatography-mass spectrometry to profiling rat and dog bile. J. Proteome Res. 2009;8:2495–2500. doi: 10.1021/pr801078a. [DOI] [PubMed] [Google Scholar]
- 9.Iwasaki M, Miwa S, Ikegami T, Tomita MM. One-dimensional capillary liquid chromatographic separation coupled with tandem mass spectrometry unveils the Escherichia coli proteome on a microarray scale. Anal. Chem. 2010;82:2616–2620. doi: 10.1021/ac100343q. [DOI] [PubMed] [Google Scholar]
- 10.Li Y, Wojcik R, Dovichi NJ. A replaceable microreactor for on-line protein digestion in a two-dimensional capillary electrophoresis system with tandem mass spectrometry detection. J. Chromatogr. A. 2011;1218:2007–2011. doi: 10.1016/j.chroma.2010.10.013. [DOI] [PMC free article] [PubMed] [Google Scholar]
- 11.Olivares JA, Nguyen NT, Yonker CR, Smith RD. Online mass-spectrometric detection for capillary zone electrophoresis. Anal. Chem. 1987;59:1230–1232. [Google Scholar]
- 12.Smith RD, Barinaga CJ, Udseth HR. Improved electrospray ionization interface for capillary zone electrophoresis - mass-spectrometry. Anal. Chem. 1988;60:1948–1952. [Google Scholar]
- 13.Moini M. Simplifying CE-MS operation. 2. Interfacing low-flow separation techniques to mass spectrometry using a porous tip. Anal. Chem. 2007;79:4241–4246. doi: 10.1021/ac0704560. [DOI] [PubMed] [Google Scholar]
- 14.Maxwell EJ, Zhong X, Zhang H, Zeijl N, Chen DDY. Decoupling CE and ESI for a more robust interface with MS. Electrophoresis. 2010;31:1130–1137. doi: 10.1002/elps.200900517. [DOI] [PubMed] [Google Scholar]
- 15.Maxwell EJ, Chen DDY. Twenty years of interface development for capillary electrophoresis-electrospray ionization-mass spectrometry. Anal. Chim. Acta. 2008;627:25–33. doi: 10.1016/j.aca.2008.06.034. [DOI] [PubMed] [Google Scholar]
- 16.Wojcik R, Dada OO, Sadilek M, Dovichi NJ. Simplified capillary electrophoresis nanospray sheath-flow interface for high efficiency and sensitive peptide analysis. Rapid Commun. Mass Spectrom. 2010;24:2554–2560. doi: 10.1002/rcm.4672. [DOI] [PubMed] [Google Scholar]
- 17.Tong W, Link A, Eng JK, Yates JR., III Identification of proteins in complexes by solid-phase microextraction/multistep elution/capillary electrophoresis/tandem mass spectrometry. Anal. Chem. 1999;71:2270–2278. doi: 10.1021/ac9901182. [DOI] [PubMed] [Google Scholar]
- 18.Wang Y, Fonslow BR, Wong CCL, Nakorchevsky A, Yates JR., III Improving the comprehensiveness and sensitivity of sheathless capillary electrophoresis-tandem mass spectrometry for proteomic analysis. Anal. Chem. 2012;84:8505–8513. doi: 10.1021/ac301091m. [DOI] [PMC free article] [PubMed] [Google Scholar]
- 19.Lee WH, Wang CW, Her GR. Staggered multistep elution solid-phase extraction capillary electrophoresis/tandem mass spectrometry: a high-throughput approach in protein analysis. Rapid Commun. Mass Spectrom. 2011;25:2124–2130. doi: 10.1002/rcm.5091. [DOI] [PubMed] [Google Scholar]
- 20.Faserl K, Kremser L, Müller M, Teis D, Lindner HH. Quantitative proteomics using ultralow flow capillary electrophoresis-mass spectrometry. Anal. Chem. 2015;87:4633–4640. doi: 10.1021/acs.analchem.5b00312. [DOI] [PMC free article] [PubMed] [Google Scholar]
- 21.Zhu G, Sun L, Yan X, Dovichi NJ. Single-shot proteomics using capillary zone electrophoresis-electrospray ionization-tandem mass spectrometry with production of more than 1250 Escherichia coli peptide identifications in a 50 min separation. Anal. Chem. 2013;85:2569–2573. doi: 10.1021/ac303750g. [DOI] [PMC free article] [PubMed] [Google Scholar]
- 22.Zhu G, Sun L, Yan X, Dovichi NJ. Stable, reproducible, and automated capillary zone electrophoresis-tandem mass spectrometry system with an electrokinetically pumped sheath-flow nanospray interface. Anal. Chim. Acta. 2014;810:94–98. doi: 10.1016/j.aca.2013.11.057. [DOI] [PMC free article] [PubMed] [Google Scholar]
- 23.Sun L, Hebert AS, Yan X, Zhao Y, Westphall MS, Rush MJ, Zhu G, Champion MM, Coon JJ, Dovichi NJ. Over 10,000 peptide identifications from the HeLa proteome by using single-shot capillary zone electrophoresis combined with tandem mass spectrometry. Angew. Chem., Int. Ed. 2014;53:13931–13933. doi: 10.1002/anie.201409075. [DOI] [PMC free article] [PubMed] [Google Scholar]
- 24.Peuchen EH, Sun L, Dovichi NJ. Optimization and comparison of bottom-up proteomic sample preparation for early-stage Xenopus laevis embryos. Anal Bioanal Chem. 2016;408:4743–4749. doi: 10.1007/s00216-016-9564-2. [DOI] [PMC free article] [PubMed] [Google Scholar]
- 25.Song C, Ye M, Han G, Jiang X, Wang F, Yu Z, Chen R, Zou H. Reversed-phase-reversed-phase liquid chromatography approach with high orthogonality for multidimensional separation of phosphopeptides. Anal. Chem. 2010;82:53–56. doi: 10.1021/ac9023044. [DOI] [PubMed] [Google Scholar]
- 26.Zhu G, Sun L, Dovichi NJ. Thermally-initiated free radical polymerization for reproducible production of stable linear polyacrylamide coated capillaries, and their application to proteomic analysis using capillary zone electrophoresis-mass spectrometry. Talanta. 2016;146:839–843. doi: 10.1016/j.talanta.2015.06.003. [DOI] [PMC free article] [PubMed] [Google Scholar]
- 27.Sun L, Zhu G, Zhang Z, Mou S, Dovichi NJ. Third-generation electrokinetically pumped sheath-flow nanospray interface with improved stability and sensitivity for automated capillary zone electrophoresis-mass spectrometry analysis of complex proteome digests. J. Proteome Res. 2015;14:2312–2321. doi: 10.1021/acs.jproteome.5b00100. [DOI] [PMC free article] [PubMed] [Google Scholar]
- 28.Cox J, Neuhauser N, Michalski A, Scheltema RA, Olsen JV, Mann MJ. Andromeda: a peptide search engine integrated into the MaxQuant environment. Proteome Res. 2011;10:1794–1805. doi: 10.1021/pr101065j. [DOI] [PubMed] [Google Scholar]
- 29.Wühr M, Freeman RM, Jr, Presler M, Horb ME, Peshkin L, Gygi SP, Kirschner MW. Deep proteomics of the Xenopus laevis egg using an mRNA-derived reference database. Curr. Biol. 2014;24:1467–1475. doi: 10.1016/j.cub.2014.05.044. [DOI] [PMC free article] [PubMed] [Google Scholar]
- 30.Zhu G, Sun L, Yan X, Dovichi NJ. Bottom-up proteomics of Escherichia coli using dynamic pH junction preconcentration and capillary zone electrophoresis-electrospray ionization-tandem mass spectrometry. Anal. Chem. 2014;86:6331–6336. doi: 10.1021/ac5004486. [DOI] [PMC free article] [PubMed] [Google Scholar]
- 31.Shihabi ZK. Stacking in capillary zone electrophoresis. J. Chromatogr. A. 2000;902:107–117. doi: 10.1016/s0021-9673(00)00743-3. [DOI] [PubMed] [Google Scholar]
Associated Data
This section collects any data citations, data availability statements, or supplementary materials included in this article.


