

Abstract
Purpose of review
Metabolic syndrome (MetS) is a cluster of inter-related and heritable metabolic traits, which collectively impart unsurpassed risk for atherosclerotic cardiovascular disease and type 2 diabetes. Considerable work has been done to understand the underlying disease mechanisms by elucidating its genetic etiology.
Recent findings
Genome-wide association studies (GWAS) have been widely utilized albeit with modest success in identifying variants that are associated with more than two metabolic traits. Another limitation of this approach is the inherent small effect of the common variants, a major barrier for dissecting their cognate pathways. Modest advances in this venue have been also made by genetic studies of kindreds at the extreme ends of quantitative distributions. These efforts have led to the discovery of a number of disease genes with large effects that underlie the association of diverse traits of this syndrome.
Summary
Substantial progress has been made over the last decade in identification of genetic risk factors associated with the various traits of MetS. The heterogeneity and multifactorial heritability of MetS, however, has been a challenge towards understanding the factors underlying the association of these traits. Genetic investigations of outlier kindreds or homogenous populations with high prevalence for the disease can potentially improve our knowledge of the disease pathophysiology.
Keywords: Genetics, Metabolic syndrome, obesity, hypertriglyceridemia, diabetes
1. Introduction
Metabolic syndrome is a cluster of metabolic traits that confer high risk for cardiovascular disease (CVD) and diabetes. While this entity has been known for more than 6 decades [1], its significance has only been recently realized as a public health threat with a prevalence that is soaring across all age groups [2].
Patients with MetS have an estimated relative risk (RR) of 2.35 (2.02-2.73) for CVD [3]. Their RR for CVD mortality after adjusting for diabetes and conventional risk factors is estimated between 1.39 (1.03-1.86) [4] to 1.54 (1.32-1.79) [5]. The RR for death appears to be independent of body weight and can be as high as 4.05 (2.38-6.89) in normal weight patients with MetS compared to those without MetS [4]. Even among subjects with angiographically significant coronary artery disease (CAD), the hazard ratio for cardiovascular events is much greater in those with MetS compared to those without [6].
MetS remains a heterogeneous disorder with multiple components encompassing truncal obesity, atherogenic dyslipidemia, hypertension, glucose intolerance, a proinflammatory state, and a prothrombotic state that commonly cluster together. The spectrum of traits in a patient at the time of diagnosis may vary considerably even in affected members of the same family. This heterogeneity creates a challenge for genetic studies that hinge on a well-defined clinical phenotype for success. Attempts have been made by national and international organizations to establish a universal definition for this syndrome. The National Cholesterol Education Program (NCEP) Adult Treatment Panel III (ATP III) criteria are widely used and require the presence of any 3 out of 5 metabolic traits for the diagnosis. These include: hypertension (>130/85 mmHg), abdominal obesity (a waist circumference of ≥102 cm in men, ≥88 cm in women, ≥90 cm in Asian-American men, and ≥80 cm in Asian-American women), elevated triglycerides (TG ≥150 mg/dl), reduced plasma high-density lipoprotein cholesterol (HDL <40 mg/dl in men and <50 mg/dl in women), and impaired glucose tolerance (>100 mg/dl) [7; 8].
Recently, the CardioMetabolic Health Alliance think tank further categorized the syndrome into subtypes and stages. The subtypes include lipid dominant, adiposity dominant, vascular dominant, insulin resistance dominant, and “other subtype” that contains patients with hyperuricemia, chronic kidney disease or hormonal dysfunction. This effort was made to improve the characterization of the phenotype and prognostication of end-organ consequences [9*].
2. Genetic causes of Metabolic syndrome
Family and twin studies have provided the initial evidence for the heritability and co-occurrence of the metabolic traits. Heritability estimates for each of the MetS traits exceed 50%.
Genetic studies have successfully identified a number of mutations for individual traits. In this regards progress in understanding the genetics of obesity, which plays a central role in MetS, has been substantial.
2.1. Monogenic disorders of obesity
Total body fat is determined by calories from food intake and energy expenditure, which are both influenced by genetic factors. Rare recessive mutations in the genes encoding leptin and its receptor have been associated with obesity and insulin resistance. Leptin is secreted from adipose tissue and provides an important feedback signal between the peripheral fat deposit and the hypothalamic proopiomelanocortin (POMC) neurons in the arcuate and paraventricular nuclei. Post-translational processing of POMC generates melanocortin peptides α, β, and γMSH, which stimulate the melanocortin receptors 3 and 4 (MC4R and MC3R) to generate an anorectic response and reduce the fat deposit [10] . In addition, leptin inhibits the orexigenic pathway via inhibiting the agouti-related peptide (AGRP) and neuropeptide Y (NPY) neurons in the arcuate nucleus [11]. Mutations in MCR3, MC4R, and POMC genes have been associated with monogenic forms of obesity. Moreover, MC4R mutations account for about 6% of monogenic obesity cases in children [12].
3. Genetic approaches for discovery of MetS genes
In the following section we will briefly explain the different approaches and their results.
3.1. Candidate gene approach
Mutation burden analysis of candidate genes is among the first methods used for discovering MetS genes. Given its biased nature, most genetic associations failed to be replicated or be identified through GWAS. Such examples include polymorphisms in or near genes encoding SLC6A14, GAD2, and ENPP1.
Furthermore, the majority of the identified disease genes underlie only one metabolic trait. Few exceptions include variations in ADIPOQ associated with diabetes, hypertension, and dyslipidemia. Other examples include variations in NR3C1, FOXC2, SREBP1, and GNB3 genes.
3.2. Genome-wide Linkage Analysis
Genome wide linkage analysis has been widely used to map disease genes for MetS. Several loci were have been reported in Caucasian Americans (1p34.1, 1q41, 2p22.3, 3q27, 7q31.3, 9p13.1, 9q21.1, 10p11.2, 17p12, and 19q13.4) [13] and in Hispanics (6q and 1q23–q31) [14]. No specific gene has been identified for these loci.
3.3. Genome Wide Association Studies (GWAS)
GWAS examine the genome for common polymorphisms associated with the disease and are particularly suitable for complex traits. This unbiased approach takes advantage of linkage disequilibrium between a disease allele and nearby polymorphisms. These studies have been powered by the discovery of a massive number of polymorphisms in the human genome. Nonetheless, they also suffer from several limitations. First, uncovered genetic variants are not necessarily causative. Another setback is the requirement of a minimum allele frequency, often set at 5% in the study population. This means that the associated mutation should be ancient enough to be widespread in the study population. However, genetic variants that withstand the pressure of time often impart small effects on the trait. Moreover, these studies fall victim of multiple testing corrections that are necessary given the large number of variants used in each assay. The threshold for a “genome-wide significance” is set at p < 5 × 10⁻⁸. Nonetheless, a number of variants have been identified by GWAS that have provided insight into disease pathogenesis (table 1-5).
Table 1.
Obesity associated genes based on genome wide association studies.
| Chr1 | Genes2 |
|---|---|
| 1 | DNM3/PIGC |
| GORAB | |
| PTBP2 | |
| ELAVL4 | |
| FUBP1 | |
| USP33 | |
| FPGT | |
| TNNI3K | |
| GNAT2 | |
| AMPD2 | |
| NEGR1 | |
| LYPLAL1 | |
| TBX15-WARS2 | |
| NAV1 | |
| SLC30A10 | |
| SEC16B | |
| AGBL4 | |
| DCST2 | |
| TAL1 | |
| 2 | LINC01122 |
| NCOA1 | |
| SH2B1 | |
| GRB14-COBLL1 | |
| KCNK3 | |
| EHBP1 | |
| TMEM18 | |
| MEIS1 | |
| FIGN | |
| UBE2E3 | |
| CALCRL | |
| CREB1 | |
| KLF7 | |
| LRP1B | |
| IRS1; PLCD4 | |
| CYP27A1 | |
| USP37 | |
| TTLL4 | |
| STK36; ZNF142 | |
| RQCD1 | |
| POMC/ADCY3 | |
| ERBB4 | |
| FANCL | |
| 3 | PLXND1 |
| CADM2 | |
| ETV5 | |
| RASA2 | |
| LEKR1 | |
| PPARG | |
| PBRM1c | |
| FHIT | |
| ADAMTS9 | |
| GBE1 | |
| NISCH/STAB1 | |
| RARB | |
| MRPS22 | |
| 4 | GNPDA2 |
| GABRG1 | |
| HHIP | |
| NT5C2 | |
| 10 | CYP17A1 |
| SFXN2 | |
| HIF1AN | |
| GRID1 | |
| TCF7L2 | |
| 11 | BDNF |
| MTCH2 | |
| MACROD1 | |
| VEGFB | |
| CADM1 | |
| HSD17B12 | |
| TRIM66 | |
| TUB | |
| RPL27A | |
| 12 | ITPR2-SSPN |
| CLIP1 | |
| HOXC13 | |
| HECTD4 | |
| CCDC92 | |
| BCDIN3D | |
| FAIM2 | |
| 13 | MTIF3 |
| GTF3A | |
| OLFM4 | |
| MIR548A2 | |
| SPRY2 | |
| MIR548X2 | |
| PCDH9 | |
| SLC39A8 | |
| NUP54 | |
| SCARB2 | |
| SPATA5-FGF2 | |
| NMU | |
| FAM13A | |
| 5 | TNFAIP8 |
| HSD17B4 | |
| POC5 | |
| HMGCR | |
| COL4A3BP | |
| PCSK1 | |
| ZNF608 | |
| FGFR4 | |
| CPEB4 | |
| GALNT10 | |
| MAP3K1 | |
| 6 | LY86 |
| PARK2 | |
| IFNGR1 | |
| OLIG3 | |
| VEGFA | |
| HMGA1 | |
| RSPO3 | |
| TDRG1 | |
| LRFN2 | |
| SNRPC | |
| NUDT3 | |
| CDKAL1 | |
| TFAP2B | |
| BTNL2 | |
| MIR3144 | |
| FOXO3 | |
| 7 | NFE2L3 |
| HIP1 | |
| PMS2L3 | |
| PMS2P5 | |
| WBSCR16 | |
| SNX10 | |
| PMS2L11 | |
| ASB4 | |
| HOXA11 | |
| CALCR | |
| HSA-miR-653 | |
| MSC | |
| 8 | ZBTB10 |
| HNF4G | |
| RALYL | |
| MSRA | |
| NKX2-6 | |
| 9 | LMX1B |
| LINGO2 | |
| ABCA1 | |
| KLF9 | |
| PAX5 | |
| TLR4 | |
| CCDC171 | |
| EPB41L4B | |
| STXBP6 | |
| 14 | NRXN3 |
| PRKD1 | |
| 15 | SMAD6 |
| LBXCOR1 | |
| SCG3 | |
| DMXL2 | |
| BBS4 | |
| ADPGK-AS1 | |
| RFX7 | |
| KLF13 | |
| FTO | |
| 16 | GPRC5B |
| IQCK | |
| GP2; CBLN1 | |
| CMIP | |
| SBK1; APOBR | |
| ATXN2L | |
| SULT1A2; TUFM | |
| MAPK3 | |
| KCTD13 | |
| INO80E | |
| TAOK2 | |
| YPEL3 | |
| SH2B1 | |
| NLRC3 | |
| KAT8; ZNF646 | |
| VKORC1 | |
| ZNF668 | |
| STX1B | |
| FBXL19 | |
| RABEP1 | |
| 17 | RPTOR |
| PEMT | |
| KCNJ2 | |
| SMG6 | |
| 18 | BCL2 |
| MC4R | |
| NPC1 | |
| RIT2 | |
| GRP | |
| 19 | KCTD15 |
| GIPR | |
| QPCTL | |
| JUND | |
| GDF15 | |
| PGPEP1 | |
| TOMM40 | |
| APOE | |
| APOC1 | |
| ZC3H4 | |
| CEBPA | |
| GDF5 | |
| 20 | EYA2 |
| ZFP64 | |
| BMP2 | |
| 21 | ETS2 |
| 22 | ZNRF3 |
| KREMEN1 |
Chromosome number
Nearest genes to loci identified in association with BMI, or waist-to-hip ratio as markers of obesity
Table 5.
Genes associated with blood high density lipoprotein levels based on genome wide association studies
| Chr1 | Nearest genes2 | Gene name |
|---|---|---|
| 1q | GALNT2 | Polypeptide N-acetylgalactosaminyl transferase 2 |
| 2p | APOB | Apolipoprotein B |
| 8p | LPL, SLC18A1 | Lipoprotein lipase, solute carrier family 18A1 |
| 9p | TTC39B | Tetratricopeptide repeat domain 39B |
| 9q | GRIN3A | Glutamate receptor ionotropic N-methyl-D-aspartate 3A |
| PPP3R2 | Protein phosphatase 3 regulatory subunit B beta | |
| ABCA1 | ATP-binding cassette, sub-family A (ABC1) | |
| 11p | MADD | MAP-kinase activating death domain |
| NR1H3 | Nuclear receptor subfamily 1 group H member 3 | |
| 11q | FADS1-FADS2-FADS3 | Fatty acid desaturase 1, 2 and 3 |
| APOA1-C3-A4-A5, ZNF259 | Apolipoprotein A1-C3-A4-A5; Zinc finger protein 259; | |
| BUD13 | BUD13 homolog | |
| 15q | LIPC | Lipase hepatic |
| 16q | CETP | Cholesteryl ester transfer protein, plasma |
| LCAT | Lecithin-cholesterol acyltransferase | |
| CTCF | CCCTC-binding factor (zinc finger protein) | |
| 17p | METTL16 | Methyltransferase like 16; |
| PAFAH1B1 | Platelet-activating factor acetylhydrolase 1b, regulatory subunit 1 | |
| 18q | LIPG, ACAA2 | Lipase endothelial; Acetyl-CoA acyltransferase 2 |
| 19p | ANGPTL4 | Angiopoietin- like 4 |
| 20q | HNF4A | Hepatocyte nuclear factor 4, alpha |
| PLTP | Phospholipid transfer protein |
Chromosome number
Genes nearest to identified loci that are associated with high density lipoprotein (HDL) levels in the blood
The BMI (body mass index) associated loci are over 100 (table 1). The largest GWAS meta-analysis study to date included about 340,000 individuals mainly of European descent. The analysis attributed 2.7% of BMI variation to the 97 identified loci [15**]. Each SNP contributed roughly a 0.1 unit increase in BMI or 0.3 Kg of weight to a 1.7 meters tall individual. In other words, a 29 kg weight increase is expected in an individual that harbors all the 97 at-risk variants. Interestingly, secondary analysis showed that 6.6 ± 1% of additional BMI variation could be explained by 2,346 SNPs that were associated with obesity but with a p <5×10⁻³, well below the threshold for GWAS significance. Further directionality analysis estimated that about 1,000 of these SNPs represent true BMI associations. This is in comparison to the 21.6 ± 2.2% of BMI variance explained by the 1.4 million SNPs in HapMap3.
Of note, some of the obesity-associated loci showed evidence for association with other traits of MetS based on directionality analysis. For instance, FTO and TMEM18 were associated with higher triglycerides (TG), lower HDL, increased fasting insulin, increased blood pressure (BP), and coronary artery disease (CAD). HIP1, MC4R and PRKD1 were associated with higher TG, lower HDL, increased fasting insulin, and CAD. FOXO3 was associated with higher TG, lower HDL, increased blood pressure (BP), and CAD. Finally, data-driven expression-prioritized integration of complex traits (DEPICT) analysis showed that of the 31 tissue types enriched with the obesity associated genes, 27 were in the central nervous system and in dynamic pathways related to synaptic plasticity and glutamate signaling, which confirms the role of neurohormonal regulation and behavior in the pathogenesis of obesity [15**].
One of the strong and reproducible GWAS BMI-associated signals is in the FTO gene (fat mass and obesity associated gene), which encodes a 2-oxoglutarate-dependent nucleic acid demethylase. Latest follow up mechanistic studies showed that the pathogenic alleles repress mitochondrial thermogenesis in adipocyte precursor cells and shift their differentiation from beige (energy dissipating cells) to white (energy storing) adipocytes [16**]. The ARID5B-IRX3-IRX5 pathway mediates this process.
Another recent GWAS included about 224,500 individuals mainly of European descent in a study of the adipose tissue distribution as measured by the BMI-adjusted waist-to-hip ratio (WHR) [17**]. Out of the 49 loci identified, 20 had significant sexual dimorphism and the majority had stronger effects in women. It is worth mentioning the loci that were significantly associated with multiple MetS traits. The GRB14-COBLL1 locus was associated with increased TG, decreased HDL, increased fasting insulin, T2DM, and increased LDL. The MAP3K1, VEGFA and CCDC92 loci were associated with increased TG and decreased HDL. The CCDC92 locus was associated with decreased BMI-adjusted-adiponectin levels (BAA). The PPARG locus was associated with increased TG and LDL. CMIP was associated with decreased HDL and BAA [17**].
In a meta-analysis of GWAS for dyslipidemias in over 188,000 people, 69 microRNAs were identified in genomic regions in proximity to identified SNPs. Further analysis for predicted miRNAs targets identified 4 miRNAs with links to cardiometabolic traits; miR-128-1, miR-148a, miR-130b and miR-301b. In vitro and in vivo studies showed that the latter two miRNA influence lipid trafficking via modulating the expression of low-density lipoprotein (LDL) receptor (LDLR) and ATP-binding cassette A1 cholesterol transporter (ABCA1) [18]. The study, however, did not examine the allele specific effects of the associated SNPs on miRNAs’ expression and function. Nonetheless, the findings are quite intriguing and prompt further studies to examine the association of miRNAs with metabolic traits.
In an interesting application of genetic risk scores using 19 variants associated with insulin resistance from prior GWAS studies, patients with more than 17 at-risk alleles were at significantly increased risk for T2DM, CAD, and HTN compared to those with less than 9 at-risk alleles. Analysis of genetic risk scores revealed that 11 variants out of the 19 were associated with a metabolic profile consistent with MetS; higher TG, lower HDL, greater hepatic steatosis, and lower adiponectin. Moreover, these variants were associated with lower BMI and increased visceral-to-subcutaneous adipose tissue ratio, which is consistent with a subtle form of lipodystrophy [19*].
Lastly, some of the BMI-associated loci negatively correlate with other elements of the MetS. For instance, HHIP is associated with lower risk of T2DM and with increased levels of HDL. Similarly, IRS1 is associated with lower levels of TG, higher levels of HDL, lower fasting insulin levels, and decreased CAD risk; all opposite to what would be expected with MetS [15**]. These findings echo prior observations that obesity doesn't necessarily cause metabolic abnormalities, as one third of obese subjects have normal metabolic profile and harbor no CVD risk [20]. On the other hand, up to 45% of normal weight subjects harbor other metabolic abnormalities placing them at higher risk for CVD and T2DM [21].
4. Monogenic causes of Metabolic Syndrome
Studying monogenic forms of MetS and its form fruste partial lipodystrophies has resulted in identification of factors that underly the association of diverse metabolic traits.
4.1. Hereditary lipodystrophies
Hereditary lipodystrophies are characterized by metabolic traits similar to MetS, except for major differences in the amount and distribution of adipose tissue and decreased leptin levels. These rare disorders include early onset congenital generalized lipodystrophy (CGL) and progeroid syndrome as well as adult onset familial partial lipodystrophies (FPLD) and mandibuloacral dysplasia.
CGL has been associated with mutations in AGPAT2, BSCL2, CAV1, PTRF, and PPARG, which are mainly involved in lipid droplet formation and the biosynthesis of triglycerides and phospholipids [22].
FPLD is the closest disorder to MetS. To date mutations in nine different genes have been associated with FPLD. The autosomal dominant from of FPLD results from mutations in LMNA, PPARG, AKT2, and PLIN1. The autosomal recessive form involves mutations in CIDEC, LIPE, WRN, PCYT1A, and ZMPSTE24 genes [23; 24; 25].
4.2. Wnt and low-density lipoprotein receptor-related protein 6 (LRP6)
MetS has been associated with mutations in the highly conserved Wnt-LRP6 pathway that plays a pivotal role in embryonic development and nutrient sensing. The canonical Wnt pathway is activated via Frizzled family receptors and LRP5/6 co-receptors. Both canonical and non-canonical pathways inhibit mesenchymal stem cell differentiation into adipocytes via repressing PPARG [26; 27]. Several other lines of evidence indicate the importance of Wnt signaling in regulating body weight and food intake as it is expressed in the hypothalamus. Moreover, Wnt ligands and their LRP6 co-receptor are downregulated in NPY neurons in the arcuate nucleus of leptin deficient mice [28]. LRP6 mutations such as R611C, R473Q, R360H, and N433S are associated with autosomal dominant MetS and early onset CAD [29]. Some of these mutations reduce the canonical Wnt function by up to 40% [29]. The role of LRP6 in regulation of plasma lipids was investigated, as it is a member of the LDLR family. Studies of skin fibroblasts in LRP6R611C mutation carriers showed reduced LDL uptake attributed to interference with LDLR internalization and clathrin mediated LDL uptake [30]. Mouse studies implicated LRP6 in regulating LDL synthesis, de novo lipogenesis, and VLDL secretion [31]. Finally, mice with LRP6R611C mutation develop coronary artery disease caused by excessive proliferation of undifferentiated vascular smooth muscle cells. This is triggered by excess activity of growth factors due to the lack of TCF7L2 inhibition of Sp-1 [32]. This variant of CAD phenocopies an entity known as plaque erosion and is linked to increased activity of noncanonical Wnt signalling. Mutations in LRP6 have also been associated with non-alcoholic steatohepatitis (NASH). Studies of mouse models have linked activation of noncanonical Wnt and downstream TGF pathway to liver fibrosis and inflammation.
Subjects with LRP6 mutations have reduced insulin receptor (IR) expression and are insulin resistant [33]. LRP6 transcriptional regulation of IR is important for adipogenic transformation of 3T3L1 cells [34] and for preferential glucose uptake in a drosophila model of insulin resistance [35]. Reduced IR expression can be rescued by either TCF7L2 overexpression or high doses of Wnt3a [Figure 1]. Insulin resistance in LRP6R611C mutation carriers is also accounted for by activation of mTORC1 pathway and serine phosphorylation of IRS1 at multiple residues.
Figure 1.
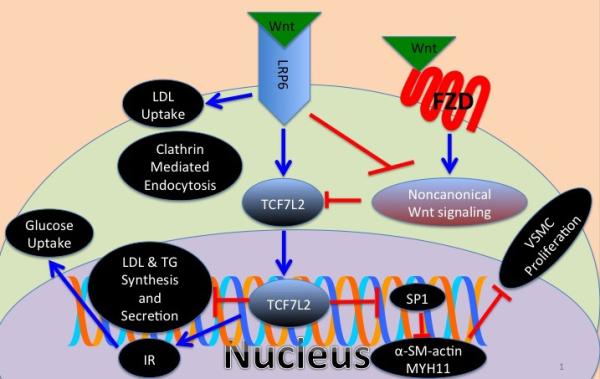
Schematic of Wnt mediated regulation of lipid metabolism, glucose metabolism and vascular smooth muscle differentiation via the canonical and noncanonical pathways. LDL: low density lipoprotein, TG: triglycerides, IR: insulin receptor, VSMC: vascular smooth muscle cell, and FZD: frizzled receptor.
4.3. Dyrk1B a novel gene for metabolic syndrome
We recently discovered a gain of function mutation in Dyrk1B that results in autosomal dominant MetS with early onset CAD. Early mechanistic studies of the R102C mutation suggested increased adipocyte differentiation of precursor cells and increased transcription of glucose-6-phosphatase, the rate-limiting enzyme of gluconeogenesis [36**]. Dual specificity tyrosine-regulated kinase (Dyrk) family has been implicated in nutrient sensing. Dryk kinases regulate GSK3B's phosphorylation of NFAT and FOXO1 transcription factors, thereby influencing pancreatic function, skeletal muscle development, glucose, and insulin homeostasis [37].
Dyrk1B is positively regulated at the transcriptional level by Rho GTPase-Rac 1, and negatively regulated by RAS-MEK-ERK. Interestingly, loss of function mutations in the latter inhibitory pathway is linked to obesity and insulin resistance in humans [38]. Targets of Dryk1B include FOXO1, SIRT1/2, HIF1a, and glycogen synthase all of which are involved in glucose homeostasis [39]. Dyrk1A promotes food intake via direct phosphorylation and activation of SIRT1, which in return deacytylates and activates FOXO. FOXO increases the expression of NPY thus promoting food intake [40]. Moreover, Dryk1A and 1B are highly expressed in the arcuate nucleus, olfactory bulb and hippocampus. This suggests that Dyrk1B may play an important role appetite regulation. NPY is also postulated to increase Dyrk1B expression via the PKA-CREB pathway, as Dyrk1B has a CREB motif in its promoter region [41].
Additionally, Dyrk1B has been shown to influence cell cycle activity by increasing the turnover of p27kip (CDKN1B) [42]. Interestingly, mice deficient in p27 develop atherosclerosis, obesity and insulin resistance whereas those overexpressing p27 are protected against atherosclerosis [43].
Conclusion
With the advent of modern molecular genetics different approaches have been used to identify the genetic causes of MetS. Most progress has been made in identification of common variants that increase the risk for one or two metabolic risk factors. Study of larger and more homogenous populations is necessary to identify variants that underlie the association of the diverse metabolic traits of this syndrome. Genetic studies of outlier kindreds with extreme forms of MetS have led to identification of variants with large effects. The advantage of this approach is in the effect size of the variants and the potential in characterizing their functional effects in vitro and in vivo. Many of these variants such as Dyrk1B are potential targets for development of novel drugs against this syndrome.
Table 2.
Blood pressure associated genes based on genome wide association studies
| Chr1 | Genes2 |
|---|---|
| 1p | CASZ1 |
| MTHFR | |
| CAPZA1 | |
| MOV10 | |
| 2q | FIGN |
| 3p | SLC4A7 |
| ULK4 | |
| MAP4 | |
| 3q | MECOM |
| 4q | CHIC2 |
| FGF5 | |
| SLC39A8 | |
| ENPEP | |
| GUCY1A3 | |
| 5p | NPR3 |
| 5q | EBF1 |
| 6p | HFE |
| HIST1H1T | |
| BAG6 | |
| 7q | PIK3CG |
| NOS3 | |
| 8q | NOV |
| 10p | CACNB2 |
| 10q | PLCE1 |
| CYP17A1 | |
| NT5C2 | |
| ADRB1 | |
| 11p | ADM |
| PLEKHA7 | |
| 11q | ARHGAP42 |
| ADAMTS8 | |
| 12q | POC1B |
| ATP2B1 | |
| SH2B3 | |
| ATXN2 | |
| ALDH2 | |
| NAA25 | |
| HECTD4 | |
| TBX3 | |
| 15q | CSK |
| ULK3 | |
| FES | |
| 17q | ACBD4 |
| WNT3 | |
| GOSR2 | |
| ZNF652 | |
| 18p | c18orf1 |
| 20p | JAG1 |
| 20q | ZNF831 |
Chromosome number
Nearest genes to loci identified in association with blood pressure
Table 3.
Insulin resistance associated loci based on genome wide association studies
| Chr1 | Genes2 |
|---|---|
| 1p | NOTCH2 |
| ADAM30 | |
| SLC44A3 | |
| 1q | PCNXL2 |
| CR2 | |
| F3 | |
| 2p | BCL11A |
| THADA | |
| 2q | IRS1 |
| GRB14 | |
| G6PC2-ABCB11 | |
| RBM43 | |
| RND3 | |
| RBMS1 | |
| ITGB6 | |
| 3p | SYN2 |
| PPARG | |
| ADAMTS9 | |
| PSMD6 | |
| 3q | ST6GAL1 |
| ZPLD1 | |
| PLS1 | |
| IGF2BP2 | |
| PEX5L | |
| 4p | WFS1 |
| PPP2R2C | |
| MAEA | |
| 5q | CETN3 |
| ZBED3 | |
| 6p | KCNK16 |
| CDKAL1 | |
| ZFAND3 | |
| VEGFA | |
| 7p | DGKB |
| AGMO | |
| GCC1 | |
| JAZF1 | |
| 7q | PAX4 |
| ACHE | |
| KLF14 | |
| 8q | SLC30A8 |
| TP53INP1 | |
| 9p | PTPRD |
| CDKN2A | |
| CDKN2B | |
| GLIS3 | |
| 9q | CHCHD2P9 |
| 10p | CDC123 |
| CAMK1D | |
| 10q | TCERG1L |
| PANK1 | |
| HHEX | |
| VPS26A | |
| KIF11 | |
| TCF7L2 | |
| 11p | KCNQ1 |
| GALNT18 | |
| KCNJ11 | |
| 11q | MTNR1B |
| ARAP1 | |
| TMEM45B | |
| BARX2 | |
| 12q | DCD |
| HMGA2 | |
| HNF1A | |
| TSPAN8 | |
| LGR5 | |
| 13q | SPRY2 |
| 14q | C14orf70 |
| 15q | ZFAND6 |
| C2CD4B | |
| AP3S2 | |
| C2CD4A | |
| C2CD4B | |
| HMG20A | |
| PRC1 | |
| 16q | CMIP |
| WWOX | |
| FTO | |
| 17p | SRR |
| 17q | HNF1B |
| 18p | LPIN2 |
| 19q | PEPD |
| ACP7 | |
| 20q | HNF4A |
| 21q | HUNK |
| Xq | DUSP9 |
Chromosome number
Nearest genes to loci identified in association with insulin resistance
Table 4.
Hypertriglyceridemia associated loci based on GWAS studies
| Chr1 | Nearest genes2 | Gene name |
|---|---|---|
| 1p | ANGPTL3 | Angiopoietin- like 3 |
| DOCK7 | Dedicator of cytokinesis 7 | |
| ATG4C | Autophagy related 4C, cysteine peptidase | |
| 1q | GALNT2 | Polypeptide N-acetylgalactosaminyltransferase 2 |
| 2p | GCKR | Glucokinase (hexokinase 4) regulator |
| APOB | Apolipoprotein B | |
| 7q | BAZ1B | Bromodomain adjacent to zinc finger domain 1B |
| BCL7B | B-cell CLL/lymphoma 7B | |
| TBL2 | Transducin (beta)-like 2; MLX interacting protein-like | |
| MLXIPL | ||
| 8p | LPL/SLC18A1 | Lipoprotein lipase; Solute carrier family 18A1 |
| XKR6 | XK Kell blood group complex subunit-related 6 | |
| SLC35G5 | Solute carrier family 35, member G5 | |
| TRIB1 | Tribbles pseudokinase 1 | |
| 11q | FADS1-FADS2-FADS3 | Fatty acid desaturase 1, 2 and 3 |
| APOA1-C3-A4-A5 | Apolipoprotein A1-C3-A4-A5 | |
| ZNF259, BUD13 | Zinc finger protein 259; BUD13 homolog | |
| 15q | RASGRP1 | RAS guanyl releasing protein 1 |
| 19p | NCAN, SUGP1 | Neurocan; SURP and G patch domain containing 1 |
| CILP2 | Cartilage intermediate layer protein 2 | |
| PBX4 | Pre-B-cell leukemia homeobox 4 | |
| 19q | TOMM40 | Translocase of outer mitochondrial membrane 40 homolog; |
| APOE-C1-C2 | Apolipoprotein E; Apolipoprotein C-I | |
| 20q | PLTP | Phospholipid transfer protein |
Chromosome number
Nearest genes to hypertriglyceridemia associated loci
Key points.
Metabolic syndrome is a combination of heritable cardio-metabolic abnormalities that tend to cluster together and significantly increase the risk of cardiovascular events.
Only a few genes with large effects have been discovered that can explain the association of diverse traits in this syndrome
Study of homogenous populations at the extreme ends of quantitative distribution is necessary to identify variants that underlie the association of the diverse metabolic traits of this syndrome.
Elucidating the genetics of MetS can lead to pharmacotherapies that improve all the metabolic profiles in patients with this syndrome.
Acknowledgements
None
Financial support and sponsorship:
This manuscript was supported by grants from the National Institutes of Health (NIH) (1R01HL122830 and 1R01HL122822 to Arya Mani).
Footnotes
Conflicts of Interest
None
References
- 1.Vague J. The degree of masculine differentiation of obesities: a factor determining predisposition to diabetes, atherosclerosis, gout, and uric calculous disease. Am J Clin Nutr. 1956 Jan-Feb;4(1):20–34. doi: 10.1093/ajcn/4.1.20. [DOI] [PubMed] [Google Scholar]
- 2.Falkner B, Cossrow ND. Prevalence of metabolic syndrome and obesity-associated hypertension in the racial ethnic minorities of the United States. Curr Hypertens Rep. 2014 Jul;16(7):449–014-0449-5. doi: 10.1007/s11906-014-0449-5. [DOI] [PMC free article] [PubMed] [Google Scholar]
- 3.Mottillo S, Filion KB, Genest J, Joseph L, Pilote L, Poirier P, et al. The metabolic syndrome and cardiovascular risk a systematic review and meta-analysis. J Am Coll Cardiol. 2010 Sep 28;56(14):1113–1132. doi: 10.1016/j.jacc.2010.05.034. [DOI] [PubMed] [Google Scholar]
- 4.Daly CA, Hildebrandt P, Bertrand M, Ferrari R, Remme W, Simoons M, et al. Adverse prognosis associated with the metabolic syndrome in established coronary artery disease: data from the EUROPA trial. Heart. 2007 Nov;93(11):1406–1411. doi: 10.1136/hrt.2006.113084. [DOI] [PMC free article] [PubMed] [Google Scholar]
- 5.Gami AS, Witt BJ, Howard DE, Erwin PJ, Gami LA, Somers VK, et al. Metabolic syndrome and risk of incident cardiovascular events and death: a systematic review and meta-analysis of longitudinal studies. J Am Coll Cardiol. 2007 Jan 30;49(4):403–414. doi: 10.1016/j.jacc.2006.09.032. [DOI] [PubMed] [Google Scholar]
- 6.Marroquin OC, Kip KE, Kelley DE, Johnson BD, Shaw LJ, Bairey Merz CN, et al. Metabolic syndrome modifies the cardiovascular risk associated with angiographic coronary artery disease in women: a report from the Women's Ischemia Syndrome Evaluation. Circulation. 2004 Feb 17;109(6):714–721. doi: 10.1161/01.CIR.0000115517.26897.A7. [DOI] [PubMed] [Google Scholar]
- 7.National Cholesterol Education Program (NCEP) Expert Panel on Detection, Evaluation, and Treatment of High Blood Cholesterol in Adults (Adult Treatment Panel III) Third Report of the National Cholesterol Education Program (NCEP) Expert Panel on Detection, Evaluation, and Treatment of High Blood Cholesterol in Adults (Adult Treatment Panel III) final report. Circulation. 2002 Dec 17;106(25):3143–3421. [PubMed] [Google Scholar]
- 8.Grundy SM, Cleeman JI, Daniels SR, Donato KA, Eckel RH, Franklin BA, et al. Diagnosis and management of the metabolic syndrome: an American Heart Association/National Heart, Lung, and Blood Institute Scientific Statement. Circulation. 2005 Oct 25;112(17):2735–2752. doi: 10.1161/CIRCULATIONAHA.105.169404. [DOI] [PubMed] [Google Scholar]
- 9*.Sperling LS, Mechanick JI, Neeland IJ, Herrick CJ, Despres JP, Ndumele CE, et al. The CardioMetabolic Health Alliance: Working Toward a New Care Model for the Metabolic Syndrome. J Am Coll Cardiol. 2015 Sep 1;66(9):1050–1067. doi: 10.1016/j.jacc.2015.06.1328. [This article discussed new approaches towards classification of metabolic syndrome. It helps further clarify the complex phenotypes in metabolic syndrome. The new approach can also help in tailoring medical management.] [DOI] [PubMed] [Google Scholar]
- 10.Van der Klaauw AA, Farooqi IS. The hunger genes: pathways to obesity. Cell. 2015 Mar 26;161(1):119–132. doi: 10.1016/j.cell.2015.03.008. [DOI] [PubMed] [Google Scholar]
- 11.Gropp E, Shanabrough M, Borok E, Xu AW, Janoschek R, Buch T, et al. Agouti-related peptide-expressing neurons are mandatory for feeding. Nat Neurosci. 2005 Oct;8(10):1289–1291. doi: 10.1038/nn1548. [DOI] [PubMed] [Google Scholar]
- 12.Doulla M, McIntyre AD, Hegele RA, Gallego PH. A novel MC4R mutation associated with childhood-onset obesity: A case report. Paediatr Child Health. 2014 Dec;19(10):515–518. doi: 10.1093/pch/19.10.515. [DOI] [PMC free article] [PubMed] [Google Scholar]
- 13.Loos RJ, Katzmarzyk PT, Rao DC, Rice T, Leon AS, Skinner JS, et al. Genome-wide linkage scan for the metabolic syndrome in the HERITAGE Family Study. J Clin Endocrinol Metab. 2003 Dec;88(12):5935–5943. doi: 10.1210/jc.2003-030553. [DOI] [PubMed] [Google Scholar]
- 14.Langefeld CD, Wagenknecht LE, Rotter JI, Williams AH, Hokanson JE, Saad MF, et al. Linkage of the metabolic syndrome to 1q23-q31 in Hispanic families: the Insulin Resistance Atherosclerosis Study Family Study. Diabetes. 2004 Apr;53(4):1170–1174. doi: 10.2337/diabetes.53.4.1170. [DOI] [PubMed] [Google Scholar]
- 15**.Locke AE, Kahali B, Berndt SI, Justice AE, Pers TH, Day FR, et al. Genetic studies of body mass index yield new insights for obesity biology. Nature. 2015 Feb 12;518(7538):197–206. doi: 10.1038/nature14177. [This article is an original genome wide association study with metabochip meta-analysis of body mass index (BMI). It includes over 300,000 people, and identifies 97 loci in association with the obesity marker. The article contains a wealth of data in the supplementary materials.] [DOI] [PMC free article] [PubMed] [Google Scholar]
- 16**.Claussnitzer M, Dankel SN, Kim KH, Quon G, Meuleman W, Haugen C, et al. FTO Obesity Variant Circuitry and Adipocyte Browning in Humans. N Engl J Med. 2015 Sep 3;373(10):895–907. doi: 10.1056/NEJMoa1502214. [This article provides significant insight into the molecular mechanisms through which the FTO gene mediates the obesity phenotype. This is also a proof of concept, as the FTO gene was discovered in a GWAS study of obesity many years ago. While the GWAS provided the associated evidence, this study demonstrates a causation relationship with a clear and novel molecular pathway identified.] [DOI] [PMC free article] [PubMed] [Google Scholar]
- 17**.Shungin D, Winkler TW, Croteau-Chonka DC, Ferreira T, Locke AE, Magi R, et al. New genetic loci link adipose and insulin biology to body fat distribution. Nature. 2015 Feb 12;518(7538):187–196. doi: 10.1038/nature14132. [This study used the waist-to-hip ratio adjusted for BMI as a surrogate marker for adiposity. Another great GWAS and Metabochip meta-analysis of over 220,000 people though with a different marker of obesity that aims to capture the abnormal adipose tissue distribution compared to the study by Locke AE et al. It successfully, identifies 49 loci, of which 33 are new. There is a wealth of data in the supplementary materials.] [DOI] [PMC free article] [PubMed] [Google Scholar]
- 18.Wagschal A, Najafi-Shoushtari SH, Wang L, Goedeke L, Sinha S, deLemos AS, et al. Genome-wide identification of microRNAs regulating cholesterol and triglyceride homeostasis. Nat Med. 2015 Nov;21(11):1290–1297. doi: 10.1038/nm.3980. [DOI] [PMC free article] [PubMed] [Google Scholar]
- 19.Yaghootkar H, Scott RA, White CC, Zhang W, Speliotes E, Munroe PB, et al. Genetic evidence for a normal-weight “metabolically obese” phenotype linking insulin resistance, hypertension, coronary artery disease, and type 2 diabetes. Diabetes. 2014 Dec;63(12):4369–4377. doi: 10.2337/db14-0318. [DOI] [PMC free article] [PubMed] [Google Scholar]
- 20.Wildman RP. Healthy obesity. Curr Opin Clin Nutr Metab Care. 2009 Jul;12(4):438–443. doi: 10.1097/MCO.0b013e32832c6db7. [DOI] [PubMed] [Google Scholar]
- 21.Conus F, Rabasa-Lhoret R, Peronnet F. Characteristics of metabolically obese normal-weight (MONW) subjects. Appl Physiol Nutr Metab. 2007 Feb;32(1):4–12. doi: 10.1139/h06-092. [DOI] [PubMed] [Google Scholar]
- 22.Patni N, Garg A. Congenital generalized lipodystrophies-new insights into metabolic dysfunction. Nat Rev Endocrinol. 2015 Sep;11(9):522–534. doi: 10.1038/nrendo.2015.123. [DOI] [PMC free article] [PubMed] [Google Scholar]
- 23.Farhan SM, Robinson JF, McIntyre AD, Marrosu MG, Ticca AF, Loddo S, et al. A novel LIPE nonsense mutation found using exome sequencing in siblings with late-onset familial partial lipodystrophy. Can J Cardiol. 2014 Dec;30(12):1649–1654. doi: 10.1016/j.cjca.2014.09.007. [DOI] [PubMed] [Google Scholar]
- 24.Dyment DA, Gibson WT, Huang L, Bassyouni H, Hegele RA, Innes AM. Biallelic mutations at PPARG cause a congenital, generalized lipodystrophy similar to the Berardinelli-Seip syndrome. Eur J Med Genet. 2014 Sep;57(9):524–526. doi: 10.1016/j.ejmg.2014.06.006. [DOI] [PubMed] [Google Scholar]
- 25.Robbins AL, Savage DB. The genetics of lipid storage and human lipodystrophies. Trends Mol Med. 2015 Jul;21(7):433–438. doi: 10.1016/j.molmed.2015.04.004. [DOI] [PubMed] [Google Scholar]
- 26.Okamura M, Kudo H, Wakabayashi K, Tanaka T, Nonaka A, Uchida A, et al. COUP-TFII acts downstream of Wnt/beta-catenin signal to silence PPARgamma gene expression and repress adipogenesis. Proc Natl Acad Sci U S A. 2009 Apr 7;106(14):5819–5824. doi: 10.1073/pnas.0901676106. [DOI] [PMC free article] [PubMed] [Google Scholar]
- 27.Takada I, Mihara M, Suzawa M, Ohtake F, Kobayashi S, Igarashi M, et al. A histone lysine methyltransferase activated by non-canonical Wnt signalling suppresses PPAR-gamma transactivation. Nat Cell Biol. 2007 Nov;9(11):1273–1285. doi: 10.1038/ncb1647. [DOI] [PubMed] [Google Scholar]
- 28.Benzler J, Andrews ZB, Pracht C, Stohr S, Shepherd PR, Grattan DR, et al. Hypothalamic WNT signalling is impaired during obesity and reinstated by leptin treatment in male mice. Endocrinology. 2013 Dec;154(12):4737–4745. doi: 10.1210/en.2013-1746. [DOI] [PubMed] [Google Scholar]
- 29.Singh R, Smith E, Fathzadeh M, Liu W, Go GW, Subrahmanyan L, et al. Rare nonconservative LRP6 mutations are associated with metabolic syndrome. Hum Mutat. 2013 Sep;34(9):1221–1225. doi: 10.1002/humu.22360. [DOI] [PMC free article] [PubMed] [Google Scholar]
- 30.Ye ZJ, Go GW, Singh R, Liu W, Keramati AR, Mani A. LRP6 protein regulates low density lipoprotein (LDL) receptor-mediated LDL uptake. J Biol Chem. 2012 Jan 6;287(2):1335–1344. doi: 10.1074/jbc.M111.295287. [DOI] [PMC free article] [PubMed] [Google Scholar]
- 31.Go GW, Srivastava R, Hernandez-Ono A, Gang G, Smith SB, Booth CJ, et al. The combined hyperlipidemia caused by impaired Wnt-LRP6 signaling is reversed by Wnt3a rescue. Cell Metab. 2014 Feb 4;19(2):209–220. doi: 10.1016/j.cmet.2013.11.023. [DOI] [PMC free article] [PubMed] [Google Scholar]
- 32.Srivastava R, Zhang J, Go G, Narayanan A, Nottoli TP, Mani A. Impaired LRP6-TCF7L2 Activity Enhances Smooth Muscle Cell Plasticity and Causes Coronary Artery Disease. Cell Reports. 2015 doi: 10.1016/j.celrep.2015.09.028. In Press. [DOI] [PMC free article] [PubMed] [Google Scholar]
- 33.Singh R, Aguiar RB, Naik S, Mani S, Ostadsharif K, Wencker D, et al. LRP6 enhances glucose metabolism by promoting TCF7L2-dependent insulin receptor expression and IGF receptor stabilization in humans. Cell Metab. 2013 Feb 5;17(2):197–209. doi: 10.1016/j.cmet.2013.01.009. [DOI] [PMC free article] [PubMed] [Google Scholar]
- 34.Palsgaard J, Emanuelli B, Winnay JN, Sumara G, Karsenty G, Kahn CR. Cross-talk between insulin and Wnt signaling in preadipocytes: role of Wnt co-receptor low density lipoprotein receptor-related protein-5 (LRP5). J Biol Chem. 2012 Apr 6;287(15):12016–12026. doi: 10.1074/jbc.M111.337048. [DOI] [PMC free article] [PubMed] [Google Scholar]
- 35.Hirabayashi S, Baranski TJ, Cagan RL. Transformed Drosophila cells evade diet-mediated insulin resistance through wingless signaling. Cell. 2013 Aug 1;154(3):664–675. doi: 10.1016/j.cell.2013.06.030. [DOI] [PMC free article] [PubMed] [Google Scholar]
- 36**.Keramati AR, Fathzadeh M, Go GW, Singh R, Choi M, Faramarzi S, et al. A form of the metabolic syndrome associated with mutations in DYRK1B. N Engl J Med. 2014 May 15;370(20):1909–1919. doi: 10.1056/NEJMoa1301824. [This article describes the discovery of a novel gene associated with metabolic syndrome. This study was based on three different families with high incidence of metabolic syndrome. The use of such a homogenous population with a clearly defined phenotype led to the identification of a founder mutation in a previously unknown locus. Preliminary follow up studies demonstrate a significant role for DYRK1B in energy metabolism.] [DOI] [PMC free article] [PubMed] [Google Scholar]
- 37.Gwack Y, Sharma S, Nardone J, Tanasa B, Iuga A, Srikanth S, et al. A genome-wide Drosophila RNAi screen identifies DYRK-family kinases as regulators of NFAT. Nature. 2006 Jun 1;441(7093):646–650. doi: 10.1038/nature04631. [DOI] [PubMed] [Google Scholar]
- 38.Pearce LR, Atanassova N, Banton MC, Bottomley B, van der Klaauw AA, Revelli JP, et al. KSR2 mutations are associated with obesity, insulin resistance, and impaired cellular fuel oxidation. Cell. 2013 Nov 7;155(4):765–777. doi: 10.1016/j.cell.2013.09.058. [DOI] [PMC free article] [PubMed] [Google Scholar]
- 39.Guo X, Williams JG, Schug TT, Li X. DYRK1A and DYRK3 promote cell survival through phosphorylation and activation of SIRT1. J Biol Chem. 2010 Apr 23;285(17):13223–13232. doi: 10.1074/jbc.M110.102574. [DOI] [PMC free article] [PubMed] [Google Scholar]
- 40.Hong SH, Lee KS, Kwak SJ, Kim AK, Bai H, Jung MS, et al. Minibrain/Dyrk1a regulates food intake through the Sir2-FOXO-sNPF/NPY pathway in Drosophila and mammals. PLoS Genet. 2012;8(8):e1002857. doi: 10.1371/journal.pgen.1002857. [DOI] [PMC free article] [PubMed] [Google Scholar]
- 41.Martin KA, Mani MV, Mani A. New targets to treat obesity and the metabolic syndrome. Eur J Pharmacol. 2015 Sep 15;763(Pt A):64–74. doi: 10.1016/j.ejphar.2015.03.093. [DOI] [PMC free article] [PubMed] [Google Scholar]
- 42.Ewton DZ, Lee K, Deng X, Lim S, Friedman E. Rapid turnover of cell-cycle regulators found in Mirk/dyrk1B transfectants. Int J Cancer. 2003 Jan 1;103(1):21–28. doi: 10.1002/ijc.10743. [DOI] [PubMed] [Google Scholar]
- 43.Naaz A, Holsberger DR, Iwamoto GA, Nelson A, Kiyokawa H, Cooke PS. Loss of cyclin-dependent kinase inhibitors produces adipocyte hyperplasia and obesity. FASEB J. 2004 Dec;18(15):1925–1927. doi: 10.1096/fj.04-2631fje. [DOI] [PubMed] [Google Scholar]