Abstract
Confocal and two-photon microscopy has been widely used in bone research to not only produce high quality, three-dimensional images but also to provide valuable structural and quantitative information. In this article, we describe step-by-step protocols for confocal and two-photon microscopy to investigate earlier cellular events during colonisation of cancer cells in bone using xenograft mouse models. This includes confocal/two-photon microscopy imaging of paraformaldehyde fixed thick bone sections and frozen bone samples.
Introduction
Confocal and two-photon microscopy have been widely used to visualise and track biological events, from the cellular to the molecular level, with the main advantage being able to produce three-dimensional (3D) images of thick sample specimens. This provides exciting possibilities to study cellular interactions and microstructures when imaging optically dense tissue such as bone.
The first confocal microscope was developed by Marvin Minsky1 in 1955 and was widely applied in biological research after its commercial availability in early 1980s.2 In a confocal microscope, the laser beam is focused by the objective lens into a focal volume within a fluorescent specimen. All emitted fluorescent light from the focal plane will be recollected by the objective lens, focused at the confocal pinhole and passed to the detector, whilst fluorescent light emitted from objects not in focal plane (out-of-focus signal) will hit the edge of the pinhole and be physically blocked from reaching the detector. Therefore, sharper images with better contrast and higher resolution could be achieved using a confocal microscope, compared with the commonly used wide-field fluorescence microscope (Figure 1a). Since the first application in studying human cranial bone microstructure by Alan Boyde in 1990,3 confocal microscopy has become a powerful tool in research related to the skeletal system, such as assessment of bone microdamage under physiological and pathological conditions.4,5,6 Confocal microscopy has also provided opportunities to investigate bone cell-to-cell interactions in three-dimension, which is particular important for research involving osteocytes and osteoblasts.7,8,9,10,11 More recently using revised and improved bone processing strategy, a significant progress has been made in the imaging of the bone marrow microenvironment and particularly the vasculature in bone. This technical advance led to the identification of a specialised blood vessel subtype (namely type H) in bone, which forms a niche for osteoprogenitors and thereby regulates bone formation.12,13,14
Figure 1.
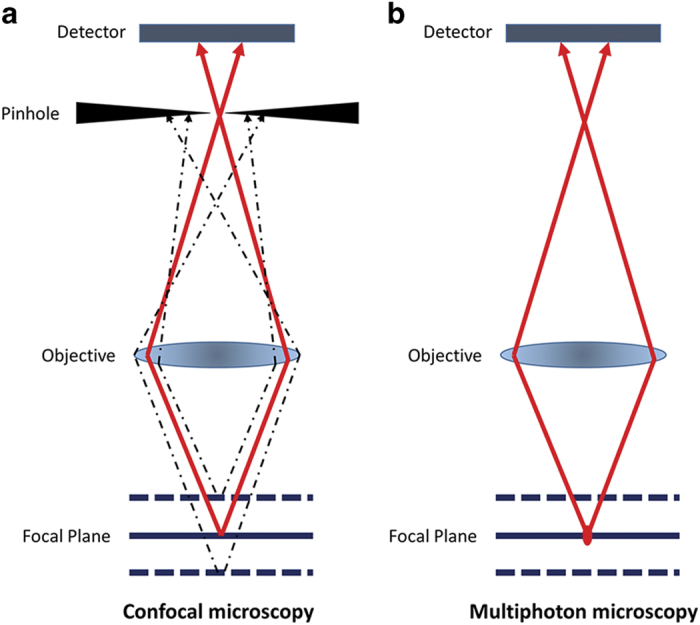
Working principle of confocal and two-photon microscopy. (a) In a confocal microscope, all emitted fluorescent light from the focal plane focused at the confocal pinhole and passed to the detector, whilst out-of-focus signal will hit the edge of the pinhole and be physically blocked from reaching the detector. (b) In two-photon microscopy, the two-photon effect only occurs at the focal point, therefore out-of-focus signal is limited and no pinhole is needed.
The principle of the two-photon effect was proposed in 1930s by Maria Göppert-Mayer and confirmed in 1961 by Kaiser.15 During conventional excitation using confocal microscopy, a fluorescent molecule absorbs a single excitation photon with higher energy level and shorter wavelength than emission. For example, a photon of 488 nm wavelength is used to excite green fluorescent protein (GFP) molecule to emit a 509 nm photon. In contrast, in two-photon microscopy, two longer wavelength exciting photons are used to excite the same fluorescent molecule, when these two photons are concentrated or ‘fused' in a small volume of specimen (<1 f litre) within a short time period (scale of attoseconds).16 In theory, a GFP molecule could be excited by two 976 nm photons with half the amount of energy of one 488 nm photon.16 This means the operating wavelength is in the near-infrared range. In addition, as the two-photon effect only occurs at the focal point, the excitation outside the focal plan is limited and hence physically cutting out-of-focus signals with the pinhole is no longer necessary (Figure 1b). All of these offer advantages compared with confocal microscopy, including reduced scattering, enhanced depth penetration, lower phototoxicity, and the ability to excite multiple fluorescent markers with a single excitation wavelength. As bone structures heavily scatter lights and the high collagen content generates second-harmonic signals (SHG), these advantages won two-photon microscopy increasing popularity in research of cellular activities and interactions within bone and marrow, particularly in identifying the haematopoietic stem cell niche and detecting bone metastasis-initiating cancer cells in bone.17,18,19,20,21,22,23
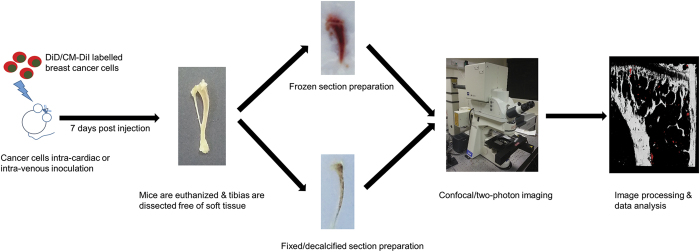
In this article, using the detection of breast cancer cell bone colonisation by confocal and two-photon microscopy as a representative example, we will describe a step-by-step methodology, from sample preparation to data analyses, used to investigate cellular events in frozen and fixed/decalcified mouse bone samples ex vivo (see schematic outline, Figure 2). Advantages and limitations of this technology is also discussed to guide the reader as to which is the most appropriate for their research question.
Figure 2.
Schematic outline. The step-by-step methodology will be described in details in steps of cancer cell preparation, bone specimen preparation (frozen and fixed sample respectively), confocal/two-photon microscopy imaging, and image analysis.
Materials and methods
This methodology, developed for use with the Zeiss LSM510 NLO Upright two-photon microscope, allows the visualization the 3D structure of frozen/fixed samples of calcified bones and the detection of fluorescent lipophilic dyes labelled cancer cells within the bone marrow, providing essential information on the seeding of cancer cells in vivo.
Cancer cell preparation and inoculation
On the day of inoculation, breast cancer cells are pre-labelled with fluorescent lipophilic membrane dyes (Vybrant DiD, DiI and CM-DiI, Life Technologies Ltd, Paisley, UK) to facilitate the detection of single cells in the bone microenvironment by two-photon microscopy. One advantage of using these lipophilic dyes is being able to detect dormant cells as these cell membrane dyes are diluted to undetectable concentrations in proliferating cells.20,21,22,24,25
Cancer cells are firstly washed with phosphate-buffered saline (PBS), trypsinised by 0.15% Trypsin-EDTA for 3-5 min, at 37 °C, 5% CO2. Cells are neutralised with appropriate media containing 10% FBS and centrifuged for 5 min at 200 g. The cell pellet is resuspended at a concentration of 1 × 10⁶ cells per ml in serum free medium for Vybrant DiD labelling or in Hanks′ balanced salt solution (HBSS) for Vybrant CM-DiI. Five microliter cell-labeling solution is added per milliliter of cell suspension and incubated at 37 °C for 20 min (Vybrant DiD) or 5 min followed by 15 min on ice (Vybrant CM-DiI). Following the incubation, the cell suspension is centrifuged at 200 g for 5 min. The supernatant is discarded and the cell pellet is washed in PBS for three times. Labelled cancer cells are then resuspended at 1 × 10⁶ cells per ml in PBS for the following intra-cardiac or intravenous inoculations in immunocompromised mice (100 μl per mouse). The cell suspension should be kept on ice and filtered with 40 μm cell strainer prior injection to prevent clumping of cells that could cause embolisms.26
Note: Unlike DiD and DiI, CM-DiI is a DiI derivative and can be retained in cells throughout fixation, permeabilization and paraffin embedding procedure.
Frozen bone sample preparation
As previous studies suggested, breast cancer cells locate preferentially in long bones in murine models, tibias and femurs are therefore collected for ex vivo two-photon microscopy examination.20,27 Other bone samples (for example, ribs) can also be used for confocal/two-photon microscopy examination but extra care should be taken to maintain consistency of sample orientation while sectioning, which is important for comparison of different samples.
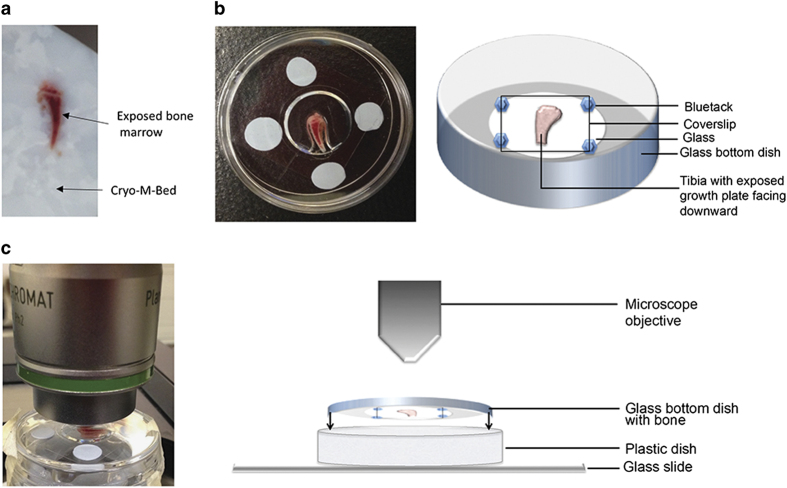
Immediately after animal euthanasia, long bones are dissected free of soft tissue and snap-frozen in liquid nitrogen. The frozen bones are then embedded in Bright Cryo-M-Bed (Bright Instrument Co Ltd, Huntingdon, UK) and frozen in sample blocks. The embedded tissue blocks are then trimmed longitudinally to expose bone marrow area using a Bright OTF Cryostat with a 3020 microtome (Bright Instrument Co Ltd; Figure 3a). The cutting angle of the blade is set to 22 degrees in order to obtain an even surface crucial to allow optimal imaging of the bone structure. However, the optimal setting of cutting angle could be various depend on different instruments. The bone is placed with the exposed marrow surface inside an uncoated, 35 mm glass bottom microwell dish (No. 0 coverslip, Glass thickness: 0.08–0.13 mm; MatTek Corporation, Ashland, TN, USA) and a coverslip is applied to keep it tightly attaching to the surface of glass bottom, using blu-tack or water resistant glue (Figure 3b). Using an upright two-photon microscope (Zeiss LSM510 NLO, Carl Zeiss In, Cambridge, UK) the glass bottom dish has to be placed upside down, with the exposed bone marrow surface facing upwards (Figure 3c). For long scans, ensure to keep the sample moist.
Figure 3.
Preparation of the specimen. (a) Long bones should be collected snap frozen and embedded in Bright Cryo-M-Bed and bone marrow exposed a Bright OTF Cryostat with a 3020 microtome. (b) The specimen is placed in a glass bottom dish with the exposed marrow surface facing downwards on the dish, specimen need to be hold in place with a coverslip, as shown in real and schematic. (c) Using an upright microscope the dish previously prepared should be placed facing upwards and onto a microscopy slide which hold it in place, as shown in real and schematic.
Note: Keeping similar orientations of samples in the blocks is strongly advised. For example, right tibias are placed in blocks with the right fibula facing the right side of the block and the opposite direction is used for the left limb.
Fixed/decalcified bone sample preparation
Extreme calcification causes opacity and hinders processing of bone tissue preventing its analysis by high-resolution optical imaging. Though extensive and long decalcification steps enable ergonomic tissue handling, these steps mask epitopes of antigens limiting the optimal immunohistochemical analysis. We have recently revised and improved the bone processing strategy, which involves short decalcification, and thick bone sectioning combined with high resolution confocal microscopy.12,13,14 Here, we report this advanced methodology in a stepwise manner that will provide a platform to close several major knowledge gaps and will therefore greatly facilitate future analyses focusing on the bone marrow.
In this procedure, freshly isolated bone tissue is fixed immediately using a 4% paraformaldehyde solution for 4 h at room temperature. The fixed bones are washed in PBS and subjected to short decalcification using 0.5 M EDTA solution for 24–48 h. Decalcified bones are washed thoroughly in PBS and incubated in cryoprotectant solution (20% sucrose and 2% Polyvinyl Pyrrolidone) for 24 h. Following cryoprotection, bones are suspended in gelatin based embedding solution for 30 min before being embedded and kept in an ultrafreezer for freezing. The embedding solution composed of 8% gelatin, 20% sucrose and 2% PVP works better than OCT in this protocol. The frozen samples are cut using a cryotome to get tissue sections of appropriate thickness. These cryosections can be further used for immunohistochemical studies to understand the bone marrow microenvironment. The comprehensive methodology from collecting fresh bone tissues to cryosectioning and immunostaining has been described previously.28
Imaging bone samples with confocal/two-photon microscopy
Basic microscope settings
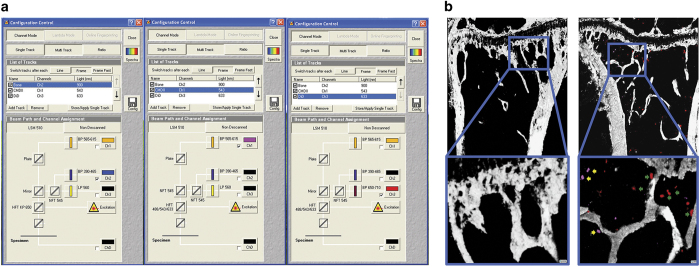
The bone structure can be visualised by SHG using a Chameleon laser at 900 nm (Coherent, Santa Clara, CA, USA), while Vybrant-DiD labelled cancer cells can be visualised using a 633 nm HeNe laser and Vybrant DiI/CM-DiI with a 543 nm HeNe laser. The configuration settings and beam paths for different channels are shown in Figure 4a. The SHG is detected with BP 390–465 (blue, pseudocoloured white in image Figure 4b), Vybrant-DiI/CM-DiI with BP 565–615 (orange/red, pseudocoloured pink in image Figure 4b) and Vybrant-DiD with BP 650–710 (far red, pseudocoloured red in image Figure 4b).
Figure 4.
Configuration settings to scan bone and tumour cells labelled with Vybrant DiD and CM-DiI. Beam paths for the different channels are shown in (a). The bone structure is visualised by second harmonic generation (SHG) using a Chameleon laser at 900 nm with a BP390-465 filter, while Vybrant DiD labelled cancer cells are visualised using a 633 nm HeNe laser with a BP 650–710 filter and Vybrant DiI/CM-DiI is visualised with a 543 nm HeNe laser with a BP 565–615 filter. (b) Mouse tibia scans in which only SHG signals are shown in the tibia of a non-tumour cell bearing mouse (left panel) while breast cancer cells labelled with Vybrant CM-DiI (yellow arrows) and Vybrant DiD (green arrows) are visible in the tibia of a tumour cell bearing mouse (right panel).
Note: As two-photon microscopy has the ability to excite multiple fluorescent markers with a single excitation wavelength, two-photon excitation can be set at 820 nm and multiple fluorescence can be detected using the following: BP 435–485 to detect blue (SHG), BP 500–550 to detect green (GFP), and BP 650–710 to detect far-red (DiD).23 However, this will increase the energy level of photon and hence higher risk of photobleaching.
Note: To rule out auto fluorescence and artefacts, a non-tumour cell bearing bone should be imaged as a blank control (Figure 4b). If available, a spectral fingerprinting should also be performed to confirm the identity of imaged cells.
Note: Two-photon work has potential hazard to the eyes depending on laser light wavelength and beam intensity. Damage to the retina can be caused by light within the wavelength range of 400–1400, nm, therefore safety goggles must be worn at all times during the procedure.
Visualisation of the specimen with transmitted light
Ensuring that the specimen is flat against the glass bottom dish is crucial for obtaining high quality image of the specimen. Transmitted light is used to visualise the specimen prior to the scanning with the two-photon laser, via ensuring even focus at all extremities of the specimen and clear vision of both borders of the growth plate.
Setting up the Z-stack
Once the focus on the specimen has been set using transmitted light, visualise the tissue with the Chameleon laser set at 900 nm. Adjust the focus up and down until the bone disappears from view to set a temporary upper and bottom boundaries, using the continuous scan function. Move the focal plane to the middle between the two boundaries and set as zero level where the bone should appear brightest. In the Z-stack setting panel (see Note), reset the upper and bottom boundaries depending on the desired depth of the Z-stack scan. For a Z-stack in depth of 70 μm, upper and bottom boundaries are set at 35 μm above and below the focal plane (zero level), respectively, with 2 μm interval between each scan levels.
Note: The depth of a Z-stack should be determined by the weakest laser used in the protocol. At 100% power, the 543 nm HeNe laser (for DiI/CM-DiI) could typically achieve acceptable image quality at depth of 70 μm, while 633 nm HeNe laser (for DiD) could reach 100 μm, when used for imaging bone specimens. Although two-photon excitation can in theory image at depths up to 1 mm,29 good quality image of bone structure can only be achieved up to 130 μm with SHG and the Chameleon laser at 900 nm.
Setting up a tile scan
Once satisfied with the z stack setting, move the position beacon to the middle of the specimen. A tile of 5 × 6 mosaics (an area of 2104 × 2525 μm) is required to cover the growth plate and the metaphysis region of a tibia. It is recommended to check the four corner of the tile to determine if the Z-stack boundaries are appropriate for the entire bone, adjusting the z settings if necessary. Reposition the beacon to the middle of the tile and focus at zero plane. The other lasers can then be switched on and a low resolution test tile scan could be run to check the settings and presence of tumour cells in the bone.
Note: It is strongly recommended to use low resolution scanning and maximal scanning speed during the set up stage, that is, using a frame size of 256 and a mean pixels depth of 1, to quicken this procedure and reduce the potential of photobleaching. Although two-photon microscopy has the general advantage of reduced photobleaching, high-order photobleaching is still observed within the focal volume.29
Imaging the bone
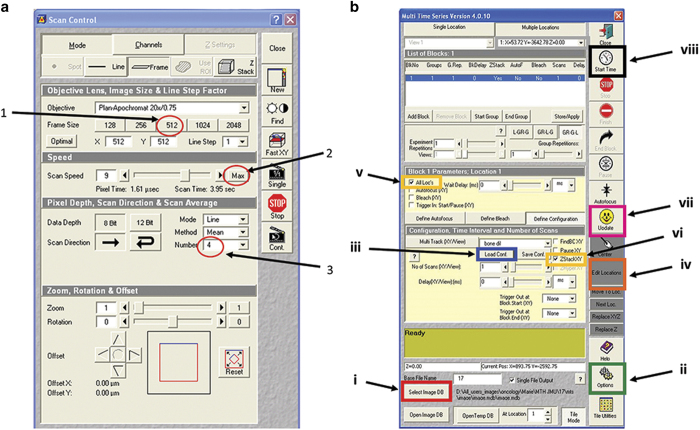
To achieve high quality image within the shortest time period, change the frame size to 512, mean pixel depth to 4 and use the maximum speed of scanning (Figure 5a). Prior to the beginning of the scan, correct settings and detailed configuration should be loaded in a Multi Time Series (MTS) software (Carl Zeiss, Jena, Germany). These include database to store temporary files and the reconstructed tile z-stack image, configuration of laser settings, depth and pixels of the scan, Z-stack and tile location. Principal steps and settings of MTS software are shown in Figure 5b. Typically, a scan of 2104 × 2525 μm for 70 μm depth using two lasers will take ∼3 h and 30 min, while using three lasers will take up to 6 h depending on the instrument.
Figure 5.
Control panel and example of Multi Time Series (MTS) software. (a) The optimal settings include (1) frame size of 512, (2) mean pixel depth at 4 and (3) use of the maximum speed of scanning. (b) MTS software and crucial steps: (i) Select the image database where to save the reconstructed image; (ii) Select the temporary database in Options; (iii) Load the previously saved configuration of laser settings, depth and pixels of the scan; (iv) Edit location and create a tile of 5 × 6; (v) Select ‘All locations'; (vi) Select ZstackXY'; (vii) Update all settings; (viii) Start the series.
Image analysis using Volocity 3D Image Analysis Software
Analysis of the 3D reconstructed, tile z-stack scans can be performed using a range of different software packages, such as the commercially available Volocity 3D Image Analysis (PerkinElmer, Cambridge, UK) or the free accessible ImageJ software (https://imagej.nih.gov/ij/).
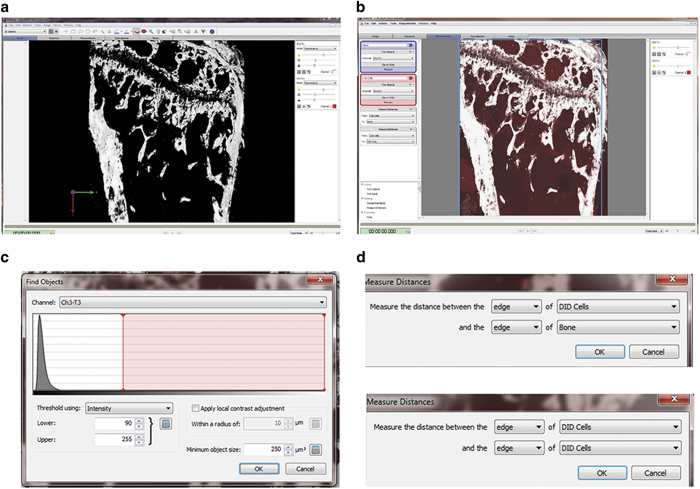
In this methodology, we use Volocity 3D Image Analysis Software to carry out 3D analysis of the scanned tibias. Under the ‘3D Opacity' mode, the software could be used to provide qualitative data via applying pseudocolour (that is, white colour for calcified bone tissue by SHG) and adjusting brightness and contrast for different channels (Figure 6a). Under ‘extended focus' model, the software could provide quantitative data, that is, quantifying objectives and measuring distances between objectives. Upon setting up the quantification protocol, the function ‘Find object' is used to identify bone and tumour cells. Objectives detected with 900 nm two-photon laser with a minimum size of 500 μm3 are considered as bone, while objectives detected by the 633 nm HeNe laser with a minimum size of 250 μm3 and intensity threshold between 90 and 255 are considered Vybrant-DiD labelled breast cancer cells (Figures 6b and c). Objectives are quantified within a defined region of interest and their distance to the nearest bone surface and to the nearest tumour cell is calculated using the ‘Measure distance' option of the software, in addition to the default measurements such as size and signal intensity of the objectives (Figure 6d). Finally, all the quantitative data can be exported as comma-separated values (CSV) file for further statistical analysis.
Figure 6.
Image analysis using Volocity 3D Image Analysis Software. (a) A 3D reconstruction image of tibia specimen after pseudocolour applied (white colour for calcified bone tissue by SHG) and brightness/contrast adjusted, under the ‘3D Opacity' mode. (b) Under the ‘extended focus' model, region of interest (ROI) can be selected with a free hand tool. (c) The function ‘Find object' is used to identify bone and tumour cells. The settings for identifying tumour cells labelled with DiD are objectives with a minimum size of 250 μm3 and intensity threshold between 90 and 255. (d) Distance from identified tumour cells to the nearest bone surface and to the nearest tumour cell can also be calculated, using the ‘Measure distance' option.
Discussion
In this manuscript, we have described step-by-step protocols to be used in confocal and two-photon microscopy in cancer bone metastasis research using mouse models.
This method holds a number of advantages over other available techniques for bone imaging. These advantages include: (1) The method generates high-resolution 3D image of the bone microenvironment to understand the spatial and temporal arrangement of multiple cell types within the bone tissue. (2) The thick tissue sections maintain intact structure and cellular morphology, which is essential to understand phenotypic changes in bone structure in genetic studies. (3) The high quality reproducible images generated using this protocol can be used for quantification studies as the method shows low levels of background while maintaining optimal tissue and cellular morphology.
In addition to the techniques related to confocal and two-photon microscopy, good fluorescent labelling techniques are equally important for high quality imaging. It is important to choose the right labelling dyes appropriate to the nature of samples and equipment of laser sources. A panel of the most commonly used fluorescent markers for bone research using confocal and two-photon microscopy are listed in Table 1. This will facilitate the readers to decide the choice in usage of confocal or two-photon microscopy, together with considering beneficial factors such as lower photon toxicity and multi-fluorescence excitation by two-photon microscopy. However, deeper penetration depth by two-photon, widely accepted as sixfold deeper than confocal microscopy using the same sample and fluorophores,29 will not be achieved in thick bone specimens due to their dense nature. In our practice, penetration depth below 150 μm by two-photon laser and SHG could provide optimal images for bone structure, which is not significantly superior to the maximum depth (∼100 μm) that confocal microscopy could achieve.
Table 1. Spectra of commonly used fluorescent markers for bone research using confocal and two-photon microscopy.
| Two-photon excitation (nm) | Confocal excitation (nm) | Emission (nm) | |
|---|---|---|---|
| eBFP | 780 | 380 | 440 |
| eCFP | 860–920 | 433 | 475 |
| eGFP | 880–930 | 488 | 509 |
| tdTomato | 900–1000 | 554 | 581 |
| DsRed | 930–990 | 557 | 592 |
| mCherry | 900–1000 | 587 | 610 |
| FITC | 780–800 | 494 | 520 |
| Texas red | 780–920 | 595 | 615 |
| Hoechst | 780 | 350 | 461 |
| DAPI | 700 | 358 | 461 |
| DiI | 700 | 549 | 565 |
| DiD | 780–820 | 644 | 665 |
| DiO | 780–830 | 484 | 501 |
| Alizarin complexone | 900 | 530–560 | 580 |
| Calcein | 780–900 | 495 | 515 |
| Tetracycline | 800 | 390 | 550 |
| Bone collagen (SHG) | 820–900 | NA | 450 |
Abbreviations; eBFP, enhanced blue fluorescent protein; eCFP, enhanced cyan fluorescent protein; eGFP, enhanced green fluorescent protein; FITC, fluorescein isothiocyanate; SHG, second-harmonic signal.
Although using confocal/two-photon microscopy to carry out static ex vivo imaging is highly advantageous, it has to be used in combination with other advanced techniques such as micro-CT, PET and so on to better understand the bone structure. This procedure does not provide dynamic data, which limits our understanding of dynamic processes in bone. However, with the advance of in vivo two-photon microscopy, live imaging the dynamic process of the engraftment of tumour cells into skeletons is not out of reach any more. Lo Celso and Sipkins et al. 30,31,32 have successfully established protocols to tracking of individual haematopoietic stem cells in mouse calvarium bone marrow. Lawson et al.23 also described such a method using two-photon microscopy to imaging tumour cell engraftment in real time within intact tibia of live mice. Other limitations associated with using this procedure are: (1) Using fluorescent lipophilic dyes could induce microenvironment contamination which possibly occurs via trogocytosis or diffusible microparticles.33 Therefore, optimization of the labelling procedures and drastic cross validation via different approaches should be adopted to avoid results misinterpretation. (2) The procedure is unsuitable for quantifying secretory or chemokines in bone. (3) As the procedure involves imaging of thick tissue sections, it is necessary to analyze serial sections and number of samples to verify the phenotypic changes in bone structure. (4) The procedure costs are higher than other techniques due to the high purchase costs of appropriate laser sources and high running costs for longer scanning time.
In conclusion, confocal/two-photon microscopy is a powerful research tool for studying cellular interactions and microstructures in murine bone models. Understanding working principle, background, advantages and limitations of this technique, could help users to adjust and improve their own protocol for applying confocal/two-photon microscopy to cancer bone metastasis research, using our methodology as a reference.
Acknowledgments
This article is supported by the IBMS-ECTS Young Investigators. We thank Professor Ingunn Holen and Ms Anne Fowles for critical reading of this manuscript and insightful scientific discussion. We also thank the technical support from Dr Colin Gray of Light Microscopy Core Facility, The University of Sheffield.
Footnotes
The authors declare no conflict of interest.
References
- Minsky M. Memoir on inventing the confocal scanning microscope. Scanning 1988; 10: 128–138. [Google Scholar]
- Lee K, Yeung H. Application of laser scanning confocal microscopy in musculoskeletal research. In: Qin L, Genant HK, Griffith JF, Leung KS (eds).Advanced Bioimaging Technologies in Assessment of the Quality of Bone and Scaffold Materials Springer: Berlin, Heidelberg, 2007; pp173–189. [Google Scholar]
- Boyde A, Hendel P, Hendel R, Maconnachie E, Jones SJ. Human cranial bone structure and the healing of cranial bone grafts: a study using backscattered electron imaging and confocal microscopy. Anat Embryol (Berl) 1990; 181: 235–251. [DOI] [PubMed] [Google Scholar]
- Fazzalari NL, Forwood MR, Manthey BA, Smith K, Kolesik P. Three-dimensional confocal images of microdamage in cancellous bone. Bone 1998; 23: 373–378. [DOI] [PubMed] [Google Scholar]
- O'Brien FJ, Taylor D, Dickson GR, Lee TC. Visualisation of three-dimensional microcracks in compact bone. J Anat 2000; 197: (Pt 3): 413–420. [DOI] [PMC free article] [PubMed] [Google Scholar]
- Zarrinkalam KH, Kuliwaba JS, Martin RB, Wallwork MA, Fazzalari NL. New insights into the propagation of fatigue damage in cortical bone using confocal microscopy and chelating fluorochromes. Eur J Morphol 2005; 42: 81–90. [DOI] [PubMed] [Google Scholar]
- Kamioka H, Honjo T, Takano-Yamamoto T. A three-dimensional distribution of osteocyte processes revealed by the combination of confocal laser scanning microscopy and differential interference contrast microscopy. Bone 2001; 28: 145–149. [DOI] [PubMed] [Google Scholar]
- Nesbitt SA, Horton MA. Fluorescence imaging of bone-resorbing osteoclasts by confocal microscopy. Methods Mol Med 2003; 80: 259–281. [DOI] [PubMed] [Google Scholar]
- Ramires PA, Giuffrida A, Milella E. Three-dimensional reconstruction of confocal laser microscopy images to study the behaviour of osteoblastic cells grown on biomaterials. Biomaterials 2002; 23: 397–406. [DOI] [PubMed] [Google Scholar]
- Sugawara Y, Kamioka H, Honjo T, Tezuka K, Takano-Yamamoto T. Three-dimensional reconstruction of chick calvarial osteocytes and their cell processes using confocal microscopy. Bone 2005; 36: 877–883. [DOI] [PubMed] [Google Scholar]
- Akkiraju H, Bonor J, Nohe A. An improved immunostaining and imaging methodology to determine cell and protein distributions within the bone environment. J Histochem Cytochem 2016; 64: 168–178. [DOI] [PMC free article] [PubMed] [Google Scholar]
- Kusumbe AP, Ramasamy SK, Adams RH. Coupling of angiogenesis and osteogenesis by a specific vessel subtype in bone. Nature 2014; 507: 323–328. [DOI] [PMC free article] [PubMed] [Google Scholar]
- Ramasamy SK, Kusumbe AP, Wang L, Adams RH. Endothelial Notch activity promotes angiogenesis and osteogenesis in bone. Nature 2014; 507: 376–380. [DOI] [PMC free article] [PubMed] [Google Scholar]
- Kusumbe AP, Ramasamy SK, Itkin T, Mae MA, Langen UH, Betsholtz C et al. Age-dependent modulation of vascular niches for haematopoietic stem cells. Nature 2016; 532: 380–384. [DOI] [PMC free article] [PubMed] [Google Scholar]
- Kaiser W, Garrett CGB. Two-photon excitation in CaF2:Eu2+. Phys Rev Lett 1961; 7: 229–231. [Google Scholar]
- Kawakami N, Flugel A. Knocking at the brain's door: intravital two-photon imaging of autoreactive T cell interactions with CNS structures. Semin Immunopathol 2010; 32: 275–287. [DOI] [PMC free article] [PubMed] [Google Scholar]
- Malide D, Metais JY, Dunbar CE. Dynamic clonal analysis of murine hematopoietic stem and progenitor cells marked by 5 fluorescent proteins using confocal and multiphoton microscopy. Blood 2012; 120: e105–e116. [DOI] [PMC free article] [PubMed] [Google Scholar]
- Sano H, Kikuta J, Furuya M, Kondo N, Endo N, Ishii M. Intravital bone imaging by two-photon excitation microscopy to identify osteocytic osteolysis in vivo. Bone 2015; 74: 134–139. [DOI] [PubMed] [Google Scholar]
- Xie Y, Yin T, Wiegraebe W, He XC, Miller D, Stark D et al. Detection of functional haematopoietic stem cell niche using real-time imaging. Nature 2009; 457: 97–101. [DOI] [PubMed] [Google Scholar]
- Wang N, Docherty FE, Brown HK, Reeves KJ, Fowles AC, Ottewell PD et al. Prostate cancer cells preferentially home to osteoblast-rich areas in the early stages of bone metastasis: evidence from in vivo models. J Bone Miner Res 2014; 29: 2688–2696. [DOI] [PubMed] [Google Scholar]
- Wang N, Reeves KJ, Brown HK, Fowles AC, Docherty FE, Ottewell PD et al. The frequency of osteolytic bone metastasis is determined by conditions of the soil, not the number of seeds; evidence from in vivo models of breast and prostate cancer. J Exp Clin Cancer Res 2015; 34: 124. [DOI] [PMC free article] [PubMed] [Google Scholar]
- Wang N, Docherty F, Brown HK, Reeves K, Fowles A, Lawson M et al. Mitotic quiescence, but not unique ‘stemness,' marks the phenotype of bone metastasis-initiating cells in prostate cancer. FASEB J 2015; 29: 3141–3150. [DOI] [PubMed] [Google Scholar]
- Lawson MA, McDonald MM, Kovacic N, Hua Khoo W, Terry RL, Down J et al. Osteoclasts control reactivation of dormant myeloma cells by remodelling the endosteal niche. Nat Commun 2015; 6: 8983. [DOI] [PMC free article] [PubMed] [Google Scholar]
- Price TT, Burness ML, Sivan A, Warner MJ, Cheng R, Lee CH et al. Dormant breast cancer micrometastases reside in specific bone marrow niches that regulate their transit to and from bone. Sci Transl Med 2016; 8: 340ra73. [DOI] [PMC free article] [PubMed] [Google Scholar]
- Pece S, Tosoni D, Confalonieri S, Mazzarol G, Vecchi M, Ronzoni S et al. Biological and molecular heterogeneity of breast cancers correlates with their cancer stem cell content. Cell 2010; 140: 62–73. [DOI] [PubMed] [Google Scholar]
- Dai J, Hensel J, Wang N, Kruithof-de Julio M, Shiozawa Y. Mouse models for studying prostate cancer bone metastasis. BoneKEy Rep 2016; 5: 777. [DOI] [PMC free article] [PubMed] [Google Scholar]
- Ottewell PD, Wang N, Brown HK, Reeves KJ, Fowles CA, Croucher PI et al. Zoledronic acid has differential antitumor activity in the pre- and postmenopausal bone microenvironment in vivo. Clin Cancer Res 2014; 20: 2922–2932. [DOI] [PMC free article] [PubMed] [Google Scholar]
- Kusumbe AP, Ramasamy SK, Starsichova A, Adams RH. Sample preparation for high-resolution 3D confocal imaging of mouse skeletal tissue. Nat Protoc 2015; 10: 1904–1914. [DOI] [PubMed] [Google Scholar]
- Ustione A, Piston DW. A simple introduction to multiphoton microscopy. J Microsc 2011; 243: 221–226. [DOI] [PubMed] [Google Scholar]
- Lo Celso C, Fleming HE, Wu JW, Zhao CX, Miake-Lye S, Fujisaki J et al. Live-animal tracking of individual haematopoietic stem/progenitor cells in their niche. Nature 2009; 457: 92–96. [DOI] [PMC free article] [PubMed] [Google Scholar]
- Lo Celso C, Lin CP, Scadden DT. In vivo imaging of transplanted hematopoietic stem and progenitor cells in mouse calvarium bone marrow. Nat Protoc 2011; 6: 1–14. [DOI] [PMC free article] [PubMed] [Google Scholar]
- Sipkins DA, Wei X, Wu JW, Runnels JM, Cote D, Means TK et al. In vivo imaging of specialized bone marrow endothelial microdomains for tumour engraftment. Nature 2005; 435: 969–973. [DOI] [PMC free article] [PubMed] [Google Scholar]
- Lassailly F, Griessinger E, Bonnet D. ‘Microenvironmental contaminations' induced by fluorescent lipophilic dyes used for noninvasive in vitro and in vivo cell tracking. Blood 2010; 115: 5347–5354. [DOI] [PubMed] [Google Scholar]


