

Abstract
We introduce a new method to multiplex the throughput of samples for targeted mass spectrometry analysis. The current paradigm for obtaining absolute quantification from biological samples requires spiking isotopically heavy peptide standards into light biological lysates. Because each lysate must be run individually, this method places limitations on sample throughput and high demands on instrument time. When cell lines are first metabolically labeled with various neutron-encoded (NeuCode) lysine isotopologues possessing mDa mass differences from each other, heavy cell lysates may be mixed and spiked with an additional heavy peptide as an internal standard. We demonstrate that these NeuCode lysate peptides may be co-isolated with their internal standards, fragmented, and analyzed together using high resolving power parallel reaction monitoring (PRM). Instead of running each sample individually, these methods allow samples to be multiplexed to obtain absolute concentrations of target peptides in 5, 15, and even 25 biological samples at a time during single mass spectrometry experiments.
Introduction
Targeted mass spectrometry methods are the gold standard approach for measuring the absolute abundance of specific proteins with high reproducibility and sensitivity.1–5 Triple quadrupole (QqQ) mass spectrometers utilizing the selected reaction monitoring (SRM) strategy are the most widespread instrument platforms for such analyses. In this format, isolation and collisional dissociation of targeted peptide precursor ions are followed by sequential detection of two to five product ions (i.e., transitions).6 Because this approach offers high sensitivity, reproducibility, and the ability to collect absolute abundance information through the use of isotopically labeled standards, it has become increasingly important and widespread.7–10
Transition selection and method development, however, limit the conventional SRM method. The mass spectrometer must be instructed when to look for each target during the chromatographic elution period for each analyte in order to attain sufficient depth.11–13 During that time the system cycles through the various product ion transitions and collects the desired information.14 Besides scheduling when to target each analyte, the analyst must also determine the best transitions to monitor, being mindful of both signal strength and isobaric interferences from the background.15,16 We recently proposed an alternative strategy for targeted proteomics that leverages high resolution and accurate mass measurement.17 Today hybrid MS systems that replace the third quadrupole of QqQ systems with either Orbitrap or time-of-flight (TOF) analyzers are commonplace.18–20 On such devices one can rapidly collect a high resolution MS/MS scan so that all precursor-to-product transitions are easily monitored together, thereby alleviating the rigor typically required to set up a traditional SRM experiment. We have named this method parallel reaction monitoring (PRM), and we and others have demonstrated its comparable figures of merit to SRM.17,21,22
PRM scanning has many benefits, including reduced energy for targeted analysis, and it can be performed on the same MS systems employed in discovery efforts.23 That said, both SRM and PRM suffer from limited throughput and neither is routinely adapted to the multiplexing techniques that have rapidly accelerated the discovery proteomics landscape.24–26 Attempts have been made to scale up sample throughput for targeted mass spectrometry experiments using chemical labeling strategies, with varying degrees of success.27–31 We reasoned that the high resolution MS/MS scanning utilized by PRM could afford new opportunities for higher throughput targeted MS analysis.32 A prime example, the seamless integration of PRM with our recently introduced neutron-encoded stable isotope labeling strategy (i.e., NeuCode SILAC) could offer highly plexed absolute quantification.33 With these isotopologues we can generate NeuCode-labeled peptide mixtures having up to 30 plexes and m/z peaks spaced as few as six mDa apart.34–42 Following collisional activation, all y-type product ions containing a lysine will reveal the quantity of the targeted peptide upon high resolution PRM analysis. Dedication of some of these NeuCode channels to synthetic peptide standards affords absolute quantification for 6, 18, and even 30-plex targeted analyses.
Here we describe a new approach to achieve multi-plexed, targeted proteome analysis through the combination of PRM and NeuCode labeling. First, using a six-plex NeuCode PRM method, we assess numerous figures of merit, including limit-of-detection (LOD), dynamic range, and quantitative accuracy. Next, we describe an approach to expand the NeuCode PRM method to allow 18-plex absolute quantification, and we demonstrate its utility for analysis of virus protein content following infection of a prostate cancer (PC-3) cell line with vesicular stomatitis virus.43,44 Finally, we push the technique even further and provide preliminary data showing the expansion of the method for 30-plex targeted analysis.
Experimental Procedures
NeuCode SILAC Cell Culture
Human prostate cancer (PC-3) cells were cultured in RPMI media (Cambridge Isotopes) supplemented with 10% dialyzed FBS, arginine, and K080 lysine (+8.0502 Da) (Cambridge Isotopes). Cells were passaged 8 times over the course of 4 weeks. 1 × 10⁶ cells were lysed and prepared for mass spectrometry analysis. A data-dependent top-10 method confirmed the successful global incorporation of NeuCode lysines using an Orbitrap elite mass spectrometer.
Vesicular Stomatitis Virus Infections, Fluorescence, and Western Blots
Human PC-3 human prostate cancer cells were grown in lysine-deficient RPMI 1640 media (Thermo Scientific) supplemented with 10% dialyzed FBS (Thermo Scientific) and K422, K521, K341, K440, or K080. PC-3 cells were grown through 10 passages and analyzed by mass spectrometry to ensure complete lysine incorporation. PC-3 cells from each NeuCode channel were plated onto six-well plates at a concentration of 1 × 10⁶ cells per well in RPMI media supplemented with 2% dialyzed FBS and the appropriate lysine isotopologue, such that consecutive infection timepoints were collected from cells grown in successive lysine isotopologues. Infections were carried out using wild-type VSV-N1, mutant VSV-M51R, or VSV N1-dsRedExpress, a VSV reporter strain expressing a red fluorescent protein (RFP) reporter of viral protein translation.43 Virus was added to wells at a multiplicity-of-infection (MOI) 50 (50 virions/cell) at infection timepoints, incubated for 30 minutes, and washed with 1 mL 2% FBS SILAC media. At each time point infected cell samples were lysed using a solution of 8 M urea, 50 mM Tris, pH 8.0, 5 mM CaCl2, and protease inhibitor tablet (Roche). RFP fluorescence measurements were collected during the infection time-course from cells plated at an identical concentration, infected with VSV N1-dsRedExpress at an MOI of 50, and analyzed using a Typhoon fluorescence scanner, 650 V PMT, and 200 μm resolution, and quantified using JEX software as previously described (ADD CITATION PMID 25938799). VSV protein standards were created by recombinant expression in E. coli. pET-based expression plasmids for VSV-P and VSV-M were provided by Ming Luo (University of Alabama-Birmingham), and recombinant protein was expressed, purified as previously described (ADD CITATION PMID 11000221), and used in quantitative western blots(WB). VSV-P was additionally used to produce a custom anti-VSV-P polyclonal antibody in rabbits (Abgent). Lysed cellular extracts were thawed and protein content measured by BCA assay (Pierce). Samples were diluted to equal concentrations, 4x denaturing loading buffer with β-mercaptoethanol added (Licor) and samples were boiled for 5 minutes to denature proteins. 20μl of sample containing 4 μg total protein was loaded per lane of a 10% polyacrylamide gel (SmartGel, Amresco) and PrecisionPlus Protein Dual Xtra protein standards (BioRad) were used. A 7-point standard curve to relate WB band intensity to absolute protein concentration was created by serial 1:2 dilutions of purified recombinant VSV-M and VSV-P and loaded starting at a concentration of 0.5 ug/lane. Quadruplicate gels were run at 120V for 90 minutes in SmartGel running buffer (Amresco). Proteins were transferred to PVDF membranes using a BioRad Semi-Dry transfer apparatus at 15 V for 30 minutes. Membranes were blocked in TBST with 5% BSA for 3 hours at 4°C. Membranes were then incubated at room temperature for 4 hr in the following antibodies diluted in 3% BSA/TBST: rabbit polyclonal anti-VSV-P (described above, 1:15000 dilution), mouse monoclonal anti-β-actin (Sigma, clone AC-15, 1:2000), and mouse monoclonal anti-VSV-M (clone 23H12, hybridoma provided by Douglas Lyles ADD CITATION PMID 18638751) Membranes were rinsed 3× with TBST, and a solution of blocking buffer (Licor) with 1:15000 dilution of Licor donkey anti-mouse 800 nm and 1:20,000 dilution goat anti-rabbit 680 nm fluorescent antibodies was added and incubated 1 hour. Membranes were again rinsed 3x, and imaged on a Licor Odyssey infrared membrane scanner. Band intensities were quantified using ImageJ software. Integrated band intensities in each lane were normalized to the corresponding β-actin loading control and then averaged across the four replicate gels. Absolute protein concentrations were calculated from intensity values by interpolation of the standard curve.
Identifying Vesicular Stomatitis Virus Peptides for PRM
PC-3 cells were infected with VSV-N1 or VSV-M51R at MOI 50 and lysed 12 hours post-infection (hpi). Following preparation for mass spectrometry, samples were subjected to data-dependent top-10 acquisition (DDA). Peptides were separated over a 120 minute nLC gradient from 98% solvent A (0.2% formic acid) and 2% solvent B (0.2% formic acid in acetonitrile) to 30% solvent A and 70% solvent B over the course of 100 minutes and followed by a 20 minute column re-equilibration. The most abundant and reproducible peptide-spectral matches (PSMs) obtained from DDA were identified, and those peptides were synthesized commercially as AQUA QuantPro™ standards with C-terminal K602 lysines (+8.0412 Da) (Thermo Pierce). Thermo .raw files were converted to text files using the Coon OMSSA Proteomic Analysis Software Suite (COMPASS) and searched using the Open source Mass Spectrometry Search Algorithm (OMSSA). Methionine oxidation was searched as a variable modification, and cysteine carbamidomethylation was searched as a fixed modification. Precursor mass tolerance was defined as 5 Da and fragment ion tolerance was set to 0.01 Da. Search results were filtered to 1% FDR according to E-values.
Sample preparation
Lysate protein concentrations were determined by protein BCA assay (Pierce). Cell lysate proteins were reduced with 5 mM dithiothreitol at ambient temperature for 30 minutes, alkylated with 15 mM iodoacetamide in the dark at ambient temperature for 30 minutes, and quenched with 5 mM dithiothreitol. The 5 synthetic K602 peptide standards were dosed into each cell lysates from a stock solution (384 fmol/μl). Additional N and M K602 standards dosed for later infection timepoints (2.3 and 1.6 pmol, respectively). A solution of 50 mM Tris (pH 8.0) and 5 mM CaCl2 was used to dilute the urea to a 1.5 M concentration. Proteins were digested with LysC (1:200 enzyme:protein ratio) and trypsin (1:50 enzyme:protein ratio) at 37°C for 15 hours. The digestion was quenched with TFA and desalted with a tC18 sep-pak (Waters). Samples were resuspended to a concentration of 1 μg/μl in 0.2% formic acid.
Duplex and 6-plex LC-MS/MS
2 μg of peptides were loaded onto a 75 μm capillary packed with 5 μm Magic C18 (Michrome) or 1.7 μm Bridged Ethylene Hybrid C18 (Waters) particles in mobile phase A (0.2% formic acid in water). 6.6 fmol–2.3 pmol of peptide standards were injected on-column, depending on the K602 peptide and the infection timepoint being analyzed. Peptides were eluted during a 90-minute gradient of mobile phase B (0.2% formic acid in acetonitrile). Eluting peptides were analyzed with an Orbitrap elite mass spectrometer. A preliminary DDA run of a mixture of the K602 standards was used to identify the retention times and charge states of the K602 peptide standards and NeuCode viral peptides. Once all 5 K602 standards were identified, retention time scheduling was used to ensure that each peptide pair was targeted for PRM across both peptides’ elution profiles. Survey scans were collected with the Orbitrap at 30,000 resolving power to ensure that the K602-K080 peptides were observed as a single precursor for tandem MS sampling. Prior to MS/MS, an additional MS1 scan at 480,000 resolving power was collected to confirm the presence of NeuCode peptides. Each eluting NeuCode set was co-isolated and analyzed by MS/MS according to the peptides’ previously scheduled retention times. Tandem mass spectra were collected in profile mode and were generated by HCD in the Orbitrap at 120,000 resolving power for duplex PRM and 480,000 resolving power for 6-plex PRM. MS1 and MS/MS target ion accumulation values were set to 1 × 10⁶ and 4 × 10⁵, respectively, and normalized collision energies were set at 30.
NeuCode PRM Limit-of-Detection
PC-3 cells were labeled to completion with K080, infected with VSV, and harvested at seven hours post-infection. Synthetic peptide standards were spiked at known concentrations for each of the viral proteins (N = 6.4 μM, P = 0.33 μM, M = 4.7 μM, G = 1.5 μM, L = 0.013 μM), and the single infection lysate was prepared for MS. The sample was diluted in a background of tryptic yeast peptides to establish a limit-of-detection of the NeuCode K602 and K080 partners in a complex matrix. The K602 synthetic peptide standards were dosed at a 1:1 ratio to closely match the concentration of K080 peptides. The infection lysate was then diluted at ratios of 50:50, 1:10, 1:50, 1:100, 1:500, and 1:1,000. Each mixture was analyzed using a targeted MS method to co-isolate and fragment viral peptide targets at a collision energy of 30. Fragments were analyzed with 120,000 resolving power MS/MS scans. S/N ratios were calculated for the ion chromatograms obtained for each NeuCode doublet (resulting from each viral peptide).
NeuCode PRM Dynamic Range
Saccharomyces cerevisiae strain BY4742 was grown in defined, synthetic dropout (SC-lys, Sunrise Science) media supplemented with one of the eight NeuCode lysines. Cells were grown for a minimum of ten doublings at 30°C to ensure complete lysine incorporation. Cells were harvested at mid log phase using centrifugation at 3,000 rpm for 3 min, washed with chilled ddH2O, flash frozen in liquid nitrogen, and stored at −80°C until use. The total amount of NeuCode yeast protein from each culture was determined using a protein BCA assay (Thermo Scientific) and the proteins were mixed in a known ratio of 1:10:10:100:100:1000 (K602 : K422 : K521 : K341 : K440 : K080) to produce a single pooled sample which was prepared for MS. Nine previously optimized yeast target peptides in this pooled sample were analyzed by PRM during 100 min nLC-MS/MS experiments. Target MS/MS spectra containing NeuCode peptide fragments were analyzed at 480,000 resolving power, and the average transition intensities for each peptide target’s 6-plex fragments were plotted to observe the dynamic range and linearity of the mixed ratios.
18-plex LC-MS/MS
Sets of 5 infection timepoint lysates corresponding to the K422 through K080 PC-3 cell lines (0–8 hpi, 10–21 hpi, and 24–36 hpi) were pooled and prepared for mass spectrometry. 80 fmol of AQUA peptide ILAFLGSSNLK602 originating from the VSV matrix(M) protein (QuantPro™ grade, Thermo Scientific) was spiked into each of the three pooled samples of NeuCode lysates. The urea concentration in each sample was diluted to 4 M with 50 mM Tris, pH 8.0, and 5 mM CaCl2. Proteolytic digestion was performed by addition of Lys-C (Wako) at a 1:200 enzyme-to-protein ratio and incubation at ambient temperature for 2 h. Samples were incubated with trypsin (Promega) at a 1:50 enzyme-to-protein ratio at ambient temperature for 18 h. The digestion reaction was quenched by addition of TFA and then desalted with tC18 Sep-Pak cartridges (Waters). The desalted peptides from the three pooled samples were dimethyl labeled (3-plex) using formaldehyde (CH2O, CD2O, or 13CD2O) and NaCNBH3 or NaCNBD3. The resultant light (+28.0313 Da, 0–8 hpi), medium (+32.0564 Da, 10–21 hpi), and heavy (+36.0757 Da, 24–36 hpi) chemically labeled timepoints were mixed 1:1:1 and analyzed by targeted mass spectrometry. Targeted acquisition of dimethylated peptides was performed using a wide 20 m/z isolation window centered on the central dimethylated peptide channel. Co-isolated peptides were fragmented by HCD and analyzed with 480,000 resolving power MS/MS scans.
30-plex LC-MS/MS
Sets of 5 infection timepoint lysates corresponding to the K422 through K080 PC-3 cell lines (N1 timepoints 6–10, M51R timepoints 6–10, technical replicates of N1 timepoints 6–10, M51R timepoints 1–5, and N1 timepoints 1–5) were 5-plex dimethyl labeled using formaldehyde (CH2O, CD2O, or 13CD2O). Either NaCNBH3 or NaCNBD3 were used as reducing reagents. Each labeling reaction was quenched using 1% NH4OH and re-acidified and desalted using a tC18 sep-pak (Waters). Filtered lysate peptides were resuspended and mixed in a 1:1:1:1:1 ratio. Targeted acquisition of dimethylated peptides was performed using a wide 20 m/z isolation window centered on the central dimethylated peptide channel. Co-isolated peptides were fragmented by HCD and analyzed with 480,000 resolving power MS/MS scans.
Results and Discussion
NeuCode Duplex PRM
To test the overall concept of NeuCode PRM, we labeled human prostate cancer (PC-3) cells with a single isotopologue of lysine (K080). The labeled PC-3 cells were then infected with wild-type vesicular stomatitis virus (VSV), lysed 7 hours post-infection, and spiked with 15 fmol of the synthetic peptide standard, SNYFAYETGGK602, a proxy for the viral glycoprotein (G protein, Figure 1A). In this fashion, the endogenous and synthetic peptide pair is separated by 36 mDa and y-type product ions are distinguished in MS/MS scans collected at sufficient resolving power. Targeted analysis of this sample, using 120,000 resolving power MS/MS scans, produced the spectra shown in Figure 1B. Note each detected y-type product ion doublet was resolved, allowing extraction of ion chromatograms (XIC) for each version of the target peptide. These integrated XICs (Figure 1C) reveal that 86 fmol of the VSV glycoprotein (G protein) had been translated in the first 7 hours of infection. We repeated this process using four other synthetic peptides each targeting a different viral protein and achieved similar results, with resolution of singly charged y-type product ions up to 1,043 m/z experimentally confirming theoretical calculations (1,039 m/z max). Finally, percent relative standard deviations (% RSDs) for triplicate injections ranged from 2–20%, consistent with traditional SRM (2–10%) and PRM (3–18%).22
Figure 1.
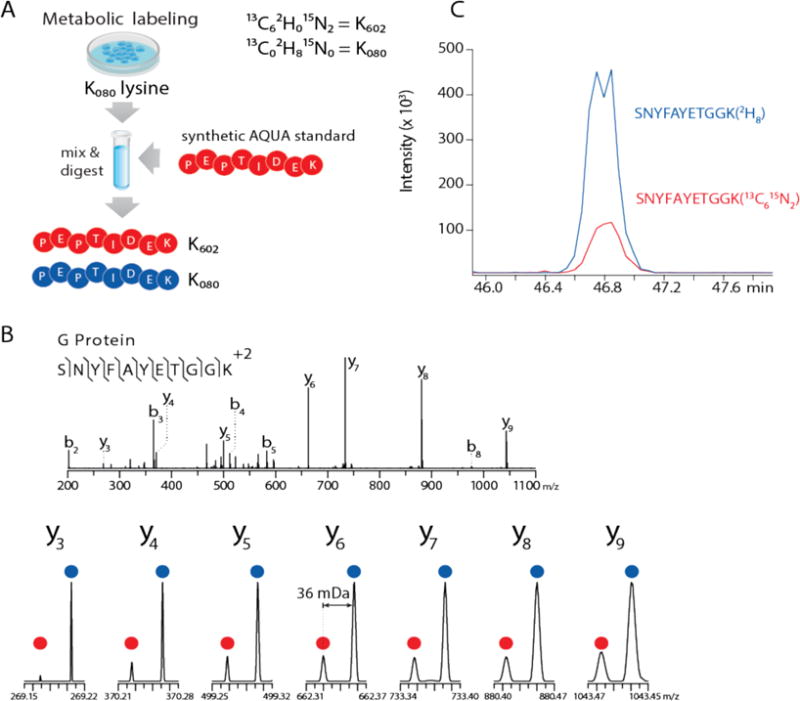
Duplex NeuCode Quantitation. (A) Scheme for preparing samples for NeuCode duplex PRM. Cells were metabolically labeled in K080 supplemented media, infected with vesicular stomatitis virus, lysed, and mixed with a K602 peptide standard. (B) K602 standards and their matching K080 peptides are co-isolated, fragmented, and appear as 36 mDa spaced doublets in 120,000 resolving power MS/MS scans. Duplex NeuCode samples were analyzed using an Orbitrap Elite mass spectrometer. (C) Extracted ion chromatograms (XIC) were prepared for K602 and K080 pairs and integrated to obtain absolute peptide concentrations from the infection timepoint.
NeuCode 6-Plex PRM
Modern Orbitrap and FT-ICR analyzers can deliver very high resolving power MS/MS scans, up to 480,000 available on current commercial Orbitrap platforms.45 Higher resolving powers, of course, permit more closely spaced NeuCode labels and, hence, increased multi-plexing. Recently, we described the synthesis and use of six lysine isotopologues all having the same nominal mass, but spaced by ~ 6 mDa.36,46 Using a theoretical Orbitrap resolving power of 480,000, we estimate that all singly charged y-type product ions can be distinguished at this spacing up to 925 m/z. From these calculations, we conclude that NeuCode PRM methodology has considerable promise to offer multi-plexed, targeted capability.
To test this concept, we sought to monitor absolute abundances of the entire VSV viral proteome (five proteins) following infection. Each of five PC-3 cultures was labeled with a unique NeuCode lysine isotopologue (K422, K521, K341, K440, or K080, Figure 2A). These cells were infected with VSV-N1 (50 virions/cell) and lysed at 1, 3, 5, 8, and 12 hours post-infection. A second set of labeled cells was harvested at 15, 18, 24, 36, and 48 hours post-infection. Each set of five cell lysates was pooled and spiked with a set of five standard peptides (between 100 fmol to 5 pmol for each viral protein, Supplementary Table 1), each containing a K602 label at the C-terminus. Using a PRM method with 480,000 resolving power MS/MS scans, we targeted the five surrogate peptides over a single nLC-MS/MS gradient. Figure 2B and 2C present exemplary data resulting from these experiments. As closely predicted by our theoretical calculations, all NeuCode signatures present in the y-type product ions up to 925 m/z are resolved and thus quantifiable. In this example, we successfully monitored seven unique y-type products, each exhibiting six unique m/z peaks, for a total of 42 transitions monitored in a single MS/MS scan. For each of the five target peptides we could detect and resolve at least six y-type product ions per virus peptide with signal-to-noise (S/N) > 10.
Figure 2.
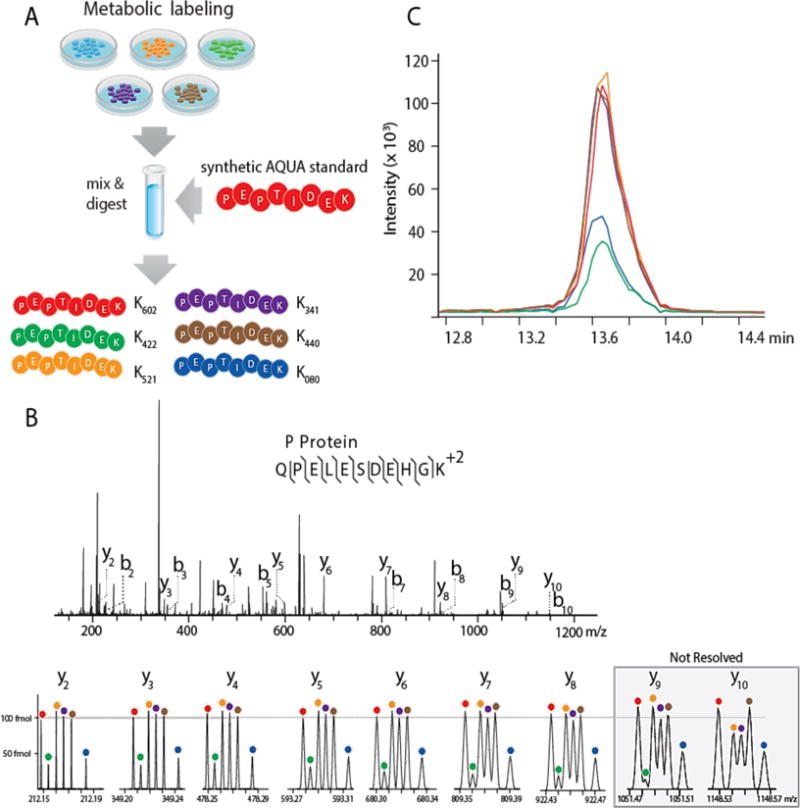
6-plex NeuCode Quantitation. (A) Scheme for preparing samples for NeuCode 6-plex PRM. Cells were metabolically labeled in K422, K521, K341, K440, or K080 media, infected with vesicular stomatitis virus, lysed, and mixed with a K602 peptide standard. (B) NeuCode peptides are co-isolated, fragmented, and produce six peaks for every y-ion, corresponding to the K602 internal standard and 5 NeuCode viral peptides collected from infected cell lysates at 12, 18, 24, 36, and 48 hours post-infection. MS/MS scans were collected at 480,000 resolving power using an Orbitrap Elite mass spectrometer. (C) XICs of the six NeuCode peptides were integrated to obtain absolute peptide concentrations from the five infection timepoints.
Following the single nLC-MS/MS analysis of each 6-plex sample set (i.e., 1–12 and 15–48 hour), we obtained the absolute abundances of the five viral proteins across ten post-infection timepoints (Figure 3A). The multi-plexed capability of NeuCode PRM allowed for a five-fold reduction in analysis time compared to traditional SRM. To validate data quality, we monitored relative protein concentrations for VSV proteins P and M via fully quantitative Western blotting using purified VSV protein standard curves. Note reliable antibody/recombinant protein pairs for the remaining viral proteins do not exist. These measurements, presented in Figure 3 (panels B and C, respectively), confirm the results obtained with NeuCode PRM.
Figure 3.
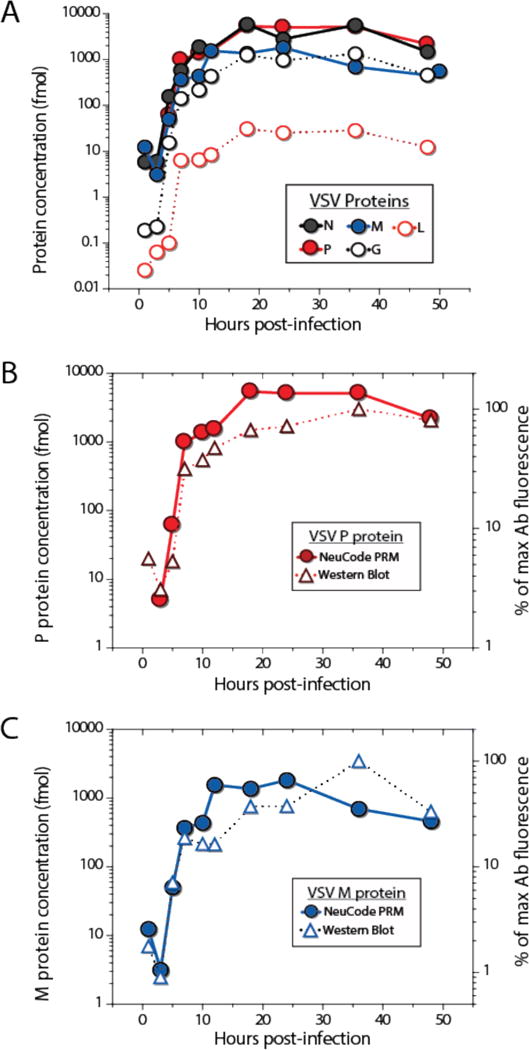
(A) Using 6-plex NeuCode PRM, absolute VSV protein abundances were obtained from 10 cell lysates using only two 100 min nLC-MS/MS experiments. Absolute protein abundance as determined by NeuCode PRM correlated well with quantitative Western blots for (B) the VSV P protein and (C) VSV M protein.
NeuCode PRM: Limit of Detection
A key figure of merit for any targeted method is sensitivity, often evaluated by limit of detection (LOD). To assess sensitivity, we labeled PC-3 cells to completion with K080, infected them with VSV, and, to ensure sufficient production of the target viral protein, harvested cells at seven hours post-infection. Using the synthetic peptide standards, vide supra, we constructed calibration curves and measured the concentration of each viral protein (N = 6.4 μM, P = 0.33 μM, M = 4.7 μM, G = 1.5 μM, L = 0.013 μM). To establish LODs, synthetic peptide standards were dosed at a 1:1 ratio followed by dilution with yeast lysate at ratios of 50:50, 1:10, 1:50, 1:100, 1:500, and 1:1,000. Each of these mixtures was analyzed using the duplex NeuCode PRM method described above. Ion chromatograms for each doublet, from each target, were extracted and the resulting S/N ratios calculated (Supplemental Figure 1). From these data we estimate the LODs for these five target peptides were identical between the K602 and K080 partners, with detection limits of 100–400 amol on-column. Modern SRM methods are capable of achieving similar LODs, ranging from 60 amol – 780 amol depending on the peptide sequence.3 Standard PRM LODs are similar, with 6 – 150 amol detection limits depending on target ion fill times and isolation widths.17,21,23 We conclude that NeuCode PRM detection limits are within the range of current targeted techniques, with the added benefit of multiplexing analysis.
NeuCode PRM: Dynamic Range
Another important metric of any analytical method is intra-experiment dynamic range. In NeuCode PRM, single MS/MS scans contain transitions from multiple samples. This strategy advantageously affords the opportunity for parallel sample processing; that said, the maximal intra-scan dynamic range of the mass analyzer ultimately limits dynamic range in this mode. Orbitrap mass analyzers can achieve an intrascan dynamic range up to 25,000.45,47,48
To characterize the dynamic range of the NeuCode PRM method we labeled six cultures of yeast – each with one of the six NeuCode lysine isotopologues (K602, K422, K521, K341, K440, or K080). Upon full incorporation, the cells were lysed, digested with Lys-C, and mixed in known ratios of 1:10:10:100:100:1000 (K602 : K422 : K521 : K341 : K440 : K080). This mixture was analyzed using the NeuCode PRM mass spectral method. Co-isolated NeuCode peptide precursor ions were dissociated to reveal six distinct m/z peaks for each y-type product ion. Figure 4A presents a sample spectrum for the target yeast peptide, GVFQGVHDSAEK. Here we observe at least 103 intrascan dynamic range across 4 y-type product ions. Eight other peptides were targeted and the average transition intensities for three NeuCode y-type product ion clusters from each were plotted (Figure 4B and Supplemental Figure 2). While the most diluted NeuCode peptide (1000-fold, K602) was always detected, quantitative accuracy was diminished. We note that these experiments were performed using a quadrupole ion trap-Orbitrap hybrid, meaning the ion trap isolation space charge capacity, ~ 300,000, limited the total number of ions that can be used for an MS/MS scan.49,50 Newer quadrupole-Orbitrap-quadrupole ion trap hybrid systems circumvent this limitation by utilizing a mass filter for isolation. In this geometry a much higher number of ions can be injected for MS/MS scans.51 We thus anticipate that newer MS hardware will considerably boost the dynamic range of the NeuCode PRM method.
Figure 4.
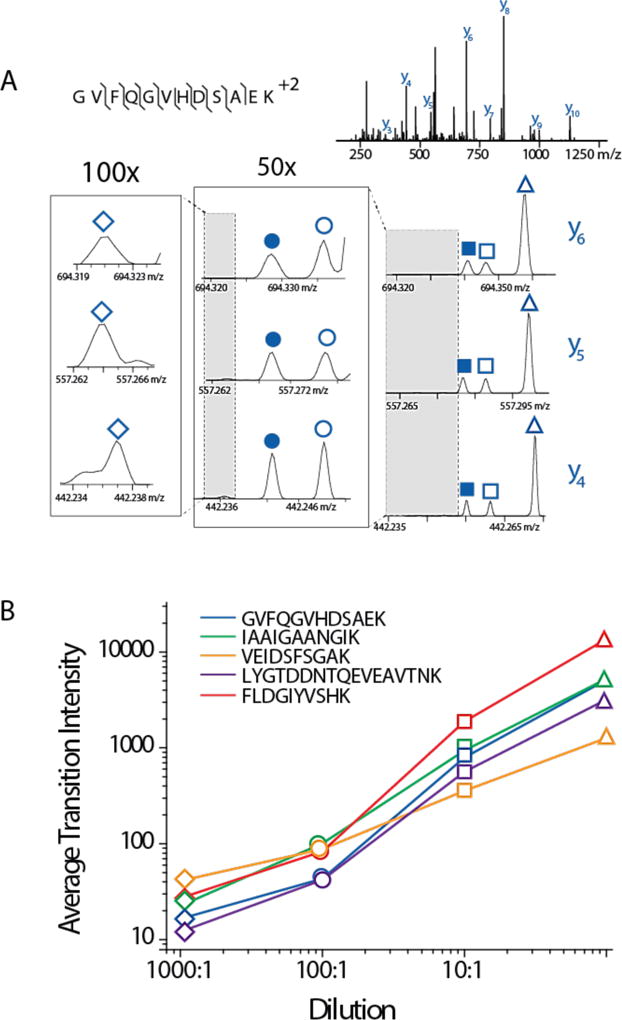
(A) Intrascan dynamic range of NeuCode PRM. NeuCode yeast lysates (K602, K422, K521, K341, K440, K080) were mixed in a ratio of 1:10:10:100:100:1000. 480,000 resolving power MS/MS scans displayed signal over three orders of magnitude for each resolvable y-ion for the sample peptide GVFQGVHDSAEK. (B) The average transition intensity from the resolvable y-ions of five sample yeast peptides was plotted to illustrate the dynamic range of NeuCode PRM. Additional yeast peptides are illustrated in Supplemental Figure 1.
NeuCode 18-Plex PRM Quantification
We reasoned that superposition of multiple isotopic clusters with the 6-plex NeuCode signatures could further expand NeuCode PRM multi-plexing capacity. One route to achieve this expansion is through metabolic labeling with NeuCode lysine isotopologues at nominal mass differences other than +8, i.e., +4 and/or +12 Da. Since these compounds are not yet available, we combined the 6-plex NeuCode labeling strategy discussed above with chemical labels to create three distinct isotopic clusters for each peptide. Three sets of NeuCode-labeled PC-3 cell cultures (K422, K521, K341, K440, and K080) were infected with a reporter strain of vesicular stomatitis virus, VSV-dsRedExpress, which carries an easily visualized reporter RFP gene that is transcribed alongside viral proteins (ADD CITATION PMID 24338628). The infected cells were harvested at 15 timepoints spanning 36 hours. Each set of five infection timepoints was dosed with spike-in standard peptides (K602), allowing for quantification of each viral protein. These samples were individually labeled with light, medium, or heavy dimethyl tags and then combined to produce a single sample containing 18 isotopically labeled versions of each targeted peptide.
The 18-plexed sample used our NeuCode PRM method as described above, except that the three dimethyl-labeled clusters were targeted for each peptide. Co-isolation of all 18 peptide precursor ions was accomplished by centering an isolation window wide enough to encompass both the lower and higher sets on the middle cluster. Upon isolation, the 18 uniquely labeled peptide target ion populations were dissociated and their product ion spectra collected using the Orbitrap analyzer at a resolving power of 480,000. Figure 5 presents an example of 18-plex NeuCode PRM data. Here each y-type product ion exists in three distinct nominal mass groupings. Upon high resolution mass analysis each of the three groupings comprises six unique m/z signals. The lowest m/z peak in each of the three groupings represents the spike-in peptide standard, dosed at 80 fmol. By including a standard in each of the three clusters we control for aberrations in precursor isolation and any ion transmission artifacts that may affect quantification. In this way, we can normalize the NeuCode signals within each isotopic cluster.
Figure 5.
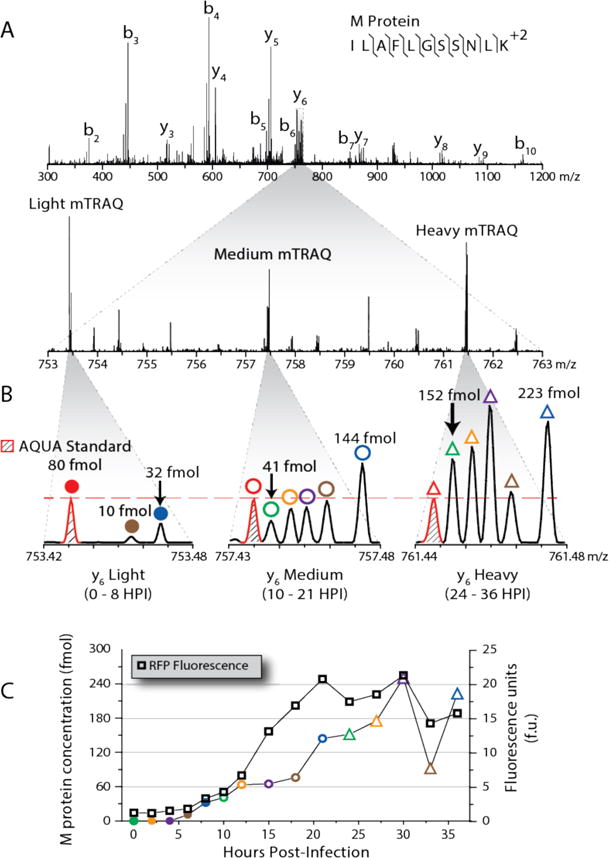
18-plex NeuCode quantification of viral peptide produced during a VSV-dsRedExpress infection of NeuCode SILAC PC-3 cells. (A) Three sets of -plex NeuCode infection lysates were chemically modified with light, medium, or heavy dimethyl labels and mixed. 20 m/z bins were used to co-isolate the light, medium, and heavy labeled versions of the VSV peptide ILAFLGSSNLK,480,000 resolving power MS/MS scans. (B) Each chemically labeled cluster of y-ions contained the transitions corresponding to a K602 standard and the NeuCode SILAC peptide abundances at 5 infection timepoints. (C) VSV abundances for the M protein peptide were overlaid with the RFP fluorescence produced during the mutant VSV infection and correlated through the 12 hour infection timepoint.
To generate an orthogonal metric of virus protein translation (matrix protein, M), and to benchmark NeuCode PRM performance, RFP fluorescence was monitored at identical post-infection timepoints. Absolute concentrations of intracellular viral M protein measured by NeuCode PRM were similar to increases in RFP fluorescence up to 12 hours after the start of the infection (Figure 5C). The two methods detected different protein M abundances at later timepoints. That said, note the NeuCode PRM method is actually measuring the intracellular concentrations of virus proteins, while the fluorescence measurement is gathering data on a non-viral proxy, RFP. At 12 hours post-infection cells are mounting a response to infection and are either degrading or excreting viral protein. Thus, we conclude that at later timepoints the NeuCode PRM measurements are actually more reflective of the intracellular viral protein load than the RFP fluorescence method indicates. In sum, we collected absolute protein abundance data over a 15-point viral infection time-course with three internal standards in a single MS analysis.
NeuCode 30-Plex PRM Quantification
In principle, the inclusion of additional isotopic clusters could further expand the multiplexing capacity of NeuCode PRM. Above we describe 18-plex quantification through the use of triplex dimethyl labels coupled to six-plex NeuCode. We reasoned that implementing a five-plex dimethyl labeling scheme, with each cluster spaced two Da apart, would permit a 30-plex NeuCode PRM analysis.52,53 We generated six-plex NeuCode samples, as described above using PC-3 cells over a 48-hour time-course following infection with either wild-type VSV-N1 or the mutant strain, VSV-M51R. In total, 25 infection timepoints were obtained, spiked with the K602 labeled synthetic peptide standards (one for each of the viral proteins), and dimethylated to impart a +28 Da, +30 Da, +32 Da, +34 Da, or +36 Da nominal mass difference. All target peptide ion m/z clusters were co-isolated using a 20 m/z window centered on the monoisotopic m/z of the +32 Da species. The co-isolated 30-plex set was then dissociated using collisional activation followed by MS/MS analysis with 480,000 resolving power. In this experiment y-type product ions exist across five isotopic clusters, each presenting six discrete NeuCode signals (Supplemental Figure 4). Given the only two Da spacing between clusters, the quantitative precision and accuracy of this 30-plex experiment was reduced due to signal dilution, co-isolation of many other background contaminants, and isotopic interferences. Nevertheless, this result pushes analytical boundaries and exemplifies the possibilities afforded by the NeuCode PRM strategy.
Conclusions
Here we report a new strategy for highly multiplexed targeted proteomics. The method combines two recent developments – PRM scanning and NeuCode labeling.17,36 The high resolution achieved with PRM-type analysis pairs well with the resolving power requirements of NeuCode to offer the collection of 18, and even 30, plexes in a single scan. Using a viral infection time-course we demonstrate the utility of the method in multiple plexing formats.
PRM scanning integrates well with NeuCode labeling for two primary reasons. First, targeted scanning approaches, i.e., SRM and PRM, rely on monitoring multiple transitions over the target’s entire elution profile. In NeuCode, deuterium is often used as an isotope in the various labels, and the varied amounts of deuterium can cause subtle retention time shifts that could distort the actual ion ratios if quantitative data were only extracted from a single scan. But in NeuCode PRM whole elution profile monitoring allows one to compare entire peak areas, thus eliminating this concern. Second, higher plexing can be achieved by measuring the NeuCode isotopic signatures in the MS/MS scan. Consider a 1,000 Da peptide pair labeled with NeuCode tags that differ by 6 mDa. If this precursor exists in the triply protonated form its m/z would be ~ 333 and the mass analyzer would have to distinguish isotopic clusters that differ by only 2 mTh, which would require 480,000 resolving power. In a NeuCode PRM paradigm this precursor would be dissociated and the products analyzed using high resolution. Imagine the singly charged y2 product ion has the sequence AK and is thus detected at m/z ~ 199. Now the m/z spacing of the NeuCode doublet is 6 mTh and the resolving power required to discern the two lowers considerably to 60,000. Since product ions typically exist in lower charge states and have reduced mass compared to their precursors, resolving NeuCode isotopic clusters in a PRM scanning mode increases NeuCode plexing capacity over that achieved in the MS1-based NeuCode SILAC we have previously described.37,39,40
We conclude that as the repertoire of NeuCode SILAC reagents increases, so too will the plexing capacity of NeuCode PRM increase. Our report here demonstrates that the method can produce excellent results in a real biological setting in duplex, six-plex, and even 18-plex formats. Further, we provide proof-of-concept data that illustrates potential 30-plex capacity. In step with ongoing Orbitrap mass analyzer development, NeuCode PRM spacing of less than 6 mDa will likely be within reach within a few years. We also note that TOF mass analyzers with resolving powers of ~ 50,000 or greater should provide access to at least modest levels of NeuCode PRM plexing. Another interesting concept would synthesize heavy peptide standards in a variety of NeuCode channels, such that a calibration curve of standards could be spiked into a wild-type sample.36 In this way, the plexing capacity of NeuCode PRM could be used to incorporate each standard peptide in a broad range of concentrations and to facilitate the simultaneous collection of a five-point calibration curve and analysis of the biological sample. Such an approach could be particularly attractive for profiling clinical samples where metabolically labeling of proteins or peptides is not feasible.
Supplementary Material
Acknowledgments
We are grateful to our collaborators at Cambridge Isotopes Laboratories, Inc., for the synthesis of lysine isotopologues. We would like to thank Ming Luo (University of Alabama at Birmingham) and Douglas Lyles (Wake Forest) for providing VSV protein reagents, Todd Green (University of Alabama at Birmingham) for his technical support in recombinant VSV protein expression and purification, and Kathy Vielhuber for her efforts toward expressing and purifying the VSV proteins. This work was supported by a Department of Defense National Defense Science & Engineering Graduate Fellowship (NDSEG) and the National Science Foundation Predoctoral Fellowship to E.A.V. The authors are grateful for the support of this work from the National Institutes of Health (AI091646, AI104317).
Footnotes
Author contributions. G.K.P., E.A.V., A.S.H., J.Y., and J.J.C. designed research; G.K.P., E.A.V. performed research; G.K.P., E.A.V., D.J.B., and M.S.W. analyzed data; G.K.P., A.S.H., and J.J.C. wrote the paper.
The MS proteomics data has been deposited and is publicly available through the Chorus project. NeuCode 2-plex, 6-plex, 18-plex, and 30-plex experiments are denoted and are available online (https://chorusproject.org/pages/index.html).
References
- 1.Kirkpatrick DS, Gerber SA, Gygi SP. Methods. 2005;35:265–273. doi: 10.1016/j.ymeth.2004.08.018. [DOI] [PubMed] [Google Scholar]
- 2.Kettenbach AN, Rush J, Gerber SA. Nat Protoc. 2011;6:175–186. doi: 10.1038/nprot.2010.196. [DOI] [PMC free article] [PubMed] [Google Scholar]
- 3.Zhao Y, Tian B, Edeh CB, Brasier AR. Mol Cell Proteomics. 2013 doi: 10.1074/mcp.M112.023465. [DOI] [PMC free article] [PubMed] [Google Scholar]
- 4.Zhao Y, Brasier AR. Methods. 2013 doi: 10.1016/j.ymeth.2013.02.001. [DOI] [PMC free article] [PubMed] [Google Scholar]
- 5.Picotti P, Aebersold R. Nature methods. 2012;9:555–566. doi: 10.1038/nmeth.2015. [DOI] [PubMed] [Google Scholar]
- 6.Coon JJ, Syka JE, Shabanowitz J, Hunt DF. Biotechniques. 2005;38:519, 521, 523. doi: 10.2144/05384TE01. [DOI] [PubMed] [Google Scholar]
- 7.Mani DR, Abbatiello SE, Carr SA. BMC Bioinformatics. 2012;13(Suppl 16):S9. doi: 10.1186/1471-2105-13-S16-S9. [DOI] [PMC free article] [PubMed] [Google Scholar]
- 8.Chang CY, Picotti P, Huttenhain R, Heinzelmann-Schwarz V, Jovanovic M, Aebersold R, Vitek O. Mol Cell Proteomics. 2012;11 doi: 10.1074/mcp.M111.014662. M111 014662. [DOI] [PMC free article] [PubMed] [Google Scholar]
- 9.Simicevic J, Schmid AW, Gilardoni PA, Zoller B, Raghav SK, Krier I, Gubelmann C, Lisacek F, Naef F, Moniatte M, Deplancke B. Nature methods. 2013;10:570–576. doi: 10.1038/nmeth.2441. [DOI] [PubMed] [Google Scholar]
- 10.Merrill AE, Coon JJ. Curr Opin Chem Biol. 2013;17:779–786. doi: 10.1016/j.cbpa.2013.06.011. [DOI] [PMC free article] [PubMed] [Google Scholar]
- 11.Kennedy JJ, Abbatiello SE, Kim K, Yan P, Whiteaker JR, Lin C, Kim JS, Zhang Y, Wang X, Ivey RG, Zhao L, Min H, Lee Y, Yu MH, Yang EG, Lee C, Wang P, Rodriguez H, Kim Y, Carr SA, Paulovich AG. Nature methods. 2014;11:149–155. doi: 10.1038/nmeth.2763. [DOI] [PMC free article] [PubMed] [Google Scholar]
- 12.Richards AL, Merrill AE, Coon JJ. Curr Opin Chem Biol. 2015;24:11–17. doi: 10.1016/j.cbpa.2014.10.017. [DOI] [PMC free article] [PubMed] [Google Scholar]
- 13.Bailey DJ, McDevitt MT, Westphall MS, Pagliarini DJ, Coon JJ. J Proteome Res. 2014;13:2152–2161. doi: 10.1021/pr401278j. [DOI] [PMC free article] [PubMed] [Google Scholar]
- 14.Carr SA, Abbatiello SE, Ackermann BL, Borchers C, Domon B, Deutsch EW, Grant RP, Hoofnagle AN, Huttenhain R, Koomen JM, Liebler DC, Liu T, Maclean B, Mani D, Mansfield E, Neubert H, Paulovich AG, Reiter L, Vitek O, Aebersold R, Anderson L, Bethem R, Blonder J, Boja E, Botelho J, Boyne M, Bradshaw RA, Burlingame AL, Chan D, Keshishian H, Kuhn E, Kinsinger C, Lee JS, Lee SW, Moritz R, Oses-Prieto J, Rifai N, Ritchie J, Rodriguez H, Srinivas PR, Townsend RR, Van Eyk J, Whiteley G, Wiita A, Weintraub S. Mol Cell Proteomics. 2014;13:907–917. doi: 10.1074/mcp.M113.036095. [DOI] [PMC free article] [PubMed] [Google Scholar]
- 15.Rost H, Malmstrom L, Aebersold R. Mol Cell Proteomics. 2012;11:540–549. doi: 10.1074/mcp.M111.013045. [DOI] [PMC free article] [PubMed] [Google Scholar]
- 16.Abbatiello SE, Mani DR, Keshishian H, Carr SA. Clin Chem. 2010;56:291–305. doi: 10.1373/clinchem.2009.138420. [DOI] [PMC free article] [PubMed] [Google Scholar]
- 17.Peterson AC, Russell JD, Bailey DJ, Westphall MS, Coon JJ. Mol Cell Proteomics. 2012;11:1475–1488. doi: 10.1074/mcp.O112.020131. [DOI] [PMC free article] [PubMed] [Google Scholar]
- 18.Michalski A, Damoc E, Hauschild JP, Lange O, Wieghaus A, Makarov A, Nagaraj N, Cox J, Mann M, Horning S. Molecular & Cellular Proteomics. 2011;10 doi: 10.1074/mcp.M111.011015. [DOI] [PMC free article] [PubMed] [Google Scholar]
- 19.Beck S, Michalski A, Raether O, Lubeck M, Kaspar S, Goedecke N, Baessmann C, Hornburg D, Meier F, Paron I, Kulak NA, Cox J, Mann M. Mol Cell Proteomics. 2015;14:2014–2029. doi: 10.1074/mcp.M114.047407. [DOI] [PMC free article] [PubMed] [Google Scholar]
- 20.Scheltema RA, Hauschild JP, Lange O, Hornburg D, Denisov E, Damoc E, Kuehn A, Makarov A, Mann M. Mol Cell Proteomics. 2014;13:3698–3708. doi: 10.1074/mcp.M114.043489. [DOI] [PMC free article] [PubMed] [Google Scholar]
- 21.Gallien S, Duriez E, Crone C, Kellmann M, Moehring T, Domon B. Mol Cell Proteomics. 2012;11:1709–1723. doi: 10.1074/mcp.O112.019802. [DOI] [PMC free article] [PubMed] [Google Scholar]
- 22.Gallien S, Duriez E, Demeure K, Domon B. J Proteomics. 2013;81:148–158. doi: 10.1016/j.jprot.2012.11.005. [DOI] [PubMed] [Google Scholar]
- 23.Gallien S, Bourmaud A, Kim SY, Domon B. J Proteomics. 2013 [Google Scholar]
- 24.Phanstiel D, Zhang Y, Marto JA, Coon JJ. J Am Soc Mass Spectr. 2008;19:1255–1262. doi: 10.1016/j.jasms.2008.05.023. [DOI] [PMC free article] [PubMed] [Google Scholar]
- 25.Phanstiel D, Unwin R, McAlister GC, Coon JJ. Analytical chemistry. 2009;81:1693–1698. doi: 10.1021/ac8019202. [DOI] [PMC free article] [PubMed] [Google Scholar]
- 26.Rose CM, Venkateshwaran M, Volkening JD, Grimsrud PA, Maeda J, Bailey DJ, Park K, Howes-Podoll M, den Os D, Yeun LH, Westphall MS, Sussman MR, Ane JM, Coon JJ. Mol Cell Proteomics. 2012;11:724–744. doi: 10.1074/mcp.M112.019208. [DOI] [PMC free article] [PubMed] [Google Scholar]
- 27.Aye TT, Low TY, Bjorlykke Y, Barsnes H, Heck AJ, Berven FS. Analytical chemistry. 2012;84:4999–5006. doi: 10.1021/ac300596r. [DOI] [PubMed] [Google Scholar]
- 28.Yin HR, Zhang L, Xie LQ, Huang LY, Xu Y, Cai SJ, Yang PY, Lu HJ. J Proteome Res. 2013;12:3912–3919. doi: 10.1021/pr4005025. [DOI] [PubMed] [Google Scholar]
- 29.Wolf-Yadlin A, Hautaniemi S, Lauffenburger DA, White FM. Proc Natl Acad Sci U S A. 2007;104:5860–5865. doi: 10.1073/pnas.0608638104. [DOI] [PMC free article] [PubMed] [Google Scholar]
- 30.DeSouza LV, Taylor AM, Li W, Minkoff MS, Romaschin AD, Colgan TJ, Siu KW. J Proteome Res. 2008;7:3525–3534. doi: 10.1021/pr800312m. [DOI] [PubMed] [Google Scholar]
- 31.Aye TT, Low TY, Bjorlykke Y, Barsnes H, Heck AJR, Berven FS. Analytical chemistry. 2012;84:4999–5006. doi: 10.1021/ac300596r. [DOI] [PubMed] [Google Scholar]
- 32.Ledvina AR, Savitski MM, Zubarev AR, Good DM, Coon JJ, Zubarev RA. Analytical chemistry. 2011;83:7651–7656. doi: 10.1021/ac201843e. [DOI] [PMC free article] [PubMed] [Google Scholar]
- 33.Hebert AS, Merril AE, Bailey DJ, Still AJ, Westphall MS, Streiter ER, Pagliarini DJ, Coon JJ. Nature methods. 2013 doi: 10.1038/nmeth.2378. [DOI] [PMC free article] [PubMed] [Google Scholar]
- 34.Merrill AE, Hebert AS, MacGilvray ME, Rose CM, Bailey DJ, Bradley JC, Wood WW, El Masri M, Westphall MS, Gasch AP, Coon JJ. Mol Cell Proteomics. 2014;13:2503–2512. doi: 10.1074/mcp.M114.040287. [DOI] [PMC free article] [PubMed] [Google Scholar]
- 35.Rhoads TW, Prasad A, Kwiecien NW, Merrill AE, Zawack K, Westphall MS, Schroeder FC, Kimble J, Coon JJ. Mol Cell Proteomics. 2015;14:2922–2935. doi: 10.1074/mcp.M115.049684. [DOI] [PMC free article] [PubMed] [Google Scholar]
- 36.Hebert AS, Merrill AE, Stefely JA, Bailey DJ, Wenger CD, Westphall MS, Pagliarini DJ, Coon JJ. Mol Cell Proteomics. 2013;12:3360–3369. doi: 10.1074/mcp.M113.032011. [DOI] [PMC free article] [PubMed] [Google Scholar]
- 37.Minogue CE, Hebert AS, Rensvold JW, Westphall MS, Pagliarini DJ, Coon JJ. Analytical chemistry. 2015;87:2570–2575. doi: 10.1021/ac503593d. [DOI] [PMC free article] [PubMed] [Google Scholar]
- 38.Rhoads TW, Rose CM, Bailey DJ, Riley NM, Molden RC, Nestler AJ, Merrill AE, Smith LM, Hebert AS, Westphall MS, Pagliarini DJ, Garcia BA, Coon JJ. Analytical chemistry. 2014;86:2314–2319. doi: 10.1021/ac403579s. [DOI] [PMC free article] [PubMed] [Google Scholar]
- 39.Richards AL, Vincent CE, Guthals A, Rose CM, Westphall MS, Bandeira N, Coon JJ. Mol Cell Proteomics. 2013;12:3812–3823. doi: 10.1074/mcp.M113.028951. [DOI] [PMC free article] [PubMed] [Google Scholar]
- 40.Rose CM, Merrill AE, Bailey DJ, Hebert AS, Westphall MS, Coon JJ. Analytical chemistry. 2013;85:5129–5137. doi: 10.1021/ac400476w. [DOI] [PMC free article] [PubMed] [Google Scholar]
- 41.Ulbrich A, Bailey DJ, Westphall MS, Coon JJ. Analytical chemistry. 2014;86:4402–4408. doi: 10.1021/ac500270q. [DOI] [PubMed] [Google Scholar]
- 42.Ulbrich A, Merrill AE, Hebert AS, Westphall MS, Keller MP, Attie AD, Coon JJ. J Am Soc Mass Spectr. 2014;25:6–9. doi: 10.1007/s13361-013-0765-z. [DOI] [PMC free article] [PubMed] [Google Scholar]
- 43.Swick A, Baltes A, Yin J. Biotechnol Bioeng. 2014;111:1200–1209. doi: 10.1002/bit.25170. [DOI] [PMC free article] [PubMed] [Google Scholar]
- 44.Pesko K, Voigt EA, Swick A, Morley VJ, Timm C, Yin J, Turner PE. Front Genet. 2015;6:121. doi: 10.3389/fgene.2015.00121. [DOI] [PMC free article] [PubMed] [Google Scholar]
- 45.Wenger CD, McAlister GC, Xia Q, Coon JJ. Mol Cell Proteomics. 2010;9:754–763. doi: 10.1074/mcp.M900541-MCP200. [DOI] [PMC free article] [PubMed] [Google Scholar]
- 46.Hebert AS, Merrill AE, Bailey DJ, Still AJ, Westphall MS, Strieter ER, Pagliarini DJ, Coon JJ. Nature methods. 2013;10:332–334. doi: 10.1038/nmeth.2378. [DOI] [PMC free article] [PubMed] [Google Scholar]
- 47.Makarov A, Denisov E, Lange O, Horning S. J Am Soc Mass Spectr. 2006;17:977–982. doi: 10.1016/j.jasms.2006.03.006. [DOI] [PubMed] [Google Scholar]
- 48.Makarov A, Denisov E, Lange O. J Am Soc Mass Spectr. 2009;20:1391–1396. doi: 10.1016/j.jasms.2009.01.005. [DOI] [PubMed] [Google Scholar]
- 49.
- 50.McAlister GC, Phanstiel D, Wenger CD, Lee MV, Coon JJ. Analytical chemistry. 2010;82:316–322. doi: 10.1021/ac902005s. [DOI] [PMC free article] [PubMed] [Google Scholar]
- 51.Hebert AS, Richards AL, Bailey DJ, Ulbrich A, Coughlin EE, Westphall MS, Coon JJ. Mol Cell Proteomics. 2014;13:339–347. doi: 10.1074/mcp.M113.034769. [DOI] [PMC free article] [PubMed] [Google Scholar]
- 52.Hsu JL, Huang SY, Chen SH. Electrophoresis. 2006;27:3652–3660. doi: 10.1002/elps.200600147. [DOI] [PubMed] [Google Scholar]
- 53.Wu Y, Wang F, Liu Z, Qin H, Song C, Huang J, Bian Y, Wei X, Dong J, Zou H. Chem Commun (Camb) 2014;50:1708–1710. doi: 10.1039/c3cc47998f. [DOI] [PubMed] [Google Scholar]
Associated Data
This section collects any data citations, data availability statements, or supplementary materials included in this article.